文章信息
- 田晓瑞, 舒立福, 赵凤君, 王明玉
- Tian Xiaorui, Shu Lifu, Zhao Fengjun, Wang Mingyu
- 气候变化对中国森林火险的影响
- Impacts of Climate Change on Forest Fire Danger in China
- 林业科学, 2017, 53(7): 159-169.
- Scientia Silvae Sinicae, 2017, 53(7): 159-169.
- DOI: 10.11707/j.1001-7488.20170716
-
文章历史
- 收稿日期:2016-06-29
- 修回日期:2017-01-06
-
作者相关文章
林火动态受气候、植被和人类直接影响,但在全球尺度上气候是影响林火格局的主要因素(Marlon et al., 2008)。近几十年来,北半球气候变得干燥与温暖,预计未来气候变化情景下这种趋势将更加明显,这将对林火产生显著影响(Schelhaas et al., 2010; San-Miguel-Ayanz et al., 2013)。气候变化可能已影响全球各地的野火(Westerling et al., 2006; Flannigan et al., 2009; Wotton et al., 2010),随温度升高,大部分区域的火活动将增加(Pechony et al., 2010)。在西伯利亚、阿拉斯加和加拿大等地的北方林中,平均每年过火5×10⁶~15×106 hm2,火灾极端严重的年份越来越频繁出现(Flannigan et al., 2009)。欧洲每年有50多万hm2森林受到火灾影响(Khabarov et al., 2016)。美国过去几十年的森林大火数量明显增加(Dennison et al., 2014),但目前还不能确定扑火导致的可燃物载量增加或更有利的天气对频繁发生的森林大火的贡献(Marlon et al., 2012;Barbero et al., 2014)。20世纪严格的林火管理政策导致美国西部森林火灾次数急剧减少(Marlon et al., 2012),火发生频率降低,使该地区许多森林类型的结构发生改变,可燃物载量增加,同时由于气候变化引起的森林大火发生频度也显著增加(Westerling et al., 2006)。
目前野火问题已成为全球森林管理者面临的挑战(North et al., 2012)。火险严重程度对全球气温升高敏感(Flannigan et al., 2013),气候变暖会增加潜在的灾害风险,火险期延长,可燃物干燥(蒸散量增加和枯落物干燥),导致更多野火发生。由于人为干扰,火险期长度与火烧强度、可燃物可消耗量和火管理水平等都发生了变化,景观水平上的火动态将随气候变化而进一步改变(Kloster et al., 2012)。预计到2030年和21世纪末北方林火灾次数将分别增加30%和75%(Wotton et al., 2010)。2070—2099年欧洲南部区域的夏季降水将大幅减少(高达70%),从而导致林火发生频度和严重程度增加(Alcamo et al., 2007)。Spracklen等(2009)认为21世纪50年代美国西部的年均火烧面积将增加54%,太平洋西北森林和落基山脉森林的火灾面积将分别增加78%和175%。澳大利亚东南部的很高和极端火险等级日数在2020和2035年将分别增加4%~25%和15%~70%(Hennessy et al., 2005)。预计2071—2100年中国东北地区的潜在火灾将增加10%~18%,火险期延长21~26天(Tian et al., 2011)。Liu等(2012)认为中国东北的寒带森林在2081—2100年时段火发生密度将增加30%(CGCM3 B1情景)~230%(HadCM3 A2情景)。
当前我国对气候变化影响林火的研究主要是在一些区域尺度上开展的(Tian et al., 2011; Liu et al., 2012),特别是东北地区的林火动态变化研究更多一些。在全国尺度上的气候变化影响森林火险的研究还没有报道,因此有必要开展相关研究,了解气候变化对我国森林火险的影响,以期为我国宏观林火管理提供科学参考依据。
1 研究区概况研究区包括中国陆地区域,由于研究区存在多种气候类型和植被类型,可燃物类型和火动态特征存在显著性差异,因而根据中国生态地理系统分类(郑度, 2007)和植被与林火分布特征(Tian et al., 2013)把中国分成9个区域(图 1),分别是中温带干旱地区荒漠区(R0)、寒温带湿润地区针叶林区(R1)、中温带湿润地区森林区(R2)、中温带干旱地区荒漠针叶林区(R3)、中温带半干旱地区草原区(R4)、暖温带湿润/半湿润地区落叶阔叶林、人工植被区(R5)、中温带半干旱/干旱地区草原区(R6)、中北亚热带湿润地区阔叶林、人工植被区(R7) 和热带南亚热带湿润地区阔叶林、人工植被区(R8)(田晓瑞等, 2015)。因为在R0、R4和R6很少有森林分布,所以本文主要研究森林分布的其他6个区域在过去35年和未来2021—2050年的主要气候特征及火险变化。

|
图 1 中国生态地理区与森林分布 Fig.1 Eco-geographic regions and forests distribution in China |
在1950—2011年间,中国平均每年发生森林火灾12 810次,其中一般、较大、重大和特大森林火灾分别为4 630、3 614、28和4次,年均受害森林面积613 645 hm2。1987年“5·6”大火以后,我国森林防火工作得到全面加强,森林火灾次数和损失显著减少。1989—2011年均发生森林火灾7 415次,年均过火面积260 580 hm2,其中受害森林面积85 674 hm2(包括天然林41 135 hm2、人工林29 477 hm2和其他林地15 062 hm2)。95%的森林火灾原因是烧荒炼山、上坟烧纸、野外吸烟等人为因素。根据林火发生时间,确定了各生态地理区的火险期(表 1)(Tian et al., 2013)。
|
|
根据中国地面气候资料日值数据集(V3.0)(http://cdc.cma.gov.cn/)824个国家级基准、基本站的观测资料(1961—2010年),利用距离方向加权平均法(New et al., 1999),把1976—2010年气温和降水2个气象要素插值到空间分辨率0.25°×0.25°的网格点,根据各生态地理区的植被分布情况,分别统计研究时段内有植被分布区域的火险期的气温和降水量变化。
2.2 气候情景数据未来气候变化情景应用了5套全球气候模式的插值、订正结果,这是由“跨部门的影响模式比较计划”(The Inter-Sectoral Impact Model Intercomparison Project)提供的(http://www.isi-mip.org),中国农业科学研究院农业环境与可持续发展研究所提取并转换为ASCII码。气候情景数据包含4个情景(RCP2.6、RCP4.5、RCP6.0和RCP8.5) 下5个全球气候模式(GFDL-ESM2M、HadGEM2-ES、IPSL-CM5A-LR、MIROC-ESM-CHEM和NorESM1-M)的8个气象要素(平均气温、最高气温、最低气温、降水量、太阳总辐射、平均相对湿度、地面气压和近地面平均风速)的日值数据。数据时间范围是1951—2050年,地理范围包括70.25°—140.25°E,15.25°—55.25°N,水平分辨率0.5°×0.5°。采用双线性插值方法对数据进行差值处理,并基于概率分布的统计偏差进行订正(Hagemann et al., 2011;ISI-MIP,2013)。
2.3 森林火险指数计算利用基准时段(1971—2000年)的地面气象观测数据对气候模式数据中的气温和降水量进行进一步订正(气温采用差值订正,降水量采用百分比订正)。分别根据观测数据和订正后的气候模式预测数据计算每个格点每日的森林火险天气指数(fire weather index, FWI)。由于观测数据缺失1967—1975年的相对湿度数据,所以,没有计算这几年的森林火险指数;本文根据历史观测数据计算了1976—2010年的森林火险天气指数。FWI系统是目前世界上应用范围最广的火险天气指数系统(Tian et al., 2005),在我国东北和西南等重点林区也得到应用(田晓瑞等,2010; Tian et al., 2011),对于森林火险有很好的指示作用。利用气候模式的模拟数据,分别计算4种气候情景在2001—2050年的森林火险天气指数。该指数基于每日各格点最高温度、最小相对湿度、平均风速和每日降水量计算得到,包括6个组分指数,3个可燃物湿度码和3个火行为指数。可燃物湿度码包括细小可燃物湿度码(fine fuel moisture codes, FFMC)、腐殖质湿度码(duff moisture code, DMC)和干旱码(drought code, DC)。火行为指标包括初始蔓延速度(initial spread, ISI)、累积指数(build up, BUI)和火险天气指数(FWI)。根据FWI计算日火险严重程度(daily severity rating, DSR)和火险期严重程度(seasonal severity rating, SSR)(Van Wagner,1970),用来描述研究区火险期的平均森林火险。
2.4 变化趋势分析因子突变检验采用Mann-Kendall法,分析观测时段(1976—2010年)的主要气候特征和火险的变化趋势。该趋势检验方法是一种突变和趋势非参数统计检验方法,适合于气象数据的非线性突变和趋势检验(Salmi et al., 2002), 广泛用于气候、水文和植被等方面研究(江振蓝等,2011;占车生等,2012;于延胜等,2013)。
基于秩的Mann-Kendall趋势检验法不需要样本遵从一定的分布,也不受少数异常值的干扰。对于具有n个样本的时间序列Xt=x1, x2, …,xn,先确定所有对偶值xi, xj (j>i)中xi与xj的大小关系(设为τ)。趋势检验的统计量为:
| ${U_k} = \frac{\tau }{{{{\left[ {{\rm{Var}}\left( \tau \right)} \right]}^{1/2}}}},k = 1,2, \cdots ,n。$ | (1) |
式中:
| $\tau = \sum\limits_{i = 1}^{n - 1} {\sum\limits_{j = i + 1}^n {{\mathop{\rm sgn}} } } \left( {{x_j} - {x_i}} \right),$ | (2) |
| ${\mathop{\rm sgn}} \left( \theta \right) = \left\{ {\begin{array}{*{20}{c}} {1,{\rm{if}}\theta > 0}\\ {0,{\rm{if}}\theta = 0}\\ { - 1,{\rm{if}}\theta < 0} \end{array},} \right.$ | (3) |
| ${\rm{Var}}\left( \tau \right) = \frac{{n\left( {n - 1} \right)\left( {2n + 5} \right) - \sum\limits_{i = 1}^n {{t_i}i} \left( {i - 1} \right)\left( {2i + 5} \right)}}{{18}}。$ | (4) |
当n大于10时,Uk收敛于标准正态分布(魏风英2009)。
原假设为该序列无趋势,采用双边趋势检验,在给定显著性水平α下,在正态分布表中查得临界值Uα/2,当|Uk| < Uα/2时,接受原假设,即趋势不显著;若|Uk|>Uα/2,则拒绝原假设,即认为趋势显著。
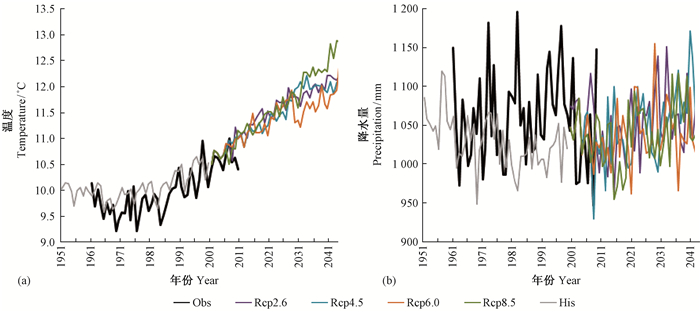
3 结果与分析 3.1 森林分布区的气温与降水变化在基准时段(1971—2000年),研究区年均气温呈上升趋势,但年均降水量没明显变化。1961—2010年森林分布区的平均气温与年降水量观测值分别为9.9 ℃和1 070 mm,气候模式模拟值分别为10.2 ℃和1 020 mm(图 2),误差分别为2.5%和-4.7%。这说明,本文应用的气候模式对中国森林分布区的平均气温与降水的模拟值和观测值基本一致,对气温模拟更准确一些。本文中的未来气候及火险天气指数分析,将基于气候模拟值进行。

|
图 2 1961—2010年观测(Obs)和1951—2050年模拟(His)森林分布区年均气温与降水量变化 Fig.2 The observed annual temperature and precipitation (Obs)of the forest distribution areas in 1951—2050 and simulated temperature and precipitation (His) in 1951-2050 |
气候模型预测的2021—2050年森林分布区的平均气温将增加1.6~2.1 ℃,其中RCP2.6、RCP4.5、RCP6.0和RCP8.5情景下分别增加1.7,1.7,1.6和2.1 ℃;森林分布区的降水将分别增加2.3%~4.8%,其中RCP2.6、RCP4.5、RCP6.0和RCP8.5情景下将分别增加4.8%,4.4%,2.3%和3.5%。
中国气候多样,各个生态区的气候变化也有差异。研究气候变化对森林火险的影响,需重点关注火险期的气候变化。历史观测时段(1961—2010年)各生态地理区内森林分布区火险期平均气温和累积降水量的统计描述分别见表 2和表 3。各生态地理区的森林火险期平均气温在4.4~12.7 ℃。火险期的累积降水量在R8最高(605.7 mm),在R3和R5较低(117.4~191.2 mm)。
|
|
|
|
Mann-Kendall检验表明(表 4),1961—2010年,所有生态地理区的火险期平均气温变化均达到极显著水平(α=0.001水平),平均气温都呈增加趋势;而火险期降水量只有R3显著增加(α=0.01水平),其他区域变化不显著。这表明大部分森林分布区火险期的气候呈暖干化变化趋势。
|
|
根据气候模式预测结果,对2021—2050年各生态地理区的火险期平均气温与降水量分别与基准时段进行了多重比较。结果表明,各生态区防火期的平均气温在都比基准时段显著增加(P=0.000)(表 5),但火险期降水量只有部分区域的变化显著(表 6)。R1和R7火险期降水量显著增加;R8在所有情景下都没有显著变化;R2在RCP6.0情景下变化不显著;R3在RCP4.5情景下变化不显著;R5在RCP4.5和RCP6.0情景下变化不显著,其他情景下都显著增加。
|
|
|
|
根据气象观测值计算的森林火险天气指数表明,1976—2010年各生态地理区内森林分布区的火险期指数平均值大部分表现出增加趋势(表 7)。R1的所有火险指数都显著增加,R2只有DMC显著增加,但R3区域的DC下降趋势显著(α=0.001),其他火险指数变化不显著。R5只有FWI显著增加,其他火险指数增加未达到显著水平。R7和R8区域中所有火险指数均呈现显著上升趋势。R1、R5、R7和R8的FWI平均值增加极显著(α=0.001)。R1、R7和R8所有的火险指数都显著增加(在α=0.01或α=0.001水平上显著)。而R3的火险指数变化不明显,DC值甚至显著降低。
|
|
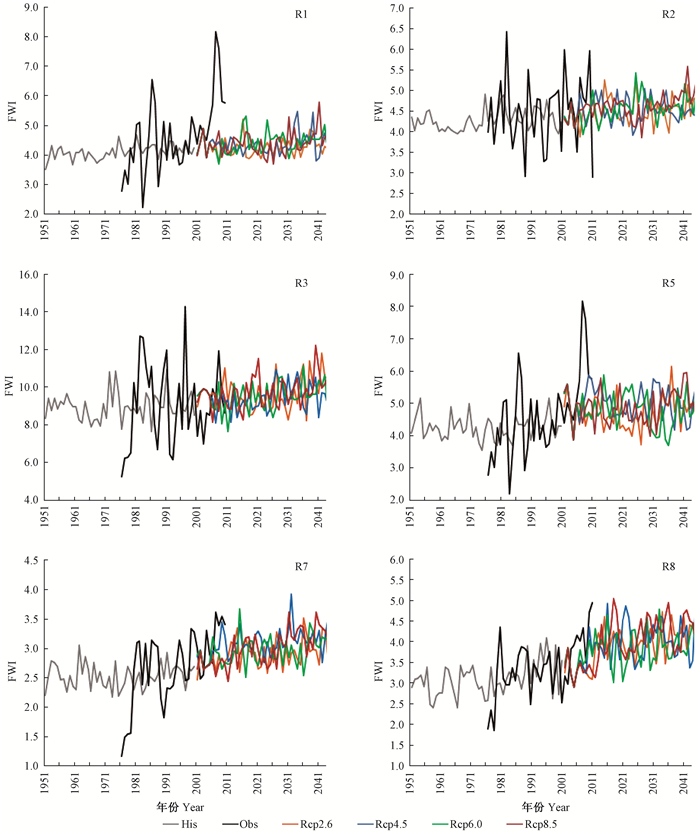
1951—2050年各生态地理区的FWI变化基本呈现缓慢上升趋势(图 3)。与观测值相比,根据气候模拟值计算的森林火险天气指数的变动幅度小,说明模拟值仅可能比较准确地表示一个时段(30年)的平均状态,但不能模拟极端年份的火险变化。

|
图 3 1976—2010年观测和1951—2050年预测的各生态地理区的火险指数变化 Fig.3 FWI of fire season for each eco-geographical region from 1951-2050 |
与基准时段相比,2021—2050年不同情景下各区火险期平均火险指数的增量变化表明,所有区域在2021—2050年FWI都有所增加,除R1和R2在RCP2.6情景下变化不显著外,其他情景与时段都变化显著(表 8)。R1、R2、R3、R5、R7和R8的火险天气指数将分别增加3.4%~12.5%、6.8%~16.8%、10.7%~19.9%、18.4%~29.8%、22.5%~33.1%和26.4%~40%。4种情景下所有区域的FFMC、BUI和DMC都增加显著。DC在4种气候情景下,R2和R3变化不显著,R1只有在RCP4.5情景下变化显著,R5、R7和R8 4种情景下都显著。ISI为R1和R2在RCP2.6变化不显著,R3在RCP4.5和RCP6.0情景下不显著,其他都显著(表 8)。
|
|
由于不同生态地理区的火险期不同,森林火险天气指数存在明显差异。对于同一区域,FWI95th百分位与平均值有比较一致的变化趋势。所以,采用FWI的高百分位数来描述整个研究区的空间变化。
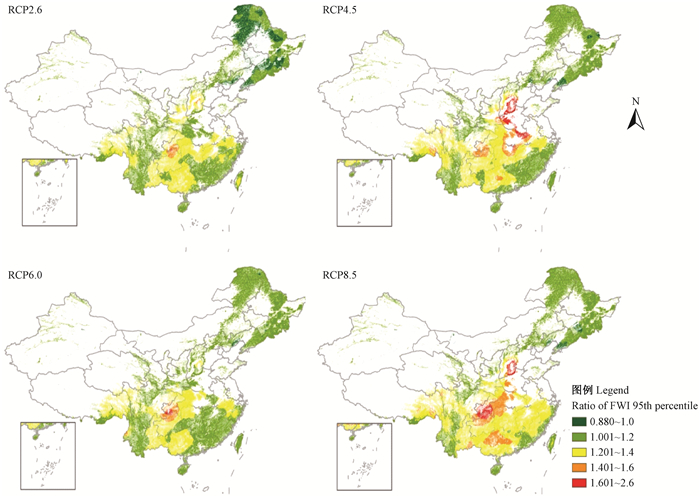
在2021—2050年,RCP2.6、RCP4.5、RCP6.0和RCP8.5情景下FWI 95th百分位数比基准时段分别增加13.5%,18.9%,14.9%和22.33%(图 4)。RCP2.6情景下95th百分位数增加最显著的区域主要分布在西南部分区域,RCP4.5情景下增幅最显著的区域是华北地区,RCP6.0情景下显著增加的区域主要分布在西南地区,RCP8.5情景下增加最显著的区域包括西南和华中、华北部分区域。

|
图 4 2021—2050年4种气候情景下FWI 95th百分位数变化比率 Fig.4 Ratio of FWI 95th percentile from 2021—2050 under four climate scenarios |
2021—2050年R1、R2和R3的FWI 95th百分位数增量都在10%以下(表 9),R1在RCP2.6情景下还下降了1%。但R5、R7和R8区域增加明显(9%~34%),在RCP4.5和RCP8.5情景下增幅达到22%~34%。这表明未来南方和西南林区的高火险天气日数将大幅度增加。
|
|
中国森林分布区在1961—2010年的平均气温呈现出上升趋势,年均降水量变化趋势不显著。所有生态地理区的火险期平均气温都呈增加趋势,而火险期降水量只有R3显著增加。邬宏等(2013)也认为1961—2010年中国东部林区年均最高气温呈上升趋势,年增幅为0.017 1 ℃。张艳平等(2008)发现大兴安岭地区1972—2005年的年均气温呈显著升高趋势, 夏季干旱化趋势较为严重。这与本文研究结果基本一致。
各生态地理区内森林分布区的火险期指数平均值大部分表现出增加趋势,只有R3的火险指数变化不明显,DC值甚至显著降低。国内有关气候变化对森林火灾的影响研究主要集中在重点火险区——大兴安岭林区(R1)。杨光等(2012)认为大兴安岭漠河县1971—2010年的初始蔓延、有效可燃物、林火天气和火灾难控程度等指数都呈增加趋势,进入21世纪后这些火险指数增幅更为显著。频繁出现的夏季干旱, 已使我国大兴安岭林区森林火险期发生了显著变化,夏季林火数量和过火面积均增加,气候变化引起的暖干化趋势导致了火险期提前和延长、林火频率和过火面积增加及林火强度增大(赵凤君等,2009)。
虽然气候预测模型可以比较好地模拟一个时段的气温和降水平均状态,但目前还不能很好地模拟极端气候事件;而森林火灾特别是森林大火一般是发生在森林火险天气高的条件下,一个时段或者火险期的平均火险天气指数不能完全反应实际的森林火险情况。受获取数据的限制,文中计算森林火险天气指数采用的是日最高气温、平均风速和最低相对湿度,不是中午的定时值,这对森林火险天气指数的准确性有一定的影响,但这样计算的森林火险天气指数也能比较好地反映森林火险的变化趋势。根据多个气候情景模式的模拟值分析未来的森林火险天气变化区域,也在一定程度上提高了预测的可靠性。随着气候模拟技术的发展,今后需要研究极端气候事件对于森林火险天气和潜在林火行为的影响。
5 结论本文应用的气候模式对研究区的年气温与降水的模拟值基本和观测值一致,因而可基于其预测结果预测未来森林火险变化。在2021—2050年,预测我国森林分布区的平均气温和降水量都有所增加;火险期的平均气温增加显著,但降水量变化不明显,这使火险期的气候呈现暖干化变化趋势。
在1976—2010年观测的各生态地理区内森林分布区的火险期指数均表现出增加趋势,与模型预测的增加趋势一致,但年际变幅远大于模型预测值,因而模型预测的火险只能比较准确地表示一个时段(30年)的平均状态,但不能模拟极端年份火险变化。
根据预测,2021—2050年大部分区域的火险指数将升高,南方比北方林区的增幅更显著,华北和西南地区的森林火险明显升高;这些区域将是森林火灾预防的重点区域,需开展针对性的林火管理措施,以降低森林火灾危害。
| [] |
江振蓝, 荆长伟, 李丹, 等. 2011. 运用Mann-Kendall方法探究地表植被变化趋势. 浙江大学学报:农业与生命科学版, 37(6): 684–692.
( Jiang Z L, Jing C W, Li D, et al. 2011. Dynamics of vegetation and its responses to terrain factors with Mann-Kendall approach: a case study in Tiaoxi watershed, Taihu Lake. Journal of Zhejiang University:Agriculture & Life Science, 37(6): 684–692. [in Chinese] ) |
| [] |
田晓瑞, 舒立福, 赵凤君, 等. 2015. 中国主要生态地理区的林火动态特征分析. 林业科学, 51(9): 71–77.
( Tian X R, Shu L F, Zhao F J, et al. 2015. Dynamic characteristics of forest fires in the main ecological geographic districts of China. Scientia Silvae Sinicae, 51(9): 71–77. [in Chinese] ) |
| [] |
田晓瑞, 赵凤君, 舒立福, 等. 2010. 西南林区卫星监测热点及森林火险天气指数分析. 林业科学研究, 23(4): 523–529.
( Tian X R, Zhao F J, Shu L F, et al. 2010. Hotspots from satellite monitoring and forest fire danger index analysis for southwest China. Forest Research, 23(4): 523–529. [in Chinese] ) |
| [] |
魏风英. 2009. 现代气象统计检验与预测. 北京, 中国气象出版社: 57-69.
( Wei F Y. 2009. Modern climate statistics diagnosis and prediction. Beijing, China Meteorological Press: 57-69. [in Chinese] ) |
| [] |
邬宏, 张称意, 王立新, 等. 2013. 近35年中国东部林区最高气温序列. 林业科学, 49(8): 1–9.
( Wu H, Zhang C Y, Wang L X, et al. 2013. Maximum temperature series in eastern forest region of China in recent 50 years. Scientia Silvae Sinicae, 49(8): 1–9. DOI:10.11707/j.1001-7488.20130801 [in Chinese] ) |
| [] |
杨光, 邸雪颖, 舒立福. 2012. 近40a大兴安岭漠河县林火行为指标变化特征. 东北林业大学学报, 40(12): 76–80.
( Yang G, Di X Y, Shu L F. 2012. Variation characteristics of forest fire behavior indexes in Mohe County of Great Xing'an Mountains in recent 40 years. Journal of Northeast Forestry University, 40(12): 76–80. DOI:10.3969/j.issn.1000-5382.2012.12.018 [in Chinese] ) |
| [] |
于延胜, 陈兴伟. 2013. 基于Mann-Kendall法的径流丰枯变化过程划分. 水资源与水工程学报, 24(1): 60–63.
( Yu Y S, Chen X W. 2013. Division of variation process of high and low runoff based on Mann -Kendall method. Journal of Water Resources & Water Engineering, 24(1): 60–63. [in Chinese] ) |
| [] |
占车生, 乔晨, 徐宗学, 等. 2012. 渭河流域近50年来气候变化趋势及突变分析. 北京师范大学学报:自然科学版, 48(4): 399–405.
( Zhan C S, Qiao C, Xu Z X, et al. 2012. Climate change and mutation analysis in Weihe river basin in the last 50 years. Journal of Beijing Normal University:Natural Science, 48(4): 399–405. [in Chinese] ) |
| [] |
张艳平, 胡海清. 2008. 大兴安岭气候变化及其对林火发生的影响. 东北林业大学学报, 36(7): 29–31.
( Zhang Y P, Hu H Q. 2008. Climatic change and its impact on forest fire in Daxinganling mountains. Journal of Northeast Forestry University, 36(7): 29–31. [in Chinese] ) |
| [] |
赵凤君, 舒立福, 田晓瑞, 等. 2009. 气候变暖背景下内蒙古大兴安岭林区森林可燃物干燥状况的变化. 生态学报, 29(4): 1914–1920.
( Zhao F J, Shu L F, Tian X R, et al. 2009. The changes of forest fuel dryness conditions under global warming in Inner Mongolia Daxing'anling forest region. Acta Ecologica Sinica, 29(4): 1914–1920. [in Chinese] ) |
| [] |
郑度, 杨勤业, 吴绍洪. 2008. 中国生态地理区域系统研究. 北京: 商务印书馆, 198-199. ( Zheng D, Yang Q Y, Wu S H. 2008. Research on Eco-geographical Region Systems of China. Beijing: The Commercial Press, 198-199.[in Chinese]) |
| [] | Alcamo J, Floerke M, Maerker M. 2007. Futurelong-term changes in global water resources driven by socio-economic and climatic changes. Hydrological Sciences Journal, 52(2): 247–275. DOI:10.1623/hysj.52.2.247 |
| [] | Barbero R, Abatzoglou J, Steel E A, et al. 2014. Modeling very large-fire occurrences over the continental United States from weather and climate forcing. Environment Research Letters, 9(12): 124–133. DOI:10.1088/1748-9326/9/12/124009 |
| [] | Dennison P E, Brewer S C, Arnold J D, et al. 2014. Large wildfire trends in the western United States, 1984-2011. Geophysical Research Letters, 41(8): 2928–2933. DOI:10.1002/2014GL059576 |
| [] | Flannigan M D, Cantin A S, de Groot W J, et al. 2013. Global wildland fire season severity in the 21st century. Forest Ecology and Management, 294(3): 54–61. |
| [] | Flannigan M D, Krawchuk M A, de Groot W J, et al. 2009. Implications of changing climate for global wildland fire. International Journal of Wildland Fire, 18(5): 483–507. DOI:10.1071/WF08187 |
| [] | Hagemann S, Chen C, Haerter J O, et al. 2011. Impact of a statistical bias correction on the projected hydrological changes obtained from three GCMs and two hydrology models. Journal of Hydrometeorology, 12(4): 556–578. DOI:10.1175/2011JHM1336.1 |
| [] | Hennessy K, Lucas C, Nicholls N, et al. 2005. Climate change impacts on fire-weather in south-east Australia.Climate Impacts Group, CSIRO Atmospheric Research and the Australian Government Bureau of Meteorology, Aspendale. http://www.cmar.csiro.au/eprint/open/hennessykj_2005b.pdf. |
| [] | ISI-MIP. 2013. The inter-sectoral impact model intercomparison project design and simulation protocol (V2.3). [2016-06-20]http://www.ncbi.nlm.nih.gov/pmc/articles/PMC3948262/pdf/pnas.201312330.pdf. |
| [] | Khabarov N, Krasovskii A, Obersteiner M, et al. 2016. Forest fires and adaptation options in Europe. Regional Environment Change, 16(1): 21–30. DOI:10.1007/s10113-014-0621-0 |
| [] | Kloster S, Mahowald N M, Randerson J T, et al. 2012. The impacts of climate, land use, and demography on fires during the 21st century simulated by CLM-CN. Biogeosciences, 9(1): 509–525. DOI:10.5194/bg-9-509-2012 |
| [] | Liu Z, Yang J, Chang Y, Weisberg P J, et al. 2012. Spatial patterns and drivers of fire occurrence and its future trend under climate change in a boreal forest of Northeast China. Global Change Biology, 18(6): 2041–2056. DOI:10.1111/gcb.2012.18.issue-6 |
| [] | Marlon J R, Bartlein P J, Carcaillet C, et al. 2008. Climate and human influences on global biomass burning over the past two millennia. Nature Geoscience, 1(10): 697–702. DOI:10.1038/ngeo313 |
| [] | Marlon J R, Bartlein P J, Gavin D G, et al. 2012. Long-term perspective on wildfires in the western USA. Proceedings of the National Academy of Sciences, 109(9): E535–E543. DOI:10.1073/pnas.1112839109 |
| [] | New M, Hulme M, Jones P. 1999. Representing twentieth-century space-time climate variability (Part Ⅰ): development of a 1961-90 mean monthly terrestrial climatology. Journal of Climate, 12(3): 829–856. DOI:10.1175/1520-0442(1999)012<0829:RTCSTC>2.0.CO;2 |
| [] | North M, Collins B M, Stephens S. 2012. Using fire to increase the scale, benefits, and future maintenance of fuels treatments. Journal of Forest, 110(7): 392–401. DOI:10.5849/jof.12-021 |
| [] | Pechony O, Shindell D T. 2010. Driving forces of global wildfires over the past millennium and the forthcoming century. Proceedings of the National Academy of Sciences, 107(45): 19167–19170. DOI:10.1073/pnas.1003669107 |
| [] | Salmi T, Maatta A, Anttila P, et al. 2002. Detecting trends of annual values of atmospheric pollutants by the Mann-Kendall test and Sen's slope estimates—the Excel template application MAKESENS. Finnish Meteorological Institute, Helsinki.. http://www.fini.fi/julkaisu/pdf/MAKESENSE-Manual_2002.pdf. |
| [] | San-Miguel-Ayanz J, Moreno J M, Camia A. 2013. Analysis of large fires in European Mediterranean landscapes: lessons learned and perspectives. Forest Ecology and Management, 294(3): 11–22. DOI:10.1016/j.foreco.2012.10.050 |
| [] | Schelhaas M J, Hengeveld G, Moriondo M, et al. 2010. Assessing risk and adaptation options to fires and windstorms in European forestry. Mitigation and Adaptation Strategies for Global Change, 15(7): 681–701. DOI:10.1007/s11027-010-9243-0 |
| [] | Spracklen D V, Mickley L J, Logan J A, et al. 2009. Impacts of climate change from 2000 to 2050 on wildfire activity and carbonaceous aerosol concentrations in the western United States. Journal of Geophysical Research, 114(D20): 301–311. |
| [] | Tian X R, McRae D J, Boychuk D, et al. 2005. Comparisons and assessment of Forest Fire Danger systems. Chinese Forestry Research, 7(1): 53–61. DOI:10.1007/s11632-005-0058-0 |
| [] | Tian X R, McRae D J, Jin J, et al. 2011. Wildfires and the Canadian Forest Fire Weather Index system for the Daxing'anling region of China. International Journal of Wildland Fire, 20(4): 963–973. |
| [] | Tian X R, Shu L F, Zhao F J, et al. 2011. Future impacts of climate change on forest fire danger in northeastern China. Journal of Forestry Research, 22(3): 437–446. DOI:10.1007/s11676-011-0185-5 |
| [] | Tian X R, Zhao F J, Shu L F, et al. 2013. Distribution characteristics and the influence factors of forest fires in China. Forest Ecology and Management, 310(1): 460–467. |
| [] | Van Wagner C E. 1970. New development in forest fire danger rating. Canada Department of Fisheries and Forestry. Canadian Forest Service Information Report PS-X-19. |
| [] | Westerling A L, Hidalgo H G, Cayan D R, et al. 2006. Warming and earlier spring increase western U.S. forest wildfire activity. Science, 313(5789): 940–943. DOI:10.1126/science.1128834 |
| [] | Wotton B M, Nock C A, Flannigan M D. 2010. Forest fire occurrence and climate change in Canada. International Journal of Wildland Fire, 19(3): 253–271. DOI:10.1071/WF09002 |
 2017, Vol. 53

