 2017, Vol. 53
文章信息
- 王艳兵, 王彦辉, 熊伟, 姚依强, 张桐, 李振华
- Wang Yanbing, Wang Yanhui, Xiong Wei, Yao Yiqiang, Zhang Tong, Li Zhenhua
- 六盘山半干旱区华北落叶松树干液流速率及主要影响因子的坡位差异
- Variation in the Sap Flow Velocity of Larix principis-rupprechtii and Its Impact Factors in Different Slope Positions in a Semi-Arid Region of Liupan Mountains
- 林业科学, 2017, 53(6): 10-20.
- Scientia Silvae Sinicae, 2017, 53(6): 10-20.
- DOI: 10.11707/j.1001-7488.20170602
-
文章历史
- 收稿日期:2016-03-15
- 修回日期:2016-05-23
-
作者相关文章


2. 沈阳农业大学林学院 沈阳 110866;
3. 北京林业大学水土保持学院 北京 100083;
4. 新乡学院生命科学技术学院 新乡 453000
2. College of Forestry, Shenyang Agricultural University Shenyang 110866;
3. College of Soil and Water Conservation, Beijing Forestry University Beijing 100083;
4. School of Life Science and Technology, Xinxiang University Xinxiang 453000
在我国西北黄土高原等广大干旱半干旱区,自然环境条件恶劣,森林植被缺乏且破坏严重,造成土壤侵蚀剧烈,严重制约了当地社会经济发展,需要大力恢复和重建森林植被覆盖。为此,近些年来国家先后启动了退耕还林还草、天然林保护等林业生态工程,森林植被覆盖率明显增加,初步遏制了生态环境恶化的态势。但是,许多研究表明,森林植被增加导致生态用水增大(Kumagai et al., 2005a;2007; Komatsu et al., 2006a; 2006b),尤其造林导致林地和流域产流功能大幅降低(张淑兰等,2010;Wang et al., 2011;Zuo et al., 2016),需在准确评价森林植被结构和空间分布的水文影响的基础上合理调控林水关系。
林木蒸腾是森林水分平衡的重要环节,其占同期降水量的比例在湿润地区为20%~40%(Shuttleworth et al., 1988;McJannet et al., 2007),在半干旱区则可达40%~70%(苏建平等,2004;Zhao et al., 2016)。森林蒸腾还与光合作用紧密相关,进而影响植物的生长(Lloyd et al., 1995)和其他生态服务功能,因此需准确估算林木蒸腾。研究表明,树木蒸腾受到气象因子、土壤水分以及植被结构等多因素的共同影响。坡面是构成流域的1个基本空间单元,具有特定的水文要素空间差异和分布规律,包括土壤水文物理性质、森林植被结构特征的差异,以及坡面径流和土壤水分的再分配(Sabate et al., 1995;Tokuchi et al., 1999;Hanba et al., 2000;Luizao et al., 2004;Tateno et al., 2004),导致森林蒸腾有很大坡位差异。以往的森林蒸腾研究虽然很多,但偏重于流域和样地2个空间尺度(苏建平等,2004;Kumagai et al., 2005;Komatsu et al., 2006a;2006b;McJannet et al., 2007;张淑兰等,2010;Wang et al., 2011),偏重于在流域内的空间差异及其水文影响(于澎涛,2000),但缺乏在坡面尺度的空间(坡位)差异及影响因素的研究,影响了估测森林蒸腾的精度,因而需要加强该方面的研究。
树干液流探针测定技术自20世纪80年代出现以来,已日趋成熟,成为野外原位监测单株树木液流的可靠手段(赵平等,2005;Hölttä et al., 2015),它不受时空异质性的限制,因此广泛用于森林水分利用研究(Wilson et al., 2001;Kumagai et al., 2007;Ford et al., 2007),以及在样地、流域或景观尺度上的森林蒸腾或森林树种组成蒸腾影响的研究(Ewers et al., 2002;Mackay et al., 2002;Pataki et al., 2003;Ewers et al., 2005;Bladon et al., 2006)。尽管液流测定技术具有以上优点,但在用于推求流域蒸腾时仍需进行样树间、样树到样地、样地到坡面、坡面到流域这4个尺度的上推(Wilson et al., 2001),而尺度上推必须克服一些空间异质性限制。已有研究集中关注样树间的树干液流速率差异(Granier et al., 1996;Wullschleger et al., 2001;Pataki et al., 2003)、树木生长指标和边材面积的空间差异(Kumagai et al., 2005b)和树干液流速率沿边材深度的空间变化(Zang et al., 1996;Lu et al., 2000;Wullschleger et al., 2000;Delzon et al., 2004;Kumagai et al., 2005a),还缺乏对树干液流速率坡位差异及影响因素的研究。为了在坡面和流域尺度上准确估计华北落叶松林(Larix principis-rupprechtii)的蒸腾耗水,必须明确树干液流速率是否存在坡位差异,并确定引起差异的主导环境因子。
华北落叶松是我国北方主要造林树种之一,在黄土高原重要水源地的宁夏六盘山地区,1964—2002年人工造林1.57万hm2,保存1.20万hm2,其中郁闭成林0.90万hm2,占总造林面积的57%(王双贵等,2002),因此非常需要研究和量化华北落叶松林的蒸腾耗水及其环境响应规律,这对维护华北落叶松林健康和开展多功能可持续经营至关重要。在六盘山地区已开展一些华北落叶松林蒸腾研究,如熊伟等(2003)和刘建立等(2008)等研究发现林分液流和蒸腾主要受太阳辐射、饱和水汽压差、土壤水分的影响;冯永健等(2010)认为0~60 cm土层的土壤水势对林分蒸腾影响最大;孙林等(2011)确定了林分冠层平均导度对太阳辐射、饱和水汽压差和土壤水分响应的阈值。这些研究成果为定量认识华北落叶松林耗水规律和基于水量平衡协调林水关系提供重要参考,但均是样地尺度的研究结论,尚未涉及树木蒸腾耗水及其环境响应的坡位差异。因此,在六盘山北侧半干旱区的叠叠沟小流域,选择1个华北落叶松林覆盖的西北坡向的典型坡面,设置上、中、下3个坡位样地,研究树干液流速率及其主要影响因子的坡位差异。
1 材料与方法 1.1 研究地概况叠叠沟小流域(106°4′55″E—106°9′15″E,35°54′12″N—35°58′33″N)位于黄土高原中西部的六盘山北侧半干旱区,隶属宁夏回族自治区固原市。面积25.4 km2,海拔1 975~2 615 m,最大高差640 m,小流域呈南北走向,东坡和西坡是其主要坡向,坡度多为10~30°。典型大陆性季风气候,年均气温6~7 ℃,无霜期130天左右,年均降水量449 mm,主要集中在7—9月。植被分区在水平带上位于温带草原地带、温带南部草原亚地带,是森林草原向典型草原的过渡区。由于近代过度开垦和放牧,原始植被破坏严重,现有森林主要是华北落叶松人工林,多为20世纪80年代后逐渐营造的,还有少量散生的榆树(Ulmus pumila)、小叶杨(Populus simonii)等。土壤类型以灰褐土为主,黄土次之。
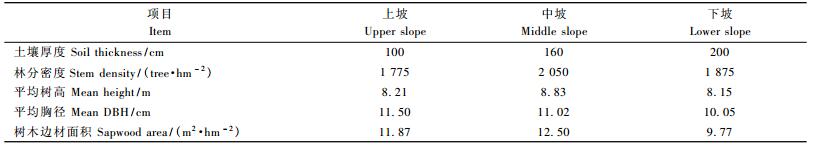
1.2 样地特征在小流域下游选择1个西北坡向(西偏北11°)的华北落叶松人工林典型坡面,高差129.9 m,水平坡长210 m,坡度30°,坡形变化比较一致。在坡面的上、中、下坡位,各设1个20 m×20 m的典型样地,林龄均为32年。各样地特征见表 1。
|
|
在距研究坡面1 km的林外开阔处,架设1台Weatherhawk-232自动气象站(WheatherHawk,美国),同步监测太阳辐射强度(Rs,W·m-2)、空气最低温度(Tmin,℃)、空气最高温度(Tmax,℃)、空气平均温度(Ta,℃)、空气相对湿度(RH,%)、降雨(P,mm)、最大风速(Wmax,m·s-1)、平均风速(Wa,m·s-1)、风向(Wd,°)、潜在蒸散(PET,mm)等常规气象指标,自记频率每5 min 1次。
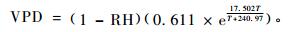
利用T和RH计算饱和水汽压差(VPD,kPa),公式如下:
|
(1) |
在林内选择冠层覆盖中等、地形一致无坑洼或凸起的地方,安装EQ15型张力计(Ecomatik,德国),测定各土层(0~10,10~20,20~40,40~60 cm)土壤水势Ψi (MPa),用DL-6数据采集器每5 min自动采集1次数据。
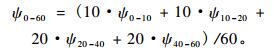
采用下式计算0~60 cm主根系层的平均土壤水势(Ψ0-60):
|
(2) |
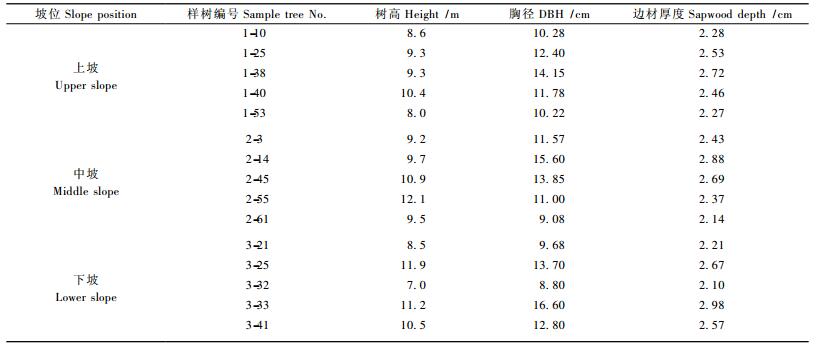
在每个样地内选择5株生长良好、干形通直的华北落叶松作为液流观测样树,其基本特征见表 2。在树干北面胸高处(距地约1.3 m)各安装1组SF-L热扩散探针(Ecomatik,德国),连续测定2015年6—9月的树干液流速率,并由DL2e数据采集器(Delta-T,英国)每隔5 min自动采集1次数据。热扩散探针的工作原理及安装方法见文献(王艳兵等,2013)。
|
|
液流速率即液流通量密度(JS,mL·cm-2min-1)的计算公式:
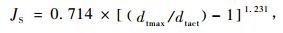
|
(3) |

|
(4) |
式中:dtmax、dtact均由式(4) 计算得到,dtmax指夜间空气湿度为100%长达2天或树干直径停止变化、处于相对稳定状态时算得的dt值;T1-0、T1-2、T1-3分别为探头S0与S1间、S2与S1间、S3与S1间的温差(℃)。
由于本研究中华北落叶松边材厚度较小(表 2),探针能够覆盖边材厚度的80%以上,因此忽略树干液流速率随边材深度的变化。基于上述方法计算得到不同坡位样地内各单株样树的液流速率,并将24 h液流速率的算术平均值作为单株样树的日均液流速率,然后将各坡位样地内的不同样树单株液流速率日均值的算术平均值作为样地液流速率。
1.5 数据分析在分析研究不同坡位液流速率与环境因子之间的关系时,采用皮尔逊相关分析法得到R2和K这2个重要参数。其中,R2为回归方程的决定系数,值越接近1说明拟合效果越好,模型可信度越高;K为回归方程的回归系数(斜率),反映对环境因子的响应程度,K>0时表明对影响因子为正响应(促进作用),K<0时表明对影响因子为负响应(抑制作用),K的绝对数值越大表明影响因子数值变化越大,K越趋近于0时则表明响应关系越弱(魏新光等,2014)。
在分析树干液流速率的环境因子响应时,为排除其他因子干扰,使用边界线方法进行分析,边界线的计算采用Duke University的Ram Oren’s H2O Ecology Group设计的宏程序。
应用SAS软件的ANOVA程序进行方差分析,检验不同坡位液流速率的差异,并进行Duncan多重比较;应用SAS中的STEPWISE程序进行逐步回归分析,建立不同坡位液流速率与环境因子的线性模型,分析各环境因子对不同坡位液流速率差异的影响。
2 结果与分析 2.1 环境因子变化观测期间(6月6日—9月30日),平均气温为15.9 ℃,最高气温为34.4 ℃(7月25日),最低气温为0.4 ℃(9月30日);日均太阳辐射强度平均为134.6 W·m-2,变幅在14.5~232.2 W·m-2;饱和水汽压差呈现出明显的季节变化,研究期间平均为1.35 kPa,最大值出现在研究中期(7月27日),为2.64 kPa。
研究期间降水量仅241 mm,且68%集中在6月和9月,中期明显较少。研究期间单日降水量大于20 mm的仅4天。从图 2可看出,不同坡位的0~60 cm土壤水势在研究期间变化格局相同,均随降水变化而出现双峰曲线,土壤水势仅在8月3日(33 mm)和9月3日(27 mm)降雨后出现明显上升。在6月6日—7月12日,由于非生长季降雪及该时段内降水补给,不同坡位土壤水势均较高,且坡位间差异较小,上、中、下坡的土壤水势分别为-0.050,-0.059和-0.016 MPa;在7月13日—8月2日,由于该时段内降雨较少,不同坡位土壤水势均呈逐渐减小趋势,且上坡和中坡的下降速率和幅度明显大于下坡,上、中、下坡位土壤水势分别为-0.446,-0.509和-0.133 MPa;在8月3日降水33 mm后,不同坡位的土壤水势均明显增大,但增幅存在显著坡位差异,上坡和中坡的增幅(0.732和0.483 MPa)显著大于下坡(0.074 MPa);在8月5日—9月2日,由于该时段内降水天数和降水量较少,不同坡位土壤水势开始迅速减小,且上坡和中坡减小速率显著大于下坡,该时段内土壤水势为上坡(-0.916 MPa)<中坡(-0.750 MPa)<下坡(-0.388 MPa);在9月3日—9月30日,由于降雨天数和降水量较多,不同坡位的土壤水势均逐渐升高,表现为上坡(-0.568 MPa)<中坡(-0.291 MPa)<下坡(-0.271 MPa)。整体上看,不同坡位的土壤水势大小为:上坡(-0.511 MPa)<中坡(-0.410 MPa)<下坡(-0.210 MPa)。

|
图 2 研究期间饱和水汽压差和土壤水势的变化 Fig.2 Variation of VPD and soil water potential during the study period |
图 3显示了研究期间不同坡位样地的日均液流速率时间变化。在6—8月期间,不同坡位的液流速率均呈现不断减小的整体变化趋势,这主要是因该时段内降水较少,土壤水势不断降低,波动是由阴雨天树木蒸腾需求较弱而导致的。在9月出现几个较高日均液流速率,是因土壤水势在雨后水分补充而升高。尽管7月末至8月初的VPD较高,但由于土壤水分限制,液流速率并未呈现出增大趋势。

|
图 3 研究期间日均液流速率变化 Fig.3 Variation of daily mean sap flow velocity during the study period |
图 4两两比较了整个研究期间3个坡位样地的液流速率(mL·cm-2min-1)。从图 4a可看出,在上坡液流速率小于0.06时,上坡和中坡的液流速率基本一致,此时的上坡土壤水势(-0.673 MPa)和中坡(-0.519 MPa)均较低,干旱胁迫使得二者的数值相近;但在上坡液流速率大于0.06时,上坡液流速率大于中坡,此时上坡和中坡土壤水势均较高(-0.075和-0.089 MPa),并未受到干旱胁迫,表明上坡和中坡液流速率的差异可能是由对气象因子响应差异引起的,即地形使上坡比中坡接受更多太阳辐射。从图 4b可看出,在上坡液流速率小于0.06时,下坡液流速率大于上坡,此时下坡土壤水势(-0.284 MPa)显著高于上坡(-0.673 MPa),即上坡干旱胁迫比下坡更大,表明此时上坡和下坡液流速率差异主要是由土壤水分差异引起的,下坡较高土壤含水量使其液流速率较大;但上坡液流速率大于0.06时,上坡液流速率大于下坡,此时上坡土壤水势(-0.075 MPa)和下坡均较高(-0.033 MPa),液流速率的差异是由对气象因子响应的坡位引起的,即地形使上坡比下坡接受更多太阳辐射。从图 4c可看出,几乎在所有液流速率范围都是下坡液流速率明显大于中坡,这主要是因下坡土壤水势高于中坡(图 1)。方差分析表明,不同坡位间液流速率差异极显著(P<0.000 1)。进一步的Duncan多重比较表明,研究期间的树干液流速率平均值的大小顺序为下坡(0.045)>上坡(0.036)>中坡(0.034),且不同坡位差异均显著(P<0.05)。

|
图 1 研究期间气温和太阳辐射的变化 Fig.1 Variation of temperature and solar radiation intensity during the study period |

|
图 4 不同坡位液流速率的比较 Fig.4 Comparison of daily mean sap flow velocity in different slope positions |
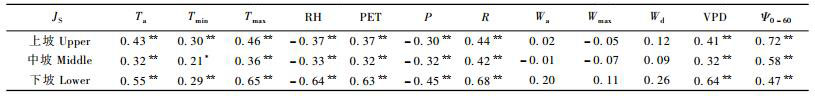
相关分析表明,除风速和风向外,日液流速率与测定的其他气象因子及土壤水势几乎均呈极显著相关(表 3),其中呈极显著正相关的因素包括日均气温、日潜在蒸散、日太阳辐射强度、VPD及0~60 cm土壤水势,呈极显著负相关的因素包括日相对湿度和日降水量。但相关系数大小存在坡位差异,除日最低气温外,液流速率与各气象因子的相关系数均表现为下坡>上坡>中坡,而与0~60 cm土壤水势的相关系数为上坡>中坡>下坡。在诸多环境因子中,上坡和中坡液流速率与0~60 cm土壤水势的相关系数均为最大,在下坡则与太阳辐射的相关系数为最大。综合来看,土壤水势和气象条件共同影响坡面上的树干液流速率变化,但主导环境因子在土壤水势较高的下坡为气象因子,在土壤水势较低的中坡和上坡为土壤水势。
|
|
在分析树干液流速率对环境因子响应时,为了排除其他因子干扰,使用边界线方法进行分析,并基于边界线数据点通过线性回归建立树干液流速率与单个环境因子的回归模型(图 5)。在相同土壤水势下,上坡的液流速率大于中坡和下坡;在太阳辐射强度或饱和水汽压差相同的条件下,基本上也都表现为上坡液流速率大于中坡和下坡(图 5);这表明地形遮荫使得上坡更利于林木蒸腾。在日均气温低于13.6 ℃时,下坡液流速率高于中坡和上坡,这可能因低温时气温随海拔升高而下降限制了中坡和上坡的蒸腾;但随着气温升高,气温的限制变弱,地形遮荫影响增强,使得上坡液流速率先后超过中坡和下坡。这表明海拔差异和地形遮荫均影响树干液流速率及其坡位差异。

|
图 5 树干液流速率与土壤水势、日均气温、日太阳辐射强度及饱和水汽压差的关系 Fig.5 The relationship between sap flow velocity and soli potential, daily average temperature, solar radiation intensity, as well as saturation vapor pressure deficit |
液流速率对环境因子的响应存在显著的坡位差异(表 4),其中的K和R2分别为图 5中各回归方程的斜率及决定系数。液流速率对日均气温、日最高气温、日均太阳辐射强度、饱和水汽压差及0~60 cm土壤水势均为正响应,而对日均相对湿度为负响应。液流速率对日均气温的响应表现为上坡>下坡>中坡,对日最高气温和饱和水汽压差的响应表现为上坡>中坡>下坡,对日均相对湿度的响应表现为上坡>中坡=下坡,对日均太阳辐射强度的响应表现为上坡<中坡=下坡,对0~60 cm土壤水势的响应表现为中坡>上坡>下坡。总体来看,从上坡到下坡,液流速率对温度、湿度、饱和水汽压差及0~60 cm土壤水势的响应基本上呈逐渐减小的趋势,而对日均太阳辐射的响应则呈逐渐增大的趋势。
|
|
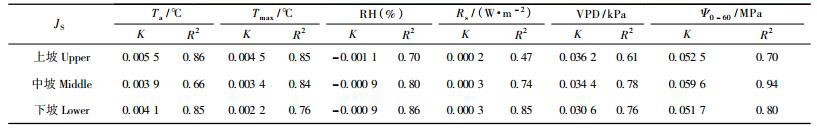
利用逐步回归分析,建立研究期间不同坡位液流速率与环境因子的多元线性回归方程,拟合效果较好,R2均在0.79以上(表 5)。但是,不同坡位入选变量存在差异,贡献最大的2个环境因子上坡为0~60 cm土壤水势和VPD,中坡为VPD和0~60 cm土壤水势,下坡为太阳辐射和0~60 cm土壤水势。3个坡位的共同点是液流速率均与土壤水势呈正相关,表明半干旱地区土壤水分限制蒸腾的特点,但与土壤水势的相关程度沿坡位降低而减小,是因土壤水势随坡位下降而升高,且下坡土壤水势研究期间一直维持在较高水平,而上坡和中坡长期处于亏缺状态;其次,研究坡面为西北坡,样地接受的太阳直射时间从上坡到下坡逐渐减小,因此下坡对太阳辐射强度变化更敏感。
|
|
树木边材液流速率与诸多气象因子以及土壤水分条件密切相关。大量研究(马玲等,2005;李海涛等,1998;于占辉等,2009;夏永秋等,2008)表明,树干液流速率与气温、空气相对湿度、光合有效辐射、总辐射、饱和水汽压差及潜在蒸散等显著相关,这与本研究一致。马玲等(2005)研究表明,马占相思(Acacia mangium)树干液流速率与气象因子的相关为光合有效辐射>总辐射>饱和水汽压差>空气相对湿度>空气温度,于占辉等(2009)研究表明侧柏(Platycladus orientalis)与气象因子相关为光合有效辐射>饱和水汽压差>温度>相对湿度,夏永秋等(2008)研究表明柠条(Caragana korshinskii)与气象因子相关为太阳辐射>温度>饱和水汽压差>相对湿度。在上述研究中虽然不同树种树干液流速率与环境因子的相关大小排序并不完全一致,但均表现为与太阳辐射相关性最高。在本研究中,除风速、风向外,不同坡位华北落叶松树干液流速率与气温、空气湿度、潜在蒸散、饱和水汽压差、太阳辐射强度等气象因子及0~60 cm土壤水势均呈极显著相关,其中相关性最高的气象因子在土壤水分条件较好的下坡为太阳辐射,这与前人研究结论一致;但是,在水分条件较差的上坡和中坡,相关性最高的环境因子均为0~60 cm土壤水势,说明土壤水势的作用在干旱地区和干旱立地上格外重要。
在本研究中,液流速率的坡位差异显著,表现为下坡>上坡>中坡,Engel等(2002)在美国纽约州哈德逊高地(降水量1 190 mm)开展的森林冠层水力特征及流域水量平衡的观测和模拟研究表明,由于地形梯度作用,北美红栎(Quercus rubra)沿坡呈现干旱和湿润生态型,树干液流速率表现为下坡>上坡,与本研究结果一致;而Kumagai等(2007; 2008)在日本九州岛对日本雪松(Cedar japonica)2个坡位液流速率和蒸腾差异研究和Loranty等(2008)在美国威斯康辛州帕克佛斯市开展的不同坡位样地美洲山杨(Populus tremuloides)、灰桤木(Alnus incana)、北美香柏(Thuja occidentalis)的树干液流速率的测定试验均表明,不同坡位的液流速率差异并不显著。本研究中60 cm主要根系分布层土壤水势表现为下坡>上坡,虽然Kumagai和Loranty等的研究中分别测定20和6 cm深土层的土壤水势均表现为下坡>上坡,与本研究一致,但是其测定结果并不能代表树木主要根系层的土壤水分状况,而Kumagai和Loranty的研究区属于湿润区,多年平均降水量分别为2 150和810 mm,因此在其研究中的不同坡位根系分布层土壤水势可能差异较小或存在差异但尚未达到限制树木液流速率的阈值(Loranty et al., 2008)。其次,不同树种的干旱胁迫应对策略可能存在差异,Breda等(1995)研究表明,随着干旱胁迫时间延长,根系吸收水分的土壤深度逐渐加深,甚至在湿润环境中由于根系生长受限导致土壤水分与蒸腾负相关。因此在本研究中的华北落叶松与前面所述研究树种之间可能存在干旱胁迫应对策略的差异。
本研究仅开展了1个生长季,且该生长季为枯水年,研究期间降水量仅为241 mm,因此研究结果存在一定的局限性。有待在平水年、丰水年及更长时间序列对树干液流速率及其环境因子响应的变化规律作进一步研究。基于本研究认为,在干旱半干旱区进行从样地到坡面的树干液流速率的尺度上推时,不仅需要考虑土壤水分的沿坡变化,同时要考虑地形因素引起的气象因子坡位差异。
4 结论在半干旱区的宁夏六盘山叠叠沟小流域的华北落叶松林西北坡面上,于2015年6—9月研究了华北落叶松日均树干液流速率的坡面差异。结果表明,不同坡位样地0~60 cm土层的土壤水势(MPa)差异显著,表现为下坡>中坡>上坡;不同坡位树干液流速率存在显著差异,但因受山地坡面气象条件差异的影响,其坡位排序与土壤水势不同,表现为下坡>上坡>中坡。在土壤水分充足时,液流速率的坡位差异主要是由地形导致的不同坡位样地的局部气象因子差异引起的;在土壤水分干旱胁迫严重时,液流速率的坡位差异主要是由土壤水分的坡位差异导致的。综合来看,树干液流速率的坡位差异是地形导致的土壤水分及气象条件的坡位差异共同作用的结果。多因子逐步回归分析表明,树干液流速率的主要环境因子在土壤水势较高的下坡为太阳辐射,在土壤水势较低的上坡为土壤水势,在介于二者之间的中坡则是饱和水汽压差和土壤水势。因此在半干旱区进行从样地到坡面的树干液流速率的尺度上推时,不仅需要考虑土壤水分的沿坡变化,同时要考虑地形因素引起的气象因子坡位差异。
| [] |
曹恭祥. 2010. 宁夏六盘山华北落叶松人工林与华山松天然次生林蒸散特征对比研究. 呼和浩特: 内蒙古农业大学硕士学位论文. ( Cao G X. 2010. A comparative study on the characteristics of evapotranspiration of Larix principis-rupprechtii plantation and Pinus armandii natural forest in Liupan Mountains of Ningxia. Hohhot: MS thesis of Inner Mongolia Agricultural University.[in Chinese]) http://cdmd.cnki.com.cn/Article/CDMD-10129-2010150143.htm |
| [] |
冯永健, 马长明, 王彦辉, 等. 2010. 华北落叶松人工林蒸腾特征及其与土壤水势的关系. 中国水土保持科学, 8(1): 93–98.
( Feng Y J, Ma C M, Wang Y H, et al. 2010. Relationship between the characteristics of transpiration of Larix principi-rupprechtii forest and soil water potential. Science of Soil and Water Conservation, 8(1): 93–98. [in Chinese] ) |
| [] |
李海涛, 陈灵芝. 1998. 应用热脉冲技术对棘皮桦和五角枫树干液流的研究. 北京林业大学学报, 20(1): 1–5.
( Li H T, Chen L Z. 1998. A study on the volume and velocity of stem-sapflow of Betula dahurica and Acer mono forests by the heat-pulse technique. Journal of Beijing Forestry university, 20(1): 1–5. [in Chinese] ) |
| [] |
刘建立, 王彦辉, 管伟, 等. 2008. 六盘山北侧生长季内华北落叶松树干液流速率研究. 华中农业大学学报, 27(3): 434–440.
( Liu J L, Wang Y H, Guan W, et al. 2008. Stem sap flux velocity of individual trees of Larix principi-rupprechtiiin rainy season in the north of Liupan Mountain. Journal of Huazhong Agricultural University, 27(3): 434–440. [in Chinese] ) |
| [] |
马玲, 赵平, 饶兴权, 等. 2005. 马占相思树干液流特征及其与环境因子的关系. 生态学报, 25(9): 2145–2161.
( Ma L, Zhao P, Rao X Q, et al. 2005. Effects of environmental factors on sap flow in Acacia mangium. Acta Ecologica Sinica, 25(9): 2145–2161. [in Chinese] ) |
| [] |
苏建平, 康博文. 2004. 我国树木蒸腾耗水研究进展. 水土保持研究, 11(2): 177–179.
( Su J P, Kang B W. 2004. Research proceeding of trees transpiration in China. Research of Soil and Water Conservation, 11(2): 177–179. [in Chinese] ) |
| [] |
孙林, 管伟, 王彦辉, 等. 2011. 华北落叶松冠层平均气孔导度模拟及其对环境因子的响应. 生态学杂志, 30(10): 2122–2128.
( Sun L, Guan W, Wang Y H, et al. 2011. Simulations of Larix principis-rupprechtii stand mean canopy stomatal conductance and its responses to environmental factors. Chinese Journal of Ecology, 30(10): 2122–2128. [in Chinese] ) |
| [] |
王双贵, 张晓娥, 张建军, 等. 2002. 六盘山林区华北落叶松人工林抚育间伐合理密度的研究. 宁夏农学院学报, 23(3): 12–14.
( Wang S G, Zhang X E, Zhang J J, et al. 2002. Research on Larix Mill. artificial woods' reasonable density of partition in Liupan Mountain area. Journal of Ningxia Agricultural College, 23(3): 12–14. [in Chinese] ) |
| [] |
王艳兵, 德永军, 熊伟, 等. 2013. 华北落叶松夜间树干液流特征及生长季补水格局. 生态学报, 33(5): 1375–1385.
( Wang Y B, De Y J, Xiong W, et al. 2013. The characteristics of nocturnal sap flow and stem water recharge pattern in growing season for a Larix principis-rupprechtii plantation. Acta Ecologica Sinica, 33(5): 1375–1385. [in Chinese] ) |
| [] |
魏新光, 陈滇豫, 汪星, 等. 2014. 山地枣林蒸腾主要影响因子的时间尺度效应. 农业工程学报, 30(17): 149–156.
( Wei X G, Chen D Y, Wang X, et al. 2014. Time scale effect on main factors that influence jujube transpiration in hillside jujube orchard. Transactions of the Chinese Society of Agricultural Engineering, 30(17): 149–156. DOI:10.3969/j.issn.1002-6819.2014.17.020 [in Chinese] ) |
| [] |
夏永秋, 邵明安. 2008. 黄土高原半干旱区柠条树干液流动态及其影响因子. 生态学报, 28(4): 1376–1382.
( Xia Y Q, Shao M A. 2008. The sap flow dynamics of Caragana korshinskii and the influence of environmental factors in semi-arid region of the Loess Plateau. Acta Ecologica Sinica, 28(4): 1376–1382. [in Chinese] ) |
| [] |
熊伟, 王彦辉, 徐德应. 2003. 宁南山区华北落叶松人工林蒸腾耗水规律及其对环境因子的响应. 林业科学, 39(2): 1–7.
( Xiong W, Wang Y H, Xu D Y. 2003. Regulations of water use for transpiration of Larix principi-rupprechtii plantation and its response on environmental factors in southern Ningxia hilly area. Scientia Silvae Sinicae, 39(2): 1–7. DOI:10.11707/j.1001-7488.20030201 [in Chinese] ) |
| [] |
于澎涛. 2000. 分布式水文模型在森林水文学中的应用. 林业科学研究, 13(4): 431–438.
( Yu P T. 2000. Application of physically-based distributed models in forest hydrology. Forest Research, 13(4): 431–438. [in Chinese] ) |
| [] |
于占辉, 陈云明, 杜盛. 2009. 黄土高原半干旱区侧柏树干液流动态. 生态学报, 29(7): 3970–3976.
( Yu Z H, Chen Y M, Du S. 2009. The sapflow dynamics of Platycladus orientalis in the semi-arid Loess Plateau region. Acta Ecologica Sinica, 29(7): 3970–3976. [in Chinese] ) |
| [] |
张淑兰, 王彦辉, 于澎涛, 等. 2010. 定量区分人类活动和降水量变化对泾河上游径流变化的影响. 水土保持学报, 24(4): 53–58.
( Zhang S L, Wang Y H, Yu P T, et al. 2010. Study for separating the impact of precipitation variation and human activities on runoff change of the upper reaches of Jing River. Journal of Soil and Water Conservation, 24(4): 53–58. [in Chinese] ) |
| [] |
赵平, 饶兴权, 马玲, 等. 2005. Granier树干液流测定系统在马占相思的水分利用研究中的应用. 热带亚热带植物学报, 13(6): 457–468.
( Zhao P, Rao X Q, Ma L, et al. 2005. Application of Granier's sap flow system in water use of Acacia mangium forest. Journal of Tropical and Subtropical Botany, 13(6): 457–468. [in Chinese] ) |
| [] | Bladon K D, Silins U, Landhäusser S M, et al. 2006. Differential transpiration by three boreal tree species in response to increased evaporative demand after variable retention harvesting. Agricultural and Forest Meteorology, 138(1/4): 104–119. |
| [] | Breda N, Granier A, Barataud F, et al. 1995. Soil water dynamics in an oak stand. I. Soil moisture, water potential and water uptake by roots. Plant and Soil, 172(1): 17–27. |
| [] | Delzon S, Sartore M, Granier A, et al. 2004. Radial profiles of sap flow with increasing tree size in maritime pine. Tree Physiology, 24(11): 1285–1293. DOI:10.1093/treephys/24.11.1285 |
| [] | Engel V C, Stieglitz M, Williams M, et al. 2002. Forest canopy hydraulic properties and catchment water balance: observations and modelling. Ecological Modelling, 154(3): 263–288. DOI:10.1016/S0304-3800(02)00068-6 |
| [] | Ewers B E, Gower S T, Bond-Lamberty B, et al. 2005. Effects of stand age and tree species on canopy transpiration and average stomatal conductance of boreal forests. Plant, Cell and Environment, 28(5): 660–678. DOI:10.1111/pce.2005.28.issue-5 |
| [] | Ewers B E, Mackay D S, Gower S T, et al. 2002. Tree species effects on stand transpiration in northern Wisconsin. Water Resources Research, 38(7): 1–11. |
| [] | Ford C R, Hubbard R M, Kloeppel B D, et al. 2007. A comparison of sap flux-based evapotranspiration estimates with catchment-scale water balance. Agricultural and Forest Meteorology, 145(3/4): 176–185. |
| [] | Granier A, Biron P, Breda N, et al. 1996. Transpiration of trees and forest stands: short and long-term monitoring using sapflow methods. Global Change Biology, 2(3): 265–274. DOI:10.1111/gcb.1996.2.issue-3 |
| [] | Hanba Y T, Noma N, Umeki K. 2000. Relationship between leaf characteristics, tree sizes and species distribution along a slope in a warm temperate forest. Ecologic Research, 15(4): 393–403. DOI:10.1046/j.1440-1703.2000.00360.x |
| [] | Hölttä T, Linkosalo T, Riikonen A, et al. 2015. An analysis of Granier sap flow method, its sensitivity to heat storage and a new approach to improve its time dynamics. Agricultural and Forest Meteorology, 211: 2–12. |
| [] | Komatsu H, Kang Y, Kume T, et al. 2006a. Transpiration from a Cryptomeria japonica plantation, part 1: aerodynamic control of transpiration. Hydrological Processes, 20(6): 1309–1320. DOI:10.1002/(ISSN)1099-1085 |
| [] | Komatsu H, Kang Y, Kume T, et al. 2006b. Transpiration from a Cryptomeria japonica plantation, part 2: responses of canopy conductance to meteorological factors. Hydrological Processes, 20(6): 1321–1334. DOI:10.1002/(ISSN)1099-1085 |
| [] | Kumagai T, Aoki S, Shimizu T, et al. 2007. Sap flow estimates of stand transpiration at two slope positions in a Japanese cedar forest watershed. Tree Physiology, 27(2): 161–168. DOI:10.1093/treephys/27.2.161 |
| [] | Kumagai T, Aoki S, Nagasawa H, et al. 2005a. Effects of tree-to-tree and radial variations on sap flow estimates of transpiration in Japanese cedar. Agricultural and Forest Meteorology, 135(1/4): 110–116. |
| [] | Kumagai T, Aoki S, Nagasawa H, et al. 2005b. Sources of error in estimating stand transpiration using allometric relationships between stem diameter and sapwood area for Cryptomeria japonica and Chamaecyparis obtusa. Forest Ecology Management, 206(1/3): 191–195. |
| [] | Kumagai T, Tateishi M, Shimizu T, et al. 2008. Transpiration and canopy conductance at two slope positions in a Japanese ceder forest watershed. Agricultural and Forest Meteorology, 148(10): 1444–1455. DOI:10.1016/j.agrformet.2008.04.010 |
| [] | Lloyd J, Grace J, Miranda A C, et al. 1995. A simple calibrated model of Amazon rainforest productivity based on leaf biochemical properties. Plant, Cell and Environment, 18(10): 1129–1145. DOI:10.1111/pce.1995.18.issue-10 |
| [] | Loranty M M, Mackay D S, Ewers B E, et al. 2008. Environmental drivers of spatial variation in whole-tree transpiration in an aspen-dominated upland-to-wetland forest gradient. Water Resources Research, 44(2): 282–288. |
| [] | Lu P, Muller W J, Chacko E K. 2000. Spatial variations in xylem sap flux density in the trunk of orchard-grown, mature mango trees under changing soil water conditions. Tree Physiology, 20(10): 683–692. DOI:10.1093/treephys/20.10.683 |
| [] | Luizao R C C, Luizao F J, Paiva R Q, et al. 2004. Variation of carbon and nitrogen cycling processes along a topographic gradient in a central Amazonian forest. Global Change Biology, 10(5): 592–600. DOI:10.1111/gcb.2004.10.issue-5 |
| [] | Mackay D S, Ahl D E, Ewers B E, et al. 2002. Effects of aggregated classifications of forest composition on estimates of evapotranspiration in a northern Wisconsin forest. Global Change Biology, 8(12): 1253–1265. DOI:10.1046/j.1365-2486.2002.00554.x |
| [] | McJannet D L, Wallace J S, Fitch P, et al. 2007. Water balance of tropical rainforest canopies in north Queensland, Australia. Hydrological Processes, 21(25): 3473–3484. DOI:10.1002/(ISSN)1099-1085 |
| [] | Pataki D E, Oren R. 2003. Species differences in stomatal control of water loss at the canopy scale in a mature bottomland deciduous forest. Advances in Water Resources, 26(12): 1267–1278. DOI:10.1016/j.advwatres.2003.08.001 |
| [] | Sabate S, Sala A, Gracia C A. 1995. Nutrient content in Quercus ilex canopies: seasonal and spatial variation within a catchment. Plant Soil, 169(1): 297–304. |
| [] | Shuttleworth W J. 1988. Evaporation from Amazonian rainforest. Proceedings of the Royal Society of London. Series B: Biological Sciences, 233(1272): 321–346. DOI:10.1098/rspb.1988.0024 |
| [] | Tateno R, Hishi T, Takeda H. 2004. Above-and belowground biomass and net primary production in a cool-temperate deciduous forest in relation to topographical changes in soil nitrogen. Forest Ecology and Management, 193(3): 297–306. DOI:10.1016/j.foreco.2003.11.011 |
| [] | Tokuchi N, Takeda H, Yoshida K, et al. 1999. Topographical variations in a plant-soil system along a slope on Mt Ryuoh, Japan. Ecological Research, 14(4): 361–369. DOI:10.1046/j.1440-1703.1999.00309.x |
| [] | Wang Y H, Yu P T, Feger K H, et al. 2011. Annual runoff and evapotranspiration of forestlands and non-forestlands in selected basins of the Loess Plateau of China. Ecohydrology, 4(2): 277–287. DOI:10.1002/eco.215 |
| [] | Wilson K B, Hanson P J, Mulholland P J, et al. 2001. A comparison of methods for determining forest evapotranspiration and its components: sap-flow, soil water budget, eddy covariance and catchment water balance. Agricultural and Forest Meteorology, 106(2): 153–168. DOI:10.1016/S0168-1923(00)00199-4 |
| [] | Wullschleger S D, Hanson P J, Todd D E. 2001. Transpiration from a multi-species deciduous forest as estimated by xylem sap flow techniques. Forest Ecology and Management, 143(1/3): 205–213. |
| [] | Wullschleger S D, King A W. 2000. Radial variation in sap velocity as a function of stem diameter and sapwood thickness in a yellow-poplar trees. Tree Physiology, 20(8): 511–518. DOI:10.1093/treephys/20.8.511 |
| [] | Zang D, Beadle C L, White D A. 1996. Variation of sapflow velocity in Eucalyptus globulus with position in sapwood and use of a correction coefficient. Tree Physiology, 16(8): 697–703. DOI:10.1093/treephys/16.8.697 |
| [] | Zhao W Z, Liu B, Chang X X, et al. 2016. Evapotranspiration partitioning, stomatal conductance, and components of the water balance: A special case of a desert ecosystem in China. Journal of Hydrology, 538: 374–386. DOI:10.1016/j.jhydrol.2016.04.042 |
| [] | Zuo D P, Xu Z X, Yao W Y, et al. 2016. Assessing the effects of changes in land use and climate on runoff and sediment yields from a watershed in the Loess Plateau of China. Science of The Total Environment, 544: 238–250. DOI:10.1016/j.scitotenv.2015.11.060 |