文章信息
- 王鹤松, 贾根锁, 张劲松, 李岩泉
- Wang Hesong, Jia Gensuo, Zhang Jinsong, Li Yanquan
- 基于特征空间的蒸散反演方法在中国北方地区的比较与应用
- Comparison and Application of Evapotranspiration Retrieving Methods Based on Feature Space over Northern China
- 林业科学, 2016, 52(12): 123-132
- Scientia Silvae Sinicae, 2016, 52(12): 123-132.
- DOI: 10.11707/j.1001-7488.20161215
-
文章历史
- 收稿日期:2016-03-21
- 修回日期:2016-11-22
-
作者相关文章
2. 中国科学院大气物理研究所东亚区域气候-环境重点实验室 北京 100029;
3. 中国林业科学研究院林业研究所 国家林业局林木培育重点实验室 北京 100091;
4. 南京林业大学南方现代林业协同创新中心 南京 210037
2. Key Laboratory of Regional Climate-Environment Research for Temperate East Asia, Institute of Atmospheric Physics, Chinese Academy of Sciences Beijing 100029 ;
3. Key Laboratory of Tree Breeding and Cultivation of State Forestry Administration Research Institute of Forestry, CAF Beijing 100091 ;
4. Co-Innovation Center of Sustainable Forestry in Southern China, Nanjing Forestry University Nanjing 210037
蒸散是陆地与大气间相互作用的重要部分,也是土壤、植被、大气连续体(SPAC)中水分运移和能量流动的主要环节(Sobrino et al., 2001),多年来一直是水文学、生态学、气象学、土壤学等多个学科共同关注的问题之一(李新等,2012; 唐晓培等,2016; 王丽娟等,2016)。蒸散在水资源管理、气候变化与植被反馈和气候模式的构建中起着至关重要的作用(Nemani et al., 2002;Nishida et al., 2003; 王介民等,2003)。中国北方大部分地区属干旱-半干旱气候,人口总量及密度的迅速增加、城市的扩张以及工业和农业对水资源的过度使用加剧了该地区干旱化的趋势,使得水分供需矛盾日益突出(李新周等,2004; 马柱国等,2006; 黄荣辉等,2013)。选取适合的蒸散反演方法,获取中国北方地区蒸散的时空变化特征不仅可以为该地区的水资源管理提供决策支持,还可加深对陆地生态系统水分与能量循环过程的认识。
早期的蒸散反演方法主要是面向平坦、均一下垫面的参考蒸散模型(Penman,1948; Monteith,1965; Priestley et al.,1972),这类模型通常只能在一定的假设条件下,在有限的空间范围内来计算作物的参考蒸散量,无法在复杂下垫面进行空间外推(刘丙军等,2007)。蒸散过程模型也称机理模型,这类模型将气象、土壤参数、下垫面植被的冠层导度、叶面积指数(LAI)等生理生态参数进行集成,可模拟典型试验区的蒸散过程,并可对未来的情景进行预测(莫兴国等,2004; 刘树华等,2007; 米娜等,2010)。但过程模型对地面气象、土壤等参数的精度要求过高,在区域尺度下往往无法满足对输入参数精度和空间分辨率的要求,难以在大尺度上应用。
遥感具有空间上连续、时间上可重复的特点,与地面土壤、气象、植被等信息进行集成,可实现蒸散的尺度扩展,可能是区域尺度下实现蒸散连续监测唯一可行的方法(Glenn et al.,2010)。基于遥感数据,蒸散的反演方法主要有: 1)根据实际观测得到的局地通量与遥感反演的地表参数进行经验性外推的方法(Nagler et al.,2005; French et al.,2010)这类方法虽然可以和遥感较好地结合,但计算的结果往往局限在某一空间范围之内,在尺度扩展上有一定局限性; 2)地表能量平衡模型 主要有SEBAL(surface energy balance algorithm for land)和SEBS(surface energy balance system)2种方法,这类方法通过选取地面的参考点来计算显热通量,然后根据能量平衡公式推算出潜热通量,进而得到蒸散,在小流域尺度、景观尺度有较好的应用(Bastiaanssen et al.,1998; Wang et al.,2005; 吴炳方等,2006),但是,地表能量平衡模型对地面气象参数敏感性较高,气象参数的误差会放大计算结果的误差,此外,能量不闭合现象也会增加由余项法得出的蒸散结果的不确定性; 3)地表温度-植被指数(反照率)特征空间方法(简称特征空间法)这类方法通过遥感数据可获得由地表温度和植被指数(反照率)构成的特征空间,进而结合气象数据,可在区域尺度上进行蒸散的反演,特征空间法可降低蒸散反演对地面气象参数的依赖性,仅需要少量气象数据且对其精度要求不高,因此得到广泛应用(Venturini et al.,2004; 刘英等,2012)。综上,特征空间法是区域尺度蒸散反演的可行方法,但该类方法多应用于平坦下垫面,在地形复杂区域的应用效果尚需验证,在中国北方这样大范围的区域尺度上开展的应用还较少(Tang et al.,2010)。另外,基于特征空间法,已有Jiang等(1999)提出的基于地表温度-植被指数的方法、Roerink等(2000)提出的基于地表温度-反照率的方法(S-SEBI)以及Wang等(2006)在Jiang等(1999)方法的基础上融合了热惯量方法,提出的基于昼夜地表温度差-植被指数的方法。上述不同方案的特征空间方法在中国北方地区的适用性需要进行验证与比较。
本研究基于MODIS(MODerate resolution imaging spectroradiometer)的卫星产品和气象台站数据,比较Jiang等(1999)、Wang等(2006)和Roerink等(2000)提出的3种特征空间方法。运用协同观测台站的实测数据对模型进行验证,在选择适合于中国北方地区方法的基础上,反演并分析中国北方地区蒸散的空间格局与季节变化特征,旨在探寻适合复杂下垫面的区域遥感蒸散反演方法,以期为改进蒸散的算法提供支持并初步认识中国北方地区蒸散的时空分布规律。
1 研究方法 1.1 数据获取与订正利用中国气象局在中国北方地区及其周边351个气象站的总辐射、气温数据,采用克里格空间插值(栅格大小1 km)得到区域尺度的总辐射与气温,其中温度的插值引入数字高程数据(DEM,1 km空间分辨率)作为加权变量(姜晓剑等,2010)。遥感数据来自中等分辨率成像光谱仪(MODIS)陆地工作组(http://modis-land.gsfc.nasa.gov/)发布的遥感产品(Collection 5),主要包括地表反射率(MOD09A1,0.5 km分辨率,用于计算地表反照率和植被指数)、地表覆盖类型(MCD12Q1,1 km分辨率)以及地表温度数据(MOD11A2,1 km分辨率)。
1.2 相关因子计算地表净辐射可由下式得到(Su,2002):
| ${R_n} = 1 - A{R_a} + {\varepsilon _a}\sigma T_a^4 - {\varepsilon _s}\sigma T_s^4.$ | (1) |
式中: A为地表反照率; Rn为地表净辐射(W·m-2); Ra为向下短波太阳辐射(W·m-2); εa为大气比辐射率; σ为玻尔兹曼常数(5.67亿W·m-2K-4); εs为地表比辐射率(无单位量纲); Ta和Ts分别为卫星过境时的瞬时大气辐射温度和地表温度(单位都是K),其中大气辐射温度在实际应用中常用近地层气温代替。εa与气温(Ta)和饱和水汽压(E0)间关系 (Zhang et al.,1999)如下:
| ${\varepsilon _a} = 1.08[1 - exp{( - {E_0}/10)^{{T_a}/2016}}].$ | (2) |
| ${E_0} = 6.11exp\left[ {17.27\left( {{T_a} - 273} \right)/\left( {{T_a} - 273 + 237} \right)} \right].$ | (3) |
地表比辐射率和归一化植被指数(NDVI)间存在显著的经验关系,将地表覆盖类型分为植被和土壤2类,地表比辐射率由下式计算(Sobrino et al.,2007):
| $\varepsilon = {\varepsilon _v}{P_v} + {\varepsilon _s}\left( {1 - {P_v}} \right) + d.$ | (4) |
式中:ε为地表的比辐射率; εv为植被的比辐射率,此处赋值0.99; εs为裸土的比辐射率,此处赋值0.97; d为裸土和植被之间的热交换,通常这一项可以忽略; Pv为像元内植被覆盖度,通过NDVI计算得到(Choudhury et al.,1994):
| ${P_v} = (NDVI - NDV{I_{min}})/(NDV{I_{max}} - NDV{I_{min}}).$ | (5) |
式中: NDVImax和NDVImin分别为研究区域生长季内NDVI的最大和最小值。
以上公式计算的辐射热通量是卫星过境时刻的瞬时值,而气象本底数据是逐日平均值。为此,本研究根据协同观测台站的观测数据分析得到白天Terra、Aqua卫星过境时刻(分别为当地时间10:30和13:30)气温与日均温的相关关系:
| ${T_{ra}} = 0.992{\rm{ }}1{T_m} + 2.7144({R^2} = 0.89,p < 0.01);$ | (6) |
| ${T_{au}} = 1.0134{T_m} + 4.8485({R^2} = 0.82,p < 0.01).$ | (7) |
式中: Tra和Tau分别为Terra卫星和Aqua卫星过境时的气温(℃),Tm为日平均气温(℃)。日平均净辐射与瞬时净辐射的比值是一个与日序有关的函数,Aqua过境时平均净辐射与瞬时净辐射的比值Cdi可以表示为(Sobrino et al.,2007):
| $\begin{array}{l} {C_{di}} = - 0.000008DO{Y^2} + 0.0028DOY + 0.082\\ \left( {{R^2} = 0.91,P < 0.01} \right). \end{array}$ | (8) |
式中: DOY为年积日。
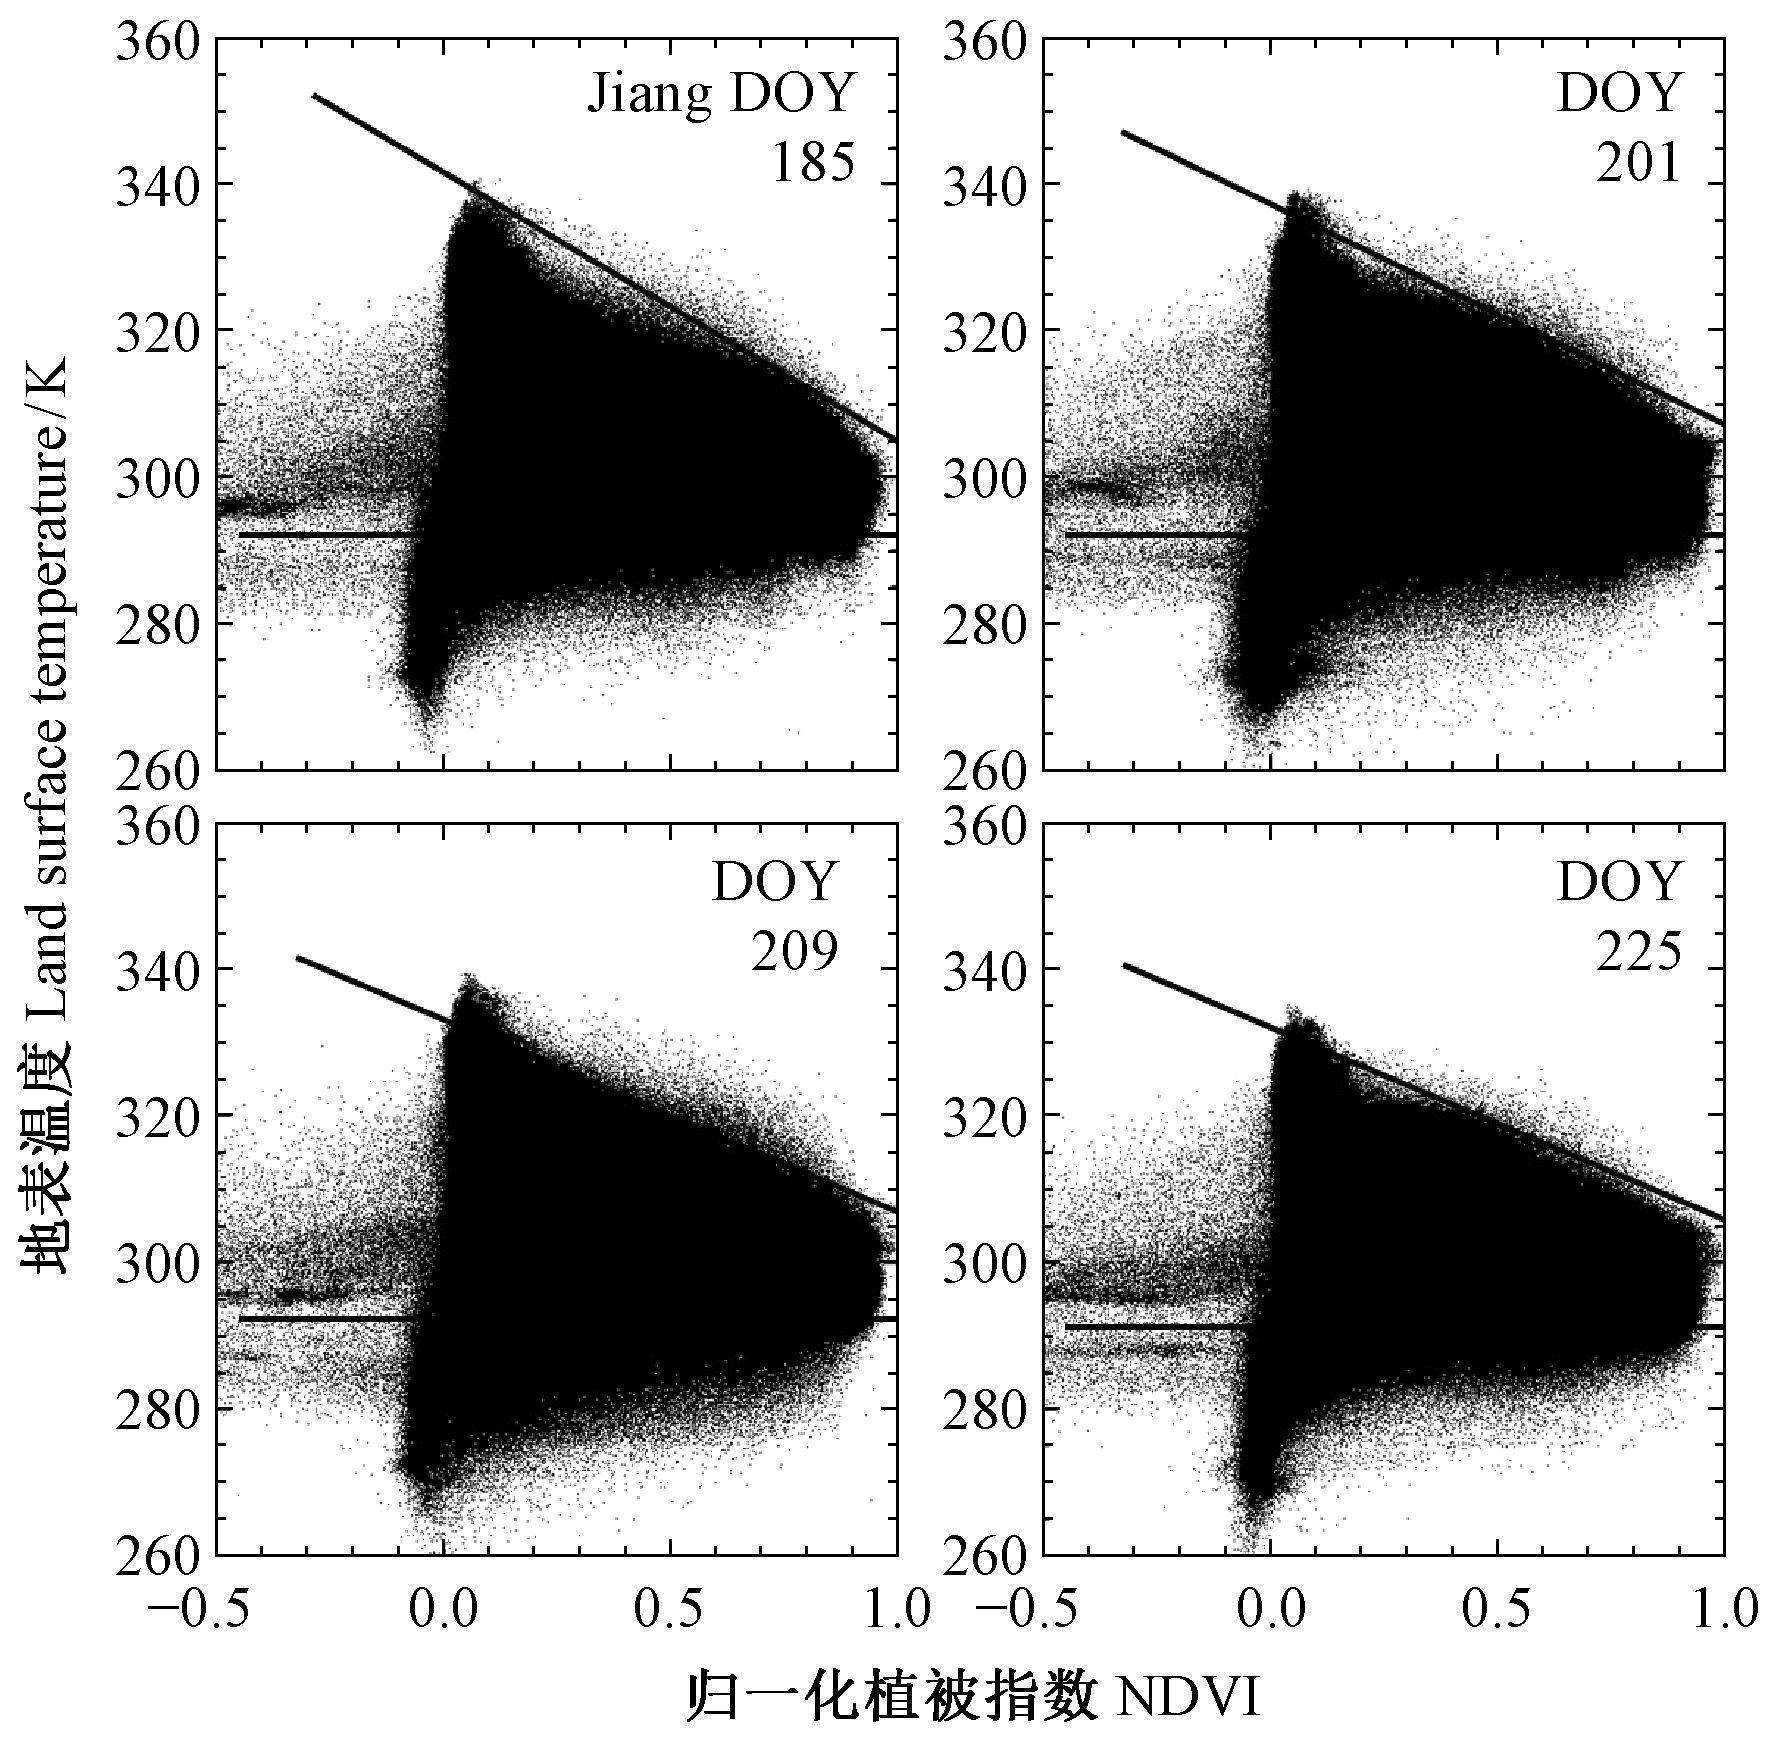
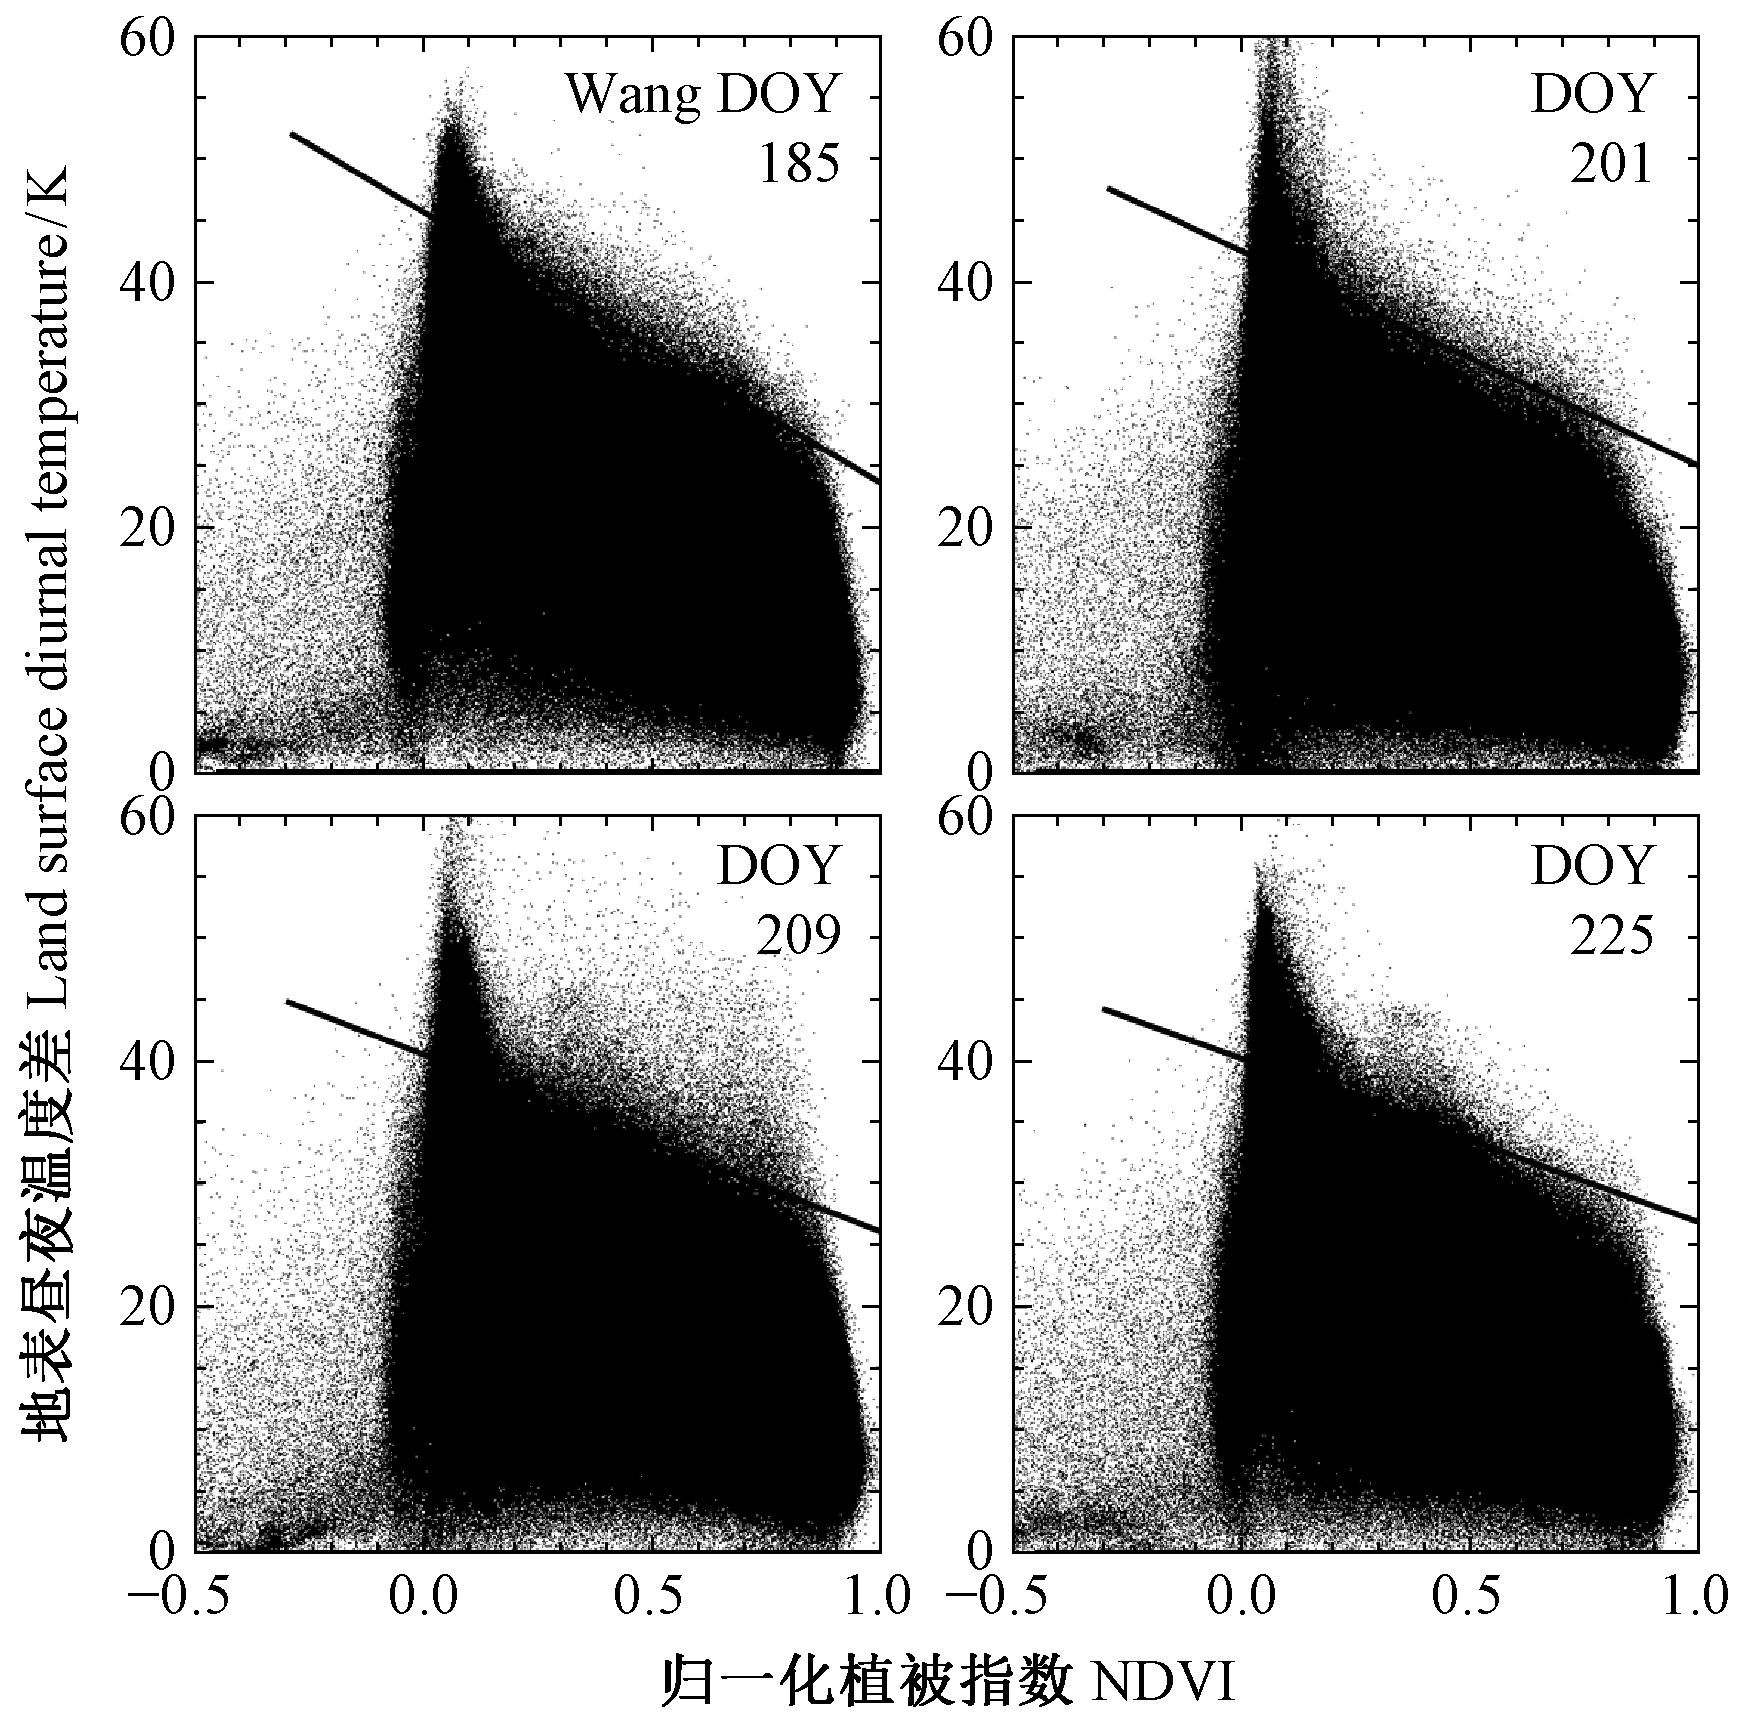
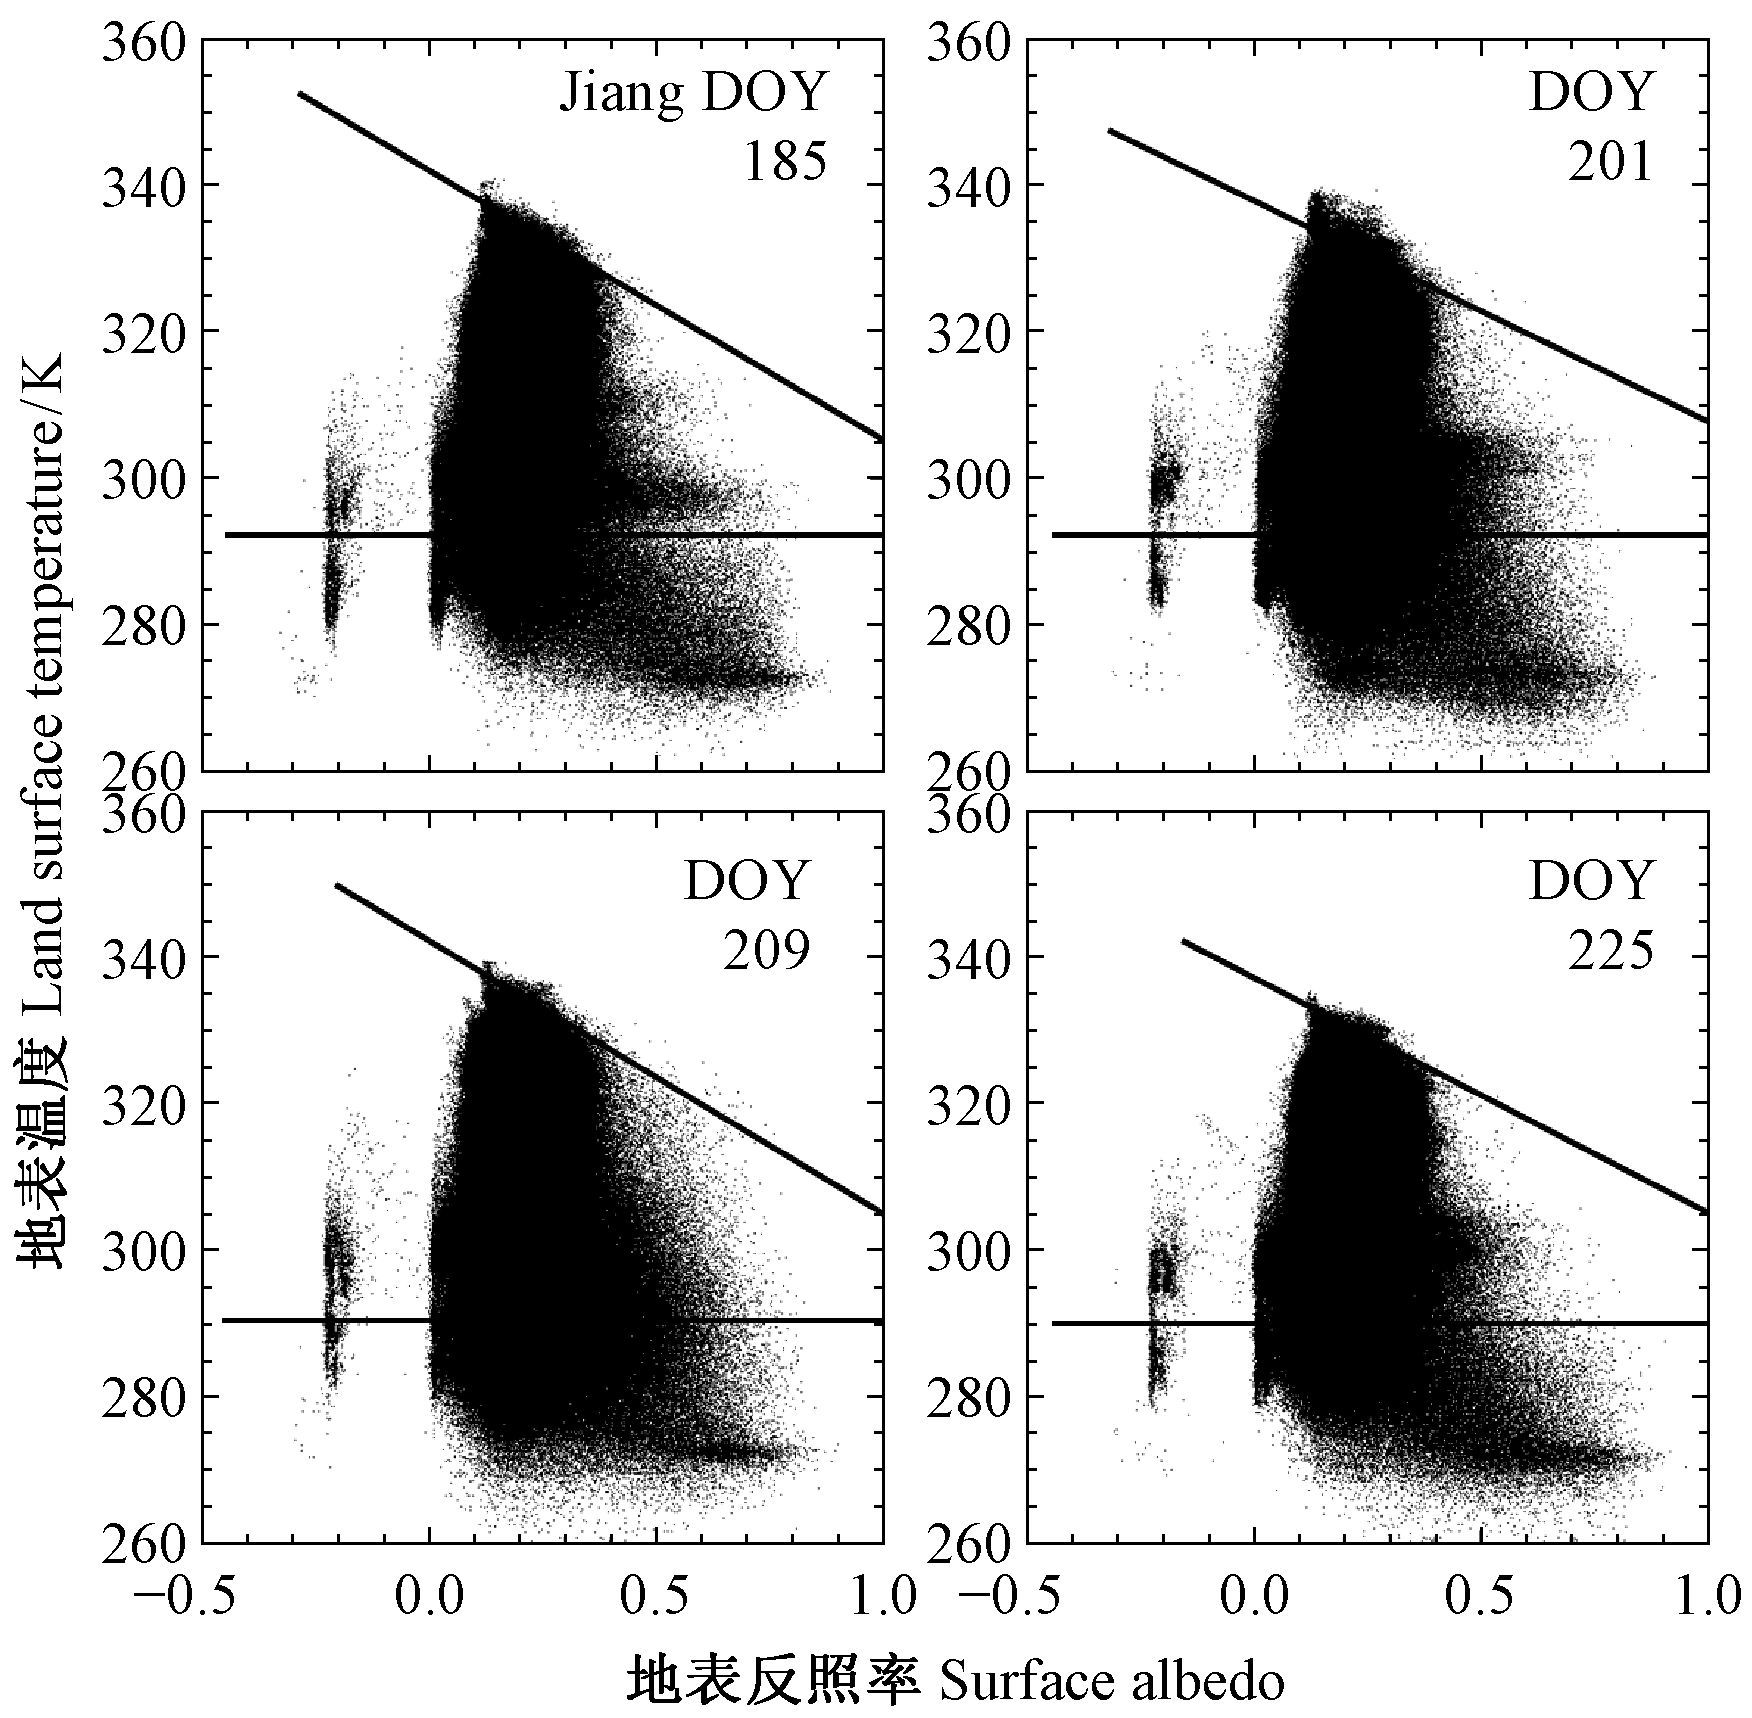
1.3 特征空间构建特征空间的构建主要在于“干边”和“湿边”的确定。在水分胁迫状态下,由于潜热减少,太阳辐射分配给地表的显热会增加,进而造成地表温度或昼夜温差的增加。“干边”代表的是不同植被指数(反照率)所对应的地表最大温度(温差); 而“湿边”是在水分饱和情况下,地表的温度情况。图 1,2和3分别为基于地表温度与植被指数(Jiang et al.,1999)、地表昼夜温度差与植被指数(Wang et al.,2006)和地表温度与地表反照率(Roerink et al.,2000)所构建的散点图。虽然Jiang等(1999)、Wang等(2006)和Roerink等(2000)这3种方法都有明确的物理基础,但在“干边”和“湿边”的确定上仍有一些不确定性。相对而言,“湿边”较容易确定,在Jiang等(1999)和Roerink等(2000)的方法中,本研究使用中国北方地区的大型水体如青海湖、呼伦湖的表面温度作为“湿边”的温度。而Wang等(2006)的方法是通过昼夜地表温差为0这一设定来确定“湿边”的。在“干边”的确定上,本研究使用Tang等(2010)推荐的自动确定边界的方法,使用方差和均方根差来约束“干边”的选取,具有较好的操作性。

|
图 1 地表温度与植被指数的空间散点 Fig.1 Scatter plots of the land surface temperature and normalized difference vegetation index(NDVI)values |

|
图 2 地表昼夜温度差与植被指数的空间散点 Fig.2 Scatter plots of the land surface diurnal temperature and normalized difference vegetation index(NDVI)values |

|
图 3 地表温度与地表反照率的空间散点 Fig.3 Scatter plots of the land surface temperature and land surface albedo values |
“干边”和“湿边”确定后,使用空间差值的方法得到蒸发比(EF),Jiang等(1999)的EF计算方法为:
| $\begin{array}{l} EF = \Delta \left( {{T_{max}} - {T_i}} \right)\left( {{\alpha _{max}} - {\alpha _{max}}NDVI} \right)/\\ \left( {\Delta + \gamma } \right)\left( {{T_{max}} - {T_{min}}} \right) + {\alpha _{max}}NDVI; \end{array}$ | (9) |
Wang等(2006)的EF计算方法为:
| $\begin{array}{l} EF = \Delta {\left( {\Delta {T_{max}} - \Delta T} \right)_i}\left( {{\alpha _{max}} - {\alpha _{max}}} \right)NDVI/\\ \left( {\Delta + \gamma } \right)\left( {\Delta {T_{max}} - \Delta {T_{min}}} \right) + {\alpha _{max}}NDVI; \end{array}$ | (10) |
Roerink等(2000)的EF计算方法为:
| $\begin{array}{l} EF = \Delta \left( {{T_{max}} - {T_i}} \right)\left( {{\alpha _{max}} - {\alpha _{max}}A} \right)/\\ \left( {\Delta + \gamma } \right)\left( {{T_{max}} - {T_{min}}} \right) + {\alpha _{max}}A. \end{array}$ | (11) |
式中:Tmax为“干边”对应温度; ΔTmax为“干边”对应的昼夜温差; Tmin为“湿边”对应温度; ΔTmin为“湿边”对应的昼夜温差; Ti,ΔTi分别为某一像元所对应的温度和昼夜温差; αmax为Priestly-Taylor系数,通常取值为1.26;Δ为饱和水气压随温度而变化的斜率;γ为干湿球常数。结合净辐射、土壤热通量数据,可得到潜热(LE)数据:
| $LE = EF\left( {{R_n} - G} \right);$ | (12) |
| $G = 0.35{R_n}\left( {1 - {P_v}} \right) + 0.05{R_n}{P_v}.$ | (13) |
式中:G为土壤热通量。蒸散量(ET)(单位: mm·d-1)由潜热通量(LE)(单位: W·m-2)经计算得到:
| $ET = 24 \times 3600 \times LE/2450000.$ | (14) |
本研究使用的验证数据来自“中国北方干旱-半干旱区协同观测集成研究”的10个通量台站。这些台站主要分布在中国北方的干旱与半干旱地区,代表了中国北方的主要植被类型(王鹤松等,2010),获取时段为植被的主要生长季(5—9月)。除长武、大野口、密云因位于山地地区,台站周围地势略有起伏外,其余台站都是农田或草地站,地势平坦。具体信息见表 1。蒸散通量数据由涡动相关系统观测得到,该系统包含了一个三维超声风速仪(除临泽和长武站使用Gill的WindMaster外,其余均使用Campbell的CSAT3)和开路式快速响应型红外气体分析仪(IRGA,Model LI7500,LI-Cor Inc.,Lincoln,Nebraska,USA)。为确保数据的精度与可比性,在协同观测前,所有台站的红外气体分析仪均经过H2O/CO2标定。原始数据的采集频率为10 Hz,数据经数据采集器(Model CR5000,Campbell Scientific Inc.,Logan,Utah,USA)存储,使用英国爱丁堡大学开发的涡动相关数据处理软件EdiRe进行数据处理,包括坐标旋转、WPL订正(Webb et al.,1980)等,处理结果每30 min输出1次。将由降水、雾气对Licor-7500光通道产生影响的数据删除,将小于2 h的缺测数据进行线性插补。为使遥感影像数据与地面观测数据在空间尺度上相匹配,经过解析足迹模型的计算,确定每个台站通量贡献区面积(Kleissl et al.,2009; 双喜等,2009; 贾贞贞等,2010)。同时,在考虑遥感像元的空间地理精度基础上,选取每个通量塔周围3×3个遥感像元(3 km×3 km)与通量观测数据进行验证比较。
|
|
将3种方法的反演结果分别与通量台站实测数据进行比较。回归分析表明,Wang等(2006)方法反演蒸发比的相关性最高,误差最小(R2=0.65,RMSE=0.17,表 1,图 4)。从各个台站来看,除在大野口站之外,Wang等(2006)方法的相关性都是最高的; 除位于东部地区的锦州站和密云站之外,Wang等(2006)方法的误差都是最低的。此外,在海拔较高的西部台站,Wang等(2006)的误差明显低于Jiang等(1999)和Roerink等(2000)。从反演蒸散的空间分布来看,以2008年第217日产品为例(图 5),在东部低海拔地区,3种方法反演得到蒸散的大小在空间分布上较为一致,Jiang等(1999)和Roerink等(2000)方法在西部的高海拔地区则普遍存在高估的现象。在昆仑山脉、天山山脉、祁连山脉以及青海省南部高原,Jiang等(1999)和Roerink等(2000)方法反演的蒸散大多达到5 mm·d-1以上,大小甚至与东部半湿润地区的山东半岛和辽东半岛相当。而Wang等(2006)方法反演的蒸散在上述区域多为2~3 mm·d-1。根据国家气象本底站的降水观测资料,新疆北部地区的平均年降水量为254 mm,南部地区为117 mm(苏宏超等,2007)。李世荣等(2006)在青海东部观测发现青海云杉(Picea asperata)和华北落叶松(Larix principis-rupprechtii)混交林生长季林地在7和8月的蒸散量分别为54.38和47.90 mm。可见在高海拔地区,Wang等(2006)方法的反演结果更接近于实际情况。受地表温度随海拔升高而降低的影响,Jiang等(1999)和Roerink等(2000)的方法整体上高估了中国西北地区的蒸散量。而Wang等(2006)的方法采用地表温度的昼夜温差变化构建特征空间,考虑了昼夜的热通量变化,可以避免海拔对模型反演结果的影响。经过与协同观测通量数据的验证发现,Wang等(2006)的方法反演的蒸散量相关性较高(R2=0.57,RMSE=0.78 mm·d-1),说明使用该方法在大范围空间尺度下反演区域蒸散量有较好的可行性。综上,Wang等(2006)的方法在海拔高度差异巨大、地势起伏剧烈的中国北方地区表现最好,本研究选用Wang等(2006)的方法来反演研究区的蒸散分布。

|
图 4 3种方法(Jiang,Wang和Roerink)模拟蒸发比(EF)并与实测值进行比较 Fig.4 Comparison between the modeled evaporative fraction(EF) using three methods(Jiang,Wang and Roerink)and measured EF |

|
图 5 不同反演方法对中国北方地区蒸散(ET)进行的估算,以2008年年积日217为例(白色为缺测地区) Fig.5 Spatial pattern of modeled ET using different retrieving methods on the day of year 217 in 2008 over northern China(data in white area is missing) |
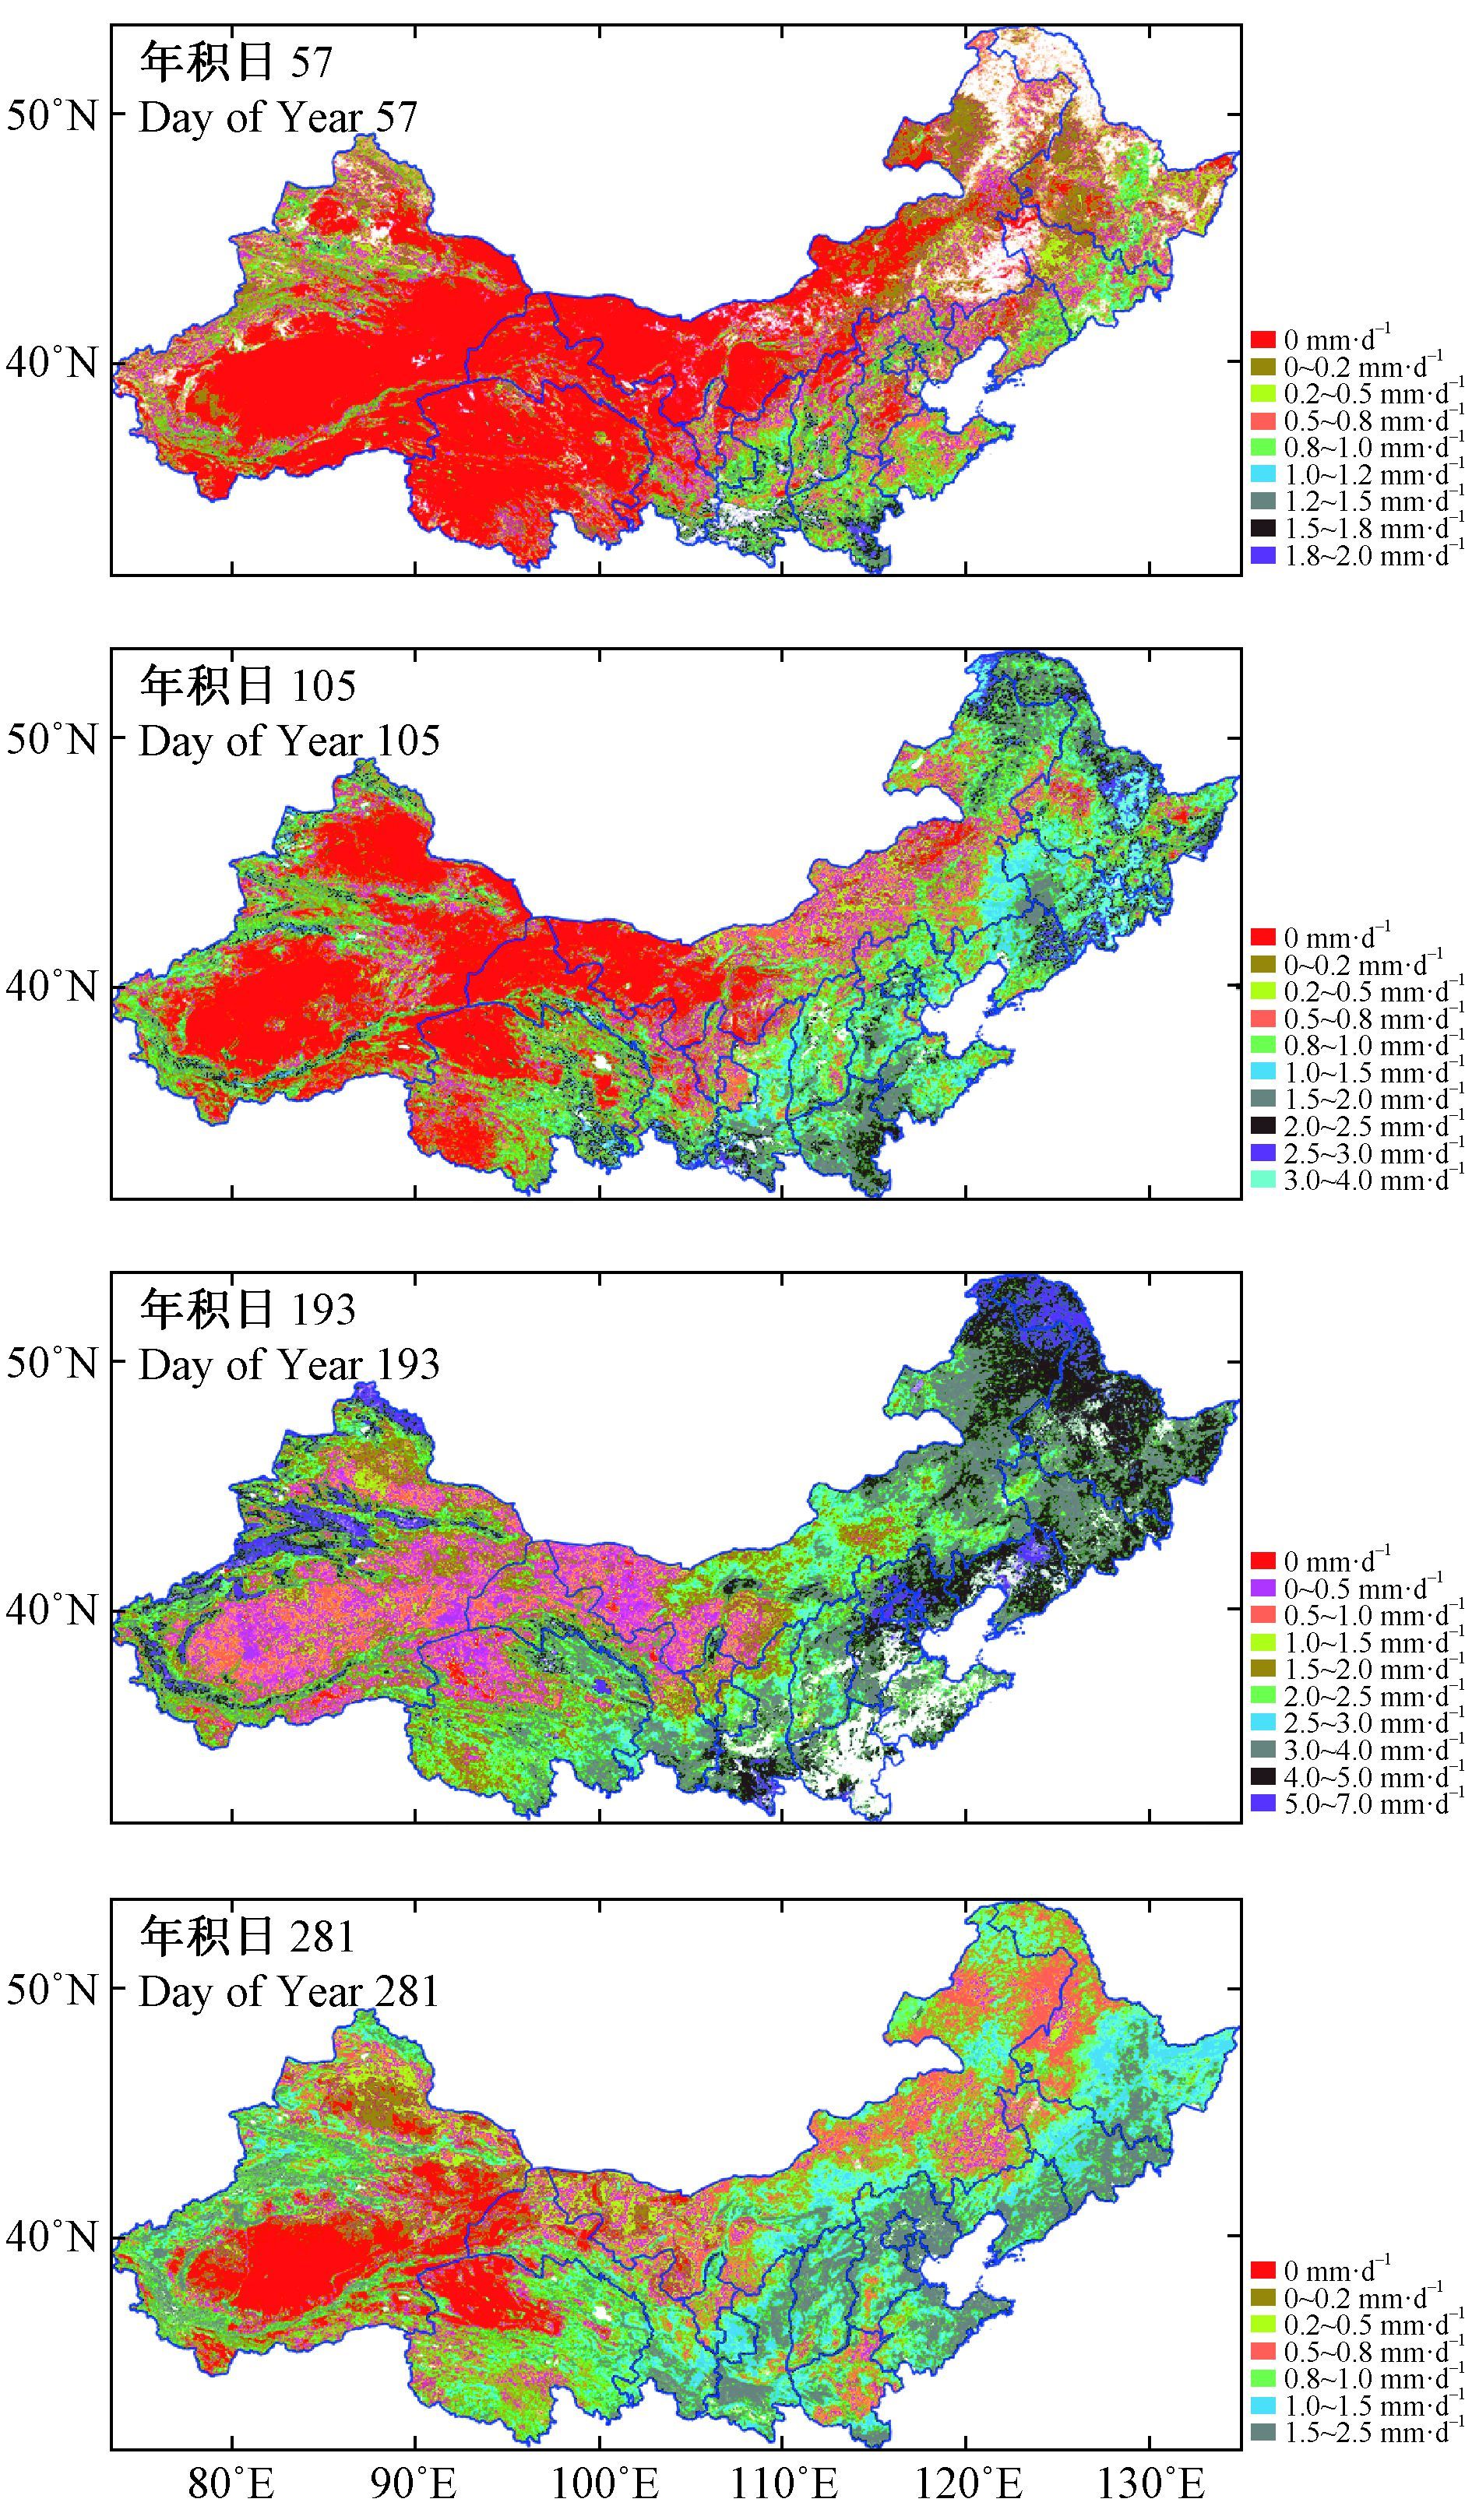
分别将2008年第57,105,193和281日反演得到的蒸散作为冬季、春季、夏季以及秋季的典型日来分析中国北方地区蒸散的时空格局变化(图 6)。在不同的季节,中国北方地区蒸散在空间分布上都表现出东高西低的特征。在冬季,大部分地区蒸散量在0.5 mm·d-1以下,蒸散量高值区(0.5~2 mm·d-1)集中在中国东北的长白山山脉、新疆西北部的天山山脉一带、华北的农田区域以及秦岭南部的阔叶林带;长白山脉和天山山脉一带蒸散量主要来自于少量积雪的融化蒸发,而华北农田和秦岭南部蒸散量则主要由植被的蒸腾耗水产生。在春季,随着温度增加和积雪融化,整个中国北方的蒸散量迅速增加,除西北部的准噶尔、柴达木和塔里木等沙漠地区外,都有较明显的蒸散作用,大部分达到了0.8 mm·d-1以上;天山山脉以及东北地区的积雪进一步融化,使得蒸散量明显增加,华北地区农田和秦岭植被的生长,也产生了较强的蒸散作用(1~3mm·d-1)。在夏季,随着温度、降水的增加以及植被生长的加速,整个区域蒸散量达到全年最大值,绝大部分地区蒸散强度在1.5 mm·d-1上,蒸散量高值区集中在中国东北的森林以及草甸草原地带、华北的农田地区以及秦岭一带的阔叶林区;蒸散量总体上从东部向西逐渐减弱,直至新疆的塔里木盆地一带达到最低值。在秋季,蒸散明显回落,除中国东北地区东南部、华北地区以及秦岭一带保持在1~2.5 mm·d-1外,其余地区蒸散量大多在1mm·d-1以下;内蒙古东部随着草原的枯黄蒸散多降至1mm·d-1以下,西部的塔里木、柴达木以及内蒙古阿拉善一带,蒸散量大多为0,仅在高海拔的亚高山地区表现出了一定的强度(0.8~2.5 mm·d-1)。

|
图 6 2008年中国北方地区四季的典型日(年积日57,105,193和281)蒸散量(ET)空间分布(白色为缺测地区) Fig.6 Spatial pattern of ET at typical days(day of year 57,105,1193 and 281 in 2008)of four seasons in northern China (data in white area is missing) |
由表 1可见,基于Wang等(2006)的方法,除大野口、东苏外,蒸发比模拟值与实测值的相关性都较高(R2>0.5)。大野口站所处位置的海拔落差在所有站中最大,导致垂直风向对涡动仪器的测量干扰较大,降低了观测结果的可靠性。东苏在所有台站中降水量最低,年均降水量仅为287 mm,3种模型在该站的反演效果都比较差。与这个现象类似的是,当前版本(Collection 5)的MODIS的ET产品在类似的稀疏植被地区同样没有提出较好的参数化方案,以致该类地区的产品一直空缺(Mu et al.,2011)。上述现象可能原因是,在干旱严重胁迫地区,大气和气孔的阻抗与干旱胁迫间的变化是非线性的,导致现有遥感蒸散模型在干旱地区的模拟能力较弱。
目前,多数基于遥感的蒸散量模拟需要有高精度的近地层气象参数支持,如风速、空气温度与湿度等。这种对地面数据的依赖使得模型很难在更大空间范围的区域尺度上应用。相对而言,特征空间法中需要的地面气象参数少且精度要求不高,免去了复杂的参数描述过程。目前,特征空间法已被广泛应用于蒸散反演、干旱监测等,但大多采用植被指数-地表温度来构成特征空间(田苗等,2010)。从本研究的结果来看,在大尺度空间范围上使用昼夜温差替代地表温度,是特征空间法可行的发展方向。Wang等(2006)的方法在集成了热惯量法的同时,保持了特征空间法对地面气象参数精度不敏感的特点 (Eichinger et al.,1996; Wang et al.,2006)。此外,该方法中的关键参数: 白天、夜间的地表温度以及植被指数都可以从遥感平台获得,使得该方法在区域尺度上更为实用。
能量平衡方程是很多遥感反演蒸散方法的基础,这类方法首先得到的是显热通量,然后通过能量平衡方程,采用余项法来得出潜热,进而得到蒸发比来计算蒸散量。但是,大量的地面观测表明,地表与大气间的能量收支普遍存在着能量不闭合的现象(王介民等,2009)。这会造成由余项法计算出来的潜热被高估。本研究采用的特征空间法是一种直接估算蒸发比的方法,不需要通过净辐射减去土壤热通量和显热通量的方式去计算蒸发比,避免了上述问题。这种直接获取蒸发比的方式使得特征空间法有望进一步降低反演结果的不确定性。
4 结论本研究使用区域气象和遥感数据,在中国北方地区,通过遥感特征空间的方法,反演了研究区域蒸散量的时空变化,主要结论如下。
1) 在下垫面类型复杂、海拔差异明显的中国北方地区,Jiang等(1999)和Roerink等(2000)的方法会将西部高海拔地区的蒸散量高估。Wang等(2006)的方法则考虑了研究区域昼夜的热惯量变化情况,可较好地模拟中国北方地区蒸散的空间和季节分布。
2) 在不同季节,中国北方地区蒸散量在空间分布上都表现出东高西低的特征。夏季的蒸散最高,春季略高于秋季,冬季最小。
3) 本研究采用的方法对地面参数依赖较少,比较适于在大尺度空间上开展蒸散的模拟工作,能够避免能量不闭合对蒸散遥感估算造成的影响,具有较好的实用价值。
| [] |
黄荣辉, 周德刚, 陈文, 等. 2013. 关于中国西北干旱区陆-气相互作用及其对气候影响研究的最近进展. 大气科学 , 37 (2) : 189–210.
( Huang R H, Zhou D G, Chen W, et al.2013. Recent progress in studies of air-land interaction over the arid area of Northwest China and its impact on climate. Chinese Journal of Atmospheric Sciences , 37 (2) : 189–210. [in Chinese] ) |
| [] |
贾贞贞, 刘绍民, 毛德发, 等. 2010. 基于地面观测的遥感监测蒸散量验证方法研究. 地球科学进展 , 25 (11) : 1248–1260.
( Jia Z Z, Liu S M, Mao D F, et al.2010. A study of the validation method of remotely sensed evapotranspiration based on observation data. Advances in Earth Science , 25 (11) : 1248–1260. [in Chinese] ) |
| [] |
姜晓剑, 刘小军, 黄芬, 等. 2010. 逐日气象要素空间插值方法的比较. 应用生态学报 , 21 (3) : 624–630.
( Jiang X J, Liu X J, Huang F, et al.2010. Comparison of spatial interpolation methods for daily meteorological elements. Chinese Journal of Applied Ecology , 21 (3) : 624–630. [in Chinese] ) |
| [] |
李世荣, 周心澄, 李福源, 等. 2006. 青海云杉和华北落叶松混交林林地蒸散和水量平衡研究. 水土保持学报 , 20 (2) : 118–121.
( Li S R, Zhou X C, Li F Y, et al.2006. Evapotranspiration and water balance of Picea asperata Mast. and Larix gmeini Rupr.mixed stand. Journal of Soil and Water Conservation , 20 (2) : 118–121. [in Chinese] ) |
| [] |
李新, 李小文, 李增元, 等. 2012. 黑河综合遥感联合试验研究进展:概述. 遥感技术与应用 , 27 (5) : 637–649.
( Li X, Li X W, Li Z Y, et al.2012. Progresses on the watershed allied telemetry experimental research(WATER). Remote Sensing Technology & Application , 27 (5) : 637–649. [in Chinese] ) |
| [] |
李新周, 刘晓东, 马柱国. 2004. 近百年来全球主要干旱区的干旱化特征分析. 干旱区研究 , 21 (2) : 97–103.
( Li X Z, Liu X D, Ma Z G.2004. Analysis on the drought characteristics in the main arid regions in the world since recent hundred-odd years. Arid Zone Research , 21 (2) : 97–103. [in Chinese] ) |
| [] |
刘丙军, 邵东国, 沈新平. 2007. 作物需水时空尺度特征研究进展. 农业工程学报 , 23 (5) : 258–264.
( Liu B J, Shao D G, Shen X P.2007. Advances in researches on the spatial-temporal features of crop water requirement. Transactions of the Chinese Society of Agricultural Engineering , 23 (5) : 258–264. [in Chinese] ) |
| [] |
刘树华, 于飞, 刘和平, 等. 2007. 干旱、半干旱地区蒸散过程的模拟研究. 北京大学学报:自然科学版 , 43 (3) : 359–366.
( Liu S H, Yu F, Liu H P, et al.2007. Study of evapotranspiration processes simulation in arid and semi-arid regions. Acta Scientiarum Naturalium Universitatis Pekinensis , 43 (3) : 359–366. [in Chinese] ) |
| [] |
刘英, 马保东, 吴立新, 等. 2012. 基于NDVI-ST双抛物线特征空间的冬小麦旱情遥感监测. 农业机械学报 , 43 (5) : 55–63.
( Liu Y, Ma B D, Wu L X, et al.2012. Drought remote sensing for winter wheat based on double parabola NDVI-ST space. Transactions of the Chinese Society for Agricultural Machinery , 43 (5) : 55–63. [in Chinese] ) |
| [] |
马柱国, 符淙斌. 2006. 1951-2004年中国北方干旱化的基本事实. 科学通报 , 51 (20) : 2913–2925.
( Ma Z G, Fu C B.2006. Some evidence of drying trend over northern China from 1951 to 2004. Science Bulletin , 51 (20) : 2913–2925. [in Chinese] ) |
| [] |
米娜, 张玉书, 陈鹏狮, 等. 2010. 玉米农田蒸散过程及其对气候变化的响应模拟. 生态学报 , 30 (3) : 698–709.
( Mi N, Zhang Y S, Chen P S, et al.2010. A modeling study of evapotranspiration from maize cropping system and its response to climate change. Acta Ecologica Sinica , 30 (3) : 698–709. [in Chinese] ) |
| [] |
莫兴国, 林忠辉, 李宏轩. 2004. 基于过程模型的河北平原冬小麦产量和蒸散量模拟. 地理研究 , 23 (5) : 623–631.
( Mo X G, Lin Z H, Li H X.2004. Simulation of winter wheat yield and evapotranspiration with process-based model and remote sensing data in the Hebei Plain. Geographical Research , 23 (5) : 623–631. [in Chinese] ) |
| [] |
双喜, 刘绍民, 徐自为, 等. 2009. 黑河流域观测通量的空间代表性研究. 地球科学进展 , 24 (7) : 724–733.
( Shuang X, Liu S M, Xu Z W, et al.2009. Investigation of spatial representativeness for surface flux measurements in the Heihe River Basin. Advances in Earth Science , 24 (7) : 724–733. [in Chinese] ) |
| [] |
苏宏超, 沈永平, 韩萍, 等. 2007. 新疆降水特征及其对水资源和生态环境的影响. 冰川冻土 , 29 (3) : 343–350.
( Su H C, Shen Y P, Han P, et al.2007. Precipitation and its impact on water resources and ecological environment in Xinjiang region. Journal of Glaciology and Geocryology , 29 (3) : 343–350. [in Chinese] ) |
| [] |
唐晓培, 宋妮, 陈智芳, 等. 2016. 未来主要气候情景下黄淮海地区参考作物蒸散量时空分布. 农业工程学报 , 32 (14) : 168–176.
( Tang X P, Song N, Chen Z F, et al.2016. Spatial and temporal distribution of ET0 under main climate scenarios in future across Huang-Huai-Hai Plain. Transactions of the Chinese Society of Agricultural Engineering , 32 (14) : 168–176. [in Chinese] ) |
| [] |
田苗, 王鹏新, 孙威. 2010. 基于地表温度与植被指数特征空间反演地表参数的研究进展. 地球科学进展 , 25 (7) : 698–705.
( Tian M, Wang P X, Sun W.2010. A review of retrieving of land surface parameters using the land surface temperature-vegetation index feature space. Advances in Earth Science , 25 (7) : 698–705. [in Chinese] ) |
| [] |
王鹤松, 贾根锁, 冯锦明, 等. 2010. 我国北方地区植被总初级生产力的空间分布与季节变化. 大气科学 , 34 (5) : 882–890.
( Wang H S, Jia G S, Feng J M, et al.2010. Spatial distribution and seasonality of gross primary production in northern China. Chinese Journal of Atmospheric Sciences , 34 (5) : 882–890. [in Chinese] ) |
| [] |
王介民, 高峰, 刘绍民. 2003. 流域尺度ET的遥感反演. 遥感技术与应用 , 18 (5) : 332–338.
( Wang J M, Gao F, Liu S M.2003. Remote sensing retrieval of evapotranspiration over the scale of drainage basin. Remote Sensing Technology and Application , 18 (5) : 332–338. [in Chinese] ) |
| [] |
王介民, 王维真, 刘绍民, 等. 2009. 近地层能量平衡闭合问题-综述及个例分析. 地球科学进展 , 24 (7) : 705–713.
( Wang J M, Wang W Z, Liu S M, et al.2009. The problems of surface energy balance closure-an over view and case study. Advances in Earth Science , 24 (7) : 705–713. [in Chinese] ) |
| [] |
王丽娟, 郭铌, 杨启东, 等. 2016. 基于MODIS遥感产品估算西北半干旱区的陆面蒸散量. 高原气象 , 35 (2) : 375–384.
( Wang L J, Guo N, Yang Q D, et al.2016. Land surface evapotranspiration estimated based on MODIS remote sensing products over the semi-arid northwest China. Plateau Meteorology , 35 (2) : 375–384. [in Chinese] ) |
| [] |
吴炳方, 邵建华. 2006. 遥感估算蒸腾蒸发量的时空尺度推演方法及应用. 水利学报 , 37 (3) : 286–307.
( Wu B F, Shao J H.2006. Temporal and spatial extension of evaportranspiration estimated from remote sensing. Journal of Hydraulic Engineering , 37 (3) : 286–307. [in Chinese] ) |
| [] | Bastiaanssen W G M, Menenti M, Feddes R A, et al.1998. A remote sensing surface energy balance algorithm for land(SEBAL)1. Formulation.Journal of Hydrology , 212 (98) : 198–212. |
| [] | Choudhury B J, Ahmed N U, Idso S B, et al.1994. Relations between evaporation coefficients and vegetation indices studied by model simulations. Remote Sensing of Environment , 50 (1) : 1–17. DOI:10.1016/0034-4257(94)90090-6 |
| [] | Eichinger W E, Parlange M B, Stricker H.1996. On the concept of equilibrium evaporation and the value of the priestley-taylor coefficient. Water Resources Research , 32 (1) : 161–164. DOI:10.1029/95WR02920 |
| [] | French A N, Hunsaker D J, Clarke T R, et al.2010. Combining remotely sensed data and ground-based radiometers to estimate crop cover and surface temperatures at daily time steps. Journal of Irrigation and Drainage Engineering , 136 (4) : 232–239. DOI:10.1061/(ASCE)IR.1943-4774.0000169 |
| [] | Glenn E P, Nagler P L, Huete A R.2010. Vegetation index methods for estimating evapotranspiration by remote sensing. Surveys in Geophysics , 31 (6) : 531–555. DOI:10.1007/s10712-010-9102-2 |
| [] | Jiang L, Islam S.1999. A methodology for estimation of surface evapotranspiration overlarge areas using remote sensing observations. Geophysical Research Letters , 26 (17) : 2773–2776. DOI:10.1029/1999GL006049 |
| [] | Kleissl J, Hong S H, Hendrickx J M H.2009. New Mexico scintillometer network:supporting remote sensing and hydrologic and meteorological models. Bulletin of the American Meteorological Society , 90 (2) : 207–218. DOI:10.1175/2008BAMS2480.1 |
| [] | Monteith J L.1965. Evaporation and environment. Symposia of the Society for Experimental Biology , 19 (19) : 205–224. |
| [] | Mu Q Z, Zhao M S, Running S W.2011. Improvements to a MODIS global terrestrial evapotranspiration algorithm. Remote Sensing of Environment , 115 (8) : 1781–1800. DOI:10.1016/j.rse.2011.02.019 |
| [] | Nagler P, Cleverly J, Lampkin D, et al.2005. Predicting riparian evapotranspiration from MODIS vegetation indices and meteorological data. Remote Sensing of Environment , 94 (1) : 17–30. DOI:10.1016/j.rse.2004.08.009 |
| [] | Nemani R R, White M A, Thornton P, et al.2002. Recent trends in hydrologic balance have enhanced the carbon sink in the United States. Geophysical Research Letters , 29 (10) : 1061–1064. DOI:10.1029/2002GL014867 |
| [] | Nishida K, Nemani R R, Running S W, et al.2003. An operational remote sensing algorithm of land surface evaporation. Journal of Geophysical Research , 108 (9) : 469–474. |
| [] | Penman H L.1948. Natural evaporation from open water,bare soil and grass. Proceedings of the Royal Society of London A , 193 (1032) : 120–145. DOI:10.1098/rspa.1948.0037 |
| [] | Priestley C H B, Taylor R J.1972. On the assessment of surface heat flux and evaporation using large-scale parameters. Monthly Weather Review , 100 (2) : 81–92. DOI:10.1175/1520-0493(1972)100<0081:OTAOSH>2.3.CO;2 |
| [] | Roerink G J, Su Z, Menenti M.2000. S-SEBI:a simple remote sensing algorithm to estimate the surface energy balance. Physics and Chemistry of the Earth,Part B:Hydrology,Oceans and Atmosphere , 25 (2) : 147–157. DOI:10.1016/S1464-1909(99)00128-8 |
| [] | Sobrino J A, Gómez M, Jiménez-Mu J C, et al.2007. Application of a simple algorithm to estimate daily evapotranspiration from NOAA-AVHRR images for the Iberian Peninsula. Remote Sensing of Environment , 110 (2) : 139–148. DOI:10.1016/j.rse.2007.02.017 |
| [] | Sobrino J A, Raissouni N, Li Z.2001. A comparative study of land surface emissivity retrieval from NOAA data. Remote Sensing of Environment , 75 (2) : 256–266. DOI:10.1016/S0034-4257(00)00171-1 |
| [] | Su Z.2002. The surface energy balance system(SEBS)for estimation of turbulent heat fluxes. Hydrology and Earth System Sciences , 6 (1) : 85–99. DOI:10.5194/hess-6-85-2002 |
| [] | Tang R L, Li Z L, Tang B.2010. An application of the Ts-VI triangle method with enhanced edges determination for evapotranspiration estimation from MODIS data in arid and semi-arid regions:implementation and validation. Remote Sensing of Environment , 114 (3) : 540–551. DOI:10.1016/j.rse.2009.10.012 |
| [] | Venturini V, Bisht G, Islam S, et al.2004. Comparison of evaporative fractions estimated from AVHRR and MODIS sensors over South Florida. Remote Sensing of Environment , 93 (1/2) : 77–86. |
| [] | Wang J M, Liu S M, Maitan T, et al.2005. Monitoring actual evapotranspiration with satellite remote sensing in the Hai River basin of China. Journal Agricultural Meteorology , 60 (5) : 565–568. DOI:10.2480/agrmet.565 |
| [] | Wang K, Li Z, Crib M.2006. Estimation of evaporative fraction from a combination of day and night land surface temperatures and NDVI:a new method to determine the priestley-taylor parameter. Remote Sensing of Environment , 102 (3) : 293–305. |
| [] | Webb E K, Pearman G I, Leuning R.1980. Correction of flux measurements for density effects due to heat and water vapour transfer. Quarterly Journal of the Royal Meteorological Society , 106 (447) : 85–100. DOI:10.1002/(ISSN)1477-870X |
| [] | Zhang W, Zhang Y, Katsuro O, et al.1999. Observation and estimation of daily actual evapotranspiration and evaporation on a glacierized watershed at the headwater of the Urumqi River,Tianshan,China. Hydrological Processes , 13 (11) : 1589–1601. DOI:10.1002/(ISSN)1099-1085 |
 2016, Vol. 52
