文章信息
- 苗庆林, 田晓瑞
- Miao Qinglin, Tian Xiaorui
- 多气候情景下大兴安岭森林燃烧性评估
- Assessment of Burn Probability Assessment in Daxing'anling under Multi-Climatic Scenarios
- 林业科学, 2016, 52(10): 109-116
- Scientia Silvae Sinicae, 2016, 52(10): 109-116.
- DOI: 10.11707/j.1001-7488.20161014
-
文章历史
- 收稿日期:2016-02-24
- 修回日期:2016-05-09
-
作者相关文章
2. 北京市房山区蒲洼乡人民政府 北京 102477
2. Puwa Township People's Government, Fangshan District, Beijing Beijing 102477
火是森林生态系统的重要干扰因子,在复杂的时间和空间尺度上它是生态系统发展变化的重要动力(Whitlock et al., 2010)。林火的发生和蔓延与气象条件、火源和可燃物类型等息息相关。受时间和空间尺度的限制,仅基于有限的历史林火资料很难对林火动态进行定量分析。对长时间尺度(几年或几十年)和大空间尺度(景观)上的火发生和蔓延的模拟还存在很大不确定性,因此,需要结合气候、植被和地形条件等因子对火发生和蔓延进行模拟。景观尺度上的林火动态模拟是开展林火管理措施及评价其效果的重要方法(Scott et al., 2001;Stephens et al., 2005)。Hargrove等(2010)利用LANDIS景观模型模拟了大尺度上可燃物变化对林火动态的影响和不同的森林经营方案与土地利用变化等对火动态和景观的影响(Gustafson et al., 2004)。Cary等(2009)利用4种模型模拟了过火面积对地形、可燃物和气候与气象3个因子的敏感性,发现气候因子对过火面积的影响最大。
林火动态受地形、植被和气候等因素的影响。有关气候变化对林火动态的影响已有大量研究(Moriondo et al., 2006;Flannigan et al., 2009; De Groot et al., 2012)。气候变化导致很多区域的林火动态已发生改变,大部分区域的森林火险升高,火险期延长,火活动增加(Moriondo et al., 2006;田晓瑞等,2012)。对于经营的森林,由于人为干扰导致火险期长度、火险强度、可消耗可燃物等发生变化,景观水平上的火动态在21世纪将随全球气候变化而进一步改变(Kloster et al., 2012)。预计到2030年和21世纪末,北方林火次数将分别增加30%和75%(Wotton et al., 2010)。由于春季雪融日期提前及春季、夏季气温升高,导致北美西部地区火险期延长(Westerling et al., 2006;Running et al., 2006)。在2050年代,美国西部年均火烧面积将增加54%,太平洋西北森林和落基山脉森林的火灾面积将分别增加78%和175%(Spracklen et al., 2009)。在2 × CO2情景下,葡萄牙火灾次数将增加179%,火灾面积将增加378%,年增长率为1.4%~7.8%(Carvalho et al., 2010)。1961-2005年内蒙古大兴安岭林区的森林火险呈升高趋势,火险期提前和延长,夏季森林火灾增多(赵凤君等,2009),未来对森林火灾的控制将更困难(邸雪颖等,2011)。杨光等(2012)根据HadCM3模式模拟的A2a和B2a气候情景数据,分析了黑龙江大兴安岭地区21世纪森林火险变化,发现中等以上的火险日数呈上升趋势。2071-2100年中国东北地区的潜在火灾可能增加10%~18%,火险期延长21~26天(Tian et al., 2011),中国东北的寒带森林在2081-2100年段的火发生密度将增加30%(CGCM3 B1情景)~230%(HadCM3 A2情景)(Liu et al., 2012)。
本文采用的气候情景数据是RCP(representative concentration pathways)气候情景,包括RCP2.6、RCP4.5、RCP6.0和RCP8.5 4种情景,每种情景代表了不同的辐射强迫程度和CO2浓度及其变化路径(Van Vuuren et al., 2011)。RCP2.6、RCP4.5、RCP6.0与RCP8.5情境分别代表辐射强迫力在2100年增加2.6、4.5、6.0和8.5 W·m-2。在这4种情境中,RCP2.6是暖化减缓的情境(辐射强迫力在2100年呈减少趋势),RCP4.5与RCP6.0是属于稳定情境(辐射强迫力变化在2100年呈较为稳定状态),RCP8.5则是温室气体高度排放情境(辐射强迫力在2100年前持续增加)。
燃烧概率模型(BURN-P3)用于模拟景观尺度上的火发生与蔓延(Parisien et al., 2005),模型包括火发生、火蔓延环境和火蔓延3个模块。该模型基于火增长模型(Prometheus)模拟每起火的蔓延。模型以年为步长进行迭代循环,迭代次数根据研究区面积大小、景观结构组成和火动态确定。同一迭代过程中不会出现重复火烧的格点,根据每个格点在所有模拟次数中的重复火烧次数计算燃烧概率。通过燃烧概率模型定量描述未来气候情景下大兴安岭地区的林火动态变化,将提高对气候变化影响的认知,为开展林火管理适应技术提供科学依据。
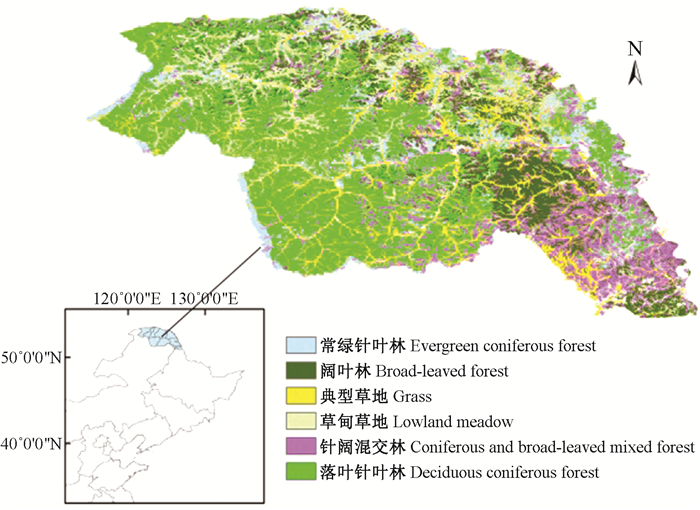
1 研究区概况研究区位于黑龙江大兴安岭,地理范围为121°11′-127°02′E,50°54′-53°33N′(图 1)。研究区总面积约646.2万hm2,平均海拔573 m。地形起伏不大,山坡较为平缓。气候属于寒温带大陆性季风气候,冬季寒冷漫长、夏季炎热短暂。年均气温-2.8 ℃,无霜期90~110天,年均降水量450~500 mm (徐化成,1998)。
|
图 1 研究区域和可燃物类型 Fig.1 The study area and fuel types |
植被类型主要以落叶松林和针阔混交林为主,落叶松林、针阔混交林、落叶阔叶林[主要为白桦(Betula platyphylla)林、蒙古栎(Quercus mongolica)林和山杨(Populus davidiana)林等]和常绿针叶林(樟子松(Pinus sylvestris var. mongolica)、偃松(Pinus pumila)和云杉(Picea sp.)等分别占34%、18.1%、14.1%和8%;湿地主要分布在岭南的中部和西部,占13.8%;草地占9.8%。研究区的主要树种有兴安落叶松(Larix gmelinii)、白桦、樟子松、蒙古栎和山杨等。林内下木以榛子(Corylus heterophylla)、杜鹃(Rhododendron simsii)和越桔(Vaccinium vitis-idaea)居多。河谷、沼泽地带生长着茂密的塔头苔草(Carex tato)、大叶章(Deyeuxia langsdorffii)、蚊子草(Filipendula palmata)和地榆(Sanguisorba officinalis)等草本植物。
2 数据来源植被数据源于中国1:25万土地覆盖遥感调查与监测数据库(国家科学数据共享工程-地球系统科学共享网)。数字高程数据(DEM)源于地理空间数据云(http://www.gscloud.cn)。气象台站历史气象数据(1980-2010年)源于中国气象科学数据共享网(http://cdc.nmic.cn),包括4个气象站(漠河、塔河、新林和呼玛)的日最高气温、日平均气温、24小时降水量、日最小相对湿度、平均风速和风向等日值数据。大兴安岭1987-2010年森林火灾统计资料源于黑龙江省森林草原防火办公室,包括火灾发生与扑灭时间、经纬度坐标、火烧面积和火因等信息。
1971-2050年RCP2.6、RCP4.5、RCP6.0和RCP8.5 4个气候情景的全球气候模式HadGEM2-ES数据由ISI-MIP(The Inter-Sectoral Impact Model Intercomparison Project)提供,经中国农业科学院农业环境与可持续发展研究所提取并转换为ASCII码。此数据经过了初步插值(双线性插值)和订正(基于概率分布的统计偏差订正),包括最高气温、降水量、平均相对湿度和近地面平均风速等日值数据。
3 研究方法 3.1 气候情景数据订正采用月均差值(或差值比例)校正法和非线性转化方程法(Hay et al., 2000)对研究区的1971-2050年RCP2.6、RCP4.5、RCP6.0和RCP8.5气候情景数据进行进一步订正。根据1981-2000年地面观测数据对模拟数据的气温、降水和相对湿度进行校正,通过对气象站点的历史观测数据和附近格点的模拟数据的月均值进行差异性分析,确定修订参数。利用历史观测的日均相对湿度和中午相对湿度建立回归方程,再根据修订的平均相对湿度计算中午相对湿度。
3.2 火天气指数(FWI)计算根据修正的温度、相对湿度、降水量和风速,逐日计算4种气候情景和历史观测数据的林火天气指数,输出指标包括3个可燃物湿度码[细小可燃物湿度码(fine fuel moisture content, FFMC)、腐殖质湿度码(duff moisture content, DMC)、干旱码(drought code, DC)]和3个火行为指标,即初始蔓延速度(initial spread index, ISI)、有效可燃物指标(build-up index, BUI)和火险天气指数(fire weather index, FWI)(Van Wagner et al., 1987)。
3.3 森林燃烧模拟林火发生与蔓延模拟采用BURN-P3模型,模型的输入包括空间数据和运行环境参数设定。
空间数据包括可燃物类型、地形、火发生密度、风场、气象分区和火管理分区,空间分辨率为100 m。研究区可燃物类型按加拿大可燃物分类系统分为6类,即常绿针叶林(C-4)、落叶针叶林(M-1a)、针阔混交林(M-1b)、落叶阔叶林(D-1)、典型草地(O-1a)和草甸草地(O-1b)。林火发生密度分布根据1987-2010年林火统计资料分别生成不同火因(人为/雷击)和不同季节(春、夏、秋)的火点密度分布图。气象分区则根据4个气象台站的位置将研究区分成4个区。模拟风场采用WindNinja软件处理(Forthofer et al., 2010)基于表面热通量、距山脊顶部或山谷底部的距离、坡度角、表面和夹带的阻力参数等来计算地形风。
运行环境参数包括季节划分、火因分类、燃烧时间分布和火险天气数据。基于物候观测(中国科学院地理研究所,1988a;1988b;1989a;1989b)确定春季(03-01-05-31)、夏季(06-01-08-31)和秋季(09-01-10-31)。1987-2010年过火面积≥100 hm2的火灾占总过火面积的99.8%,因此,定义过火面积≥100 hm2的火为跑火。跑火频次和蔓延天数概率分布也是根据林火统计数据确定。模拟的迭代次数为100,可以得到相对稳定的燃烧概率分布图。
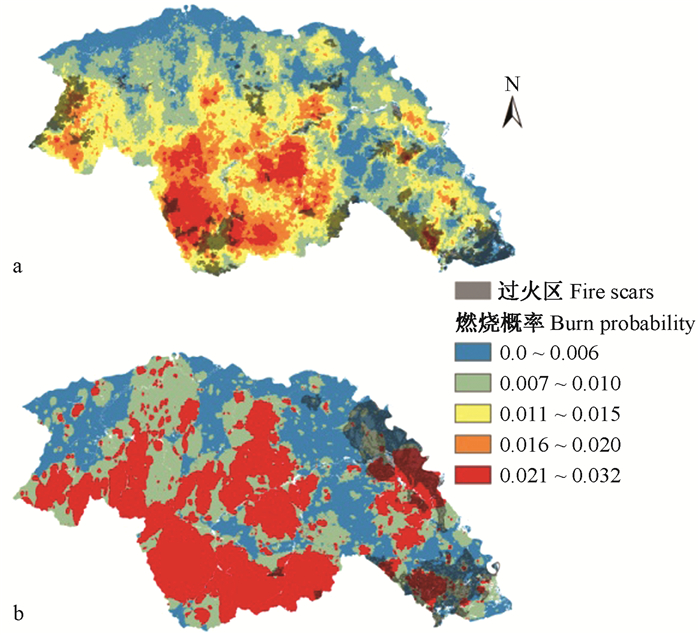
4 结果与分析 4.1 BURN-P3模型适用性评估利用历史地面观测数据模拟1991-2010年研究区的燃烧概率分布,对比分析燃烧概率与该阶段过火区的关系。1991-2010年研究区的火烧主要分布在大兴安岭中南部、西部和东部地区,总过火面积约102.54万hm2,其中2003年过火面积约64.28万hm2,占62.7%,2场大火都分布在研究区东部(图 2),因此,特别提出2003年进行单独分析。
|
图 2 1991-2010年模拟燃烧概率与过火区分布 Fig.2 The burn probability and the burned area map during 1991-2010 a.1991-2010(除2003年except for 2003); b.2003. |
1991-2010年研究区模拟平均燃烧概率为0.010 8(变动范围0~0.032 0),过火区(除2003年)平均燃烧概率为0.011 3。2003年研究区平均燃烧概率为0.014 2(变动范围0~0.0600),比20年平均值高31.5%。2003年发生了2起特大火灾,过火区平均值为0.013 8,也明显高于其他年份。1991-2010年火发生位置的平均燃烧概率为0.012 45,高于研究区的平均值(0.010 8),t检验结果表明差异显著(P=0.047)。
火灾主要发生在东部燃烧概率高的区域。1991-2010年落叶松林、常绿针叶林、典型草地、落叶阔叶林等可燃物类型的燃烧概率平均值分别为0.013 4,0.010 6,0.010 7和0.005 8,落叶松林、常绿针叶林和典型草地的燃烧概率高于总体平均值,这符合研究区的林火发生规律。
森林火灾发生不但受森林燃烧性的影响,还与火源、火灾发生时段的森林火险密切相关,因此,实际情况下森林燃烧概率分布与过火区分布不可能存在完全对应关系,特别是在认为干扰强度大的大兴安岭地区,人为火源分布、森林火灾的预防和扑救措施等都对林火的发生和发展有很大影响。整体而言,BURN-P3的模拟结果基本反映了研究区的森林燃烧状况。
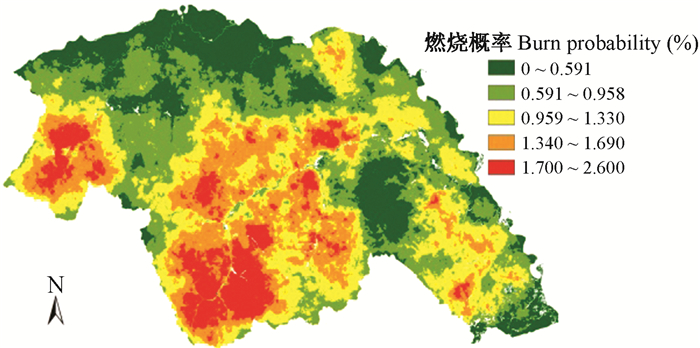
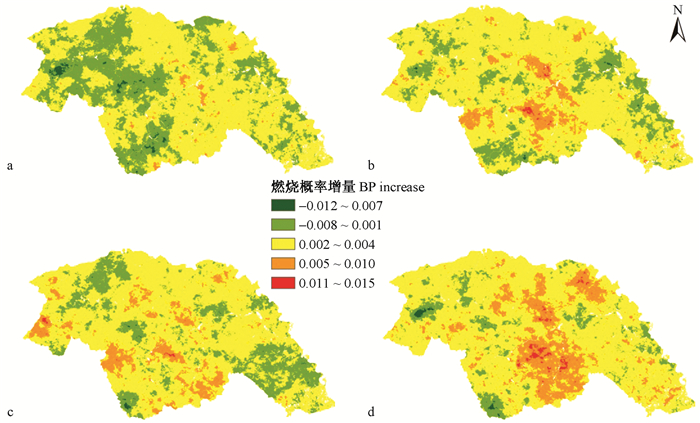
4.2 2021-2050年森林燃烧概率变化在基准时段(1971-2000),研究区平均燃烧概率为0.010 1(变化范围0~0.026 0),中南部和西南部燃烧概率高(图 3)。与基准时段相比,2021-2050年RCP2.6情景下的研究区平均燃烧概率降低6.21%,其中燃烧概率升高区域占37.83%,主要分布在中南部。RCP4.5、RCP6.0和RCP8.5情景下的研究区平均燃烧概率分别增加7.71%,7.8%和19.84%,其中燃烧概率升高的区域分别占57.69%,58.03%和75.46%,中部区域的燃烧概率增幅明显(图 4)。落叶松林是研究区历史上过火面积最多的可燃物类型,该类型在RCP2.6、RCP4.5、RCP6.0和RCP8.5情境下高和极高燃烧概率的区域分别增加-3.19%,4.42%,7.93%和12.32%。
|
图 3 基准时段平均燃烧概率 Fig.3 Burn probability for baseline |
|
图 4 4种气候情景下2021-2050年燃烧概率变化 Fig.4 The increase of average burn probability for four scenarios in 2021-2050 a. RCP2.6气候情景RCP2.6 scenario;b. RCP4.5气候情景RCP4.5 scenario;c.RCP6.0气候情景RCP6.0 scenario;d.RCP8.5气候情景RCP8.5 scenario. |
与基准时段相比,2021-2050年RCP2.6和RCP6.0情景下平均火烧强度分别降低20.7%和4.9%,但仍有28.10%和48.54%的区域火强度升高。RCP4.5和RCP8.5情境下平均火烧强度分别增加6.9%和2.3%,火强度升高的区域分别占58.4%和57.4%。南部区域的火烧强度增幅更大(图 5)。

|
图 5 4种气候情景下2021-2050年火烧强度变化 Fig.5 The increase of fire intensity for four scenarios in 2021-2050 a. RCP2.6气候情景RCP2.6 scenario;b.RCP4.5气候情景RCP4.5 scenario;c.RCP6.0气候情景RCP6.0 scenario;d.RCP8.5气候情景RCP8.5 scenario. |
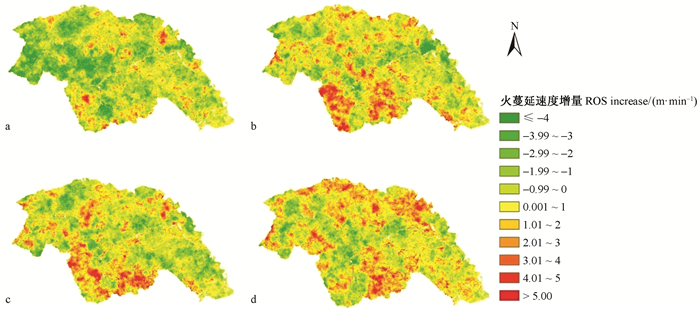
RCP2.6、RCP4.5、RCP6.0和RCP8.5情景下的研究区平均火蔓延速度分别增加-13.0%,4.4%,1.5%和8.0%,其中火蔓延速度增加的区域分别占32.2%,54.7%,49.5%和60.1%(图 6)。RCP4.5和RCP6.0气候情景下南部区域增幅明显,而RCP8.5气候情景下东南部和北部区域增加显著。
|
图 6 4种气候情景下2021-2050年火蔓延速度变化 Fig.6 The increase of flame front rate of spread for four scenarios in 2021-2050 a.RCP2.6气候情景RCP2.6 scenario;b.RCP4.5气候情景RCP4.5 scenario;c.RCP6.0气候情景RCP6.0 scenario;d.RCP8.5气候情景RCP8.5 scenario. |
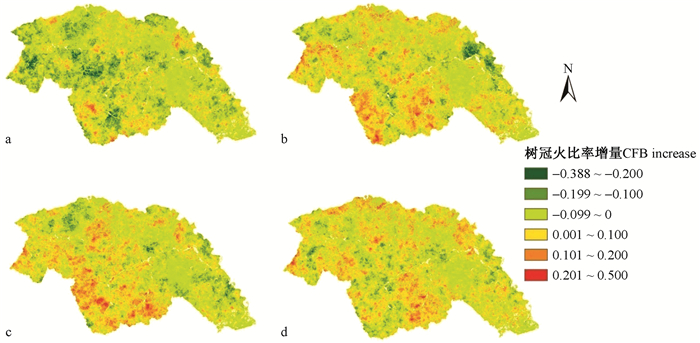
RCP2.6、RCP4.5、RCP6.0和RCP8.5情景下树冠火比例分别增加-12.7%,4.2%,5.0%和4.7%,其中树冠火增多的区域分别占25.4%,44.0%,43.2%和44.5%。RCP4.5和RCP6.0情景下中部和西部树冠火增多比较显著(图 7)。
|
图 7 4种气候情景下2021-2050年树冠火比率变化 Fig.7 The increase of crown fraction burned for four scenarios in 2021-2050 a.RCP2.6气候情景RCP2.6 scenario;b.RCP4.5气候情景RCP4.5 scenario;c.RCP6.0气候情景RCP6.0 scenario;d.RCP8.5气候情景RCP8.5 scenario. |
基准时段BURN-P3模拟的雷击火占52.25%,人为火占47.75%。春季和夏季雷击火发生次数均大于人为火,而秋季雷击火比例低于人为火。春、夏和秋季火发生次数分别占44.91%,27.72%和27.37%。模拟火蔓延天数为1~11天,其中蔓延1~7天的概率为83.75%。模拟的火发生密度、火烧蔓延时间、跑火次数和蔓延天数都接近历史统计值。年均过火面积和火险期平均火险指数存在显著相关关系(P < 0.01),尤其与ISI和FWI相关性更强,相关系数分别为0.783 0和0.783 2。这与Tian等(2013)对1987-2010年火险指数与过火面积的结论近似,也证明Burn-P3模型对于研究区的燃烧概率模拟比较可靠。
过去的研究也都认为该区域的森林火险在今后会有一定程度的增加(杨光等,2012;Tian et al., 2011;Liu et al., 2012),但这些研究都是采用SEARS情景。杨光等(2012)也是采用HadCM3模式模拟的A2a和B2a气候情景数据,认为高和很高的火险日数增加明显。Tian等(2011)预测2071-2100年中国东北地区潜在火灾可能增加10%~18%,这与本文RCP8.5的情景类似。但这些研究都是基于火险天气指数对未来情景的预测,而本文是基于不同情景下的模拟天气数据对研究区每日的火发生与蔓延进行模拟,采用的研究方法和指标都不相同。Liu等(2012)对中国东北的寒带森林在2081-2100时段的火发生密度模拟结果表明,不同气候情景之间差异很大,CGCM3 B1情景下火发生密度增加30%,而HadCM3 A2情景下降增加230%。该研究主要是模拟未来气候情景下的火发生,且采用的模拟时段、气候情景、全球气候模型和火干扰模型等与本文都不相同,也没有模拟火行为的变化。
本研究只用HadGEM2-ES一个气候模式的数据进行了模拟,今后需采用更多的气候模型数据进行模拟分析,增加燃烧概率模拟的可靠性。本文对未来的林火动态模拟没有考虑可燃物、林火管理能力和火源的变化。考虑到研究区已采取了严格的林火管理措施,未来30年这些因子可能不会发生根本性变化,可以认为这些因子对林火活动的作用不会影响结论的整体可靠性。
6 结论BURN-P3模型的模拟结果可较好地反映大兴安岭地区的森林燃烧概率状况。与基准时段相比,2021-2050时段RCP2.6气候情景下平均燃烧概率有所降低,RCP4.5、RCP6.0和RCP8.5气候情景下的燃烧概率将增加7.7%~19.5%, 火烧强度、蔓延速度和树冠火比率都呈现小幅增加。中南部的火活动明显增强,不同气候情景之间有所差异。
| [] |
邸雪颖, 李永福, 孙建, 等. 2011. 黑龙江省大兴安岭地区塔河县森林火险天气指标动态. 应用生态学报 , 22 (5) : 1240–1246.
( Di X Y, Li Y F, Sun J, et al.2011. Dynamics of forest fire weather indices in Tahe County of Great Xing'an Mountains region, Heilongjiang Province. Chinese Journal of Applied Ecology , 22 (5) : 1240–1246. [in Chinese] ) |
| [] |
田晓瑞, 舒立福, 赵凤君, 等. 2012. 未来情景下西南地区森林火险变化. 林业科学 , 48 (1) : 121–125.
( Tian X R, Shu L F, Zhao F J, et al.2012. Forest fire danger changes for southwest China under future scenarios. Scientia Silvae Sinicae , 48 (1) : 121–125. [in Chinese] ) |
| [] |
徐化成. 1998. 中国大兴安岭森林. 北京: 科学出版社 .
( Xu H C. 1998. The forest of Daxing'anling. Beijing: Science Press . [in Chinese] ) |
| [] |
杨光, 舒立福, 邸雪颖. 2012. 气候变化影响下大兴安岭地区21世纪森林火险等级变化预测. 应用生态学报 , 23 (12) : 3236–3242.
( Yang G, Shu L F, Di X Y.2012. Prediction on the changes of forest fire danger rating in Great Xing'an Mountain region of Northeast China in the 21st century under effects of climate change. Chinese Journal of Applied Ecology , 23 (12) : 3236–3242. [in Chinese] ) |
| [] |
赵凤君, 舒立福, 田晓瑞, 等. 2009. 气候变暖背景下内蒙古大兴安岭林区森林可燃物干燥状况的变化. 生态学报 , 29 (4) : 1914–1920.
( Zhao F J, Shu L F, Tian X R, et al.2009. The changes of forest fuel dryness conditions under global warming in Inner Mongolia Daxing'anling forest region. Acta Ecologica Sinica , 29 (4) : 1914–1920. [in Chinese] ) |
| [] |
中国科学院地理研究所. 1989a. 中国动植物物候观测年报第9号. 北京: 地质出版社 .
( Institute of Geographical Sciences and Natural Resources Research, CAS. 1989a. Annuals of observation on plants and animals in China(9). Beijing: Geological Publishing House . [in Chinese] ) |
| [] |
中国科学院地理研究所. 1989b. 中国动植物物候观测年报第10号. 北京: 地质出版社 .
( Institute of Geographical Sciences and Natural Resources Research, CAS. 1989b. Annuals of observation on plants and animals in China(10). Beijing: Geological Publishing House . [in Chinese] ) |
| [] |
中国科学院地理研究所. 1988a. 中国动植物物候观测年报第7号. 北京: 地质出版社 .
( Institute of Geographical Sciences and Natural Resources Research, CAS. 1988a. Annuals of observation on plants and animals in China(7). Beijing: Geological Publishing House . [in Chinese] ) |
| [] |
中国科学院地理研究所. 1988b. 中国动植物物候观测年报第8号. 北京: 地质出版社 .
( Institute of Geographical Sciences and Natural Resources Research, CAS. 1988b. Annuals of observation on plants and animals in China(8). Beijing: Geological Publishing House . [in Chinese] ) |
| [] |
中国科学院地理研究所. 1992. 中国动植物物候观测年报第11号. 北京: 中国科学技术出版社 .
( Institute of Geographical Sciences and Natural Resources Research, CAS. 1992. Annuals of observation on plants and animals in China(11). Beijing:Science and Technology of China Press. . [in Chinese] ) |
| [] | Carvalho A, Flannigan M D, Logan K A, et al.2010. The impact of spatial resolution on area burned and fire occurrence projections in Portugal under climate change. Climate Change , 98 (1/2) : 177–197. |
| [] | Cary G J, Flannigan M D, Keane R E, et al.2009. Relative importance of fuel management, ignition management and weather for area burned:evidence from five landscape-fire-succession models. International Journal of Wildland Fire , 18 (2) : 147–156. DOI:10.1071/WF07085 |
| [] | De Groot W J, Flannigan M D, Cantin A S.2012. Climate change impacts on future boreal fire regimes. Forest Ecology and Management , 294 (2013) : 35–44. |
| [] | Flannigan M, Stocks B, Turetsky M, et al.2009. Impact of climate change on fire activity and fire management in the circumboreal forest. Global Change Biology , 15 (3) : 549–560. DOI:10.1111/gcb.2009.15.issue-3 |
| [] | Forthofer J M, Shannon K, Butler B W.2010. Initialization of high resolution surface wind simulations using NWS gridded data. Proceedings of 3rd Fire Behavior and Fuels Conference, Spokane, Washington, USA : 25–29. |
| [] | Gustafson E J, Zollner P A, Sturtevant B R, et al.2004. Influence of forest management alternatives and land type on susceptibility to fire in northern Wisconsin, USA. Landscape Ecology , 19 (3) : 327–341. DOI:10.1023/B:LAND.0000030431.12912.7f |
| [] | Hargrove W W, Gardner R H, Turner M G, et al.2000. Simulating fire patterns in heterogeneous landscapes. Ecological Modeling , 135 (2) : 243–263. |
| [] | Hay L E, Wilby R L, Leavesley G H.2000. A comparison of Delta change and downscaled GCM scenarios for three mountainous basins in the United States. Journal of the American Water Resources Association , 36 (2) : 387–397. DOI:10.1111/jawr.2000.36.issue-2 |
| [] | Kloster S, Mahowald N M, Randerson J T, et al.2012. The impacts of climate, land use, and demography on fires during the 21st century simulated by CLM-CN. Biogeosciences , 9 (1) : 509–525. DOI:10.5194/bg-9-509-2012 |
| [] | Liu Z H, Yang J, Chang Y, et al.2012. Spatial patterns and drivers of fire occurrence and its future trend under climate change in a boreal forest of Northeast China. Global Change Biology , 18 (6) : 2041–2056. DOI:10.1111/gcb.2012.18.issue-6 |
| [] | Miller N L, Schlegel N J.2006. Climate change projected fire weather sensitivity:California Santa Ana wind occurrence. Geophysical Research Letters , 33 (15) : L15711. DOI:10.1029/2006GL025808 |
| [] | Moriondo M, Good P, Durao R, et al.2006. Potential impact of climate change on fire risk in the Mediterranean area. Climate Research , 31 (1) : 85–95. |
| [] | Parisien M A, Kafka V G, Hirsch K G, et al. 2005. Mapping wildfire susceptibility with the BURN-P3 simulation model. http://www.cfs.nrcan.gc.ca/bookstore_pdfs/25627.pdf. |
| [] | Running S W.2006. Climate change:Is global warming causing more larger wildfires. Science , 313 (5789) : 927–928. DOI:10.1126/science.1130370 |
| [] | Scott J H, Reinhardt E D.2001. Assessing crown fire potential by linking models of surface and crown fire behavior. US Department of Agriculture, Forest Service, Rocky Mountain Research Station : 6–34. |
| [] | Spracklen D V, Mickley L J, Logan J A, et al.2009. Impacts of climate change from 2000 to 2050 on wildfire activity and carbonaceous aerosol concentrations in the western United States. Journal of Geophysical Research , 114 (D20) : D20301. DOI:10.1029/2008JD010966 |
| [] | Stephens S L, Moghaddas J J.2005. Experimental fuel treatment impacts on forest structure, potential fire behavior, and predicted tree mortality in a California mixed conifer forest. Forest Ecology and Management , 215 (1) : 21–36. |
| [] | Tian X R, Shu L F, Zhao F J, et al.2011. Future impacts of climate change on forest fire danger in northeastern China. Journal of Forestry Research , 22 (3) : 437–446. DOI:10.1007/s11676-011-0185-5 |
| [] | Tian X R, Shu L F, Wang M Y, et al.2013. The fire danger and fire regime for the Daxing'anling region for 1987-2010. Procedia Engineering , 62 : 1023–1031. DOI:10.1016/j.proeng.2013.08.157 |
| [] | Van Vuuren D P, Edmonds J, Kainuma M, et al.2011. The representative concentration pathways:an overview. Climatic Change , 109 (1/2) : 5–31. |
| [] | Van Wagner C E, Forest P.1987. Development and structure of the canadian forest fire weather index system. Ottawa:Canadian Forest Service, Forest Technical Report , 35 : 1–36. |
| [] | Westerling A L, Hidalgo H G, Cayan D R, et al.2006. Warming and earlier spring increase western U. S. forest wildfire activity.Science , 313 (5789) : 940–943. |
| [] | Whitlock C, Higuera P E, McWethy D B, et al.2010. Paleoecological perspectives on fire ecology:revisiting the fire-regime concept. The Open Ecology Journal , 3 (1) : 6–23. |
| [] | Wotton B M, Nock C A, Flannigan M D.2010. Forest fire occurrence and climate change in Canada. International Journal of Wildland Fire , 19 (3) : 253–271. DOI:10.1071/WF09002 |
 2016, Vol. 52

