文章信息
- 杨博文, 陈鹏宇, 金森
- Yang Bowen, Chen Pengyu, Jin Sen
- 帽儿山两林分气温与地表可燃物温度差异及对可燃物含水率预测的影响
- Differences of Air Temperature and Fuel Surface Temperature in Two Stands in Maoershan Forest Farm and Their Effects on Fuel Moisture Modelling
- 林业科学, 2015, 51(7): 91-98
- Scientia Silvae Sinicae, 2015, 51(7): 91-98.
- DOI: 10.11707/j.1001-7488.20150710
-
文章历史
- 收稿日期:2014-12-30
- 修回日期:2015-04-14
-
作者相关文章
森林可燃物含水率,特别是地表细小死可燃物含水率是影响林火发生及林火蔓延的重要因素之一(Trevitt,1991),也是火险预报的重要内容,提高地表死可燃物含水率预测的准确性对预测林火的发生以及火灾的扑救防范工作有着重大意义(郑焕能,1992; Matthews et al., 2006)。温度是影响地表死可燃物含水率的重要因素,也是含水率预报中常用的预测因子。纯统计预测方法一般采用距地表 1.5 m处的气温作为预报因子,而物理和半物理预测方法多采用地表可燃物温度作为预测因子(Viney et al., 1989;Vinney,1991; 金森等,1999; Catchpole et al., 2001; Matthews et al., 2007)。一般来说,地表死可燃物温度要比气温更能准确衡量影响其含水率变化的热量条件,用该温度建模更符合物理原理并具有较高的精度(Matthews,2006; Matthews et al., 2010)。Catchpole等(2001)提出利用野外数据直接估测可燃物含水率的方法(以下简称直接估计法),该方法基于一种半物理的平衡含水率模型,采用地表可燃物温度和湿度作为预测因子,方便快捷,精度较高(金森等,2010);但直接测量地表可燃物温度的气象站很少,在使用直接估计法时,往往需要将气温转换为地表可燃物温度(Catchpole et al., 2001)。目前常用的气温-可燃物温度转换模型(以下简称温度转换模型)有 Byram & Jemison(以下简称B模型)和Van Wagner(以下简称V模型)。这2个模型是统计型模型,对于不同地区的适用性不同。 因此本文对不同地区地表可燃物温度与气温的差异、 温度转换模型在不同地区的适用性以及应用气温和地表可燃物温度分别驱动直接估计法模型的误差进行研究,为提高可燃物含水率预测精度提供参考。
1 研究区概况与研究方法 1.1 研究区概况研究区位于东北林业大学帽儿山试验林场,地理位置45°20′—45°25′ N,127°30′—127°34′ N,属温带大陆性气候,年平均气温2.8 ℃,1月份最冷,月平均气温-18~-23 ℃,7月份最热,月平均气温21~22 ℃。年降水量723.8 mm,集中在6—8月。年蒸发量1 093.9 mm,干燥度0.7。≥10 ℃积温2 530.1 ℃,无霜期120 天左右。最长积雪覆盖152天,结冻初日在9月下旬、终日在5月上旬,冻土深度150 cm。原生植被以红松(Pinus koraiensis)为主,目前主要是原生植被大量破坏后形成的天然次生林。乔木有红松、日本落叶松(Larix kaempferi)、白桦(Betula platyphylla)、山杨(Populus davidiana)、蒙古栎(Quercus mongolica)、黄波罗(Phellodendron amurense)、胡桃楸(Juglans m and shurica)等,平均胸径10~50 cm;灌丛有茶镳子(Ribes nigrum)、珍珠梅(Sorbaria sorbifolia)、 胡枝子(Lespedeza bicolor)、紫丁香(Syringa oblata)、刺五加(Acanthopanax senticosus)等。
1.2 相关模型介绍Byram & Jemison模型(Byram,1963)表示如下:
| ${{T}_{\text{f}}}={{T}_{a}}+\frac{K}{42.5{{U}_{\text{f}}}+32.7{}^\circ }$ | (1) |
Van Wagner模型(Van Wagner,1969)表示如下:
| ${{T}_{\text{f}}}={{T}_{\text{a}}}+aK{{e}^{-0.004{{U}_{\text{f}}}}}$ | (2) |
含水率预测模型采用Catchpole等(2001)提出的利用野外数据直接估计可燃物含水率的模型,表示如下:
| $m\left({{t}_{i}} \right)={{\lambda }^{2}}{{m}_{i-1}}+\lambda \left(1-\lambda \right){{q}_{i-1}}+\left(1-\lambda \right){{q}_{i}}$ | (3) |
| $\Delta t=t-{{t}_{i-1}}$ | (4) |
| $\lambda =\exp \left(-\frac{\Delta t}{2\tau } \right)$ | (5) |
| $q=a+b\lg \left(-\frac{RT}{M}\lg H \right)$ | (6) |
在研究区平地上选择红松和落叶松2个林分。 红松林平均胸径12.9 cm,平均树高13.0 m,郁闭度0.85;落叶松林平均胸径15.3 cm,平均树高15.9 m,郁闭度0.9。为研究地表可燃物温度与气温的差异及现有2种温度转换模型的误差,6月11—15日、6月18—19日和6月24—26日,在红松林下距地1,2,3,4 cm的地表可燃物上放置Watch Dog 400叶片温度测量记录仪的温度探头,每隔5 min记录1次。在其上部安装HOBO-U30便携式气象站,每隔5 min与地表可燃物温度同步测量1次距地表1.5 m 处的气温、空气湿度以及风速、太阳辐射。7月12日、7月15—18日,按红松林做法,在落叶松林分中测定距地1,2,3,4 cm的地表可燃物温度和距地表1.5 m 处的气温、空气湿度以及风速、太阳辐射。
为研究温度转换模型对以时为步长的可燃物含水率预测精度的影响,6月11日,在测定温度的红松林下设2个采样点,用18目尼龙网固定在塑料方筛内制成地表凋落物容器,顶部使用8 目尼龙网遮盖,以阻止其他凋落物落入其中。在保持凋落层原有结构的情况下,采集大小一致的地表凋落层样品,放入方筛后使用精度为0.01 g 的电子天平称质量,减去容器质量后得到样品湿质量。将样品置于原取样处,保持破坏前的地表状况,每间隔1 h 记录1 次样品质量,连续24 h测量。结束后将样品装于封口袋置于105 ℃烘箱中持续烘干24 h至恒质量并称量,计算可燃物含水率。此时,用距地表可燃物顶部1 cm处的可燃物温度来表征方筛内可燃物表面温度。
7月12日,在落叶松林下设2个采样点,与红松林做法相同,测定每隔1 h的可燃物含水率。
1.4 数据处理与分析绘制观测时段地表可燃物温度与气温的时间动态曲线,分析二者的差异。为便于比较分析温度转换对可燃物含水率预测精度的影响,将测量可燃物含水率的6月11日和7月12日的数据与其他时段数据分别绘制。
对于测定可燃物含水率的日期和全部观测日期,根据实测的气温、辐射和风速,分别用2个温度转换模型计算不同高度处的可燃物温度,其中,V模型中的a采用松林的0.035 m2·W-1,然后按式(7)计算温度转换模型的误差,误差大于二者差异的均值(3 ℃)则不适用:
| $\text{RMSE=}\sqrt{\sum\limits_{i=1}^{n}{\frac{{{\left({{m}_{i}}-{{{\hat{m}}}_{i}} \right)}^{2}}}{n}}}$ | (7) |
按式(8)计算可燃物含水率:
| $m=\left({{W}_{\text{h}}}-{{W}_{\text{d}}} \right)/{{W}_{d}}\times 100%$ | (8) |
分别采用下列方式对直接估计法模型进行参数估计:
1)采用气温作为温度变量。
2)分别采用根据2个温度转换模型计算出来的地表可燃物温度(1 cm处,下同)作为温度变量(该方法是目前的常用做法)。
3)采用实测的地表可燃物温度作为温度变量。
按式(7)计算可燃物含水率预测误差并比较采用不同温度数据时可燃物含水率预测的误差。
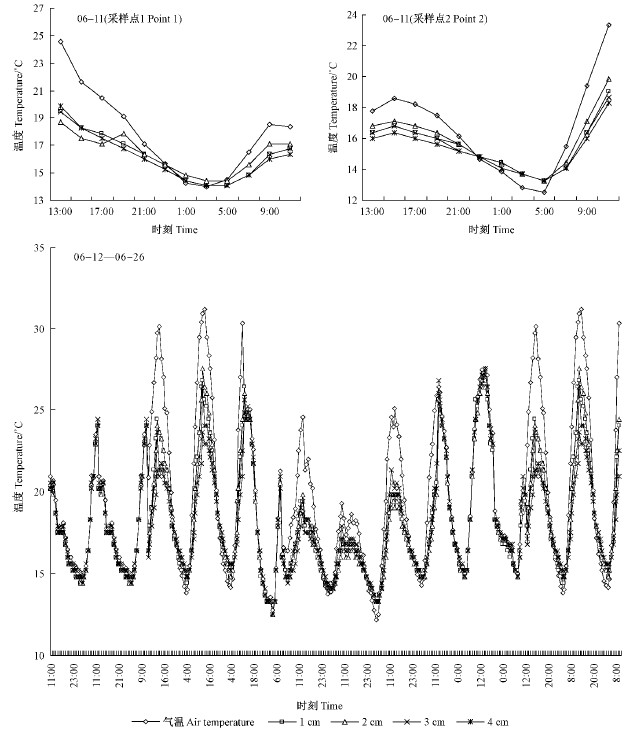
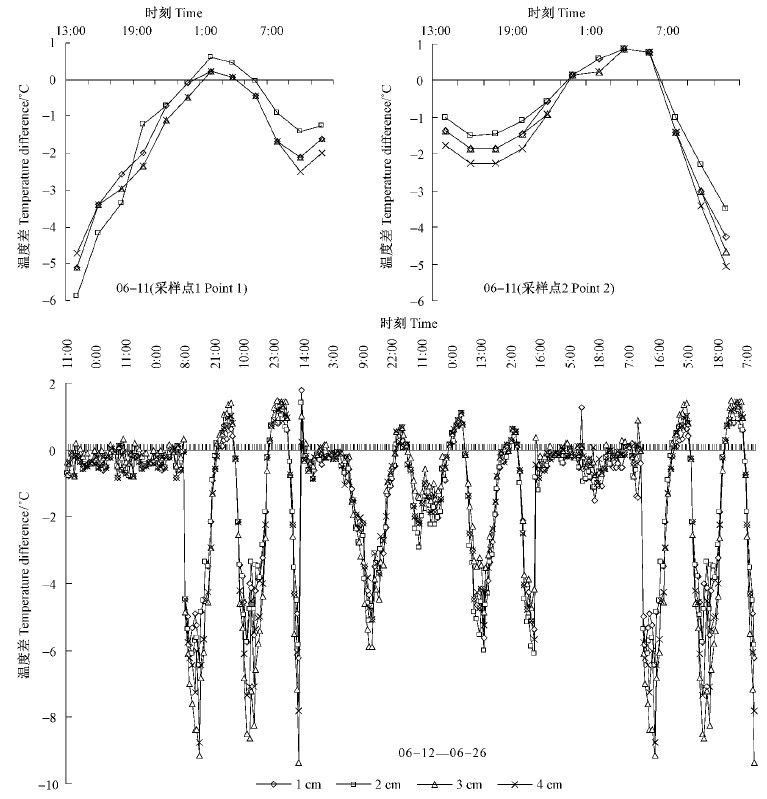
2 结果与分析 2.1 地表可燃物温度与气温的比较图 1和图 2给出了红松林中6月11日2个采样点及6月12 —26日9天的距地表1~4cm处可燃物温度和距地表1.5 m处气温的动态和差异。从图中可见,10天的观测中,多数时候距地表1~4 cm处可燃物温度与距地表1.5 m处气温差异很大,只有2天地表可燃物温度和气温的差异较小。白天地表可燃物温度低于气温,二者的差在中午附近某一时刻(时刻1)达到最大,然后开始变小,到晚上某时刻(时刻2)二者相同,而后地表可燃物温度超过气温,在午夜左右(时刻3)前者超过后者最大,此后二者的差异开始变小,到早晨7点左右二者相等,然后地表可燃物温度又开始低于气温。不同林分,时刻1,2,3出现的时间不同。时刻1出现在10:00—11:00,此时气温要高于地表可燃物温度 4~9 ℃; 对于红松林,时刻2出现在 19:00—20:00,时刻3时可燃物温度超过气温1 ℃以上。距地表1~4 cm的可燃物温度差异不显著。
 |
图 1 红松林不同高度地表可燃物温度与1.5 m处气温的比较 Fig. 1 Comparison of fuel temperatures and air temperature at 1.5 m height in korean pine stand |
 |
图 2 红松林不同高度地表可燃物温度与1.5 m处气温的差 Fig. 2 Difference of fuel temperatures at different height and air temperature at 1.5 m height in korean pinestand |
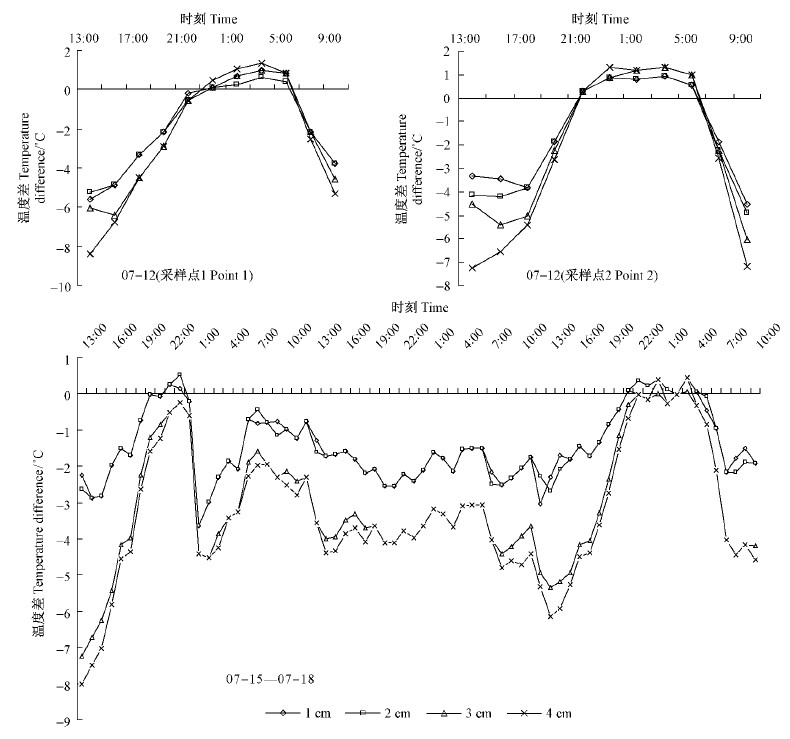
图 3和图 4给出了落叶松林中7月12日2个采样点及7月15—18日的距地表 1~4 cm处可燃物温度和1.5 m处气温的动态和差异。从图中可见,地表可燃物温度与气温的关系与红松林相似,但落叶松时刻2出现在21:00左右,较红松林略晚。
 |
图 3 落叶松林不同高度地表可燃物温度与1.5 m处气温的比较 Fig. 3 Comparison of fuel temperatures and air temperature at 1.5 m height in larch stand |
 |
图 4 落叶松林不同高度地表可燃物温度与1.5 m处气温的差 Fig. 4 Difference of fuel temperatures and air temperature at 1.5 m height in larch stand |
表 1给出了用现有2个温度转换模型计算的地表可燃物温度和实测地表可燃物温度之间的误差。从表中可见,2个温度转换模型在红松林地表可燃物温度的误差在3~4 ℃,在落叶松林地表可燃物温度的误差在4~6 ℃,且误差都随着距地表高度的增加而增加,V模型的误差大于B模型。事实上,从这2个模型的公式[式(1)和式(2)]上看,附加项为正,计算的地表可燃物温度要超过气温。从2.1节中可以看出,地表可燃物温度在某一时段高于气温,在其他时段低于气温,2个温度转换模型不能够反映出气温和地表可燃物温度在白天和夜间差异的不同方向性,这是现有2个模型误差大的主要原因。结合2个模型的最小误差都超过了3 ℃,尤其是在白天,火险最高的时段(中午附近),实测气温都高于地表可燃物温度,而此时用这2个模型计算地表可燃物温度,误差将最大,因此,现有2个温度转换模型都不适用于本地的可燃物含水率预报。
|
|
表 2给出了以气温、模型B计算的地表可燃物温度、模型V计算的地表可燃物温度、实测的地表可燃物温度为温度变量建立的可燃物含水率直接估计法模型的参数。从表中可见,用气温作为温度变量的可燃物含水率直接估计法模型与用计算的地表可燃物温度作为温度变量的可燃物含水率直接估计法模型的估计参数比较接近,而这3个模型的参数与用实测地表可燃物温度的可燃物含水率直接估计法模型的参数差别较大。表 3给出了这4个可燃物含水率直接估计法模型的含水率预测误差。 从表 3可以看出,模型间的误差差异与估计参数具有相似的模式,对于同一林分,用气温作为温度变量的可燃物含水率直接估计法模型,与用计算的地表可燃物温度作为温度变量的可燃物含水率直接估计法模型的误差差异很小,而与用实测地表可燃物温度的可燃物含水率直接估计法模型差异较大。这主要是由于本研究以小时(h)为采样间隔,包括白天和夜间的数据,很多时候向下的阳光辐射 K值为零或很小,从式(1)和(2)得到的地表可燃物温度与气温相差不大,因此,用气温和计算所得的地表可燃物温度所建模型的建模数据有很大的相似性,而与实测的地表可燃物温度数据差别较大。对于误差而言,红松林前3个可燃物含水率直接估计法模型的误差小于实测地表可燃物温度的可燃物含水率直接估计法模型,落叶松林恰好相反,这表明对于不同林型,采用气温或地表可燃物温度建立可燃物含水率直接估计法模型优劣不同。
|
|
含水率直接估计法模型的误差 Tab.3 Errors of fuel moisture prediction models
by direct estimation methods using different temperature data
|
|
一天中不同时段气温与地表不同高度可燃物温度存在着差异,白天地表可燃物温度低于气温; 夜间地表可燃物温度高于气温,这与森林内外温度的差异(陈宏志等,2007)具有一定的相似性。现有的2个可燃物温度转换模型所计算的地表可燃物温度都高于气温,误差很大,不适合用于计算地表可燃物的温度。
用气温和用现有的2个温度转换模型计算的地表可燃物温度建立的以时为步长的可燃物含水率直接预测模型的参数和误差比较相似,而与用实测地表可燃物温度建立的含水率预测模型的参数和误差差异较大,红松林前者误差小,落叶松林前者误差大。这说明,在采用以时为步长的直接估计法进行可燃物含水率预测时,以往文献中(Catchpole et al., 2001)利用现有的温度转换模型从气温计算可燃物温度后再建模的方法,与直接用气温建模的方法效果一样,因此,直接利用气温建模即可,无需再进行气温到地表可燃物温度的转换。而用地表可燃物温度建模和用气温建模是有差异的,但目前还无法判断哪个方法更优,需进一步研究。
本研究没有进行长期连续观测,且在低风速情况下,因此无法反映气温与地表可燃物温度差异的全部情况。在将温度转换模型用于可燃物含水率预测时,只使用了2个24 h的数据,相当于48个数据。Catchpole等(2001)提出此方法时所用的数据为36个,本研究的数据长度与其相似。重要的是,本研究作为一个反证,足以证实现有温度转换模型不适于以时为步长的可燃物含水率的直接预测法;但对温度转换模型的全面评价,如这2个模型在其他气象条件下应用的误差情况、是否可用于除直接估计法之外的其他可燃物含水率预测方法仍需进一步研究。
此外,由于可燃物含水率的变化情况直接受地表可燃物温度影响,而目前无法判断利用气温建模或地表可燃物温度建模的优劣性,所以研究新的可燃物温度模型,特别是能够反映气温和可燃物温度差异日变化的转换模型,将是未来研究的任务。
| [1] |
陈宏志,胡庭兴,龚 伟,等.2007.我国森林小气候的研究现状.四川林业科技,28(2): 29-83. (Chen H Z, Hu T X, Gong W, et al. 2007. An advance in research on forest microclimate in China. Journal of Sichuan Forestry Science and Technology,28(2): 29-83[in Chinese]).(  1) 1)
|
| [2] |
金森, 姜文娟, 孙玉英. 1999. 用时滞和平衡含水率准确预测可燃物含水率的理论算法. 森林防火, (4): 12-14. (Jin S, Jiang W J, Sun Y Y. 1999.Theoretical algorithm for predicting fuel moisture using timelag and equilibrium moisture content.Forest Fire Prevention, (4): 12-14[in Chinese]).(  1) 1)
|
| [3] |
金森, 李 亮. 2010. 时滞和平衡含水率直接估计法的有效性分析. 林业科学, 46(2): 95-102. (Jin S, Li L. 2010.Validation of the method for direct estimation of timelag and equilibrium moisture content of forest fuel.Scientia Silvae Sinicae, 46(2): 95-102[in Chinese]).(  1) 1)
|
| [4] |
郑焕能. 1992. 森林防火. 哈尔滨: 东北林业大学出版社 (Zheng H N. 1992.Forest Fire Prevention. Harbin: Northeast Forestry University Press.[in Chinese])(  1) 1)
|
| [5] |
Byram G B.1963. An analysis of the drying process in forest fuel material. USDA Forest Service, Southern Forest Fire Laboratory, Macon, GA, USA.( 1) 1)
|
| [6] |
Catchpole E A, Catchpole W R, Viney N R. 2001. Estimating fuel response time and predicting fuel moisture content from field data. International Journal of Wildl and Fire, 10:215-222.( 6) 6)
|
| [7] |
Matthews S, Gould J, McCaw L.2010. Simple models for predicting dead fuel moisture in eucalyptus forests.International Journal of Wildland Fire, 19: 459-467.( 1) 1)
|
| [8] |
Matthews S, McCaw W L. 2006. A next-generation fuel moisture model for fire behavior prediction. Forest Ecology and Management, 264(supp.):s91.( 2) 2)
|
| [9] |
Matthews S, McCaw W L, Neal J E, et al. 2007. Testing aprocess-based fine fuel moisture model in two forest types. Can J For Res, 37: 23-35.( 1) 1)
|
| [10] |
Matthews S. 2006. A process-based model of fine fuel moisture. International Journal of Wildland Fire, 15(2): 155-168.( 2) 2)
|
| [11] |
Trevitt A C F. 1991. Weather parameters and fuel moisture content: standards for fire model inputs//Cheney N P, Gill A M. Proceedings of the Conference on Bushfire Modelling and Fire Danger Rating Systems,CSIRO Division of Forestry: Yarralumla, Australia.( 1) 1)
|
| [12] |
Van Wagner C E. 1969. Drying rates of some fine forest fuels. Fire Control Notes, 30(4): 5-12.( 1) 1)
|
| [13] |
Viney N R, Hatton T J. 1989. Assessment of existing fine fuel moisture models applied to eucalyptus litter. Australian Forestry, 52: 82-93.( 1) 1)
|
| [14] |
Viney N R. 1991. A review of fine fuel moisture modeling. International of Wildland Fire, 1(4): 215-234.( 1) 1)
|
 2015, Vol. 51

