文章信息
- 胡昳恒, 党萌, 张甜, 罗桂春, 夏海龙, 周惠娟, 呼东峰, 贺亮, 马振华, 赵鹏
- Hu Yiheng, Dang Meng, Zhang Tian, Luo Guichun, Xia Hailong, Zhou Huijuan, Hu Dongfeng, He Liang, Ma Zhenhua, Zhao Peng
- 秦岭地区核桃自然群体和栽培群体的遗传多样性及其演化关系——基于nrDNAITS序列分析
- Genetic Diversity and Evolutionary Relationship of Juglans regia Wild and Domesticated Populations in Qinling Mountains Based on nrDNA ITS Sequences
- 林业科学, 2014, 50(12): 47-55
- Scientia Silvae Sinicae, 2014, 50(12): 47-55.
- DOI: 10.11707/j.1001-7488.20141207
-
文章历史
- 收稿日期:2014-05-20
- 修回日期:2014-09-01
-
作者相关文章
2. 陕西省环境监测中心站 西安 710054;
3. 西安市环境监测站 西安 710054;
4. 国家林业局西北林业调查规划设计院 西安 710048
2. Shaanxi Environmental Monitoring Station Xi'an 710054;
3. Xi'an Environmental Monitoring Station Xi'an 710054;
4. Northwest Institute of Forest Inventory, Planning and Design, State Forestry Administration Xi'an 710048
核桃(Juglans regia),也称胡桃,隶属于胡桃科(Jugl and aceae)胡桃属(Juglans),植物体为二倍体(2n=32),雌雄同株异花,雄花序为下垂葇荑花序,雌花2~3朵簇生,属风媒植物(Hsu et al., 1994; Dandekar et al., 2005; 裴东等,2011)。该物种具有重要的经济价值,被列为世界四大坚果(榛子、核桃、杏仁、腰果)之一。大量研究表明,核桃果仁具有很高的抗氧化能力,且Omega-3脂肪酸和蛋白质等营养成分含量高,对人类健康非常有利(Ros et al., 2006; Damasceno et al., 2011; Vinson et al., 2012)。
我国为世界核桃的主产区,总产量居全球前列,栽培历史悠久(Beer et al., 2008; Joly et al., 2009)。随着人们对核桃的栽培和人工驯化,品种也越来越多(Pollegioni et al., 2011; Christopoulos et al., 2010),核桃种质资源保护面临着严峻的挑战。同时由于自然核桃蕴含着丰富的遗传资源,自然群体与栽培群体之间的基因流如何也需进一步了解。秦岭地区是我国核桃重要产区之一(裴东等,2011),该地区位于我国温带与亚热带之间的过渡地带,作为我国重要的生物地理分界线(赵桦等,2001; 王菁兰等,2010),在生态学、地理学、植物学等相关学科领域研究中占有重要地位(白红英等,2012)。目前,秦岭地区自然核桃与栽培核桃种质资源状况还不清楚,尤其从分子水平的研究未见报道,阻碍了该地区核桃种质资源的开发和利用。
近年来,国内外研究者采用不同的分子遗传标记(RAPD,RFLP,SSR,ISSR)对胡桃属植物亲缘关系(Pollegioni et al., 2009; Zhao et al., 2014)、系统发育和谱系地理(Stanford et al., 2000; Bai et al., 2010)、遗传多样性和遗传结构(Victory et al., 2006; 王滑等,2007; Zhao et al., 2012)、核桃栽培品种鉴定和基因流估计(Christopoulos et al., 2010; Zhao et al., 2011)以及个体之间遗传关系等方面(Malvolti et al., 1994; Ciarmiello et al., 2011; Zhao et al., 2013)进行了研究。核糖体DNA内转录间隔区(internal transcribed spacer,ITS)是核糖体DNA上的一个非编码区域。该区域包括3个部分: ITS1(位于18SrDNA和5.8SrDNA之间)、5.8SrDNA和ITS2(位于5.8SrDNA和28SrDNA之间)(Baldwin,1992)。在被子植物中,ITS序列长度在500~700 bp之间(Ciarmiello et al., 2011)。ITS序列在系统发育学(Chen et al., 2001; Potter et al., 2002; Li et al., 2011)物种鉴定和进化等研究(Zhao et al., 2011; Reddy et al., 2013; Bartha et al., 2013)中应用广泛。
本研究选取核糖体内转录区(ITS)序列,通过测序获得了秦岭地区核桃的19个自然群体和10个栽培群体的序列数据;进行了核苷酸多态性、遗传结构与核桃自然群体分子方差分析;估算了核桃自然与栽培群体的基因流,并构建了该地区核桃自然和栽培群体系统发育树,试图探讨秦岭地区栽培核桃与自然核桃之间的关系,分析秦岭核桃资源演化与地理位置间的关系。研究结果有助于了解该物种的遗传资源分布、预测种源适应性,亦对种质资源开发与利用以及杂交育种的亲本选配等有重要意义。
1 材料与方法 1.1 试验材料在2011—2013年对我国秦岭地区核桃资源全面考察的基础上,进行群体采样,共采集了18个野生自然群体(涵盖秦岭南北坡包含七十二峪核桃分布的地理范围)以及9个人工栽培群体(位于商洛、安康、宝鸡、汉中和西安5个地区)。另外,采集1个四川省峨眉山中峰寺核桃自然群体与1个黑龙江省核桃栽培群体作对照(图 1,表 1)。每个自然群体选择9~20个植株进行采样,相邻植株间隔50~100 m;栽培群体均选自集中种植的农地,每个群体选取5~23个植株采样,相邻植株间距为3~5 m。取核桃健康植株,采集当年生鲜嫩叶片2~3片,硅胶干燥后运回实验室备用。
|
|
 |
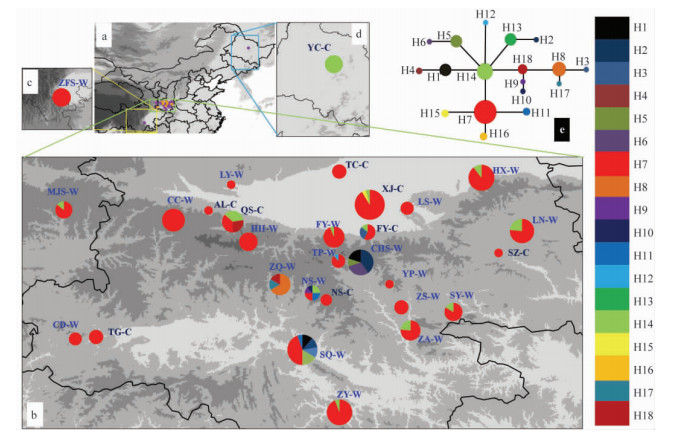
图 1 秦岭地区核桃群体ITS序列单倍型地理分布与单倍型网络
Fig. 1 Geographical distribution of ITS haplotypes and network of haplotype for 29 populations of Juglans regia
饼图代表各单倍型在该群体中的分布比例,标注框内不同颜色代表不同的ITS序列单倍型,圆圈的大小表示群体样品采集数量的多少。群体代号同表1,黑色表示核桃栽培群体、蓝色表示核桃自然群体。a为29个核桃群体采样分布图,b表示秦岭地区采样与单倍型分布放大图; c表示对照地区四川省中峰寺核桃采样地点与单倍型分布图; d表示对照地区黑龙江省伊春核桃采样地点与单倍型分布图; e表示单倍型网络拓扑结构图。 Different patterns were assigned for each haplotype according to the legend at the right side of the figure. Circumference size indicates that the number of each population. Population symbols are identified in Tab. 1. The black color of population names indicates that cultivated walnut population and the blue color of population names indicates that wild walnut population. ‘a’ indicates geographical distribution of 29 populations of J. regia; ‘b’ indicates that geographical distribution of ITS haplotypes for Qinling mountains; ‘c’ indicates that geographical distribution of ITS haplotypes for population of Sichuan province (ZFS); ‘d’ indicates that geographical distribution of ITS haplotypes for population of Heilongjiang province (YC); ‘e’ indicates that network of haplotype based on ITS data. |
基因组DNA的提取与分离参照Doyle等(1987)提出的CTAB法,并在此基础上进行了改良,具体详见Zhao等(2011)和赵鹏等(2012)。采用分光光度计和琼脂糖凝胶电泳检测基因组DNA的浓度和纯度。
1.2.2 ITS序列的PCR扩增、检测与测序核糖体内转录间隔区ITS的PCR扩增引物序列参考Zhao等(2011),由上海生物工程公司(Sangon Biotech Co.,Ltd.,Shanghai)合成(F: 5′-TCCTCCGCTTATTG ATATGC-3′;R: 5′-CCTGCGGGCGGGGACCTC -3′),2×Taq PCR Mix(20 mmol·L-1 Tris-HCl,pH8.3,0.1 U Taq polymerase,500 μL dNTPs,3 mmol·L-1 MgCl2,100 mmol·L-1 KCl以及其他稳定剂和增强剂)购自润德生物技术有限公司(RUNDE,西安),牛血清蛋白(Bovine Serum Albumin,BSA)购自Promega公司(Madison,Wisconsin,USA)。采用25 μL的PCR扩增反应体系,在Zhao等(2011)的基础上做了改进:模板DNA 2 μL(50 ng·μL-1),2×Taq PCR Mix 12.5 μL,正反向引物各1.0 μL(10 μmol·L-1),BSA(0.5 mg·mL-1)2.0 μL,H2O 6.5 μL。PCR扩增程序为: 94 ℃变性3 min;94 ℃变性15 s,50 ℃退火1 min,72 ℃延伸1.5 min,35个循环;72 ℃后延伸10 min,置4 ℃保存。
PCR扩增产物采用2.5%的琼脂糖凝胶电泳进行检测,溴化乙锭染色,凝胶成像仪(75312 Bad Wildbad,Germany)分析。检测后由上海生工生物工程有限公司进行测序。
1.3 数据分析对核桃359个个体的PCR扩增片段测序后,使用软件BioEdit v.7.0.9对测序结果进行排列、比对和校正(Hall,1999)。使用DnaSP 5.10.1软件(Librado et al., 2009)分析核苷酸多态性(π)、单倍型个数(H)、单倍型多样性(Hd)等遗传多样性指标。群体遗传分化系数(coefficient of gene differentiation)GST和NST均利用软件DnaSP 5.10.1和PERMUT(http://www.pierroron.inra.fr/genetics/labo/Software/Permut)计算(Raymond et al., 1995)。运用软件MEGA5.0(Tamura et al., 2011)溯祖理论推测单倍型间的亲缘关系,构建ITS序列单倍型的邻接(Neighor-joining,NJ)系统发育树与最大似然法(Maximum Likelihood,ML)系统发育树。同时,利用软件MEGA5.0计算得出的群体间遗传距离(Nei,1972)进行29个群体NJ与ML系统发育树的构建。采用软件Network 4.2.0.1基于最大简约性原则的中间连接网法分析(median-joining networks),构建不同单倍型间的网络关系图(Bandelt et al., 1999;http://www.fluxus-engineering.com)。利用软件Arelequin3.11中的AMOVA(Analysis of Molecular Variance)分析方法(Excoffier et al., 2005)分别检测自然群体间和群体内的遗传变异。利用DnaSP 5.1软件对自然群体和栽培群体之间的基因流(Nm)进行估算,并对所有群体进行Tajima’s、Fu and Li’s的中性检验,以确定目标DNA序列在进化过程中是否遵循中性学说(Tajima,1989;Fu et al., 1993);并利用该软件对所有群体的动态扩张进行失配分布分析(Mismatch Distribution Analysis)(Rogers et al., 1992)。应用IBD软件(Wright,1943;Bohonak,2002;http://ibdws.sdsu.edu/~ibdws/)中IBDWS方法(Jensen et al., 2005)对群体遗传距离与地理距离间的相关性及遗传距离与海拔之间的相关性进行Mantel检验。
2 结果与分析 2.1 核苷酸多态性分析对19个核桃自然群体254个个体与10个核桃栽培群体105个个体进行ITS序列测定和比对,得到长度为746 bp碱基的序列,该序列GC核苷酸含量占总核苷酸的55.9%;总突变位点32个,单倍型多样性为0.412。平均核苷酸多态性(π)为0.005 5,单倍型多样性(Hd)为0.274,群体单倍型多样性范围为0~0.679。其中,19个自然群体的核苷酸多态性(π)为0.007 4,单倍型多样性(Hd)为0.389;10个栽培群体的核苷酸多态性(π)为0.003 6,单倍型多样性(Hd)为0.159。核苷酸多态性较大的群体有宁陕县广货街(NS-W)、安康市石泉县(SQ-W)、太平国家森林公园(TP-W)、朱雀国家森林公园(ZQ-W)、西安市西郊(XJ-C)、峨眉山中峰寺(ZFS-W)。检测核桃359个个体的核糖体内转录间隔区(ITS)的序列变异,共发现了18个单倍型。其中单倍型H7出现频率最高,有26个群体拥有此单倍型,仅有3个群体(YC-C,CHS-W及ZQ-W)未见分布。单倍型H14次之,主要分布于10个群体,分别为栽培群体黑龙江伊春(YC-C)、宝鸡岐山县蔡家坡(QS-C)、西安市西郊(XJ-C)以及自然群体渭南市华县(HX-W)、甘肃省麦积山(MJS-W)、宁陕县广货街(NS-W)、朱雀国家森林公园(ZQ-W)、商洛市洛南县(LN-W)、商洛市镇安县(ZA-W)、商洛市山阳县(SY-W)。黑龙江伊春(YC-C)仅拥有一种单倍型H14,且为古老特有单倍型,而秦岭地区多个群体共享此单倍型(图 1b,d)。除了H7与H14单倍型外,其余一些特有单倍型仅分布在少数或单个群体中,如单倍型H2仅分布于西安翠华山(CHS-W)群体,H4与H6仅分布于安康市石泉县(SQ-W)群体,H12仅分布于太平国家森林公园(TP-W)群体(图 1b)。此外,西安翠华山(CHS-W)、安康市石泉县(SQ-W)、宁陕县广货街(NS-W)与朱雀国家森林公园(ZQ-W)4个核桃自然群体的单倍型多样性最高,分别为0.679,0.543,0.343,0.222,从单倍型地理分布图可看出上述4个群体中多数拥有各自的特有单倍型(图 1)。
2.2 群体遗传结构分析对检测到的18个单倍型基于最大简约性原则的中间连接网法分析进行单倍型网络图构建,结果显示: 在整个单倍型网络图中,18个单倍型的拓扑结构呈双星形分布的基因树,单倍型H7和H14位于整个网络图的中心部位,为核心的古老单倍型,且广泛分布于多数自然群体与栽培群体中。其余单倍型分别经过一步或多步突变而成为较为年轻的单倍型分散在网络图的外部节点(图 1e)。H7单倍型最古老,由该单倍型经过一步突变或演化成4种单倍型,分别为H11,H15,H16与H14。其中,H15单倍型分布在西安市西郊栽培群体中(XJ-C),且为该群体特有单倍型; H16分布于朱雀国家森林公园自然群体中(ZQ-W),也为该群体特有单倍型; H11单倍型分布于朱雀国家森林公园(ZQ-W)、宁陕县广货街(NS-W)与安康市石泉县(SQ-W)3个自然群体中,地理位置在秦岭中南部。
秦岭地区自然核桃群体的分子差异分析(AMOVA)结果显示,自然群体的ITS遗传变异中,群体间变异为46.6%,群体内的变异53.4%,即遗传变异主要存在于群体内(表 2)。上述结果说明该地区ITS序列在核桃自然群体间的分化比较明显。DnaSP 5.1软件检测结果显示,核桃自然群体和栽培群体之间的基因流(Nm)非常明显,为48.62。软件PERMUT分析秦岭地区核桃群体的遗传分化系数GST值为0.067,NST值为0.074,NST值没有明显高于GST值,表明各居群间并无明显的谱系地理学结构。应用IBD软件(Wright,1943; Bohonak,2002)分析19个自然群体遗传距离与地理距离间以及遗传距离与海拔间的相关性,结果显示,自然群体遗传距离与地理距离以及海拔间的相关性均不显著(r=0.197 5,P>0.05; r=0.097 8,P>0.05)。
|
|
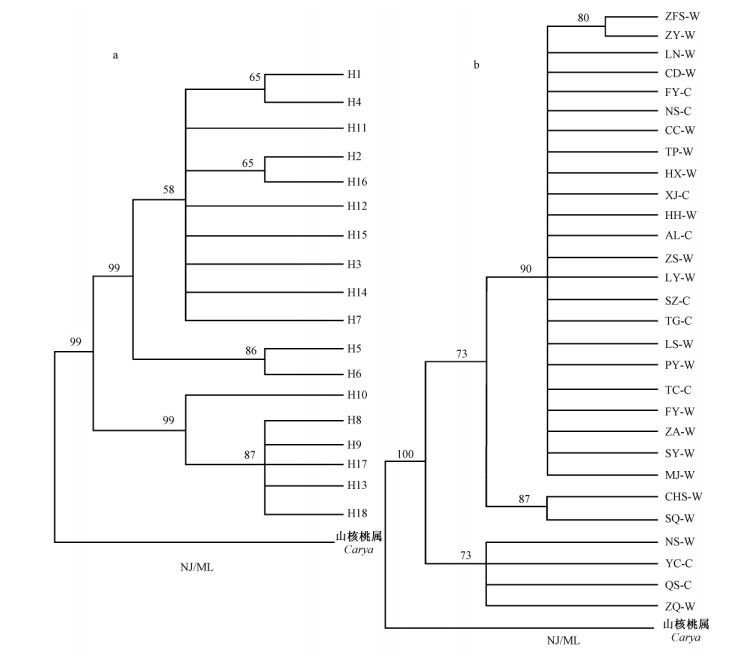
运用软件MEGA4.0构建了ITS序列的最大似然树(ML)与邻接树(NJ),分支上的数字表示自展支持率。由图 2可以看出,这些单倍型一共被分为2支,其中单倍型H7,H14,H11,H12,H3,H15,H5,H6,H2,H16,H1,H4聚为一大支,单倍型H10,H17,H8,H9,H13,H18聚为一大支,自展支持率为99%。其中,H7,H14一支在单倍型网络图中为古老单倍型,而H10,H17,H8,H9,H13,H18一支为新演化而来的单倍型,且网络进化图表明是由H14单倍型经过突变而在不同群体中形成的。18个单倍型中,有古老单倍型经过一步突变形成4种不同单倍型,而单倍型H14又经过1次至多次突变形成多个其他单倍型(图 2a)。秦岭地区核桃自然群体和栽培群体分成两大支: 自然群体宁陕(NS-W)、朱雀国家森林公园(ZQ-W)以及栽培群体黑龙江伊春(YC-C)、宝鸡岐山县蔡家坡(QS-C)4个群体为一支,剩余群体分为一支。结果表明,秦岭地区核桃栽培群体和自然群体在核糖体内转录间隔区(nrDNA ITS)序列上没有明显的差异。从地理分布上看,秦岭南北核桃群体无明显的谱系地理结构,但东北地区栽培核桃(YC-C)及四川中峰寺核桃自然群体(ZFS-W)却分布到分子系统发育树的2个分支上。
 |
图 2 基于ITS单倍型构建的最大似然树与邻接树
Fig. 2 Neighor-joining(NJ)and Maximum Likelihood(ML)trees for 29 Juglans regia populations or
18 haplotypes based on nrDNA ITS sequence
a. 18个单倍型最大似然树与邻接树; b. 29个核桃群体最大似然树与邻接树。 a.Neighor-joining(NJ)and Maximum Likelihood(ML)trees of 18 haplotypes; b.Neighor-joining(NJ)and Maximum Likelihood(ML)trees of 29 Juglans regia populations. |
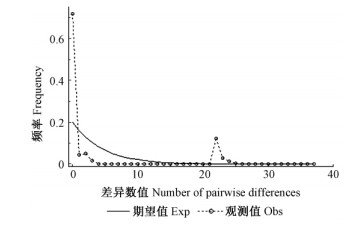
利用DnaSP 5.1软件对所有群体进行中性检验(Tajima,1989;Fu et al., 1993),检验结果表明:所有群体的Tajima’s D为不显著负值(Tajima’s D: -0.599 18,P>0.10),Fu and Li’s均为正值,统计检验也不存在显著性(Fu and Li’s D为0.881 8,P>0.10;Fu and Li’s F为0.304 3,P>0.10),表明秦岭核桃群体均未经过扩张事件。利用DnaSP 5.1对单倍型进行失配分析,若群体经历了扩张或瓶颈效应,将导致失配分布曲线呈现单峰;若群体处于动态平衡或缓慢衰退状态,没有经历扩张,则失配分布曲线为双峰或多峰(Tajima,1989;Fu et al., 1993)。结果显示,失配分布曲线呈双峰曲线(图 3),也表明秦岭地区核桃群体均没有经历扩张。
 |
图 3 ITS片段单倍型的失配分析 Fig. 3 Mismatch distribution analysis for ITS segment haplotype |
秦岭地区29个核桃群体359个个体的核苷酸多态性π值为0.005 5,单倍型多样性Hd为0.274。与其他物种群体比较相对偏低,如中国樱桃(Cerasus pseudocerasus)单倍型多样性为0.559(何文等,2014),绵参(Eriophyton wallichii)为0.908(王晓雄等,2011)。研究者普遍认为,多年生、分布广、异交且风媒的木本植物的遗传多样性水平高(Hamrick et al., 1992; Nybom,2004)。本研究核桃遗传多样性较低的原因可能为: 核桃雌雄同株异花,属风媒植物,自然群体间及其与栽培群体间基因交换频繁,而栽培核桃个体通常为扦插或嫁接的无性繁殖,不同地区核桃的遗传基础趋于相似,繁育系统是核桃群体遗传多样性的主要影响因素(Hamrick et al., 1992; Nybom,2004; Christopoulos et al., 2010; Ciarmiello et al., 2011)。自然核桃群体单倍型多样性(Hd=0.389)为栽培群体(Hd=0.159)的2.4倍,进一步证明了这种假设。
秦岭地区核桃自然群体遗传变异主要发生在群体内(表 2),自然群体与栽培群体基因交流非常明显(Nm=48.62)。该研究的群体遗传分化系数(GST=0.067)低于利用等位酶(GST=0.105)与SSR标记(FST=0.135)对核桃群体研究的结果(Fornari et al., 2001; 王滑等,2007),也低于用SSR标记对美国黑核桃(J. nigra)(FST=0.017)群体的研究结果(Victory et al., 2006)。Hamrick(1987)报道的4种针叶树的Nm值为5.3~37.8,本文核桃栽培群体与自然群体之间基因流明显高于王滑等(2007)对我国核桃(Nm=1.028)和铁核桃(J. sigillata)(Nm=3.18)的研究。可能原因: 一是,核桃栽培历史悠久,不同区域出现相互间的种质交流,导致栽培群体与自然群体之间存在较强的基因流(王滑等,2007; Liu et al., 2014);同时,核桃果仁营养价值高,由于人类活动及商业活动引起核桃果实的传播,不同地区之间可能存在长距离的交换现象(Gunn et al., 2010; Pollegioni et al., 2011)。二是,核桃为风媒植物,由于季风气候的影响,不同群体之间存在花粉交流现象,自然群体和栽培群体之间有明显的单倍型共享现象(图 1)(Gugger et al., 2013)。
3.2 ITS单倍型地理分布、物种的历史动态与谱系地理格局从18个单倍型多样性地理分布来看,西安翠华山(CHS-W)、朱雀国家森林公园(ZQ-W)、安康市石泉县(SQ-W)及宁陕县广货街(NS-W)4个核桃自然群体的单倍型不同于其他核桃群体,具有明显的独特单倍型(图 1)。可能原因为:核桃可能与该地方其他胡桃属植物发生基因渐渗,形成新的单倍型(Du et al., 2009),或者经过长期环境选择压力与人工选择演化出了部分特有基因单倍型(Liu et al., 2014)。从单倍型网络图中不难看出,单倍型H7与H14为古老单倍型(Crandall et al., 1993),其他地区特有单倍型可能是从上述2种单倍型经过基因突变演化而来,例如翠华山(CHS-W)具有特有单倍型H1,H2,H5,H6,乃经过1步或2步突变形成的。上述4个核桃自然群体(CHS-W,ZQ-W,SQ-W,NS-W)单倍型多样性高,也包含有古老单倍型H7与H14,且位于秦岭地区中心位置,故推断其可能为秦岭地区核桃遗传多样性中心,也可能为冰期避难所(Bai et al., 2010)。此外,四川峨眉山中峰寺(ZFS-W)与黑龙江伊春(YC-C)的核桃群体,与秦岭地区相距甚远(与秦岭核桃群体的平均地理距离分别为2 175 km与690 km),有趣的是,峨眉山中峰寺(ZFS-W)自然群体仅拥有古老单倍型H7,黑龙江伊春(YC-C)栽培群体仅拥有古老单倍型H14,秦岭地区所有群体均共享古老单倍型H7与H14,且秦岭北坡群体共享单倍型H14较多,秦岭南坡共享单倍型H7较多(图 1),证明秦岭地区也可能为核桃的冰期避难所(Bai et al., 2010),气候变暖后向南北方向迁移并演化出其他单倍型(Crandall et al., 1993),也可能由于偶然的长距离扩散或基因交流形成(王晓雄等,2011)。
经过3种不同的检验方法: Fu and Li’s检验、Tajima’s D分析和失配分布分析,结果均表明秦岭地区核桃自然群体在近期历史上没有经历群体的扩张(Tajima,1989;Fu et al., 1993)。由群体遗传分化系数分析知,NST值没有明显高于GST值,因此推断秦岭地区核桃自然群体没有明显的谱系地理结构(Pons et al., 1996)。本文研究的结果与先前研究过的胡桃属植物基本相同(Bai et al., 2010;Stanford et al., 2000),这可能是由于第四纪冰期气候波动与秦岭地区地形以及人类驯化历史的组合效应。是否存在其他胡桃属植物基因杂交渐渗及人为活动对核桃遗传结构的影响有待进一步研究。经过Mantel检验表明19个核桃群体的地理距离和遗传距离间不存在相关性(r=0.197 5,P>0.05),也说明地理隔离对群体分化的影响不大。这与一些学者的研究结果相一致,如水杉(Metasequoia glyptostroboides)、紫椴(Tilia amurensis)、秀雅杜鹃(Rhododendron concinnum)、红锥(Castanopsis hystrix)的研究结果均显示遗传距离与地理距离间不存在显著相关性(李晓东等,2003;穆立蔷等,2007;赵冰等,2012;徐斌等,2013)。如果对该地区物种的历史动态与谱系地理格局进行深入研究,仍需结合更多的遗传标记与数据(Hamrick et al., 1992;Aradhya et al., 2007;Delplancke et al., 2011)。
| [1] |
白红英,马新萍,高 翔,等. 2012. 基于DEM的秦岭山地1月气温及0℃等温线变化. 地理学报, 67(11): 1443-1450.( 1) 1)
|
| [2] |
何 文,张 静,黄智林,等. 2014. 基于ITS序列对栽培中国樱桃遗传多样性及其群体遗传结构的分析. 西北植物学报,34(3): 463-472.( 1) 1)
|
| [3] |
李晓东,黄宏文,李建强. 2003. 孑遗植物水杉的遗传多样性研究. 生物多样性,11(2): 100-108.( 1) 1)
|
| [4] |
穆立蔷,刘赢男. 2007. 不同地理分布区紫椴种群的遗传多样性变化. 植物生态学报, 31(6): 1190-1198.( 1) 1)
|
| [5] |
裴 东,鲁新政. 2011. 中国核桃种质资源. 北京: 中国林业出版社.( 2) 2)
|
| [6] |
王 滑,郝俊民,王宝庆,等. 2007. 中国核桃8个天然居群遗传多样性分析. 林业科学, 43(7): 120-124.( 4) 4)
|
| [7] |
王菁兰,刘全儒,孟世勇,等. 2010. 从秦岭蕨类植物区系地理成分论秦岭山地生态分界线的划分. 地理研究, 29(9): 1629-1638.( 1) 1)
|
| [8] |
王晓雄,乐霁培,孙 航,等. 2011. 青藏高原高山流石滩特有植物绵参的谱系地理学研究. 植物分类与资源学报, 33 (6): 605-614.( 2) 2)
|
| [9] |
徐 斌,张方秋,潘 文,等. 2013. 我国红锥天然群体的遗传多样性和遗传结构. 林业科学, 49(10): 162-166.( 1) 1)
|
| [10] |
赵 冰,徐 曼,司国臣,等. 2012. 秦岭秀雅杜鹃野生种群遗传多样性和遗传分化的AFLP 分析. 应用生态学报,23 (11): 2983-2990.( 1) 1)
|
| [11] |
赵 桦, 杨培君. 2001. 秦岭南坡中段种子植物区系初步分析. 西北植物学报, 21 (4): 732-739.( 1) 1)
|
| [12] |
赵 鹏,Keith Woeste,程 飞,等. 2012. 美国黑核桃SSR反应体系优化. 植物研究,32 (2): 213-221.( 1) 1)
|
| [13] |
Aradhya M K, Potter D, Gao F, et al. 2007. Molecular phylogeny of Juglans (Juglandaceae): a biogeographic perspective. Tree Genetics & Genomes, 3(4): 363-378.( 1) 1)
|
| [14] |
Bai W N, Liao W J, Zhang D Y. 2010. Nuclear and chloroplast DNA phylogeography reveal two refuge areas with asymmetrical gene flow in a temperate walnut tree from East Asia. New Phytologist, 188(3): 892-901.( 4) 4)
|
| [15] |
Baldwin B G. 1992. Phylogenetic utility of the internal transcribed spacers of nuclear ribosomal DNA in plants: An example from the compositae. Molecular Phylogenetics Evolution, 1(1): 3-16.( 1) 1)
|
| [16] |
Bandelt H J, Forster P, Rohl A. 1999. Median-joining networks for inferring intraspecific phylogenies. Molecular Biology and Evolution, 16(1): 37-48.( 1) 1)
|
| [17] |
Bartha L, DragoşN, Molnár V A, et al. 2013. Molecular evidence for reticulate speciation in Astragalus (Fabaceae) as revealed by a case study from Sect. Dissitiflori. Botany, 91(10): 702-714.( 1) 1)
|
| [18] |
Beer R, Kaiser F, Schmidt K, et al. 2008. Vegetation history of the walnut forests in Kyrgyzstan (Central Asia): natural or anthropogenic origin? Quaternary Science Review, 27(5/6): 621-632.( 1) 1)
|
| [19] |
Bohonak A J. 2002. IBD (isolation by distance): a program for analyses of isolation by distance. Journal of Heredity, 93(2): 153-154.( 2) 2)
|
| [20] |
Chen Y C, Eisner J D, Kattar M M, et al. 2001. Polymorphic internal transcribed spacer region 1 DNA sequences identify medically important yeasts. Journal of Clinical Microbiology, 39(11): 4042-4051.( 1) 1)
|
| [21] |
Christopoulos M V, Rouskas D, Tsantili E, et al. 2010. Germplasm diversity and genetic relationship among walnut (Juglans regia L.) cultivars and Greek local selections revealed by Inter-Simple Sequence Repeat (ISSR) markers. Sci Hortic, 125: 584-592.( 3) 3)
|
| [22] |
Ciarmiello L F, Piccirillo P, Pontecorvo G, et al. 2011. A PCR based SNPs marker for specific characterization of English walnut (Juglans regia L.) cultivars. Molecular Biology Reports, 38(2): 1237-1249.( 3) 3)
|
| [23] |
Crandall K A, Templeton A R. 1993. Empirical tests of some predictions from coalescent theory with applications to intraspercific phylogeny reconstruction. Genetics, 134(4): 959-969.( 2) 2)
|
| [24] |
Damasceno N R T, Pérez-Heras A, Serra M, et al. 2011. Crossover study of diets enriched with virgin olive oil, walnuts or almonds. Nutrition Metabolism and Cardiovascular Diseases, 21(s1):s14-s20.( 1) 1)
|
| [25] |
Dandekar A, Leslie C, McGranahan G. 2005. Juglans regia walnut//Litz R E. Biotechnology of fruit and nut crops. Wallingford, UK: CABI International Publishing, 307-323.( 1) 1)
|
| [26] |
Delplancke M, Alvarez N, Espíndola A, et al. 2011. Gene flow among wild and domesticated almond species: insights from chloroplast and nuclear markers. Evolutionary Applications, 5(4): 317-329.( 1) 1)
|
| [27] |
Doyle J J,Doyle J L. 1987. A rapid DNA isolation procedure for small quantities of fresh leaf tissue. Phytochemical Bulletin, 19(1):11-15.( 1) 1)
|
| [28] |
Du F K, Petit R J, Liu J Q. 2009. More introgression with less gene flow: chloroplast vs. mitochondrial DNA in the Picea asperata complex in China, and comparison with other Conifers. Molecular Ecology, 18(7): 1396-1407.( 1) 1)
|
| [29] |
Excoffier L, Laval G, Schnider S. 2005. Arleqin(version 3.0):An integrated software package for population genetics data analysis. Evolution Bioinformatics Online, 1: 47-50.( 1) 1)
|
| [30] |
Fornari B, Malvolti M E, Taurchini D. 2001. Isozyme and organellar DNA analysis of genetic diversity in natural/naturalised European and Asiatic walnut (Juglans regia L.) populations. Acta Horticulturae, 544: 167-178.( 1) 1)
|
| [31] |
Fu Y X, Li W H. 1993. Statistical test of neutrality of mutations. Genetics, 133(3): 693-709.( 4) 4)
|
| [32] |
Gugger P F, Ikegami M, Sork V L. 2013. Influence of late Quaternary climate change on present patterns of genetic variation in valley oak, Quercus lobata Née. Molecular Ecology, 22(13): 3598-3612.( 1) 1)
|
| [33] |
Gunn B F, Aradhya M, Salick J M, et al. 2010. Genetic variation in walnuts(Juglans regia and J. sigillata; Juglandaceae): species distinctions, human impacts, and the conservation of agrobiodiversity in Yunnan, China. American Journal of Botany, 97(4): 660-671.( 1) 1)
|
| [34] |
Hall T A. 1999. BioEdit: a user-friendly biological sequence alignment editor and analysis program for Windows 95/98/NT. Nucleic Acids Symposium Series, 41:95-98.( 1) 1)
|
| [35] |
Hamrick J L. 1987. Gene flow and distribution of genetic variation in plant populations //Urbanska K M. Differetiation patterns in higher plants. London: Academic Press Inc.( 1) 1)
|
| [36] |
Hamrick J L, Godt M J W, Sherman-Broyes S L. 1992. Factors influencing levels of genetic diversity in woody plant species. New Forests, 42(6): 95-124.( 3) 3)
|
| [37] |
Hsu P S, Weng R F, Siro K. 1994. New chromosome counts of some dicots in the Sino-Japanese region and their systematics and evolutionary significance. Journal of the Graduated School of the Chinese Academy of Sciences, 32(5): 411-418.( 1) 1)
|
| [38] |
Jensen J L, Bohonak A J, Kelley S T. 2005. Isolation by distance, web service. BMC Genetics, 6:13.( 1) 1)
|
| [39] |
Joly C, Visset L. 2009. Evolution of vegetation landscapes since the Late Mesolithic on the French West Atlantic coast. Review of Palaeobotany and Palynology, 154: 124-179.( 1) 1)
|
| [40] |
Li D Z, Gao L M, Li H T, et al. 2011. Comparative analysis of a large dataset indicates that internal transcribed spacer (ITS) should be incorporated into the core barcode for seed plants. Proceedings of the National Academy of Sciences of the United States of America, 108(6): 19641-19646.( 1) 1)
|
| [41] |
Librado P, Rozas J. 2009. DnaSPv5: A software for comprehensive analysis of DNA polymorphism data. Bioinformatics, 25(11): 1451-1452.( 1) 1)
|
| [42] |
Liu T, Tang S, Zhu S, et al. 2014. Transcriptome comparsion reveals the patterns of selection in domesticated and wild ramie (Boehmeria niveal L. Gaud). Plant Molecular Biology, 86(1/2): 85-92.( 2) 2)
|
| [43] |
Malvolti M E, Fineschi S, Pigliucci M. 1994. Morhpological integration and genetic variability in Juglans regia L. Journal of Heredity, 85(5): 389-394.( 1) 1)
|
| [44] |
Nei M. 1972. Genetic distance between populations. American Naturalist, 106(949): 283-293.( 1) 1)
|
| [45] |
Nybom H. 2004. Comparison of different nuclear DNA markers for estimation intraspecific genetic diversity in plants. Molecular Ecology, 13(5): 1143-1156.( 2) 2)
|
| [46] |
Pollegioni P, Woeste K, Mugnozza G S, et al. 2009. Retrospective identification of hybridogenic walnut plants by SSR fingerprinting and parentage analysis. Mol Breeding, 24(4): 321-335.( 1) 1)
|
| [47] |
Pollegioni P, Woeste K, Olimpieri I, et al. 2011. Long-term human impacts on genetic structure of Italian walnut inferred by SSR markers. Tree Genetics & Genomes, 7(4): 707-723.( 2) 2)
|
| [48] |
Pons O, Petit R J. 1996. Measuring and testing genetic differentiation with ordered versus unordered alleles. Genetics, 144: 1237-1245.( 1) 1)
|
| [49] |
Potter D, Gao F, Baggett S, et al. 2002. Defining the source of pardox: DNA sequence markers for North American walnut (Juglans L.) species and hybrids. Science Horticultural, 94(1/2): 157-170.( 1) 1)
|
| [50] |
Raymond M, Pousset F. 1995. An exact test for population differentiation. Evolution, 49: 1280-1283.( 1) 1)
|
| [51] |
Reddy U K, Aryal N, Islam-Faridi N, et al. 2013. Cytomolecular characterization of rDNA distribution in various Citrullus species using fluorescent in situ hybridization. Genetic Resources and Crop Evolution, 60(7): 2091-2100.( 1) 1)
|
| [52] |
Rogers A R, Harpending H. 1992. Population growth makes waves in the distribution of pairwise genetic difference. Molecular Biology and Evolution, 9(3): 552-569.( 1) 1)
|
| [53] |
Ros E, Mataix J. 2006. Fatty acid composition of nuts-implications for cardiovascular health. British Journal of Nutrition, 96(S2): S29-S35.( 1) 1)
|
| [54] |
Stanford A, Harden M, Parks C R. 2000. Phylogeny and biogeography of Juglans (Juglandaceae) based on matK and ITS sequence data. American Journal of Botany, 87(6): 872-882( 2) 2)
|
| [55] |
Tajima F. 1989. Statiatical method for testing the neutral mutation hypothesis by DNA polymorphism. Genetics, 123(3): 585-595.( 4) 4)
|
| [56] |
Tamura K, Peterson D, Peterson N, et al. 2011. MEGA5: Molecular evolutionary genetics analysis using maximum likelihood, evolutionary distance, and maximum parsimony methods. Molecular Biology and Evolution, 28(10): 2731-2739.( 1) 1)
|
| [57] |
Victory E R, Glaubitz J C, Rhodes Jr O E, et al. 2006. Genetic homogeneity in Juglans nigra (Juglandaceae) at nuclear microsatellites. American Journal of Botany, 93(1):118- 126.( 2) 2)
|
| [58] |
Vinson J A, Cai Y. 2012. Nuts, especially walnuts, have both antioxidant quantity and efficacy and exhibit significant potential health benefits. Food Function, 3(2): 134-140.( 1) 1)
|
| [59] |
Wright S. 1943. Isolation by distance. Genetics, 28(2):114-138.( 2) 2)
|
| [60] |
Zhao P, Zhang S, Woeste K. 2013. Genotypic data changes family assignment and family rank for growth and quality traits in a black walnut (Juglans nigra L.) progeny test. New Forests, 44:357-368.( 1) 1)
|
| [61] |
Zhao P, Woeste K. 2011. DNA markers identify hybrids between butternut (Juglans cinerea L.) and Japanese walnut (Juglans ailantifolia Carr.). Tree Genetics & Genomes, 7(3): 511-533.( 5 ) 5 )
|
| [62] |
Zhao P, Zhang S X, Woeste K. 2012. Molecular identification and genetic analysis of Juglans resources. Saarbrücken, Germany:Lambert Aacdemic Publishing.( 1) 1)
|
| [63] |
Zhao P, Zhao G F, Zhang S X, et al. 2014. RAPD derived markers for separating Manchurian walnut (Juglans mandshurica) and Japanese walnut (J. ailantifolia) from close congeners. Journal of Systematics and Evolution, 52(1): 101-111.( 1) 1)
|
 2014, Vol. 50

