文章信息
- 刘志理, 戚玉娇, 金光泽
- Liu Zhili, Qi Yujiao, Jin Guangze
- 小兴安岭谷地云冷杉林叶面积指数的季节动态及空间格局
- Seasonality and Spatial Pattern of Leaf Area Index of a Spruce-Fir Forest at the Valley in Xiaoxing’an Mountains
- 林业科学, 2013, 49(8): 58-64
- Scientia Silvae Sinicae, 2013, 49(8): 58-64.
- DOI: 10.11707/j.1001-7488.20130809
-
文章历史
- 收稿日期:2012-8-6
- 修回日期:2013-3-25
-
作者相关文章
2. 东北林业大学林学院 哈尔滨 150040
2. School of Forestry, Northeast Forestry University Harbin 150040
叶面积指数(leaf area index,LAI)是描述森林冠层结构的重要指标之一(Muraoka et al., 2010),被定义为单位地面面积上总绿叶面积的一半(Chen et al., 1992),它控制着冠层与大气间物质能量的交换(Sonnentag et al., 2007; Sprintsin et al., 2007; Behera et al., 2010)。LAI 广泛应用于碳、水循环的模拟(Asner et al., 2003; Thimonier et al., 2010)、净初级生产力及总初级生产力的估算(李文华等,1997; Barr et al., 2004)等方面。此外,准确测量 LAI 对实现研究尺度从叶片转换到冠层结构具有重要意义(Gower et al., 1991)。
LAI 的地面测量方法通常分为直接法和间接法(Deblonde et al., 1994; Jonckheere et al., 2004; Pinto-Júnior et al., 2011)。直接法估测LAI 相对准确,但因其费时、费力,且具有一定破坏性,故只能在小尺度范围内应用,不适合长期的LAI 时空动态变化监测(Marshall et al., 1986; Bréda,2003; Macfarlane et al., 2007; Pueschel et al., 2012)。相对而言,间接法(光学仪器法)能快速简便地估测LAI及其季节动态(Wasseige et al., 2003),但该方法基于林冠内叶元素的随机分布; 而大部分树种的叶元素并非随机分布,其分布方式与林冠和树枝的分布密切相关(Chen et al., 1997),植被冠层在多个尺度内的集聚现象以及树干、树枝等木质部分的影响都应考虑,因此,光学仪器测定值并非真实叶面积指数(true leaf area index,LAIt),而被称作有效叶面积指数(effective leaf area index,LAIe)(Weiss et al., 2004)。在众多间接法中,半球摄影技术(digital hemispherical photography,DHP)被广泛应用于估测地面水平上的LAI,该方法易于实施、可测定更多的林冠结构参数且能永久存档、能够量化集聚效应,且相对于其他光学仪器造价低(Coops et al., 2004;Chen et al., 2006; Pueschel et al., 2012)。
云冷杉林(spruce-fir forest)是我国寒温性常绿针叶林中分布最广的森林类型(李文华,1980),小兴安岭谷地云冷杉林是本地区非地带性顶极植被,其面积和蓄积量分别占小兴安岭地区天然林总面积和蓄积量的20%和23%,不仅提供大量木材,且在水源涵养和风景游憩等方面也起重要作用(黑龙江森林编辑委员会,1993)。Luo 等(1997)估测了贡嘎山地区不同海拔云冷杉林的最大LAI; 吕瑜良等(2007)应用LAI-2000 植物冠层分析仪比较4 种岷江冷杉林分生长季节LAI 的差异性,并分析LAI 与海拔和坡向的关系。以往研究对于常绿针叶林多采用光学仪器法或是经过参数校正(用于校正集聚效应及木质部分)来获得LAI 及其季节动态,但校正参数随研究区域内叶子的凋落而存在差异(尤其是落叶树种所占比例越大,差异越明显),因此,只利用校正光学仪器法并不适于测定小兴安岭地区谷地云冷杉林(落叶树种相对优势度为32. 8%)LAI 的季节动态。本研究通过结合光学仪器法和凋落物法,探讨小兴安岭谷地云冷杉林LAIt的季节动态(7—11 月),以LAIt为参考值,对比与LAIe的差异性,并分析LAIt的空间格局特征,以期为提高光学仪器法估测谷地云冷杉林LAI 的准确性提供科学依据,为该区域的生态过程模拟提供高精度参数。
1 材料与方法 1.1 研究区概况野外调查在黑龙江省凉水国家级自然保护区(47°10'50″ N、128°53'20″ E)进行,保护区位于黑龙江省伊春市带岭区,属小兴安岭南部达里带岭支脉的东坡。地形比较复杂,最高山脉海拔707. 3 m。该区属于温带大陆性季风气候,年均气温 - 0. 3 ℃,年均最高气温7. 5 ℃,年均最低气温 - 6. 6 ℃。多年平均降水量676 mm,降水多集中在 7 月。年积雪期130 ~ 150 天,年无霜期100 ~ 120天。本研究区域的谷地云冷杉林是谷地云冷杉林天然分布的南界,是全球气候变化的敏感地区,地势平缓,土壤为隐地带性的沼泽土,且有永冻土层分布,上层林木以云杉(Picea spp.)和冷杉(Abies nephrolepis)为主,林分年龄一般为60 ~ 80 年,胸径20 ~ 25 cm,高15 ~ 20 m。
1.2 研究方法 1.2.1 样点设置与数据采集野外调查在2006 年设置的谷地云冷杉林60 m × 60 m 样地内进行(基本概况见表 1)。随机布设20 个样点,各样点布设1 个凋落物收集器,凋落物收集器用径粗8 mm 的铁丝和尼龙网围成(孔径1 mm,深0. 5 ~ 0. 6 m),网口正方形,面积1. 0 m2,凋落网底离地面0. 5 m;各凋落物收集器旁用三根长30 cm 的PVC 管固定光学仪器采集数据的位置。使用Winscanopy2006冠层分析仪(Regent,Instruments Inc.,Quebec,Canada; 由Nikon Coolpix4500和180° 鱼眼镜头组成)在各样点采集半球摄影图像,用三脚架固定鱼眼镜头且离地面1. 3 m,为避免阳光直射,选在阴天或日出、日落前后进行,摄像时曝光及快门均设置自动状态,采集时间为2010 年7 月1 日、8 月1日、9 月1 日、9 月15 日、10 月1 日、10 月15 日及11月1 日。凋落物的收集与半球摄影法的图像采集同步进行,将凋落叶按树种分类,分别称质量后,即时将样品在65 ℃ 下烘干至恒质量,测其干质量,结合各树种的比叶面积(specific leaf area,SLA),得到各样点各时期凋落物产生的LAI。本研究中主要树种的比叶面积参照Liu 等(2012)的研究方法测定。
|
|
谷地云冷杉林存在较大比例落叶树种,本研究将常绿树种和落叶树种分开处理,首先利用光学仪器法测定11 月初LAIe,该时期落叶树种凋落完毕,该林型可看做常绿针叶林,将该时期的LAIe进行校正后作为LAIt,再结合凋落物法得到LAIt的季节动态(7—11 月)。为获得11 月初相对准确的LAIt,对光学仪器测得的LAIe进行校正中考虑木质部分以及集聚效应,其中集聚效应体现在冠层水平及针簇水平上,根据前人的理论和验证(Leblanc et al., 2001),LAIt计算公式如下:
$$L = (1 - \alpha ){L_{\text{e}}}\frac{{{\gamma _{\text{E}}}}}{{{\Omega _{\text{E}}}}}$$
(1)
由式(1)得到11 月1 日的LAIt,加上11 月1日收集的凋落物产生的LAI,得到10 月15 日的LAIt,以此类推,得到小兴安岭谷地云冷杉林7—11 月各调查时期的LAIt。
1.2.3 数据处理利用Photoshop CS 8. 01(Adobe Systems Inc,USA)软件参照Qi 等(2012)的方法消除11 月1 日半球摄影图像中树干等木质部分产生的影响。半球摄影图像采用DHP 软件进行处理,处理时提取0 ~ 60°天顶角范围内的LAI。冠层上的集聚采用DHP-TRACWin 软件(Leblanc et al., 2005; Macfarlane et al., 2007)计算的ΩE值校正,选用40 ~45°天顶角测定ΩE。LAI 的空间异质性用变异函数的主要参数块金值、基台值、尺度、空间结构比等来反映,参数使用GS + 7. 0(Gamma Design Software,2004)来计算。
2 结果与分析 2.1 校正参数α,ΩE及γE的获取11 月初木质部分产生的误差为0. 04 ~ 0. 22(表 2),均值为0. 10 ± 0. 06,表明此时常绿树种产生的LAIt最大(占光学仪器测定值的90%); 各样点冠层水平上的集聚效应差异较小(最大值与最小值相差 15%),均值为0. 90 ± 0. 04,表明谷地云冷杉林在 11 月初冠层水平上不存在明显集聚效应。总体来看,常绿针叶树种γE的排列顺序为红松(1. 77)>云杉(1. 28)> 冷杉(1. 10),不同树种的γE均随林冠高度的降低而减小(表 3),表明γE受树木在整个林分冠层中位置的影响。
|
|
|
|
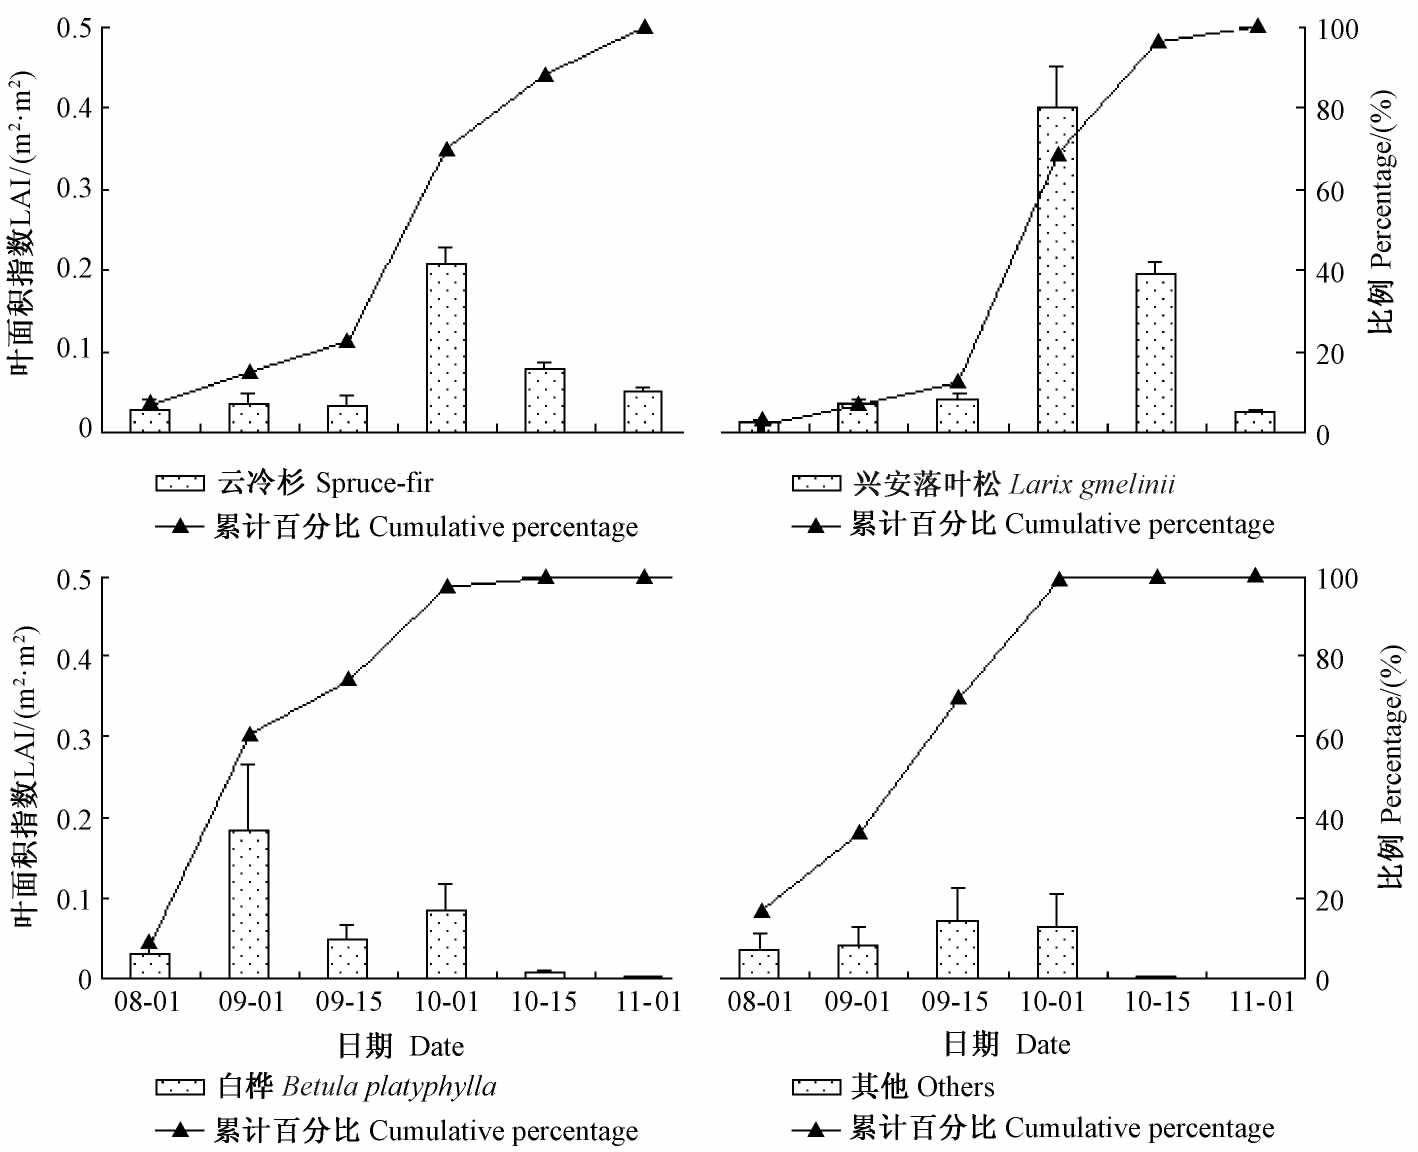
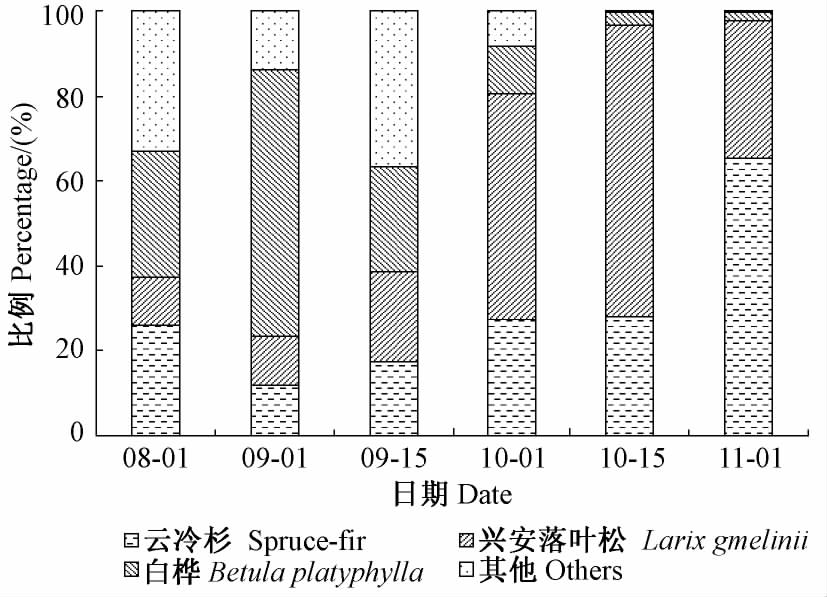
谷地云冷杉林主要组成树种的叶凋落物有明显差异(图 1)。白桦存在2 个落叶高峰期,而云冷杉、兴安落叶松及其他树种均存在1 个落叶高峰期。白桦最先在8 月达到第1 个落叶高峰,第2 个高峰出现在9 月下半月,且凋落基本完毕(10 月以前叶凋落97. 43%); 云冷杉在9 月下半月达落叶高峰期,10 月上半月凋落量次之,其他时期叶凋落量相差不大(变幅为3. 5% ~ 20. 20%),相对于其他落叶树种,云冷杉在10 月后仍存在较大的凋落量。兴安落叶松在9 月下半月达落叶高峰,较高凋落量持续到10 月上半月,其他时期的总凋落量仅占总体的15. 82%。其他树种的总凋落量产生的LAI 较小,仅占所有树种的12. 53%,9 月上半月出现落叶高峰,9 月末叶凋落基本结束(凋落量达99. 01%)。云冷杉10 中旬之前叶凋落产生LAI 占同期所有树种的比例相差不大且较小(11. 78% ~ 27. 92%),在10 月下半月明显高于其余树种(占总 LAI 的65. 46%); 兴安落叶松7 月份叶凋落产生 LAI 最小(占总LAI 的11. 13%),其余树种相差不大; 在9 月下半月至10 月上半月叶凋落产生的LAI均占最大比例,分别为53. 02%,68. 72%(图 2)。白桦8 月份的叶凋落产生的LAI 最大,占该时期总LAI 的62. 43%。其他树种7 月及9 月上半月均占最大比例,但9 月下半月以后凋落量明显下降,在 10 月之后凋落基本结束,表明10 月后大部分树种凋落结束。

|
图1 各调查时期主要树种叶凋落产生的LAI Fig.1 LAI estimated from litter of major species during the investigation period |

|
图2 各调查时期主要树种凋落叶产生的 LAI 占所有凋落叶产生总LAI 的比例 Fig.2 LAI estimated from litter of major species accounted for the proportion of the total LAI from all litter during the investigation period |
LAIe不存在明显的季节性变化(表 4),LAIe在 8 月初达到最大值为2. 44,仅比11 月份的最小值高20. 90%,不能灵敏地反映LAI 的季节性变化;相对而言,LAIt随时间推移明显减小,8 月份达到最大值3. 97,是11 月份最小值的1. 5 倍,体现了 LAI 的季节变化特性; 相对于LAIt,LAIe在整个调查期均出现低估现象,低估范围为28. 81 ~ 43. 24%,平均低估32. 98%。
|
|
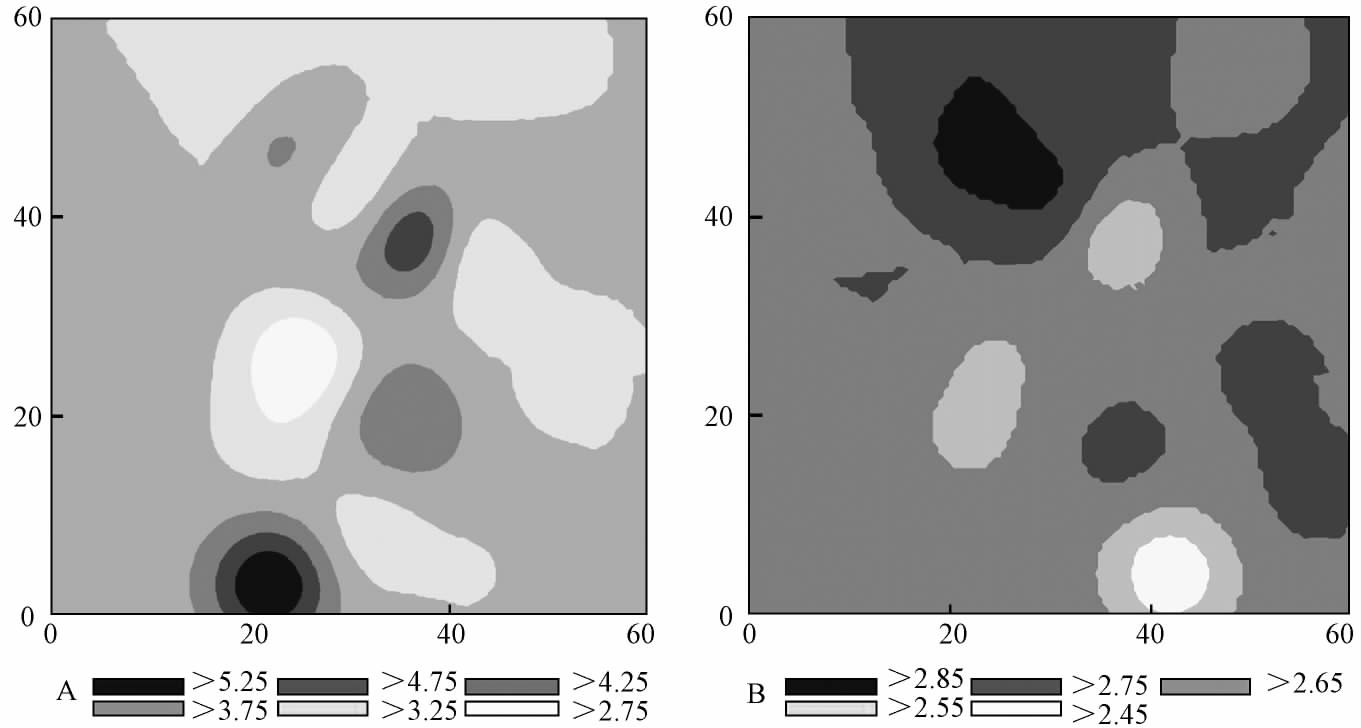
谷地云冷杉林落叶季节相同研究区内的LAIt,在最大时期(7 月)与最小时期(11 月)具有不同的空间异质性(表 5)。7 月LAIt由空间自相关引起的空间异质性占总空间异质性的99. 8%,主要表现在 4. 0 ~ 10. 44 m 的尺度上; 而由随机因素引起的空间异质性仅占总空间异质性的0. 2%,表现在4. 0 m以内的尺度上; 高密度斑块与低密度斑块均较少(图 3)。11 月LAIt由空间自相关引起的空间异质性的程度低于7 月,占总空间异质性的66. 9%,且仅在10. 98 m 的有效变程内LAIt存在明显的空间格局,高密度斑块面积较小,而中等密度斑块面积最大且分布集中,主要分布在样地边缘地带。7 月LAIt的基台值远大于11 月,说明7 月LAIt的空间异质性程度大于11 月。
|
|

|
图3 谷地云冷杉林7 月与11 月真实叶面积指数空间格局 Fig.3 The spatial patterns of LAIt in July and November in Spruce-fir forest at valley A: 7 月July; B: 11 月November |
凋落物法可准确、有效获得落叶林的LAIt(Neumann et al., 1989; Cutini et al., 1998; Bréda,2003),合理校正光学仪器法获得的LAIe可得到较准确的常绿针叶林的LAIt(Chen,1996; Thimonier et al., 2010),但单独利用这2 种方法均很难准确估测混交林LAI。小兴安岭谷地云冷杉林中落叶树种的相对优势度为32. 8%,本文尝试结合光学仪器法和凋落物法,对11 月初落叶树种完全落叶只剩常绿针叶时的LAIe进行木质部分、集聚效应的校正,校正后的LAI 结合凋落物法,得到小兴安岭谷地云冷杉林LAIt的季节动态。
木质部分和集聚效应是影响光学仪器法估测 LAI 测量精度的主要因素,光学仪器法计算LAI 过程中,因把木质部分当做叶子会增大LAI,而忽略集聚效应会减小LAI,针对以上情况,本研究分别进行校正。对于落叶林型,可利用光学仪器在展叶前或是落叶后测定木质部分的面积指数(woody areaindex,WAI)作为背景值,假设其他时期木质部分的影响不变,减去背景值来消除木质部分产生的影响,但此方法不适用于去除常绿林木质部分产生的误差。而本研究运用Photoshop 软件参照Qi 等(2012)的方法得到α 值为4% ~ 22%,其他学者得到类似结果,如Gower 等(1999)研究得到α 值 5% ~ 35%; Chen 等(2006)研究得到香脂冷杉(Abies balsamea)林的α 值为15% ~ 20%; Deblonde等(1994)估测挪威松林(Picea resinosa)及短叶松林(P. banksiana)的α 值分别为8% ~ 12%和10% ~ 33%。本研究中冠层水平的集聚指数ΩE由广泛应用的DHP-TRACWin 软件(Leblanc et al., 2005; Chen et al., 2006)直接获得,均值为0. 90,Chen 等(2006)利用相同方法得到香脂冷杉(A. balsamea)林的ΩE均值0. 95,主要树种为黑云杉(P. mariana)的林分,ΩE均值0. 91,均略高于本文研究结果,主要源于林分组成差异。
目前,国内关于常绿针叶树种簇内集聚效应的校正系数γE的研究较少报道,本研究通过实地采样量化了北方常绿针叶树种云杉、冷杉及红松的γE值,并根据各树种的胸高断面积比例加权得到谷地云冷杉林11 月初整个林分的γE为1. 2,其他学者得到类似结论,如Chen 等(2007)报道北方针叶林的γE为1. 4 ~ 1. 8,; Bréda等(2003)报道针叶林分的 γE为1. 2 ~ 2. 0。 相对于LAIt,光学仪器法估测的LAIe在LAI 最大时期低估43. 24%,主要源于此时属于叶茂盛期,冠层中的集聚效应远远大于木质部分的影响; 而在LAI 最小时期低估28. 81%,源于此时林分内只存在常绿树种,冠层中的集聚效应减弱,木质部分的影响此时最大。本研究利用半球摄影技术得到谷地云冷杉林8 月的LAIe为2. 44,探讨方法得到的LAIt为3. 84,其他学者也得到类似结果,如Thimonier等(2010)利用半球摄影技术测定云冷杉林2004 年 8 月初及2005 年7 月末的LAIe,分别为2. 3和2. 1; 将2005 年的LAIe进行曝光、集聚效应及坡度的校正后的值为3. 8。谷地云冷杉林虽为常绿针叶林,但也存在明显季节变化,7 月达最大值(3. 97),8 月小幅度减小,9 月下半月减幅最大,11 月达最小值(2. 71),总体变化幅度为31. 74%(表 4),略大于Chen 等(2006)的针叶林LAI 季节变化幅度25% ~ 30%,主要源于树种组成、生境特性及阔叶树种在常绿针叶林中所占比例不同。
变异函数分析在生态学中的应用被证明是描述空间数据的有效方法(Fortin et al., 1989; Robertson,1987)。本研究用变异函数分析得到谷地云冷杉林 7 月LAIt的空间异质性程度大于11 月,主要源于7月大部分树种叶子达到成熟期,各样点的LAIt差异较大,而11 月落叶树种均凋落完毕,只剩常绿树种,各样点的差异相对减小,因此LAIt的空间异质性程度较小。
| [1] |
黑龙江 森林编辑委员会. 1993. 黑龙江森林. 哈尔滨: 东北林业大学出版社.( 1) 1)
|
| [2] |
李文华. 1980. 小兴安岭谷地云冷杉群落结构和演替的研究. 自然资源, (4): 17-29.( 1) 1)
|
| [3] |
李文华, 罗天祥. 1997. 中国云冷杉林生物生产力格局及其数学模型. 生态学报, 17(5): 511-518.( 1) 1)
|
| [4] |
吕瑜良, 刘世荣, 孙鹏森, 等. 2007. 川西亚高山暗针叶林叶面积指数的季节动态与空间变异特征. 林业科学, 43(8): 1-7.( 1) 1)
|
| [5] |
Asner G P, Scurlock J M O, A Hicke J. 2003. Global synthesis of leaf area index observations: implications for ecological and remote sensing studies. Global Ecology and Biogeography, 12(3): 191-205.( 1) 1)
|
| [6] |
Barr A G, Black T A, Hogg E H, et al. 2004. Inter-annual variability in the leaf area index of a boreal aspen-hazelnut forest in relation to net ecosystem production. Agricultural and Forest Meteorology, 126(3/4): 237-255.( 1) 1)
|
| [7] |
Behera S K, Srivastava P, Pathre U V, et al. 2010. An indirect method of estimating leaf area index in Jatropha curcas L. using LAI-2000 Plant Canopy Analyzer. Agricultural and Forest Meteorology, 150(2): 307-311.( 1) 1)
|
| [8] |
Bréda N J J. 2003. Ground-based measurements of leaf area index: a review of methods, instruments and current controversies. Journal of Experimental Botany, 54(392): 2403-2417.( 3) 3)
|
| [9] |
Chen J M, Black T A. 1992. Defining leaf area index for non-flat leaves. Plant, Cell and Environment, 15(4): 421-429.( 1) 1)
|
| [10] |
Chen J M. 1996. Optically-based methods for measuring seasonal variation of leaf area index in boreal conifer stands. Agricultural and Forest Meteorology, 80(2/4): 135-163.( 1) 1)
|
| [11] |
Chen J M, Govind A, Sonnentag O, et al. 2006. Leaf area index measurements at Fluxnet-Canada forest sites. Agricultural and Forest Meteorology, 140(1/4): 257-268.( 1) 1)
|
| [12] |
Chen J M, Rich P M, Gower S T, et al. 1997. Leaf area index of boreal forests: theory, techniques, and measurements. Journal of Geophysical Research, 102(D24): 29429-29443.( 5) 5)
|
| [13] |
Coops N, Smith M, Jacobsen K, et al. 2004. Estimation of plant and leaf area index using three techniques in a mature native eucalypt canopy. Austral Ecology, 29(3): 332-341.( 1) 1)
|
| [14] |
Cutini A, Matteucci G, Mugnozza G. 1998. Estimation of leaf area index with the Li-Cor LAI 2000 in deciduous forests. Forest Ecology and Management, 105(1/3): 55-65.( 1) 1)
|
| [15] |
Deblonde G, Penner M, Royer A. 1994. Measuring leaf area index with the LI-COR LAI-2000 in pine stands. Ecology, 75(5): 1507-1511.( 2) 2)
|
| [16] |
Fortin M J, Drapeau P, Legendre P. 1989. Spatial autocorrelation and sampling design in plant ecoloty. Vegetatio, 83(1/2): 209-222.( 1) 1)
|
| [17] |
Gower S T, Kucharik C J, Norman J M. 1999. Direct and indirect estimation of leaf area index, f (APAR), and net primary production of terrestrial ecosystems. Remote Sensing of Environment, 70(1): 29-51.( 1) 1)
|
| [18] |
Gower S T, Norman J M. 1991. Rapid estimation of leaf area index in conifer and broad-leaf plantations. Ecology, 72(5): 1896-1900.( 1) 1)
|
| [19] |
Jonckheere I, Fleck S, Nackaerts K, et al. 2004. Review of methods for in situ leaf area index determination: Part I. Theories, sensors and hemispherical photography. Agricultural and Forest Meteorology, 121(1/2): 19-35.( 1) 1)
|
| [20] |
Leblanc S G, Chen J M. 2001. A practical scheme for correcting multiple scattering effects on optical LAI measurements. Agricultural and Forest Meteorology, 110(2): 125-139.( 1) 1)
|
| [21] |
Leblanc S G, Chen J M, Fernandes R, et al. 2005. Methodology comparison for canopy structure parameters extraction from digital hemispherical photography in boreal forests. Agricultural and Forest Meteorology, 129(3/4): 187-207.( 2) 2)
|
| [22] |
Liu Z L, Jin G Z, Qi Y J. 2012. Estimate of leaf area index in an old-growth mixed broadleaved-Korean pine forest in northeastern China. PLoS One, 7(3): e32155. doi: 10.1371/journal.pone.0032155.( 2) 2)
|
| [23] |
Luo T X, Li W H, Zhao S D. 1997. Distribution patterns of leaf area index for major coniferous forest types in China. Journal of Chinese Geography, 7(3): 61-73.( 1) 1)
|
| [24] |
Macfarlane C, Grigg A, Evangelista C. 2007. Estimating forest leaf area using cover and fullframe fisheye photography: thinking inside the circle. Agricultural and Forest Meteorology, 146(1/2): 1-12.( 2) 2)
|
| [25] |
Marshall J D, Waring R H. 1986. Comparison of methods of estimating leaf-area index in old-growth Douglas-fir. Ecology, 67(4): 975-979.( 1) 1)
|
| [26] |
Muraoka H, Saigusa N, Nasahara K N, et al. 2010. Effects of seasonal and interannual variations in leaf photosynthesis and canopy leaf area index on gross primary production of a cool-temperate deciduous broadleaf forest in Takayama Japan. Journal of plant research, 123(4): 563-576.( 1) 1)
|
| [27] |
Neumann H H, Den Hartog G, Shaw R H. 1989. Leaf area measurements based on hemispheric photographs and leaf-litter collection in a deciduous forest during autumn leaf-fall. Agricultural and Forest Meteorology, 45(3/4): 325-345.( 1) 1)
|
| [28] |
Pinto-Júnior O, Sanches L, de Almeida Lobo F, et al. 2011. Leaf area index of a tropical semi-deciduous forest of the southern Amazon Basin. International Journal of Biometeorology, 55(2): 109-118.( 1) 1)
|
| [29] |
Pueschel P, Buddenbaum H, Hill J. 2012. An efficient approach to standardizing the processing of hemispherical images for the estimation of forest structural attributes. Agricultural and Forest Meteorology, 160: 1-13.( 2) 2)
|
| [30] |
Qi Y J, Jin G Z, Liu Z L. 2012. Optical and litter collection methods for measuring leaf area index in an old-growth temperate forest in northeastern China. Journal of Forest Research, DOI: 10.1007/s10310-012-0370-1.( 2) 2)
|
| [31] |
Robertson G P. 1987. Geostatistics in ecology: interpolating with known variance. Ecology, 68(2): 744-748.( 1) 1)
|
| [32] |
Sonnentag O, Chen J M, Roberts D A, et al. 2007. Mapping tree and shrub leaf area indices in an ombrotrophic peatland through multiple endmember spectral unmixing. Remote Sensing of Environment, 109(3): 342-360.( 1) 1)
|
| [33] |
Sprintsin M, Karnieli A, Berliner P, et al. 2007. The effect of spatial resolution on the accuracy of leaf area index estimation for a forest planted in the desert transition zone. Remote Sensing of Environment, 109(4): 416-428.( 1) 1)
|
| [34] |
Thimonier A, Sedivy I, Schleppi P. 2010. Estimating leaf area index in different types of mature forest stands in Switzerland: a comparison of methods. European Journal of Forest Research, 129(4): 543-562.( 3) 3)
|
| [35] |
Wasseige C, Bastin D, Defourny P. 2003. Seasonal variation of tropical forest LAI based on field measurements in Central African Republic. Agricultural and Forest Meteorology, 119(3-4): 181-194.( 1) 1)
|
| [36] |
Weiss M, Baret F, Smith G, et al. 2004. Review of methods for in situ leaf area index (LAI) determination: Part II. Estimation of LAI, errors and sampling. Agricultural and Forest Meteorology, 121(1): 37-53.( 1) 1)
|
 2013, Vol. 49

