 2012, Vol. 48
文章信息
- 汪金松, 范秀华, 范娟, 张春雨, 夏富才
- Wang Jinsong, Fan Xiuhua, Fan Juan, Zhang Chunyu, Xia Fucai
- 林木竞争对臭冷杉生物量分配的影响
- Effects of Tree Competition on the Biomass Partitioning of Abies nephrolepis
- 林业科学, 2012, 48(4): 14-20.
- Scientia Silvae Sinicae, 2012, 48(4): 14-20.
-
文章历史
- 收稿日期:2011-02-28
- 修回日期:2012-02-25
-
作者相关文章


2. 北京林业大学理学院 北京 100083;
3. 北华大学林学院 吉林 132013
2. College of Science, Beijing Forestry University Beijing 100083;
3. College of Forestry, Beihua University Jilin 132013
测定植物生物量的方法通常包括收获法和相对生长法(于贵瑞,2003;董明,1997)。收获法尽管准确,但是需要大量的人力、物力和财力且局限于较小的样本量或者适用于较小的研究区域(Ketterings et al., 2001;Muukkonen et al., 2006;Delphis et al., 2008;Nafus et al., 2009;Quint et al., 2010)。而采用相对生长法建立生物量方程估算植物生物量能有效降低植被破坏。生物量方程将简单、易得的变量(胸径、基径、树高和树冠长度等)与植物生物量结合起来,以估测植物地上、地下生物量以及森林生态系统净生产力。
植株之间竞争的实质是对环境资源的争夺。竞争必然对植物地上、地下生物量分配产生重要的影响,进而影响植物的个体生长、形态结构及存活状况(刘方炎等,2010)。植物不断调整其生物量分配策略以适应环境变化,这是保持自身生产力的一个重要机制(Davidson,1969;Sebastia,2007)。生物量的动态变化直接影响到森林生产力及其分解过程,在当前气候变化条件下掌握植物生物量分配特征对碳循环研究有重要意义。
臭冷杉(Abies nephrolepis)作为长白山林区主要针叶树种,其生物量研究对评价整个森林的结构和功能起着重要作用。目前关于臭冷杉针叶化学成分及药用价值的研究已有不少报道(Li et al., 2005;杨志蕴等,1990),但臭冷杉生物量分配及林木竞争对其生物量分配的影响还未见报道。本研究用不同高度树干直径建立并比较臭冷杉各器官生物量方程,分析林木竞争对臭冷杉地上、地下生物量分配的影响,为准确估算森林生物量和生产力提供科学依据,为了解林木竞争机制以及臭冷杉的有效利用提供参考。
1 研究区概况研究区位于吉林省白河林业局光明林场5号林班(128°05′—128°07′E, 42°18′—42°24′N)内,海拔730~780 m,属受季风影响的温带大陆性山地气候,年平均气温3.3 ℃,年降水量600~900 mm。土壤为山地暗棕色森林土,土层厚20~40 cm。研究区地势平坦,坡度不超过5°。该区原始植被为阔叶红松(Pinus koraiensis)林,经采伐破坏后形成次生针阔混交林。林区主要乔木树种包括红松、臭冷杉、鱼鳞松(Picea jezoensis)、紫椴(Tilia amurensis)、白桦(Betula platyphylla)、蒙古栎(Quercus mongolica)、水曲柳(Fraxinus mandshurica)、大青杨(Populus ussuriensis)、春榆(Ulmus japonica)和怀槐(Maackia amurensis)等(张春雨等,2008)。
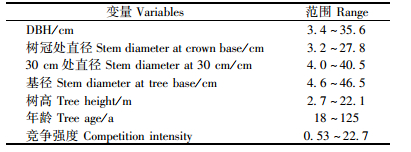
2 研究方法 2.1 样地设置2005年7—8月,在林班内建立1块260 m×200 m的固定样地。样地林龄110~120年,郁闭度0.6,林分密度2831株·hm-2,蓄积量244.7 m3·hm-2。2006年7月对样地进行调查,记录样地内所有DBH≥1 cm的活个体种名、胸径、树高、冠幅、枝下高及其位置坐标,并挂牌标记。样地中臭冷杉密度845株·hm-2,胸径1.3~39.2 cm,平均胸径6.4 cm,树高1.4~29.8 m,平均树高5.7 cm。2008年8月,将整个样地中所调查的臭冷杉个体按照其树高H划分为5个等级(1 m < H≤6 m、6 m < H≤12 m、12 m < H≤18 m、18 < H≤24 m和24 m < H≤30 m),每个等级在样地内各选择3~4株样木作为对象木,共选择21株对象木进行整株挖掘,对象木特征见表 1。对象木被伐倒前,测量其胸径、树干基部直径D0及树干30 cm处直径D30。
|
|
距离地面5 cm处将对象木伐倒,收集所有枯枝,测量每株对象木的树高H、树冠处直径Dc及树冠长度Lc并计算出树冠比率(Rc):Rc=Lc/H。在野外用台秤称量地上各器官鲜质量,不同器官选取部分鲜样带回实验室烘干称干质量,根据鲜样干质量/鲜质量比值推算出各器官干质量。由于细根(直径<5 mm)(Wang,2006)对根系总生物量的影响不大且全部挖掘出来非常困难,所以只对粗根(直径>5 mm)进行挖掘。每株对象木分别取500~1 000 g粗根鲜样装入保鲜袋中带回实验室,用流动水浸泡、漂洗,于85 ℃烘至恒质量,称干质量。根据鲜样干质量/鲜质量比值推算整株对象木粗根干质量。在每株对象木基部分别截取一个5 cm厚圆盘,带回实验室利用Lintab 5年轮分析仪(Rintech,Heidelberg,Germany)测定其年轮宽度并进行定年。
2.3 生物量方程的建立与拟合采用一般非线性方程(Y=aXb)建立臭冷杉各器官生物量方程。式中,Y为生物量,X为不同高度的树干直径(DBH,Dc,D30和D0),a和b为方程的系数。利用方程的显著性以及决定系数(R2),均方根误差(RMSE),适合指数(FI)和平均预测偏差(Bias)估计方程的拟合优度(李晓娜等,2010;Hosoda et al., 2010)。各拟合指数的计算公式如下:

|
式中:n为对象木的株数;Yi和
采用改进的Hegyi竞争指数Ic表示林木竞争强度:以对象木为中心,10 m为半径的圆组成一个竞争区域。测量竞争区域内每株竞争木的胸径及到对象木的距离。同时记录竞争木与对象木的夹角,根据角度以及距离换算出每株竞争木在圆内的极坐标值。Ic计算步骤如下。
1) 确定对象木受竞争作用的动态半径CZR:CZR= 
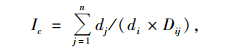
|
式中:n为竞争半径内有效竞争木的株数;Dij为对象木i到竞争木j的距离。21株对象木所受竞争强度见表 1。
2.5 数据分析采用国际通用软件R.12.1进行统计分析(http://www.R-project.org/)。
3 结果与分析 3.1 生物量方程臭冷杉不同高度树干直径与各器官生物量关系如表 2。所有方程总体回归F检验均极显著(P<0.001),R2值为0.868~0.989。其中,树干和粗根生物量方程R2值最大,其次为活枝生物量,针叶生物量方程R2值最小。
|
|

利用树干30 cm处直径或者基径拟合粗根和活枝生物量时,模型R2值高于胸径和树冠处直径的拟合结果。用树冠处直径拟合的针叶生物量精度稍优于用胸径、30 cm处直径以及基径拟合的针叶生物量。用胸径拟合树干生物量效果更优,方程可解释量和FI值最高,RMSE值与Bias绝对值最低。总体上,胸径可较准确地拟合臭冷杉各器官生物量。对于小个体样木(直径≤10 cm),利用不同高度直径预测时均会高估其生物量,并且估测误差随直径增加而增大(图 1)。

|
图 1 树干、粗根、活枝及针叶生物量残差(观测值减预测值)与树干不同高度直径的关系 Fig.1 Relationships between biomass residuals (observed minus predicted values) and stem diameters at different tree heights |
表 3所示:树干木质生物量是整株生物量的最大组成部分,其次是粗根、活枝、树皮,最小的为针叶。地上生物量与地下生物量的比值(T/R)为3.17~6.98,均值为4.5。T/R值与年龄、单株生物量、单株生物量年均生长率及树高年均生长率间均没有显著相关性(P>0.05)(图 2)。
|
|


|
图 2 地上生物量与地下生物量比(T/R)与树木年龄、单株生物量、单株生物量年均生长率及树高年均生长率的关系 Fig.2 Relationships between aboveground to belowground biomass ratio (T/R) and tree age, individual plant biomass, mean annual growth rate of individual plant biomass and mean annual growth rate of tree height |
图 3揭示了林木竞争对臭冷杉各器官生物量分配比例的影响:树干、活枝生物量拟合方程总体回归F检验显著(P<0.05),随着竞争强度增大,树干生物量占单株生物量的比例逐渐减小,活枝生物量比例逐渐增大且针叶生物量亦有逐渐增大的趋势,而粗根生物量比例基本不变,其占单株生物量的比例大约为0.19。该结果表明林木竞争并未影响粗根生物量在单株生物量中的分配比例,而仅改变了地上各器官生物量比例。

|
图 3 竞争强度与树干生物量比例、粗根生物量比例、活枝生物量比例及针叶生物量比例的关系 Fig.3 Relationships between competition intensity and proportion of different organs (stem, coarse root, living branch and needle) |
竞争强度与胸径、树高均呈显著指数相关(P<0.001),随着竞争强度逐渐增大,胸径和树高均逐渐减小。随着竞争强度增大,胸径年均生长率、树高年均生长率及单株生物量年均生长率均逐渐减小(图 4),而T/R值并不受林木竞争的影响,随着竞争增强,T/R值基本不变。

|
图 4 竞争强度与T/R、胸径年均生长率、树高年均生长率及单株生物量年均生长率的关系 Fig.4 Relationships between competition intensity and T/R, mean annual growth rate of DBH, mean annual growth rate of tree height and mean annual growth rate of individual plant biomass |
研究结果表明:胸径是预测臭冷杉各器官生物量的最可靠变量。这与前人研究结果一致(Zianis et al., 2004;Pajtík et al., 2008)。
利用不同高度树干直径拟合的生物量观测值与预测值之间的残差表现为大个体样木(直径>10 cm)大于小个体样木(直径≤10 cm)。并且利用不同高度树干直径建立的生物量方程均会高估小个体树木的生物量。Litton等(2003)研究美国海岸松(Pinus contorta)发现,利用胸径建立的生物量相对生长方程会高估胸径小于3 cm个体的地下生物量。Bond-Lamberty等(2002)对6种北方树种地上、地下生物量的研究发现,利用胸径建立各器官生物量方程时,拟合曲线大约在胸径3 cm处发生明显的变化。这些研究结果表明,随着树木生长发育,其生物量与胸径的关系可能随之也发生相应的变化,因此,针对不同生长阶段或者不同径级建立相应的生物量方程能更准确地预测林木各器官生物量。
大部分针叶树种,其粗根生物量占单株生物量的比例一般不超过30%,即T/R>2.3 (Kajimoto et al., 2006)。Kurz等(1996)利用260个针叶林样地生物量数据,研究粗根生物量与地上生物量的关系,拟合得到斜率为0.23的线性方程,即T/R的平均值为4.3。本研究表明臭冷杉T/R值为3.17~6.98,均值为4.48,与4.3相近。本研究中T/R与树木年龄、单株生物量、单株生物量年均生长率及树高年均生长率间均无显著关联。
最优分配理论(optimal partitioning theory)认为,T/R的变化反映出植物为了最大化地获取受限资源而调节各器官生物量的分配(Chapin et al., 1987;Casper et al., 1998)。大量研究结果表明:在无林木竞争环境下,有限资源的可获得性影响其地上生物量与地下生物量的比值(Wilson,1988),表现为当营养元素受限时,植物T/R减小,而光资源受限时,植物T/R增大。本研究表明,存在林木竞争时,臭冷杉地上生物量与地下生物量的比值并未发生变化,这与Newton等(1991)对北美黄杉(Pseudotsuga menziesii)及Watt等(2003)对辐射松(Pinus radiata)的研究结果一致。本研究中臭冷杉T/R不受林木竞争的影响,这可能与受压的小个体树木,将更多的生物量分配到活枝和针叶中,以牺牲树干生长为代价而不是减小向根系中的分配有关。生物量优先分配理论认为,激烈的光照竞争可以使得植物增加对叶片的投入而减少对树干木质的投入(Waring et al., 1980)。本研究亦验证了这一理论,表现为随竞争增强,树干生物量比例逐渐减小而枝叶生物量比例增大。受取样难度限制,地下竞争在混交林中的研究还比较少(Bauhus et al., 2000;Curt et al., 2003;Bolte et al., 2004)。在了解臭冷杉粗根生物量的同时,有必要研究其细根结构、细根中养分含量及细根分布。
| [] | 董明. 1997. 陆地生物群落调查观测与分析. 北京, 中国标准出版社: 73-75. |
| [] | 李晓娜, 国庆喜, 王兴昌, 等. 2010. 东北天然次生林下木树种生物量的相对生长. 林业科学, 46(8): 22–32. DOI:10.11707/j.1001-7488.20100804 |
| [] | 刘方炎, 李昆, 廖声熙, 等. 2010. 濒危植物翠柏的个体生长动态及种群结构与种内竞争. 林业科学, 46(10): 23–26. DOI:10.11707/j.1001-7488.20101004 |
| [] | 杨智蕴, 姜子涛, 顾景贤, 等. 1990. 臭冷杉针叶挥发油化学成分研究. 植物学报, 32(2): 133–136. |
| [] | 于贵瑞. 2003. 全球变化与陆地生态系统碳循环和碳蓄积. 北京, 气象出版社: 157-158. |
| [] | 张春雨, 赵秀海. 2008. 随机区块法在空间点格局分析中的应用. 生态学报, 28(7): 3108–3115. |
| [] | Bauhus J, Khanna P K, Menden N. 2000. Aboveground and belowground interactions in mixed plantations of Eucalyptus globulus and Acacia mearnsii. Canadian Journal of Forest Research, 30(12): 1886–1894. DOI:10.1139/x00-141 |
| [] | Bolte A, Rahmann T, Kuhr M, et al. 2004. Relationships between tree dimensions and coarse root biomass in mixed stands of European beech (Fagus sylvatica L.) and Norway spruce [Picea abies (L.) Karst.]. Plant and Soil, 264(1/2): 1–11. DOI:10.1023/B:PLSO.0000047777.23344.a3 |
| [] | Bond-Lamberty B, Wang C, Gower S T. 2002. Aboveground and belowground biomass and sapwood area allometric equations for six boreal tree species of northern Manitoba. Canadian Journal of Forest Research, 32(8): 1441–1450. DOI:10.1139/x02-063 |
| [] | Casper B B, Cahill Jr J F, Hyatt L A. 1998. Above-ground competition does not alter biomass allocated to roots in Abutilon theophrasti. New Phytologist, 140(2): 231–238. DOI:10.1046/j.1469-8137.1998.00271.x |
| [] | Chapin Ⅲ F S, Bloom A J, Field C B, et al. 1987. Plant responses to multiple environmental factors. Bioscience, 37(1): 49–57. DOI:10.2307/1310177 |
| [] | Curt T, Prévosto B. 2003. Root biomass and rooting profile of naturally regenerated beech in mid-elevation Scots pine woodlands. Plant Ecology, 167(2): 269–282. DOI:10.1023/A:1023904912712 |
| [] | Davidson R L. 1969. Effect of root/leaf temperature differentials on root/shoot ratios in some pasture grasses and clover. Annals of Botany, 33(3): 561–569. DOI:10.1093/oxfordjournals.aob.a084308 |
| [] | Delphis F, Levia J R. 2008. A generalized allometric equation to predict foliar dry weight on the basis of trunk diameter for eastern white pine (Pinus strobus L.). Forest Ecology and Management, 255(5/6): 1789–1792. |
| [] | Hosoda K, Iehara T. 2010. Aboveground biomass equations for individual trees of Cryptomeria japonica, Chamaecyparis obtusa and Larix kaempferi in Japan. Journal of Forest Research, 15(5): 299–306. DOI:10.1007/s10310-010-0192-y |
| [] | Kajimoto T, Matsuura Y, Osawa A, et al. 2006. Size-mass allometry and biomass allocation of two larch species growing on the continuous permafrost region in Siberia. Forest Ecology and Management, 222(1-3): 314–325. DOI:10.1016/j.foreco.2005.10.031 |
| [] | Ketterings Q M, Coe R, Noordwijk M v, et al. 2001. Reducing uncertainty in the use of allometric biomass equations for predicting above-ground tree biomass in mixed secondary forests. Forest Ecology and Management, 146(1-3): 199–209. DOI:10.1016/S0378-1127(00)00460-6 |
| [] | Kurz W A, Beukema S J, Apps M J. 1996. Estimation of root biomass and dynamics for the Carbon Budget Model of the Canadian Forest Sector. Canadian Journal of Forest Research, 26(11): 1973–1979. DOI:10.1139/x26-223 |
| [] | Li R, Jiang Z T, Yu J C. 2005. Essential oil composition of the needles of Abies nephrolepis Maxim from China. Flavour and Fragrance Journal, 20(5): 534–536. DOI:10.1002/(ISSN)1099-1026 |
| [] | Litton C M, Ryan M G, Tinker D B, et al. 2003. Belowground and aboveground biomass in young postfire lodgepole pine forests of contrasting tree density. Canadian Journal of Forest Research, 33(2): 351–363. DOI:10.1139/x02-181 |
| [] | Muukkonen P, Makipaa R, Laiho R, et al. 2006. Relationship between biomass and percent cover in understory vegetation of boreal coniferous forest. Silva Fennica, 40(2): 231–245. |
| [] | Nafus A M, McClaran M P, Archer S R, et al. 2009. Multispecies allometric models predict grass biomass in semidesert rangeland. Rangeland Ecology and Management, 62(1): 68–72. DOI:10.2111/08-003 |
| [] | Newton M, Cole E C. 1991. Root development in planted Douglas-fir under varying competitive stress. Canadian Journal of Forest Research, 21(1): 25–31. DOI:10.1139/x91-004 |
| [] | Pajtík J, Konôpka B, Lukac M. 2008. Biomass functions and expansion factors in young Norway spruce [Picea abies (L.) Karst] trees. Forest Ecology and Management, 256(5): 1096–1103. DOI:10.1016/j.foreco.2008.06.013 |
| [] | Quint T C, Dech J P. 2010. Allometric models for predicting the aboveground biomass of Canada yew (Taxus Canadensis Marsh.) from visual and digital cover estimates. Canadian Journal of Forest Research, 40(10): 2003–2014. DOI:10.1139/X10-146 |
| [] | Sebastia M T. 2007. Plant guilds drive biomass response to global warming and water availability in subalpine grassland. Journal of Applied Ecology, 44(1): 158–167. |
| [] | Wang C K. 2006. Biomass allometric equations for 10 co-occurring tree species in Chinese temperate forests. Forest Ecology and Management, 222(1-3): 9–16. DOI:10.1016/j.foreco.2005.10.074 |
| [] | Waring R H, Thies W G, Muscato D. 1980. Stem growth per unit of leaf area: a measure of tree vigour. Forest Science, 26(1): 112–117. |
| [] | Watt M S, Whitehead D, Mason E G, et al. 2003. The influence of weed competition for light and water on growth and dry matter partitioning of young Pinus radiata, at a dryland site. Forest Ecology and Management, 183(1-3): 363–376. DOI:10.1016/S0378-1127(03)00139-7 |
| [] | Wilson J B. 1988. A review of evidence on the control of root: shoot ratio, in relation to models. Annuals of Botany, 61(4): 433–449. DOI:10.1093/oxfordjournals.aob.a087575 |
| [] | Zhang C, Zhao X, Gao L, et al. 2009. Gerder, neighboring competition and habitat effects on the stem growth in dioecious fraxinus mand shurica trees in a northern temperate forest. Annals of Forest Science, 66(8): 812P1–812P9. |
| [] | Zianis D, Mencuccini M. 2004. On simplifying allometric analyses of forest biomass. Forest Ecology and Management, 187(2-3): 311–332. DOI:10.1016/j.foreco.2003.07.007 |