 2001, Vol. 37
文章信息
- 刘广全, 赵士洞, 土小宁, 孙升辉, Gravenhorst G..
- Liu Guangquan, Zhao Shidong, Tu Xiaoning, Sun Sheng hui, Gravenhorst G..
- 秦岭松栎林带生物量及其营养元素分布特征
- DISTRIBUTIONAL CHARACTERISTICS ON BIOMASS AND NUTRIENT ELEMENTS OF PINE-OAK FOREST BELT IN MT.QINLING
- 林业科学, 2001, 37(1): 28-36.
- Scientia Silvae Sinicae, 2001, 37(1): 28-36.
-
文章历史
- 收稿日期:1999-08-18
-
作者相关文章


2. 中国科学院自然资源综合考察委员会 北京 100101;
3. 西北农林科技大学 杨凌 712100;
4. 德国哥廷根大学生物气候研究所
2. Commission for Integrated Survey of Natural Resources, CAS, Beijing 100101;
3. Northwest Science and Technology University of Agriculture and Forestry, Yangling 712100;
4. Institute of Bioclimatology, University Goettingen of Germany
在秦岭山地海拔800~2300 m之间的森林生态系统中, 形成了以油松(Pinus tabulaeformis Carr.)、锐齿栎(Quercus aliena var.acuteserrata Maxim.)和华山松(P.armandi Franch)为优势种的森林类型, 它们以纯林或混交林的形式斑块分布, 海拔1700 m以上锐齿栎常与华山松混交, 而在海拔较低的地方常与油松混交, 形成不同混交林或块状纯林镶嵌分布, 统称为松栎林带, 它们是秦岭林区的主要森林类型和木材资源, 其面积和蓄积占该林区的40%以上(杨茂生等, 1994), 不仅提供大量木材和林副产品, 同时具有很好的保持水土、水源涵养和理水功能(杨茂生等, 1991)以及改良土壤作用。探索秦岭松栎林带生物量及其营养元素含量积累和分布规律, 不仅可以预测立地的生产潜力, 而且为合理地制定经营方案及森林培育积累基础数据, 提供理论依据。
1 研究区自然概况研究区位于北纬33°18′~34°26′, 东经106°04′~110°40′, 海拔800~2300 m的秦岭山地, 相对高差500~1000 m; 年均气温6.1 ℃~8.5 ℃, 最高气温30.0 ℃~40.0 ℃, 最低气温-12.0 ℃~-25.0 ℃, ≥10 ℃的积温2100 ℃~2900 ℃, 年降雨量800~1000 mm, 年蒸发量700~950 mm, 相对湿度65.0%~78.0%, 无霜期160~196 d, 为温湿气候区。林下土壤一般为山地弱灰化棕色森林土和山地棕色森林土, 另有少量黄棕壤、褐土和草甸土, 成土母质多为花岗岩和片麻岩, 土层较厚, 多在40 cm以上, pH值为6.5左右, 质地多为沙壤和壤土, 土壤结构良好, 肥力较高。
秦岭松栎林带林分层次分化明显, 乔木、灌木、草本和活地被层发育完整, 且具有丰富的层间植物。乔木层被分为两个亚层, 第1亚层高度可达12~18 m, 主要树种有锐齿栎、华山松、油松、栓皮栎(Q.variabilis)、槲栎(Q.detata)、马尾松(Pinus massoniana)、山杨(Populus davidiana)、青杨(Populus cathayensis)、青冈(Cyclobanopsis glauca)、漆树(Toxicodendron verniciflum)、椴树(Tilia sp.)、枫杨(Ptercarya stenoptera)、桦木(Betula sp.)等大乔木组成; 第2亚层高度5~11m, 主要种有鹅耳枥(Carpinus sp.)、青杂槭(Acer hersii)、木姜子(Litsea sp.)、三桠乌药(Lindera obtusiloba)、千金榆(Carpinus cordata)、花楸(Sorbus sp.)和稠李(Prunus sp.)等小乔木构成, 乔木树种计20余个。灌木层主要种有箭竹(Sinarundinaria nitida)、毛樱桃(Prunus tomentosa)、榛子(Corylus heterophylla)、中华绣线梅(Neillia sinensis)、鞘柄菝契(Smilax stans)、美丽胡枝子(Leaspedeza formosa)、栓翅卫茅(Euonymus phellomana)、青荚叶(Helwingia japonica)及啬薇属(Rosa sp.)等30多种。草本层发育较弱, 一般高度在50cm以下, 覆盖度通常不大于25%, 主要种有大披针苔草(Carex lance)、崖棕(C. siderosticta)、唐松草(Thalictrum spp.)、鹿蹄草(Pyrola rotundifolia)、糙苏(Phlomis umbrosa)、茜草(Rubia cordigfolia)等。松栎林带各林分层间植物较为丰富, 多达40~60余种, 主要由猕猴桃科、蔷薇科、百合科、毛茛科、葡萄科等组成。
2 研究方法 2.1 生物量测定方法及样品采集测定林分生物量的现存量和生产力, 用标准地-标准木-分层切割法。在秦岭林区的南、北坡, 东、中、西段, 按林分起源、树种组成、林分类型、林龄、密度、海拔、坡向、坡位、坡度和土壤因子及人为干扰程度等, 设置面积为0.04~0.15 hm2的标准地, 测定其立地和林分因子。对标准地进行每木检尺, 确定平均标准木和径阶标准木, 将标准木伐倒, 采用分层切割法测定林木生物量的现存量。
在标准地内, 按“W”形布设5个1 m×1 m样方, 林下植被灌木层分树叶、枝干取样, 草本层取混合样, 根系取混合样, 测定各自生物量; 死地被物分分解层和未分解层, 未分解层又分枯枝、枯叶、枯果和其他组分分别取样测定。同时, 在采集林下植物样和枯枝落叶样的同一地点, 挖5个土壤剖面, 按0~20 cm、20~40 cm、40~60 cm、60 cm以下机械分层取土样, 测定其物理性质、含水率和有机质含量等指标。
2.2 营养元素的测定方法将外业采集的植物样在85 ℃下烘干, 再粉碎、装瓶、贴签待用; 测定营养元素含量时, 105 ℃下烘3 h, 准确称样, 用H2SO4-H2O2凯氏消煮法溶样, 备用测定。把外业采集的土样自然风干, 过1.00 mm土壤筛, 装瓶、贴签备用。
植物样营养元素含量的化学分析方法:N为碱解扩散吸收法; P为钼蓝比色721型分光光度计法; K为火焰光度计法; Ca、Mg为WFD-Y2型原子吸收光谱法。土样营养元素含量化学测定方法:速效N为碱解扩散吸收法; 速效P为NH4F-HCL浸提, 钼蓝比色721型分光光度计法; 速效K为NH4OAC浸提, 火焰光度计法; 全N为H2SO4-CuSO4-Se消煮, 碱解扩散吸收法; 全P为酸熔, 钼蓝比色721型分光光度计法; 全K为NaOH熔融, 火焰光度计法; 全Ca、Mg为Na2CO3碱焙烧, WFD-Y2型原子吸收光谱法。
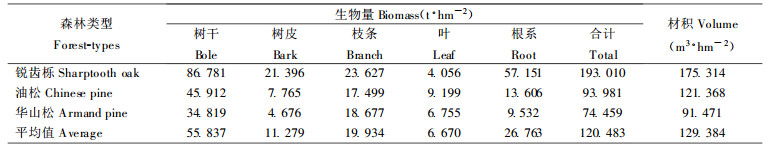
3 结果与分析 3.1 松栎林带不同林分的生物量 3.1.1 乔木层生物量和生产力松栎林带不同林分建群种的生物量、材积、叶面积、树高与胸径和树高或胸径之间存在密切的相关关系, 用回归分析法拟合了材积、树高、叶面积、树干等各器官干重的回归方程, 通过检验方程的估计精度、可靠性都达到实际要求。26龄锐齿栎林、24龄油松林和24龄华山松林乔木层的生物量现存量和木材蓄积量的平均值分别为120.483 t·hm2和129.384 m3·hm-2, 以锐齿栎林的生物量现存量和木材蓄积量最大, 分别高出平均值的60.20%和35.50%, 油松林居中, 华山松林的最小(表 1)(高甲荣, 1987; 张硕新等, 1989; 陈存根等, 1996)。
|
|
松栎林带3林分锐齿栎林年平均生产量和蓄积量最高, 分别达7.423 t·hm-2和6.743 m3·hm-2, 分别高出平均水平54.20%和29.58%, 其次为油松林, 以华山松林的最低(表 2), 这一顺序与林分起源、树种特性、各森林类型的生长发育时期、林分密度及其所处的气候带的特点, 尤其是与水热积累量的大小变化规律有关, 锐齿栎林林龄较油松林和华山松林的大, 而油松林分布的海拔略低于华山松林。
|
|
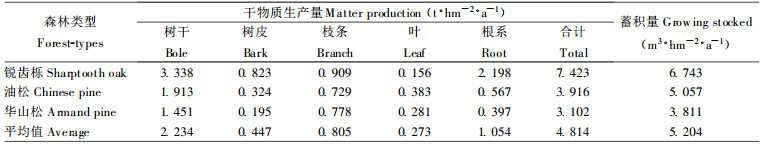
松栎林带3林分现实生产量, 锐齿栎林的干物质现实生产量和木材现实生产量最大, 其值分别达到19.273 t·hm-2·a-1和13.706 m3·hm-2·a-1, 远高于3林分的平均水平13.415 t·hm-2·a-1和10.663 m3·hm-2·a-1, 其次为油松林, 华山松林的最低(表 3)。
|
|

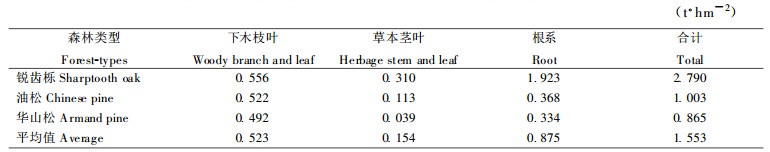
3林分林下植被层生物量现存量平均值为1.553 t·hm-2(表 4), 其中下木枝叶、草本茎叶和根的分别为0.523、0.154和0.875 t·hm-2锐齿栎林林下植被层的生物量分配比例与该林分乔木层的相比, 其根系所占的比重较大, 表明林下植被层具有发达根系, 对水土保持、防治泥石流发生有很重要的意义(杨茂生等, 1991; 陈存根等, 1996)。3林分林下植被层生物量现存量差异较大, 其合计以锐齿栎林最大, 其值达到2.790 t·hm-2, 高出平均值79.65%, 其次为油松林, 华山松林的最小。
|
|
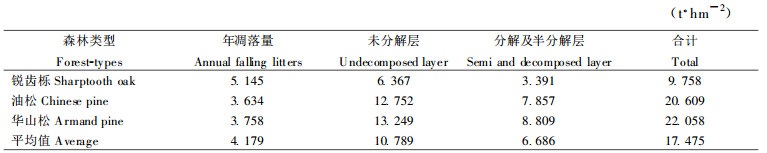
松栎林带3林分林下凋落物现存量平均值为17.475 t·hm-2, 其中未分解层和分解层及半分解层分别占61.74%和38.26%, 以华山松林最高, 油松林居中, 锐齿栎林最低。3林分年凋落物的平均值为4.179 t·hm-2, 以锐齿栎林的最大, 华山松林次之, 油松林的最小。林下凋落物层的积累量主要由年凋落物量及其分解速率控制, 而分解速率受凋落物种类和林地的水热状况限制(表 5)。
|
|
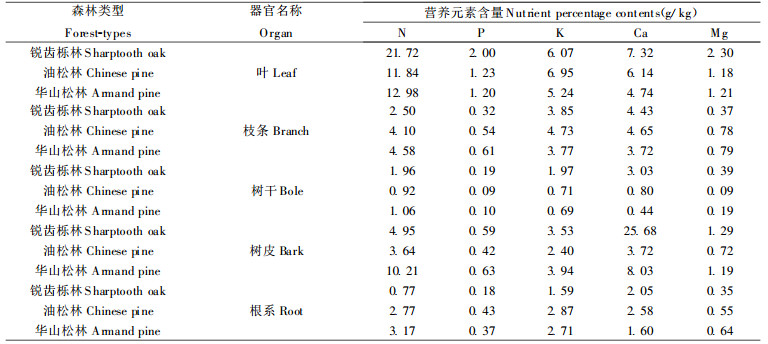
松栎林带3林分各器官营养元素含量均不相同(表 6), 由于锐齿栎林叶营养元素含量高于华山松林和油松林针叶, 可以推断前者对土壤肥力要求较高; 锐齿栎林干和皮中营养元素含量除皮内N和P低于华山松林外, 其它都高于油松林和华山松林的, 锐齿栎林干中Ca的含量分别是油松林和华山松林干的近4倍和7倍(高甲荣, 1987; 张硕新等, 1989; 1996)。锐齿栎林采伐利用过程中, 特别是多代萌芽林, 干和皮营养元素几乎不可能再进入采伐基地, 参与生态系统的营养元素再循环。因此, 锐齿栎林多代连作势必导致营养元素的大量流失, 从而引起林地土壤理化性质的改变, 林地生产潜力逐渐下降(党坤良等, 1997; Binkley, 1987; Davis et al., 1995)。
|
|
松栎林带乔木层营养元素积累量的估算根据乔木层各器官营养元素积累量(y)与胸径(D1.3)或胸径和树高(H)的乘积存在密切的相关关系。结果表明, 锐齿栎林、油松林和华山松林的营养元素积累量及其分配差异较大, 营养元素积累量分别为2139.2、840.1和701.4 kg·hm-2, 分别占该林分生物量的1.11%、0.89%和0.94%, 而且各器官营养元素积累量也存在明显的差异(表 7)。营养元素积累量在3林分乔木层各器官分配差别较大, 由于采伐而引起3林分的营养的损失量分别为1425.6、204.4和197.5 kg·hm-2(Cole, 1986; Davis et al., 1995)。锐齿栎林皮中K、Ca、Mg的积累量分别是油松林和华山松林的4倍、19倍和14倍及5倍, 采伐后干和皮中营养元素在短期内是无法被植物重新利用, 由于生态系统Ca和Mg的流失, 从而引起锐齿栎林下土壤偏酸性(党坤良等, 1996; Binkley, 1987; Davis et al., 1995), 会破坏土壤原有离子的动态平衡, 使其生产力下降(党坤良等, 1996; Bormann et al., 1979; Cole, 1986; Binkley, 1987; Charles, 1992; Davis et al., 1995)。
|
|

松栎林带3林分林下植被营养元素积累量平均值为53.1 kg·hm-2, 其中N、P、K、Ca和Mg积累量分别为14.5、1.6、16.9、17.2和2.8 kg·hm-2, 其大小排序为锐齿栎林>油松林>华山松林, 同时也可以发现3种林分林下植被的营养元素含量也存在一定的差异(表 8)。
|
|

松栎林带3林分凋落物营养元素积累量的平均值为502.5 kg·hm-2, 其中N、P、K、Ca和Mg积累量分别为187.4、11.3、66.1、203.5和34.2 kg·hm-2, 大小为油松林>华山松林>锐齿栎林, 尽管锐齿栎林凋落物的生物量现存量及其营养元素积累量均小于油松林和华山松林, 但其营养元素百分含量却远高于油松林和华山松林, 而油松林和华山松林的差异不大, 说明3林分灰分含量、分解速率和在营养元素循环中作用的差异, 其主要营养元素百分含量也存在一定差异(表 9)。
|
|

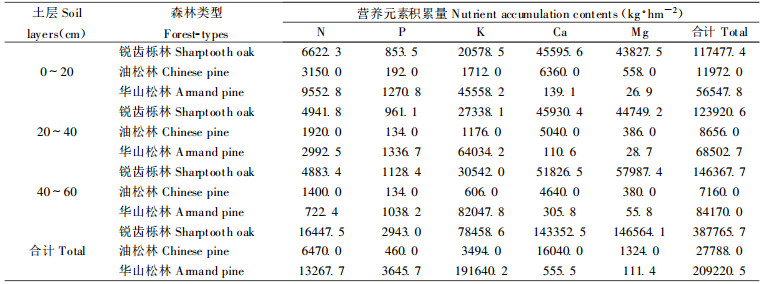
锐齿栎林、油松林和华山松林林地0~60 cm土层营养元素现存量分别为387765.7、27788.0和209220.5 kg·hm-2(表 10)。松栎林带不同林分不同土层营养元素现存量也有较大的差异, 反映了植被与土壤长期相互作用及其协同进化的结果。
|
|
松栎林带3生态系统(包括0~60 cm土层)营养元素总贮藏量达29.2500~390.1739 t·hm-2, 大小为锐齿栎林>华山松>油松林, 土层中营养现贮量占总量的93.10%~99.39%, 植被层和凋落物层的仅占0.57%~3.00%和0.10%~1.99%(表 11); 系统各层次营养元素积累量的排序为:土壤层>>乔木层>>枯枝落叶层>灌木层>草本层, 植被层及枯枝落叶层营养元素积累量之和不足总量的5.0%(高甲荣, 1987; 张硕新等, 1989; 1996;Binkley, 1987)。
|
|

锐齿栎林、油松林和华山松林营养元素生物循环各具特色(表 12), 营养元素年吸收量分别为334.4、147.2和264.3 kg·hm-2, N和P年吸收量排序为华山松林>锐齿栎林>油松林, 而K、Ca和Mg年吸收量排序是锐齿栎林>华山松林>油松林, 说明油松是一种比较耐瘠薄的树种; 3林分营养元素年归还量分别为195.5、66.9和84.1 kg·hm-2, 不同营养元素大小排序也不相同; 3林分营养元素年存留量分别为138.8、80.4和180.2 kg·hm-2, 其中N、P、K和Mg年归还量为华山松林>锐齿栎林>油松林, Ca的年存留量是锐齿栎林>华山松林>油松林; 3林分营养元素生物循环的平均归还率分别为0.585、0.454和0.318, 可见锐齿栎林不仅对林地营养元素要求比油松林和华山松林高, 而且营养元素的循环速率较油松林和华山松林快(高甲荣, 1987; 张硕新等, 1989)。
|
|

秦岭26龄锐齿栎林、24龄油松林和24龄华山松林乔木层的生物量现存量和木材蓄积量平均值分别为120.483 t·hm-2和129.384 m3·hm-2, 锐齿栎林的最大, 分别高出平均值的60.20%和35.50%, 华山林的最小。3林分林下植被层的生物量现存量平均值为1.553 t·hm-2, 锐齿栎林的最大, 高出平均值79.65%, 华山松林的最小, 仅为平均值的55.70%;锐齿栎林林下植被层有发达根系, 对水土保持, 防治泥石流有重要的意义。
松栎林带3林分中, 锐齿栎林年平均生产量和蓄积量最高, 分别达7.423 t·hm-2·a和6.743 m3·hm-2·a, 分别高出平均值54.20%和29.58%, 油松林居中, 华山松林的最低; 锐齿栎林干物质现实生产量和木材现实生产量也最大, 分别达到19.273 t·hm-2·a和13.706 m3·hm-2·a, 远高于3林分的平均水平13.415 t·hm-2·a和10.663 m3·hm-2·a, 其次为油松林, 华山松林的最低。
3林分林下凋落物现存量平均值为17.475 t·hm-2, 其中未分解层和分解层及半分解层分别占61.74%和38.26%, 华山松林最高, 锐齿栎林最低, 后者仅为平均值的55.84%; 3林分年凋落物平均值为4.179 t·hm-2, 锐齿栎林的年凋落物量是华山松林和油松林的1.4倍, 但凋落物现存量不到华山松林和油松林的一半。
松栎林带3林分各器官营养元素的含量均不相同, 总体上锐齿栎林营养元素含量高于油松林和华山松林, 锐齿栎林干Ca含量分别是油松林和华山松林干的近4和7倍, 采伐利用时, 特别对于多代萌芽林, 可能会导致林地营养元素大量流失, 特别是Ca, 从而引起林地土壤理化性质的改变, 林分生产潜力逐渐下降。
锐齿栎林、油松林和华山松林乔木层营养元素积累量分别为2139.2、840.1和701.4 kg·hm-2, 不同林分不同营养元素的积累量差别较大, 采伐引起3林分Ca的损失量, 锐齿栎林达50%, 而油松林和华山松林的仅有24%和28%。
松栎林带3林分林下植被层和凋落物层的营养元素积累量的平均值分别为53.1和502.5 kg· hm-2, 其中N、P、K、Ca和M g积累量的平均值分别达14.5、1.6、16.9、17.2、2.8和187.4、11.3、66.1、203.5、34.2 kg·hm-2, 其大小排序分别为锐齿栎林>油松林>华山松林和油松林>华山松林>锐齿栎林。
锐齿栎林、油松林和华山松林林地土壤0~60 cm层次营养元素现存量值分别达到387765.7、27788.0和209220.5 kg·hm-2, 林地土壤中N、P、K、Ca和M g的现存量分别为16467.5、2943.0、78458.6、143352.5和146564.1 kg· hm-2, 6470.0、460.0、3494.0、16040.0和1324.0 kg ·hm-2, 13267.7、3645.7、191640.2、555.5和111.4 kg·hm-2。
松栎林带3林分(包括0~60 cm土壤)营养元养总贮量达到29.2500~390.1739 t·hm-2, 其大小为锐齿栎林>华山松林>油松林, 土层营养现贮量为该系统总量的93.10%~99.39%, 植被层和凋落物层仅占0.57%~3.00%和0.10%~1.99%。
锐齿栎林、油松林和华山松林营养元素的年吸收量、归还量、存留量分别为344.4、147.2和264.3, 195.5、66.9和84.1及138.8、80.4和180.2 kg·hm-2, 不同林分各营养元素的年吸收量、归还量和存留量也有一定的差异。3林分营养元素生物循环的平均归还率分别为0.585、0.454和0.318, 可见锐齿栎林不仅对林地营养元素要求比较高, 而且其循环较快。
陈存根, 等. 1996. 秦岭火地塘林区主要森林类型的现存量和生产力. 西北林学院学报, 11(Suppl.): 92-102. |
陈存根, 等. 1996. 秦岭锐齿栎林的生物量和生产力. 西北林学院学报, 11(Suppl.): 103-114. |
党坤良, 等. 1996. 秦岭南坡锐齿栎林、松栎混交林林地土壤特性研究. 西北林学院学报, 11(Suppl.): 127-131. |
党坤良, 等. 1997. 关于秦岭火地塘林区锐齿栎林林地土壤酸化特征的研究. 西北林学院学报, 12(1): 1-7. |
高甲荣. 1987. 秦岭火地塘林区油松人工林营养元素生物循环的研究. 西北林学院学报, 2(1): 23-35. |
杨茂生, 等. 1994. 秦岭森林分类与主伐更新. 西安: 陕西科学技术出版社, 46-73.
|
张硕新, 等. 1989. 华山松人工林养分循环. 西北林学院学报, 4(1): 22-27. |
张硕新, 等. 1996. 秦岭火地塘林区主要森林类型的营养循环. 西北林学院学报, 11(Suppl.): 115-120. |
Binkley D. 1987. Forest Nutrition Management. New York: John Wiley and Sons, 1-174.
|
Bormann F H et al.Patterns in a Forested Ecosystem, (Ecological Studies 8), Springer-Verlag New York, 1979: 1~253
|
Charles J Krebs.ECOLOGY-The Experim ental Analysis of Distribution and Abundance.Third Edition.Harper Collins Publishers, 1992: 668~702
|
Cole D W.Nutrient Cycling in World Forests.Forest Site and Productivity.M artinus Nijhoff Publishers, 1986: 103~115
|
Davis G W and Richardson D M.Mediterranean-Type Ecosystems, The Function of Biodiversity(Ecologicl Studies 109), Springer-Verlag Berlin Heideberg, 1995: 1~366
|