 2009, Vol. 45
文章信息
- Hou Zhuqiang, Fei Benhua, Zhao Rongjun, Wan Hui, Chen Guihua
- 侯祝强, 费本华, 赵荣军, 万辉, 陈桂华
- Effect of Flow Rate and Pressure Difference on Determination of Air Permeability of Masson Pine
- 流速与压强对马尾松木材气体渗透性的影响
- Scientia Silvae Sinicae, 2009, 45(2): 98-104.
- 林业科学, 2009, 45(2): 98-104.
-
文章历史
- 收稿日期:2007-08-23
-
作者相关文章


2. 国家林业局北京林业机械研究所 北京 100029;
3. Forintek Canada Corp.,319,rue Franquet,Sainte-Foy,Quebec G1P 4R4,Canada;
4. 中南林业科技大学 长沙 410004
2. Beijing Forestry Machinery Research Institute of State Forestry Administration Beijing 100029;
3. Forintek Canada Corp., 319, rue Franquet, Sainte-Foy, Quebec G1P 4R4, Canada;
4. Central South University of Forestry & Technology Changsha 410004
Moisture or aqueous solutions moving into and out of log, lumber, and wood chip was depended upon permeability of wood because it determines the magnitude of the bulk flow of a fluid through wood (Erickson, 1970; Siau, 1995). Permeability has been studied extensively in drying of wood, treatablilty of wood, and impregnation of wood for chemical pulping (Jankowsky et al., 2005; Mouchot et al., 2002; Rhatigan et al., 2003; Rice et al., 1996). The nonlinear flow component is produced owing to kinetic energy loss of gas as it passes through short capillaries in softwood and hardwood (Wiley et al., 1974; Siau et al., 1979). Kuroda et al. (1988) conducted a series of air permeability measurements of softwoods and hardwoods with different flow rates. They found that the permeability of loblolly pine, Douglas-fir, and white spruce decreased with flow rate. The decreased permeability indicated presence of nonlinear flow. Lu et al. (1999) studied non-darcy air flow in wood. Based on their study, the superficial specific permeability of red oak decreased with the increase of the flow rates and nonlinear flow occurred in red oak heartwood at high flow rate. There is a high degree of correlation between gas and liquid permeability (Choong et al., 1974). Comstock (1967) conducted measurements for permeability of sapwood and heartwood of Picea glauca wood with nonswelling liquids and nitrogen gas and found out that specific permeability were equal when the viscosity difference and the molecular slip flow of the gas were accounted for. Gas permeability of wood is often measured due to the fact that the procedure for the measurement of gas permeability of wood is much simpler than that for the measurement of liquid permeability of wood (Siau, 1995).
Limited literature review shows that no study has been yet done to examine the effect of flow rate or the pressure difference between ends of specimen on the determination of gas permeability of wood specimen. The purpose of this study is to investigate the effect of flow rate on the longitudinal air permeability of wood specimen, and to present a method to estimate the effect of the flow rate or the pressure difference on the wood air permeability.
1 Materials and methods 1.1 MaterialsPlantation Masson Pine (Pinus massoniana), growing in Daqingshan, Guangxi of China, was chosen in this study. Specimens for measurement of the longitudinal air permeability were prepared from 1.5 m long and air-dried logs, which were cut from the tree height of 2.3 m above the tree bottom. Six specimens were obtained from six logs, one log for one specimen. The radial and tangential surfaces of specimens were coated with shellac and varnish. Specimens were put in a conditioning chamber to maintain 12% moisture content before the measurement was made.
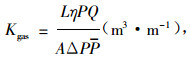
1.2 MethodsSpecific gas permeability of wood specimen is described by (Siau, 1995):
|
(1) |
where Kgas is specific gas permeability or gas permeability; L is the length of specimen parallel to the direction of flow (m); η is the dynamic viscosity of gas (Pa·s); P is the gas pressure at which flow rate of gas Q is measured; ΔP is the pressure difference between the ends of wood specimen (Pa); P is the average pressure cross wood specimen (Pa).
The setup (Fig. 1) was used for measurement of air permeability of specimens. Air in high-pressure air reservoir served for the permeating gas and moves longitudinally through tested specimen. Gas filter (d in Fig. 1) was used to remove solid particles in the air. The flow rate of the air was regulated by gas pressure regulator (c in Fig. 1). The pressure difference between the ends of specimen and the flow rate of air came out of the specimen were measure with digital gas differential pressure meter (e in Fig. 1) and digital flow meter (g in Fig. 1).The air permeates specimen, and then entries into atmosphere after it goes through the flow meter. Testing demonstrated that there was no pressure difference between the input and the output of flow meter when the flow rate was in the range of 0.08 to 0.60 min-1 (1.3×10⁻⁶ to 1.0×10⁻⁵ m3·s-1). The air pressure at the output of specimen and pressure (P) in equation (1) were both equal to atmospheric pressure, and therefore the air pressure at the input of specimen was the sum of the pressure difference ΔP and atmospheric pressure P0. The average pressure P can be calculated by:

|
(2) |

|
Fig.1 Schematic diagram of the setup used for the measurement of air permeability of masson wood specimen a: Air reservoir; b: Needle valve; c: Gas pressure regulator; d: Gas filter; e: Gas differential pressure meter; f: Specimen; g: Flow meter. Bold lines between components of the setup indicate pipelines linked the components. |
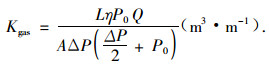
Replacing P with P0 and combining Eq. (1) with Eq. (2), it gives:
|
(3) |
During the measurement, the flow rate was regulated at a regular interval of 0.02 min-1 (3.3×10⁻⁶ m3·s-1) in the investigated range. Twenty-seven pairs of Q and ΔP data were obtained for each specimen, corresponding to twenty-seven different flow rates. Measurement of P0 was made using a mercurial barometer. The length L and the cross-section area A of specimen were measured with a vernier caliper. The dynamic viscosity of air η was calculated with temperature of air and quoted from Bolton et al. (1981).
2 Results and discussionPlots of flow rate Q vs. pressure difference ΔP from measurements were presented in Fig. 2 for six investigated Masson Pine specimens when air moves longitudinally through the specimens. Each of the plots could be divided into segment AB and BC in the investigated range of flow rate. There was a linear relationship between flow rate and pressure difference in the segment AB and a nonlinear relationship in the segment BC. Regression equations for the relationship of Q with ΔP in segment AB and BC were listed in Tab. 1 for the six specimens.

|
Fig.2 Plot of flow rate vs. pressure difference during gas moving longitudinally through six specimens Each black square in Fig. a~f represents the flow rate-pressure difference pair; AB segment and BC segment of the plot in Fig. a~f indicate the linear and nonlinear segments of the plot, respectively; Solid line in Fig. a~f is the extension of AB segment of the plot. |
|
|
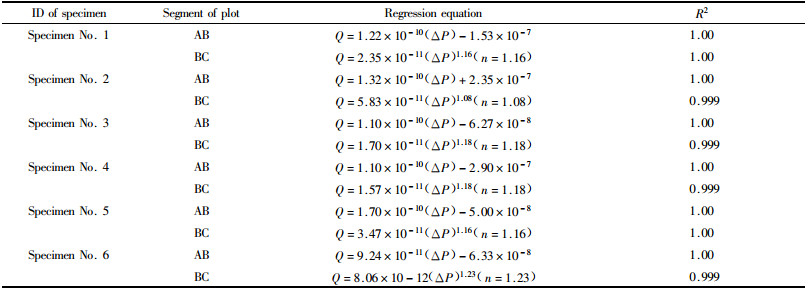
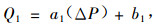
The general form of the regression equations in segment AB was
|
(5) |
and the general form in segment BC was
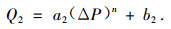
|
(6) |
Where a1, a2, b1, b2, and n in equation (5) and (6) are constants. R2 of the regression equations in Tab. 1 was equal to or very close to unit, indicating that the regression equations worked well for the actual relationships between Q and ΔP in the investigated flow rate range.
Among six investigated specimens, specimen No. 5 had the largest linear flow rate range, which Q exhibited linear relationship with ΔP, and the range was from 1.3×10⁻⁶ to 3.3×10⁻⁶ m3·s-1 (0.08 to 0.20 min-1). The flow rate range of the linear relationship ranked the second position for specimen No. 1, 2, and 3, and was from 1.3×10⁻⁶ to 3.0×10⁻⁶ m3·s-1 (0.08 to 0.18 min-1). Specimen No. 4 and 6 has the lowest flow rate range from 1.3×10⁻⁶ to 2.7×10⁻⁶ m3·s-1 (0.08 to 0.16 min-1). Average of Q exhibited a linear relationship with ΔP has a value of 3×10⁻⁶ m3·s-1, which was the same as the one of several hardwoods and softwoods investigated by Kurod et al. (1988).
There is a nonlinear flow due to the kinetic energy loss of air except for linear flow when air moves through specimen (Siau et al., 1979; Siau, 1995). The compression of air is not intense because Q (or ΔP) is low in the beginning of air movement in wood specimen, and therefore the kinetic energy loss is not so big to cause a perceptible nonlinear flow. The nonlinear flow increases and the entire flow takes on characteristic of nonlinear flow when certain value of Q (or ΔP) is reached.In this study, the flow rate exhibits a nonlinear relation with the pressure difference for the six investigated specimen when Q larger than 3.3×10⁻⁶ m3·s-1.
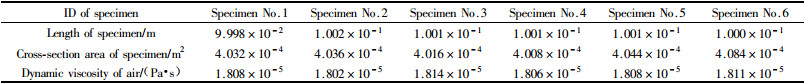
Tab. 2 showed the length, the cross-section area, and dynamic viscosity of air for measurement of the longitudinal air permeability of every specimen. A constant atmospheric pressure of 102.46 kPa was recoded during the measurement of the air permeability for all specimens. From Eq. (4), the longitudinal air permeability of specimen at each pair of Q and ΔP data was determined with parameters, the dynamic viscosity of air, and the atmospheric pressure (Tab. 2). Tab. 3 showed the longitudinal air permeability at twenty-seven pairs of Q and ΔP data from six Masson Pine specimens. Air permeability of a specimen at different flow rates or the pressure differences was different from one another. It meant that Q or ΔP had effect on the determination of air permeability of the investigated specimen. Air permeability of specimen would differ, even for the same specimen, when measurement was carried out at different Q and ΔP.
|
|
|
|

Inserting equation (5) and (6) into equation (3), respectively and rearranging them, that yields
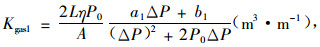
|
(7) |
and
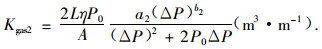
|
(8) |
Differentiating equation (7) and (8) with respect to ΔP turn out

|
(9) |
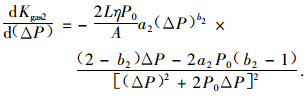
|
(10) |
Where constant a1 is a positive number in six regression equations, while constant b1 is a negative number in the regression equations for specimen No. 1, 3, 4, 5, and 6 and a positive number in the regression equation for specimen No. 2 (as shown in Tab. 1). In the case that constant b1 is positive number, the numerator of the second term in the right side of equation (9) is larger than zero and dKgas1/d(ΔP) is less than zero. Thus, Kgas1 of specimen No. 2 decreases with increasing ΔP (or Q) in the linear flow range. In the case that constant b1 is negative number, the numerator of the second term in the right side of equation (9) is either larger or less than zero depending on values of constant a1, constant b1, and pressure difference ΔP. dKgas1/d(ΔP) can be greater or smaller than zero, and Kgas1 will increase or decrease with increasing ΔP. dKgas1/d(ΔP) is less than zero for 3, 5, and 6 and air permeability of them decreases continuously in their respective linear flow range, like specimen No. 2. dKgas1/d(ΔP) is greater than zero for specimen No. 4 and its air permeability increases with increasing ΔP. For specimen No. 1, dKgas1/d(ΔP) is larger than zero in the first half of linear flow range and less than zero in the second half. Accordingly, its permeability increases in first half and decreases in the second half. Air permeability of specimen No. 2 is reduced in its linear flow range and has the maximum variation among the six specimens. Specimen No. 1 takes the minimum relative variation in linear flow range.
Constant a2 is a positive number smaller than one, and constant b2 is a positive number greater than one. The first term in the numerator of the right side of equation (10) is greater than zero. The second term in the numerator is smaller than zero. The sign of dKgas2/d(ΔP) is determined by values of a2, b2, and ΔP. Constant b2 has a value of 1.08 for the regression equation in segment BC for specimen No. 2. It is slightly over one so that the first term is greater than the second one in the numerator of the right side of Eq. (10). dKgas2/d(ΔP) of specimen No. 2 is negative at outset of its nonlinear flow range. Air permeability of specimen No. 2 decreases in its nonlinear flow range except that a couple of waves exist in air permeability. Constant b2 of other five is 1.16, 1.18, and 1.23. Such values of b2 enable the second term to be greater than the first one in the numerator of the right side of equation (10) at the outset of the nonlinear flow range. The first term increase with increasing ΔP and can exceed the second one when ΔP is equal to some value. In this case, dKgas2/d(ΔP), as a positive number, reduces gradually at first and becomes a negative number with some value of ΔP. Air permeability of these specimens increase at the outset of their respective nonlinear flow range, and then decrease with increasing when ΔP (or Q) is greater than some value. Results from Tab. 3 show that there was an increment in air permeability for specimen 1, 3, 4, 5, and 6 at the outset of their nonlinear flow range. The increment is the lowest for specimen No. 4 among the five specimens. Except specimen No. 5, air permeability of specimen trends to decreasing in a fluctuant mode up to the maximum flow rate after a rising of the air permeability in the beginning of nonlinear flow range. Air permeability of specimen No. 5 increased at first and decreased in fluctuant mode in the end after it went through two cycles of from increased to decreasing in the nonlinear flow range.
The maximum air permeability of specimen No. 1, 2, 3, and 6 occurred in the linear flow range, while the maximum air permeability of specimen No. 4 and 5 occurred in the nonlinear flow range. The minimum air permeability of specimen No. 3 and 6 was within the linear flow range, while the minimum air permeability of specimen No. 1, 2, 4, and 5 was within the nonlinear flow range. The relative differences between the maximum and minimum air permeability were shown in Tab. 3. Specimen No. 2 had the largest relative difference, 34.2%, among the six specimens other relative difference had a scope from 3.1% to 5.7%.
In order to estimate the effect of pressure difference on air permeability, the weighted average of air permeability was calculated. Values of the weighted average were listed in Tab. 3 for each specimen. The calculation for the weighted average of air permeability was made from the following equation:

|
(11) |
where i is the index of the sum; Kgasi is the air permeability of specimen at i-th pair of Q and ΔP; n is the total number of air permeability Kgas; γi is the i-th weighted factor and it is determined by
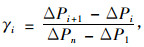
|
(12) |
where ΔPi and ΔPi+1 are the pressure difference at and i-th and (i+1)-th pair f Q and ΔP; ΔP1 and ΔPn are the pressure difference at first and at n-th pair of Q and ΔP.
In a similar way of determination of γi from equation (12), a weighted factor based on flow rate can be obtained with each interval of flow rate and the difference between the initial and final flow rate. Since there is a regular interval in adjacent flow rates when the measurement of the longitudinal air permeability was made in this study, the weighed factor based on flow rate is identical for the air permeability with different flow rates. It means that the weighed average is equal to the arithmetic one. The arithmetic average of the permeability can be regarded as the weighted average with respect to weighted factor based on flow rate. Result listed in Tab. 3 showed that the weighted average of the permeability is very close to the arithmetic average for every specimen.
In the measurement of gas permeability of wood specimen, Q and ΔP can not vary with their respective regular intervals simultaneously. In a case that either of Q and ΔP varies at a regular interval in measurement of the permeability of specimen, the arithmetic average other than the weighed average can be used as the permeability. If neither of flow rate and the pressure difference varies at a regular interval, the weighted average will only be suitable as the permeability with the effect of flow rate or the pressure difference has been taken into account.
The relative difference between the maximum and minimum of the longitudinal air permeability was from 3.1% to 5.7% for five specimens, but a specimen had the relative difference as high as 34.2%. Q or ΔP affects gas permeability of specimen. It suggests that measurement of gas permeability of wood specimen should be made at different Q or ΔP. Arithmetic or weighed average of gas permeability from the measurement can be taken as gas permeability of the tested wood specimen. The gas permeability of wood specimen varies with Q or ΔP, so the range of Q or ΔP in which the gas permeability was measured needs to be indicated together.
3 ConclusionThe investigated range of flow rate could be divided into linear flow segment and nonlinear flow segment in measurement of the longitudinal air permeability for six masson pine specimens. In the linear segment of the flow rate range, flow rate exhibited a linear relationship with pressure difference, while there was a nonlinear relationship of flow rate with pressure difference in the nonlinear segment of the flow rate range. There was no a perceptible nonlinear flow component in the beginning of air movement in wood specimen. The nonlinear flow component increases with increasing of pressure difference ΔP (or flow rate Q), and so the entire flow had a characteristic of nonlinear flow when the flow rate Q was larger than 3.3×10⁻⁶ m3·s-1.
Of six investigated specimens, the relative difference between the maximum and minimum of the longitudinal air permeability was from 3.1% to 5.7% for five specimens, while one specimen had the relative difference as high as 34.2%. Therefore, the effect of pressure difference (or flow rate) on the permeability of a specimen should be considered. It was suggested that the measurement of gas permeability of wood specimen be made at different flow rates or different pressure differences. Arithmetic or weighed average of air permeability from the measurement could be taken as air permeability of the tested wood specimen, together with showing the range of flow rate or pressure in which measurement of air permeability of wood specimen was made.
Bolton A J, Beele P M. 1981. The application of orifice flow and drag theory to the axial flow of gases through conifer wood. Wood Sci Technol, 15(3): 179-188. DOI:10.1007/BF00353470 |
Choong E T, Tesoro F O. 1974. Permeability of twenty two small diameter hardwoods growing on southern pine sites. Wood and Fiber, 6(1): 91-101. |
Comstock G L. 1967. Longitudinal permeability of wood to gases and nonswelling liquids. Forest Prod J, 17(10): 41-46. |
Erickson H D. 1970. Permeability of southern pine. Wood Science, 2(3): 149-157. |
Jankowsky I P, dos Santos G R V. 2005. Drying behavior and permeability of Eucalyptus grandis lumber. Maderas Cienc Tecnol, 7(1): 17-21. |
Kurod N, Siau J F. 1988. Evidence of nonlinear flow in softwoods from wood permeability measurements. Wood Fiber Sci, 20(1): 162-169. |
Lu J, Avramidis S. 1999. Non-Darcian air flow in wood, Part 2. Nonlinear flow. Holzforschung, 53(1): 77-84. |
Mouchot N, Zoulalian A. 2002. Longitudinal Permeability and Diffusivity of Steam in Beech Determined with a Wicke-Kallenbach-Cell. Holzforschung, 56(3): 318-326. |
Rhatigan R G, Milota M R, Morrell J J, et al. 2003. Effect of high temperature drying on permeability and treatment of western hemlock lumber. Forest Pro J, 53(9): 55-58. |
Rice R W, D'Onofrio M. 1996. Longitudinal air permeability measurements from eastern white pine, red spruce, and balsam fir. Wood Fiber Sci, 28(3): 301-308. |
Siau J F, Petty J A. 1979. Correction for capillaries used in permeability measurements of wood. Wood Sci Technol, 3(2): 179-185. |
Siau J F. 1995. Wood: Influence of moisture on physical properties. Dept of Wood Sci and Forest Prod, Virginia Polytechnic Institute and State Univ., Blacksburg, V A.
|
Wiley A T, Choong E T. 1974. Some aspects of non-Darcy behavior of gas flow in wood. Wood Fiber Sci, 6(4): 298-304. |