
Underwater Gas Leakage Flow Detection and Classification Based on Multibeam Forward-Looking Sonar
https://doi.org/10.1007/s11804-024-00563-7
-
Abstract
The risk of gas leakage due to geological flaws in offshore carbon capture, utilization, and storage, as well as leakage from underwater oil or gas pipelines, highlights the need for underwater gas leakage monitoring technology. Remotely operated vehicles (ROVs) and autonomous underwater vehicles (AUVs) are equipped with high-resolution imaging sonar systems that have broad application potential in underwater gas and target detection tasks. However, some bubble clusters are relatively weak scatterers, so detecting and distinguishing them against the seabed reverberation in forward-looking sonar images are challenging. This study uses the dual-tree complex wavelet transform to extract the image features of multibeam forward-looking sonar. Underwater gas leakages with different flows are classified by combining deep learning theory. A pool experiment is designed to simulate gas leakage, where sonar images are obtained for further processing. Results demonstrate that this method can detect and classify underwater gas leakage streams with high classification accuracy. This performance indicates that the method can detect gas leakage from multibeam forward-looking sonar images and has the potential to predict gas leakage flow.Article Highlights● Dual-tree complex wavelet transform is used to extract the image features of multibeam forward-looking sonar.● A modified VGG-16 convolutional neural network model is used to monitor and classify the flow rates of underwater gas leaks based on sonar image features.● An experimental setup for underwater gas leakage is constructed, and underwater gas flow classification tests are performed based on the experimental data. -
1 Introduction
Offshore carbon capture, utilization, and storage (CCUS) technology has received widespread attention, and storing CO2 in the ocean is considered an important strategy to reduce greenhouse gas emissions into the atmosphere (Pachauri et al., 2014; Li et al., 2021; Leighton and White, 2011). With the increasing number of pipelines transporting natural gas and offshore CCUS activities in the oceans, gas leakage is an important concern. Therefore, effective means and techniques to monitor these leaks are essential (Fawad and Mondol, 2021). Acoustic methods for detecting gas leakage have gained more attention because of their wider adaptability to variable underwater conditions, whereas optical methods are susceptible to ambient light and water turbidity.
At present, two primary approaches are used to acoustically monitor gas leakage. The first is the active method that employs active sonar, like multibeam sonar with detecting technologies, to monitor gas leakage (Xu et al., 2020; Zhang et al., 2022). The second is the passive method that utilizes hydrophones to measure the acoustic signals of the potential leakage point at close range to detect gas leakage (Li et al., 2020; 2021). In recent years, the application of multibeam sonar within active sonar systems, owing to its relatively high resolution in imaging, has garnered substantial attention and is becoming a potential tool for detecting underwater gas leakage (Veloso et al., 2015; Urban et al., 2016; Zhao et al., 2020).
Water column images (WCIs) in multibeam sonar can provide 2D information about gas plumes (Gee et al., 2012). Currently, gas plumes are identified from WCI images by manually inspecting these images for specific characteristics under many conditions. These characteristics include the echo intensities, the distinct sizes and shapes, and others of gas plumes (Colbo et al., 2014). To improve detection, scholars and enterprises have proposed various methods for identifying bubble plumes based on WCIs. Veloso et al. (2015) and Urban et al. (2016) used an intensity thresholding-based technique to process WCIs and detect gas plumes from filtered images. Zhao et al. (2017) detected bubble plumes based on the echo intensity difference between the target and noise; however, the complex marine environment noise affects threshold separation, resulting in low detection accuracy. Xu et al. (2020) used the optical flow method in conjunction with the kinematic characteristics of rising bubbles to detect bubble plume targets. Nonetheless, the target detection methods for a single image proposed above only consider intensity differences from noise or other interference without accounting for contour features. Methods based on motion features, like optical flow, rely on frame-to-frame comparisons for motion detection analysis. High frame rate and steady sampling are required, but they are difficult to achieve in some conditions.
With the widespread application of unmanned platforms such as autonomous underwater vehicles (AUVs) in ocean surveys (Yu and Wilson, 2023), the operational capabilities of their main payloads, such as forward-looking sonar, are receiving special attention. Forward-looking sonar can synthesize images of satisfactory resolution at high frequencies (Zacchini et al., 2020). However, research on utilizing forward-looking sonar for underwater leakage monitoring remains limited. A key challenge encountered in this domain is the significant impact of interference caused by seabed reverberation on the images produced by forward-looking sonar. Lightweight sonar equipment alone often cannot provide accurate observations, requiring large vehicles to carry multiple sensor sources into the submerged area, complicating underwater target identification. De Moustier et al. (2013) maneuvered a remotely operated vehicle (ROV) with a 500 kHz forward-looking multibeam sonar mounted at an angle to avoid seabed reverberation interference near the leakage source, combining optical techniques for manual identification. Ren et al. (2023) installed a system of two forward-looking sonar units with different frequencies on an ROV, facilitating targeted observations close to the underwater leakage site. One sonar unit was strategically oriented vertically to obtain high-quality acoustic images of bubbles and minimize interference caused by underwater environmental noise.
In recent years, deep learning approaches have increasingly become focal points in classification and recognition (Valdenegro-Toro, 2016). Driven by sample data training, these methods automatically learn image features through a data-driven approach, overcoming the limitations of manual feature patterns, which are simplistic but have weak discriminative capabilities. With simple image sample inputs, these methods can achieve high accuracy in recognition results. Deep learning has rapidly developed, achieving tremendous success in image processing areas such as classification and segmentation. Various classic deep learning network models, such as AlexNet, GoogleNet, VGGNet, and ResNet, have been proposed and widely applied (Ju and Xue, 2020). Their wide application has provided new perspectives and methods for sonar image classification, with many researchers applying deep learning techniques to image classification.
Considering the practical application of forward-looking sonar on AUVs, this study proposes a detection and flow classification method for underwater gas leakage that combines the dual-tree complex wavelet transform (DT-CWT) with deep learning in a single frame. This approach addresses the detection of weak scatterers of leaked gases in the presence of seabed reverberation and the classification of gas leakage flow based on localized information from rising bubbles.
In this study, a preliminary underwater gas leakage modeling device was constructed and applied in a pool environment simulation. The second section of this paper focuses on the principles of image processing using the DT-CWT, discussing image enhancement and detection techniques centered around image decomposition and reconstruction. The third section introduces feature extraction principles for classification based on processed images and presents classification techniques for gas leakage situations based on deep learning theories using a physical model of gas leakage. The fourth section elaborates on the experimental system design and presents experimental results demonstrating the superiority of intelligent monitoring for underwater gas leakage. The potential occurrence of target deviation in the actual work environment is also discussed.
2 Sonar image feature extraction and enhancement based on DT-CWT
2.1 Overview of DT-CWT
The DT-CWT is an advanced algorithm rooted in wavelet transform principles (Selesnick et al., 2005; Kingsbury, 1998). Similar to the short-time Fourier transform, DT-CWT provides frequency domain information and retains a portion of the time domain information, forming a basis for time-frequency signal analysis. The transformation involves designing a dual-tree filter based on specific rules, preserving the advantages of general complex wavelets, and facilitating flawless image reconstruction. This approach has proven successful in several applications, such as image denoising and texture enhancement (Mumtaz et al., 2006; Li et al., 2017; Arun et al., 2023).
The DT-CWT comprises two tree filters (Figure 1), cor‐ responding to high-pass and low-pass filters, with a half-sampling delay between the corresponding filters, ensuring robust translation invariance. The sampling frequencies of the two tree filters are identical, and the delay between them precisely amounts to one sampling interval. This arrangement ensures that the first level down-sampling in the imaginary tree captures the sampled values discarded by the down-sampling in the real tree. It not only achieves translation invariance in the complex wavelet transform but also avoids extensive computations, making it easy to implement. This study employs the DT-CWT to decompose for‐ ward-looking sonar images, utilizing the information from sub-band images at different levels for the recognition and feature extraction of underwater bubble images.
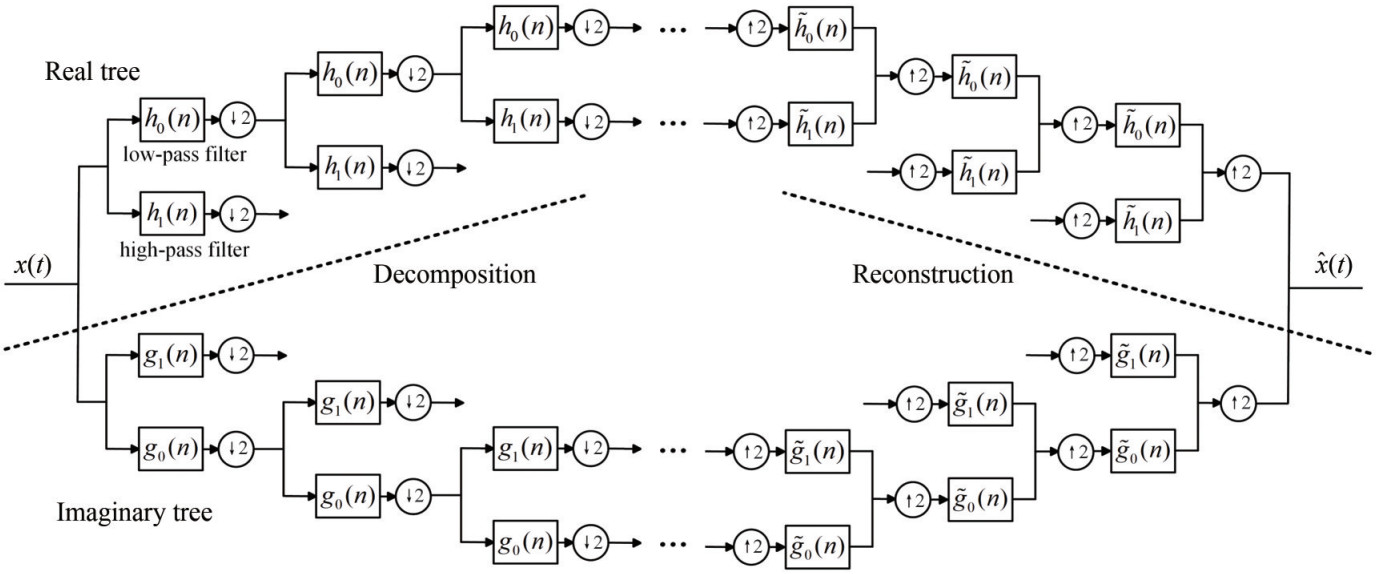 Figure 1 DT-CWT filter set
2.2 DT-CWT image decomposition and reconstruction
In forward-looking sonar images used for underwater gas leakage monitoring, the heterogeneous textures acquired at diverse resolutions enhance the efficacy of wavelet coef-ficients within distinct sub-bands for texture analysis and classification. Varied textures exhibit distinctive energy values across different detail sub-bands.
The decomposition of the image through the DT-CWT yields sub-band images corresponding to different frequency energy ranges (Selesnick et al., 2005). The decomposition proceeds as follows:
$$ d_j^{\mathrm{Re}}(n)=2^{\frac{j}{2}} \int_{-\infty}^{+\infty} x(t) \psi_h\left(2^j t-n\right) \mathrm{d} t(j=1, 2, \cdots, J) $$ (1) $$ c_J^{\mathrm{Re}}(n)=2^{\frac{J}{2}} \int_{-\infty}^{+\infty} x(t) \psi_h\left(2^J t-n\right) \mathrm{d} t $$ (2) $$ d_j^{\operatorname{Im}}(n)=2^{\frac{j}{2}} \int_{-\infty}^{+\infty} x(t) \psi_g\left(2^j t-n\right) \mathrm{d} t(j=1, 2, \cdots, J) $$ (3) $$ c_J^{\operatorname{Im}}(n)=2^{\frac{J}{2}} \int_{-\infty}^{+\infty} x(t) \psi_g\left(2^J t-n\right) \mathrm{d} t $$ (4) $$ \begin{aligned} d_j(t)= & 2^{\frac{j-1}{2}}\left[\sum\limits_{n=-\infty}^{+\infty} d_j^{\mathrm{Re}}(n) \psi_h\left(2^j t-n\right)+\right. \\ & \left.\sum\limits_{k=-\infty}^{+\infty} d_j^{\mathrm{Im}}(n) \psi_g\left(2^j t-k\right)\right] \end{aligned} $$ (5) $$ \begin{aligned} c_J(t)= & 2^{\frac{J-1}{2}}\left[\sum\limits_{n=-\infty}^{+\infty} c_J^{\mathrm{Re}}(n) \psi_h\left(2^J t-n\right)+\right. \\ & \left.\sum\limits_{k=-\infty}^{+\infty} c_J^{\mathrm{Im}}(n) \psi_g\left(2^J t-k\right)\right] \end{aligned} $$ (6) where ψh (t), ψg (t) are two real wavelets, x (t)is the original signal, dj (t) is the detail coefficient (high frequency), and cJ (t) is the scaling coefficient (low frequency).
The target image can be reconstructed by recombining different energy sub-band images with different weights. Reconstruction proceeds as follows:
$$ \hat{x}(t)=\sum\limits_{j=1}^J w_j d_j(t)+c_J(t) $$ (7) where wj is the weight for the subband j, and $\hat{x}(t)$ is the reconstruction signal.
In detecting and processing gas leakage images using the DT-CWT, the signal is divided into high-frequency and low-frequency components through high-pass and low-pass filters. The filters h0 and h1 correspond to the low-pass and high-pass filters in the real tree, whereas g0 and g1 correspond to the low-pass and high-pass filters in the imaginary tree, respectively.
For a 2D image, where the time axis is replaced by the coordinates in 2D space, the DT-CWT can capture high-frequency variations along both directions in the image. Compared with wavelet transforms, the two complementary subtrees in the DT-CWT endow the transformation with translation invariance. Even if the position of the target whose features are to be extracted changes in the image, the DT-CWT can still capture its texture information.
Additionally, the DT-CWT provides excellent directional selectivity, as illustrated in Figure 2. The gas leakage images detected by forward-looking sonar undergo decomposition through DT-CWT. As a result, each row is divided into nine levels from left to right. The corresponding sub-band images progressively reveal lower-frequency energy information. Each column, from top to bottom, represents the sub-band images in six different directions within the same level, symbolizing responses to textures in various directions.
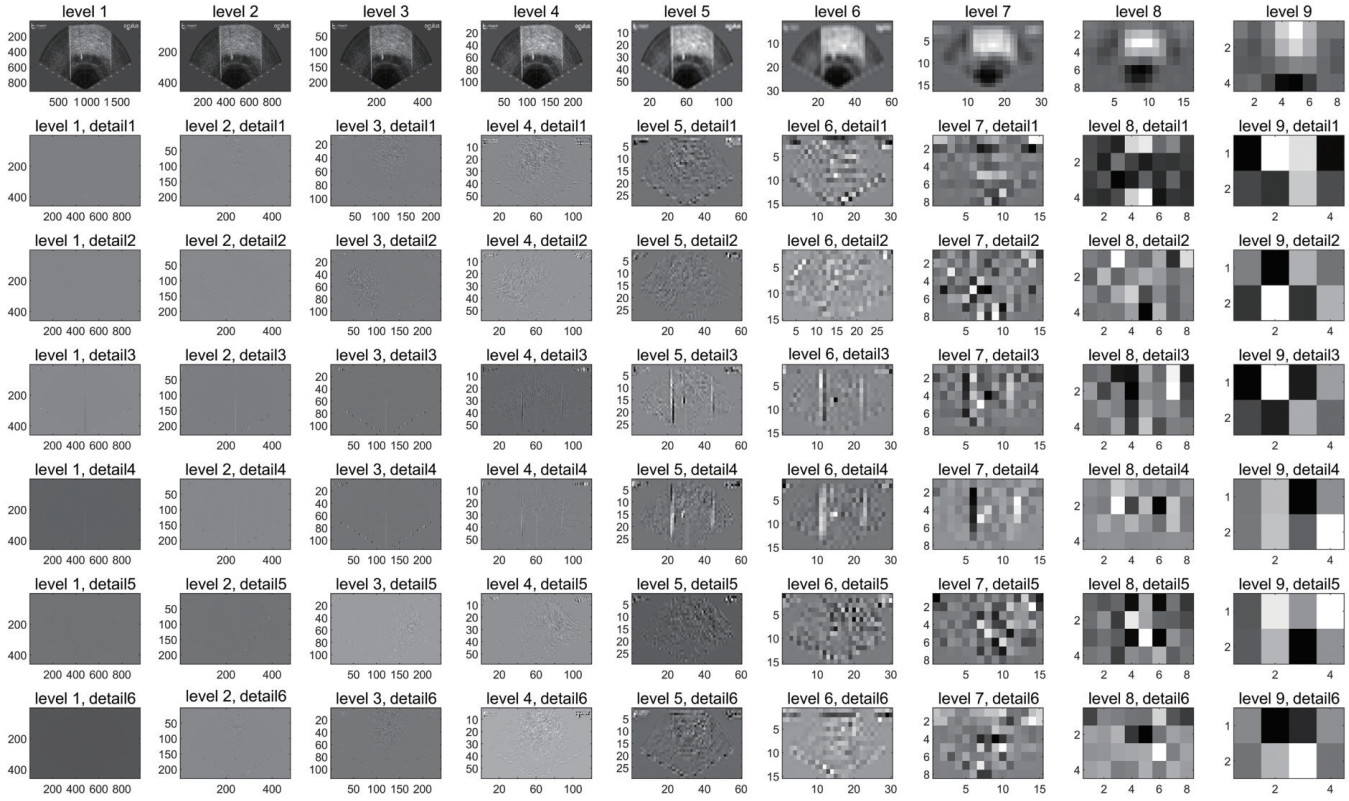 Figure 2 DT-CWT decomposition of gas leakage images
The decomposition process corresponds to the left half of Figure 1, achieved through the analysis filter bank. The reconstruction part corresponds to the right half of Figure 1, completed by the synthesis filter bank. The original signal can be reconstructed by performing the inverse DT-CWT using the low-pass and detail coefficients. Thus, by reconstructing the image with different weights assigned to each sub-band image obtained through the DT-CWT, the texture can be enhanced or attenuated at specific levels and directions. In this research, images corresponding to low and high flow rates at 3 standard liters per minute (SLPM) and 30 SLPM were captured, respectively. After reconstruction, specific image enhancement effects can be achieved, as shown in Figures 3 and 4. Variations in echo scattering caused by different bubble distributions at varying flow rates are evident. A close examination of the image details reveals that the bright spots at the leakage points in Figure 3 under low flow conditions are narrower than those in Figure 4 under high flow conditions. The processed images more clearly depict the bubble targets, reducing the interference generated by the seabed echo.
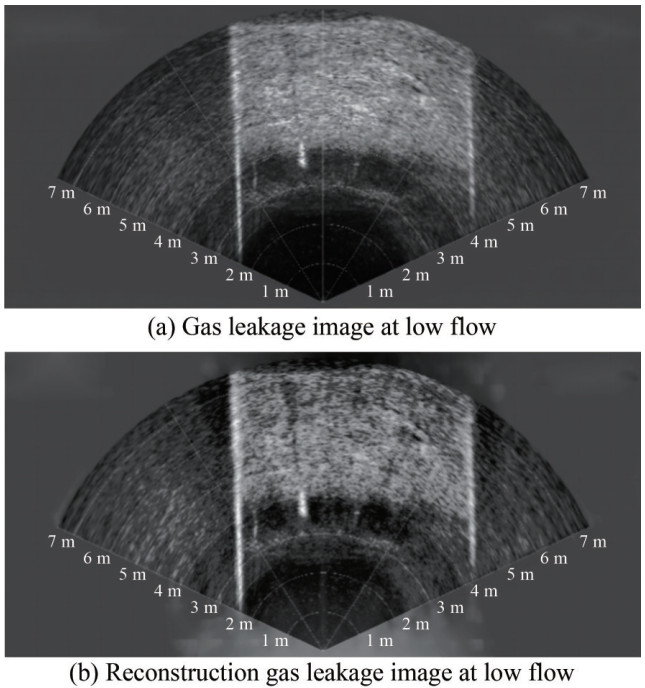 Figure 3 Gas leakage image processed at low flow
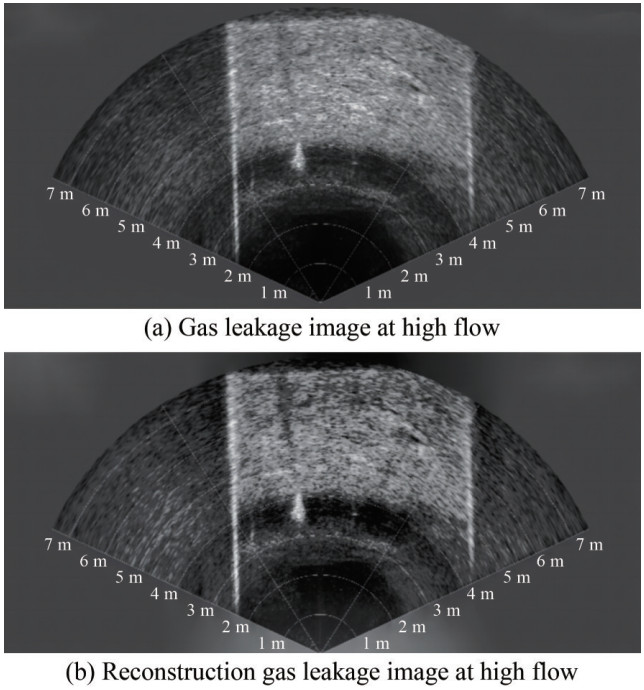 Figure 4 Gas leakage image processed at high flow
3 Classification of gas leakage flows
3.1 Leakage bubble distribution theory in flow classification
In the experimental setup, gas leakage flow is controlled by adjusting the leakage pressure differential. The process of gas bubble diffusion is highly intricate, with continually changing initial momentum, buoyancy, resistance, and surface tension as the bubble ascends. These dynamic factors result in varied phenomena during the stages of gas leakage.
In the initial phase, termed the pressure jet stage, turbulent bubble clusters are formed under the influence of the initial momentum provided by the pressure differential from the leakage source. As the bubble clusters ascend, the initial momentum gradually diminishes because of the proportional increase in resistance with the upward velocity. During this phase, buoyancy becomes the predominant influencing factor on the diffusion motion of bubbles, resulting in convective diffusion under its effect. With the leakage pressure differential maintained constant, gas continuously emanates from the leakage point, forming a plume that stabilizes over time (Sun et al., 2020). Assuming uniform flow and considering the velocity and void fraction on the horizontal cross-section of the bubble plume (Friedl and Fanneløp, 2000), these physical quantities are presumed to follow Gaussian distributions.
$$ v(r, z)=v_c(z) \mathrm{e}^{-r^2 / b(z)^2} $$ (8) $$ \varepsilon(r, z)=\varepsilon_c(z) \mathrm{e}^{-r^2 /(\lambda b(z))^2} $$ (9) where v represents the upward velocity of the bubble, r denotes the horizontal distance between the bubble and the axis, z is the vertical distance from the leakage point, and b represents the width of the bubble plume, defined as the distance from the axis to the edge of the bubbles. ε is the void fraction, and γ is the ratio of void fraction distribution to velocity distribution, typically assumed to be a constant.
Additionally, the length scale Hp represents the water depth corresponding to atmospheric pressure.
$$ H_p=\frac{p_0}{\rho g} $$ (10) where g is the acceleration due to gravity, and ρ is the density of the liquid phase. In the experimental pool setting, the value of Hp is taken as 10.33 m.
Dimensionless numbers $\hat{s}$ are defined to describe the influence of slip velocity during bubble ascent, $\hat{v}_{\mathrm{c}}$ is the dimensionless slip velocity, and $\hat{V}_0$ represents the gas volumetric flow rate. The proportionality factor α, also known as the entrainment coefficient, is presumed to remain constant. The continuity equation for the gas phase can be derived as follows:
$$ \hat{\varepsilon}_{\mathrm{c}}(\hat{z})=\frac{1}{1-\hat{z}} \frac{1}{\hat{b}^2\left(\hat{v}_{\mathrm{c}}+\hat{s}\right)}=\varepsilon_{\mathrm{c}}\left(\frac{\left(1+\lambda^2\right)^2 \gamma}{\pi^2 \lambda^2 2^5 \alpha^4} \frac{\hat{V}_0^2}{\left(H_v+H_p\right)^5 g}\right)^{-\frac{1}{3}} $$ (11) $\hat{z}, \hat{b}$, and $\hat{v}$ all represent dimensionless physical quantities, and they can be calculated based on the following relationship.
$$ \hat{z}=\frac{z}{H_v+H_p} $$ (12) $$ \hat{b}=\frac{b}{2 \alpha\left(H_v+H_p\right)} $$ (13) $$ \hat{v}=v\left(\frac{1+\lambda^2}{2 \pi \gamma \alpha^2} \frac{g \hat{V}_0}{H_v+H_p}\right)^{-\frac{1}{3}} $$ (14) The continuity equation for the liquid phase and the momentum equation for the gas- liquid mixture are depicted by Eqs. (15) and (16), respectively.
$$ \frac{\mathrm{d}}{\mathrm{~d} \hat{z}}\left(\hat{b}^2 \hat{v}_{\mathrm{c}}\right)=\hat{b} \hat{v}_{\mathrm{c}} $$ (15) $$ \frac{\mathrm{d}}{\mathrm{~d} \hat{z}}\left(\hat{b}^2 \hat{v}_{\mathrm{c}}^2\right)=\frac{1}{\left(\hat{v}_{\mathrm{c}}+\hat{s}\right)(1-\hat{z})} $$ (16) Given the entire process of gas leakage diffusion, the morphology of bubble flow is primarily determined by the magnitude of the leakage pressure differential. The flow properties of bubbles can be derived through the inversion of the void fraction of bubbles in the bubble plume and the width of the bubble plume. A simplified solution to the equation can be identified in this context (Friedl and Fanneløp, 2000):
$$ \begin{aligned} \hat{b}(\hat{z}) & =\frac{3}{5} \hat{z}\left[1-\frac{\hat{z}}{13}-7\left(\frac{\hat{z}}{13}\right)^2\right] \\ & +\hat{s} \frac{3}{110}\left(\frac{12}{25}\right)^{\frac{1}{3}} \hat{z}^{\frac{3}{4}}\left[1-\frac{1\;046}{49} \frac{\hat{z}}{39}-\frac{227\;726}{833}\left(\frac{\hat{z}}{39}\right)^2\right] \\ & -\hat{s}^2 \frac{48}{15\;125}\left(\frac{25}{12}\right)^{\frac{1}{3}} \hat{z}^{\frac{5}{3}}\left[1-\frac{34\;663}{9\;408} \hat{z}+\frac{225\;707\;803}{240\;143\;904} \hat{z}^2\right] \end{aligned} $$ (17) According to Friedl (1998), as the flow rate increases in experiments, the corresponding parameter $\hat{s}$ continuously decreases. Based on Eq. (17), a mapping relationship exists between the width of the bubble curtain and the variation in flow rate. Furthermore, based on Eq. (11), the void fraction of bubble plumes is influenced by the volume flow rate $\hat{V}_0$. The distribution of bubbles exhibits a mapping relationship with the flow rate.
Theoretical relationships indicate that the widths of bubble plumes and the fractions of void space formed under different leakage flow conditions vary and are closely related. The width of the bubble plume and the fraction of void space influence the reflected echo signals after active sonar signals are transmitted. This influence is the primary reason for the differences observed in forward-looking sonar imaging of leaking gases under varying flow conditions, providing theoretical support for the application of classification techniques based on single-frame images. Based on this discussion, gas flow rates can be classified through feature extraction from single-frame image signals.
3.2 Classification by DT-CWT feature images based on Euclidean distance
Complex echo interference in the water, which is presented in the acoustic image, complicates the identification of targets, as shown in Figure 5. As a key factor in echo interference, seabed reverberation is the sound wave of acoustic scattering due to the unevenness of the seabed and the non-uniformity of the substrate. In optimizing image processing under the background of echo interference, the differentiation of various leakage gases in different flow rates can be essentially understood as an image classification technique. Extracting local structural features of leakage bubbles identified in sonar images and combining them with a classification algorithm are crucial for distinguishing different flow rates. Local structural features in images describe the target structure of bubble acoustical images, and common features include point features, edge features, image block features, and texture features (Xu et al., 2015). Texture features serve as a measure of the target surface's brightness variation and are crucial information in images (Humeau-Heurtier, 2019). When classifying texture images with considerable differences, texture features become an effective method. The DT-CWT, with translational invariance and limited directional selectivity, overcomes the drawbacks of the discrete wavelet transform.
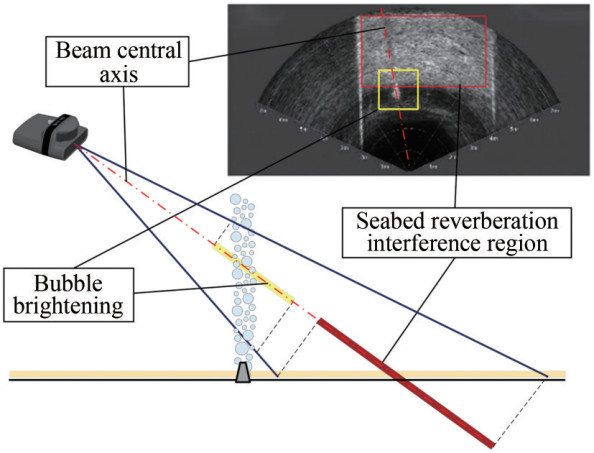 Figure 5 Gas leak detection with forward-looking sonar under seabed echo interference
The regular distribution of similar image units repeated in a pattern is the texture feature of an image. The characteristics embedded in gas leakage images under different flow rates vary. Extracting features from leakage images at different flow rates allows for a deeper understanding of the relationship between the texture features of underwater gas leakage and the corresponding flow rates. From wavelet transform to DT-CWT, various methods are provided for feature extraction in images (Qiao et al., 2021). Utilizing DT-CWT for texture feature extraction, combined with similarity measures, can be employed for the classification of gas leakage images under different flow conditions.
In accordance with the tools defined in the international standard MPEG-7 for describing image texture features, namely, the homogeneous texture descriptor (HTD), a texture descriptor based on the DT-CWT can also be defined (Xu and Zhang, 2006). HTD employs the Gabor wavelet transform to filter images in different directions and scales, resulting in texture feature maps at various directions and scales (Wu et al., 2000). The energy and energy deviation of these feature maps together constitute the HTD. The DT-CWT is similar to the Gabor wavelet transform, exhibiting variations in scale and angle. It decomposes the image into Q levels of DT-CWT coefficients, with each level having six directional sub-bands denoted as Wq, n (i, j), representing wavelet coefficient images at scale q and direction n. Here, q = 1, 2, …, Q denotes the decomposition scale, and n = 1, 2, 3, …, 6 represents the number of directions.
For each sub-band image Wq, n (i, j) obtained after decom‐position, the energy μ and standard deviation σ of its amplitude |Wq,n (i, j )| are computed as follows:
$$ \mu_{q, n}=\frac{1}{M \times N} \sum\limits_{i=1}^M \sum\limits_{j=1}^N\left|W_{q, n}(i, j)\right| $$ (18) $$ \sigma_{q, n}=\left[\frac{1}{M \times N} \sum\limits_{i=1}^M \sum\limits_{j=1}^N\left(\left|W_{q, n}(i, j)\right|-\mu_{q, n}\right)^2\right]^{\frac{1}{2}} $$ (19) where M × N represents the magnitude of the sub-band image Wq, n(i, j), and μq, n is the average of the amplitude values of the wavelet coefficients of the sub-band image Wq, n(i, j).
Thus, a composite feature vector can be constructed by combining the energy and standard deviation of the subbands as follows:
$$ f_{\mu \sigma}(i, j)=\left\{\mu_{1, 1}, \sigma_{1, 1}, \cdots, \mu_{1, 6}, \sigma_{1, 6}, \cdots, \mu_{Q, 1}, \sigma_{Q, 1}, \mu_{Q, 6}, \sigma_{Q, 6}\right\} $$ (20) In the classification method for underwater bubble acoustic images under different leakage flow rates based on feature extraction, after extracting the feature vectors from the images, it is necessary to measure the similarity between features. The similarity measurement between two feature vectors can be understood as a distance measurement between the two vectors. Euclidean distance is a simple method for distance measurement (O'Neill, 2006). The acoustic echo images of leaking bubbles under different flow rates exhibit variations in texture features, and the similarity of texture features presented by bubbles under similar flow rates can be reflected by the numerical values of the similarity measurement distance. Higher similarity corresponds to smaller numerical values of the distance.
During measurement, standardization is required for different feature components. Let x and y be the feature vectors of the database image and the recognition image, respectively. The formula for normalized Euclidean distance after processing is as follows:
$$ d_{q, n}(x, y)=\left|\frac{\mu_{q, n}^x-\mu_{q, n}^y}{\sigma\left(\mu_{q, n}\right)}\right|+\left|\frac{\sigma_{q, n}^x-\sigma_{q, n}^y}{\sigma\left(\sigma_{q, n}\right)}\right| $$ (21) $$ \operatorname{NED}(x, y)=\sum\limits_l \sum\limits_n d_{q, n}(x, y) $$ (22) By combining the Euclidean distance measurement method, a database for classification based on feature vectors can be constructed. Feature vectors of the acoustic images of leaking bubbles with known flow rates are extracted to form the database. When faced with unfamiliar leakage bubble images, their feature vectors are extracted, and classification is matched with the database image information, enabling the classification prediction of underwater gas leakage flow.
3.3 Classification by DT-CWT feature images
While traditional classification methods based on DT-CWT feature extraction are characterized by their clear physical significance and high reliability, the accuracy of the classification results obtained through these methods still requires improvement. The VGG-16 network model, a classical convolutional neural network (CNN) model, is commonly employed for tasks such as image classification and segmentation. It consists of an input layer, convolutional layers, pooling layers, fully connected layers, a classification layer, and an output layer (Simonyan and Zisserman, 2015).
The convolutional layers utilize convolutional kernels of varying sizes and numbers to extract features from images. The VGG network specifically employs 3×3 small convolutional kernels, reducing the number of parameters and accelerating the training speed of the model. Despite its straightforward structure, VGG-16 contains a large number of weight parameters. When applied to datasets with limited size and low data similarity, it is prone to overfitting, requires significant storage capacity, and is not conducive to model deployment. Moreover, its extended training time is disadvantageous for rapid identification of bubble flow. This study modifies the VGG-16 model to achieve rapid and accurate identification of bubble flow. The model is tailored to meet the requirements of bubble flow classification. The constructed CNN is illustrated in Figure 6.
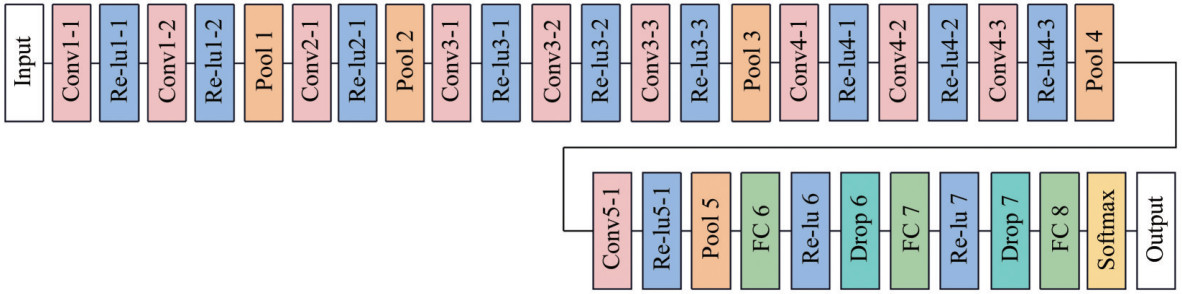 Figure 6 Constructed convolutional neural network structure
For images of gas leaks captured by forward-looking sonar, preprocessing steps such as object detection and image segmentation are performed to obtain images containing bubble features. These images are then labeled with actual flow rates to form a dataset, which is divided into training, validation, and test sets in specific proportions. An experimental environment is constructed by adjusting parameters such as the learning rate, minibatch size, and validation frequency. The final stage involves training and utilizing confusion matrix information from the test set to obtain results, including training accuracy and training loss. The specific process is shown in Figure 7.
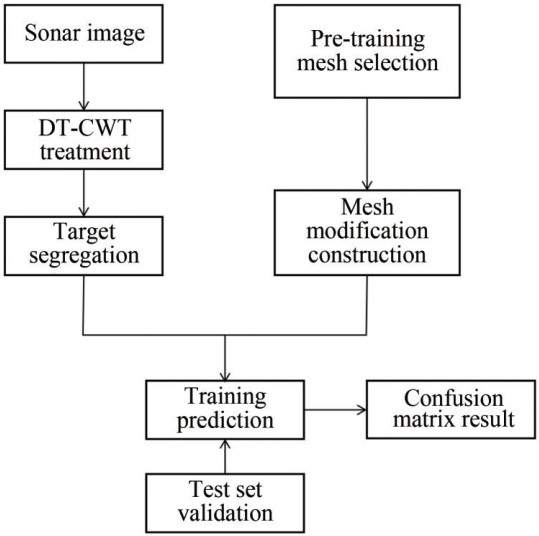 Figure 7 Flow chart of deep learning classification prediction
4 Experiment and result
4.1 Introduction to the experimental environment and procedure
In this research, an underwater gas leakage simulation device was custom-built in an experimental pool. The setup involved an aluminum alloy frame and a gas leakage source created by connecting an air pump to a hydraulic stone, simulating underwater gas leakage. An underwater optical camera was also used to document the experimental process. A flow meter was installed on one end of the gas release device to record leakage flow rates in real time. A computer was utilized for recording and processing real-time data.
The underwater platform was fitted with an Oculus 750d model forward-looking sonar for collecting acoustic data from the gas leakage, as shown in Figure 8. This sonar device is 125 mm long, 122 mm wide, and 62 mm high, making it compact, portable, and easy to install on underwater platforms and intelligent underwater equipment. It is designed for operations at a depth of up to 500 m and offers two operational frequencies: 750 kHz and 1.2 MHz. The specific parameters are detailed in Table 1. The bottom of the experimental pool was covered with a layer of sand to simulate a realistic seabed environment.
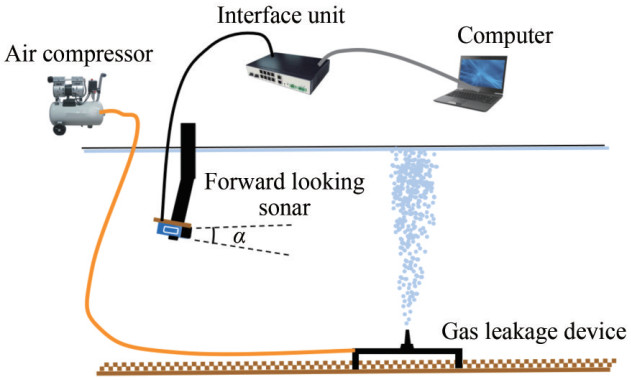 Figure 8 Schematic layout of the experimental setupTable 1 Configuration of Oculus 750d parameters
Parameter Value Operating frequency 750 kHz/1.2 MHz Max range (m) 120/40 Min range (m) 0.1 Range resolution (mm) 4/2.5 Update rate (Hz) 40 Horizontal aperture (°) 130/60 Vertical aperture (°) 20 Due to the influence of various factors such as ocean currents, water depth, nozzle size, pipeline pressure, and flow velocity, the size and distribution of bubbles generated during a gas leak undergo continuous changes as they rise under the effect of buoyancy. Furthermore, the backscatter strength (or acoustic attenuation) of the bubbles is closely related to the signal frequency, bubble size, and the number of bubbles (Greinert and Nützel, 2004). The information presented by gas leaks under different flow rate conditions is reflected in the echo images captured by forward-looking sonar.
During the experiment, the forward-looking sonar was placed at 1.0 m underwater. It utilized a 20° opening angle on the vertical plane of the sonar array to capture images of the rising bubble column from the leak. Given the relatively shallow depth of the pool (about 3 m), the sonar was positioned at an angle of approximately 25° with the horizontal plane to better study the morphology and texture characteristics of the rising bubbles. The leakage source was constructed using a hydraulic stone connected to an air compressor via a rubber hose. A high-precision flow meter was fitted to the end of the rubber hose connected to the air compressor, recording accurate leakage flow rates in real time.
Multiple sets of experiments were conducted by control‐ling variations in the input flow, recording flow data and bubble images for subsequent image processing and intelligent classification. The experiments were carried out at controlled input flow rates ranging from 1 SLPM to 30 SLPM. Five groups were selected for detailed analysis, with flow rates of 1 SLPM, 3 SLPM, 7 SLPM, 15 SLPM, and 30 SLPM, respectively. For each flow rate condition, data and images were collected for 30 seconds in three separate instances to ensure stability, forming corresponding datasets for storage.
4.2 Results of classification methods based on image feature extraction
Monitoring and classifying gas leakage through images obtained via forward-looking sonar can be regarded as an image classification problem, which is a crucial research area in pattern recognition. Gas flow classification involves categorizing sonar image samples obtained under different flow rates and assigning corresponding labels to these samples. In the acquired bubble images, numerous similar image units repeat and form a regular distribution. The rising gas column formed by bubble leakage is composed of overlaid bubbles, with a close relationship between bubble radius and distribution and leakage flow rate. Therefore, the corresponding leakage flow conditions can be matched on the basis of the texture features of local bubble information captured by forward-looking sonar.
Following the methods mentioned in Section 3.1, the approach not only detects the presence of leakage but also further distinguishes acoustic images of gas leakage under different flow rates.
Features from five sets of 1 500 underwater acoustic images under different gas leakage flow rates were extracted and randomly divided into a 3∶1 ratio to form training and testing sets. The average feature vector of the extracted features from 75% of the images was computed and utilized as the standard feature for the five flow rates. The remaining 25% of the images were designated as the testing set, and their feature vectors were extracted. The Euclidean distance was then calculated according to Equation (15) to measure the similarity with the standard features. The flow rate corresponding to the standard feature with the minimum calculated distance was selected as the output result of the classifier. Subsequently, the classification accuracy was computed by comparing the results with the true labels. This process yielded a recognition result table and confusion matrix, as shown in Table 2 and Figure 9.
Table 2 Results of leakage feature extraction classificationFlow Level Level 1 Level 2 Level 3 Level 4 Level 5 Actual Level 1 97.60% 2.40% 0.00% 0.00% 0.00% Actual Level 2 0.00% 97.60% 1.60% 0.00% 0.00% Actual Level 3 0.00% 2.67% 96.00% 1.33% 0.00% Actual Level 4 0.00% 0.00% 5.33% 76.27% 18.40% Actual Level 5 0.00% 0.00% 0.00% 14.13% 85.87% Precision rate 97.60% 97.60% 96.00% 76.27% 85.87% 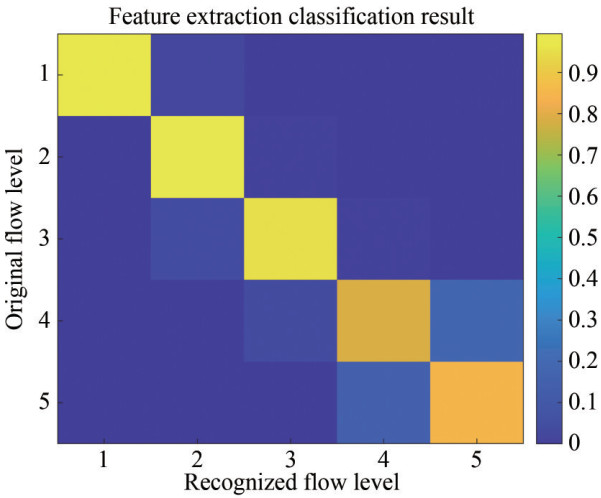 Figure 9 Confusion matrix of leakage feature extraction classification
The results indicate that the classification accuracy of gas leakage flow based on DT-CWT feature extraction is 90.67%. This approach demonstrates a reasonably accurate capability to classify underwater gas leakage flow rates, particularly within the ranges of Levels 1–3. The system exhibits high precision in assessing gas leakage flow within these specified levels. In practical underwater gas leakage scenarios, this method's advantages can be fully leveraged, enabling accurate evaluation of gas leakage conditions, especially in the early stages.
4.3 Results based on the deep learning classification method
Utilizing a pre-trained VGG-16 image classification network, the network model was fine-tuned to optimize its performance. Acoustic data were collected under five different flow rates, with approximately 1 500 images per group. A total of 2 000 images were randomly selected as the data source, adhering to a 3∶1 split for the training and validation sets. Additionally, 500 images were randomly extracted from the remaining data as the test set to validate the accuracy of the constructed network. The data proportions for the training set, validation set, and test set was allocated in a ratio of 6∶2∶2. A learning rate of 0.000 1 and a minibatch size of 10 were chosen, and the validation frequency was set to 50 to prevent overfitting. This parameter indicates that a validation assessment was conducted for every 50 mini-batches to evaluate the model's performance. The training was carried out for five epochs, culminating in the obtained results. Accuracy and loss functions serve as crucial metrics for assessing the effectiveness of the model's training (Wang et al., 2022). Ultimately, after 1 071 seconds of training in the laboratory computing environment (Table 3), the accuracy and loss function graphs are illustrated in the accompanying Figure 10.
Table 3 Computing platform parametersCPU RAM GPU VRAM INTEL I7 12700 H 8 GB NVIDIA RTX3060 6 GB 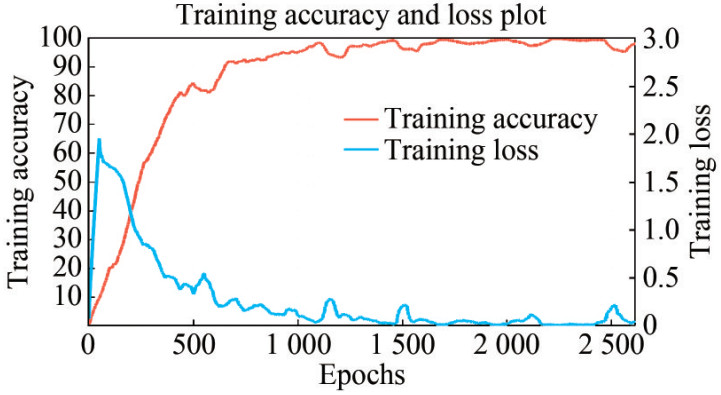 Figure 10 Deep learning training process
According to the results, each epoch consisted of 523 iterations in the training based on deep learning. Remarkably, a rapid convergence was achieved, with the accuracy reaching 95% after only two training epochs. The final validation of the model on the test set produced a confusion matrix, as depicted in the accompanying Figure 11.
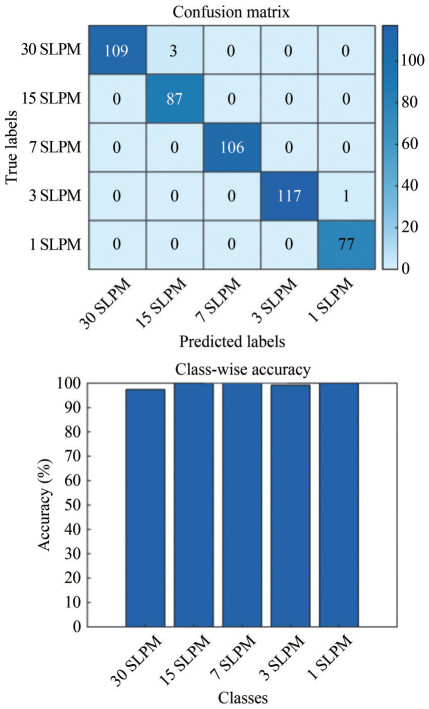 Figure 11 Confusion matrix and accuracy
The image-based deep learning approach demonstrates favorable recognition accuracy, and the integration of fea‐tures extracted through DT-CWT shows the potential to further enhance training speed and accuracy. Upon undergoing DT-CWT decomposition into sub-band images of different frequencies, forward-looking sonar images generate a reconstructed image with bubble texture features. This image can also be employed for deep learning purposes. Constructing a classifier based on CNNs requires the prior application of DT-CWT to the forward-looking sonar images. The subsequent steps are extracting sub-band images containing bubble-related features, reconstructing bubble feature images, and cropping them to specified dimensions to meet the relevant conditions for neural network training.
Moreover, augmenting the training set by flipping processed images serves a dual purpose: enhancing the accuracy of model training and mitigating the risk of overfitting while expanding the number of training samples to a certain extent. Once an appropriate pre-trained grid is selected, constructing a suitable grid allows for the training of the dataset, followed by validation on the test set. The images in the dataset preprocessed with target segmentation and flipping are shown in Figure 12 to constitute the training samples.
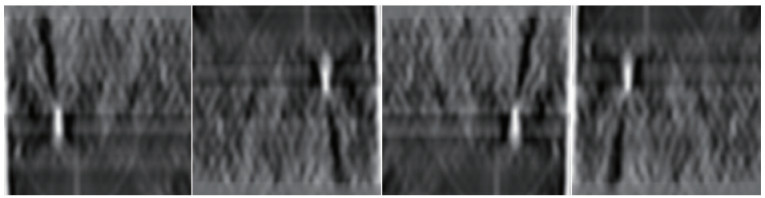 Figure 12 Preprocessed flipped images
In the consistent laboratory computing environment, the training results of the flipped bubble leakage dataset trans-formed through DT-CWT were compared with those of the original flipped bubble dataset, as depicted in Figures 13 and 14. The convergence speed of accuracy was much faster, and the rate of reduction in the loss function was higher for the DT-CWT transformed dataset. The training time required to achieve a 90% accuracy on the DT-CWT transformed dataset was considerably lower than that of the original training set, with only 55.32% of the epochs needed compared with the original training set, effectively halving the training time. Upon concluding the training, the test set validation results, including the confusion matrix, are presented in Figures 15 and 16.
 Figure 13 Comparison chart of training accuracy
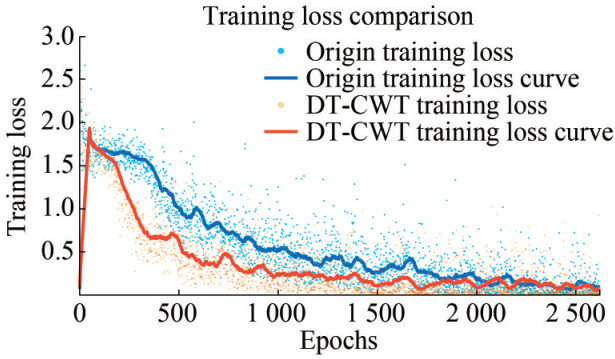 Figure 14 Comparison chart of training loss
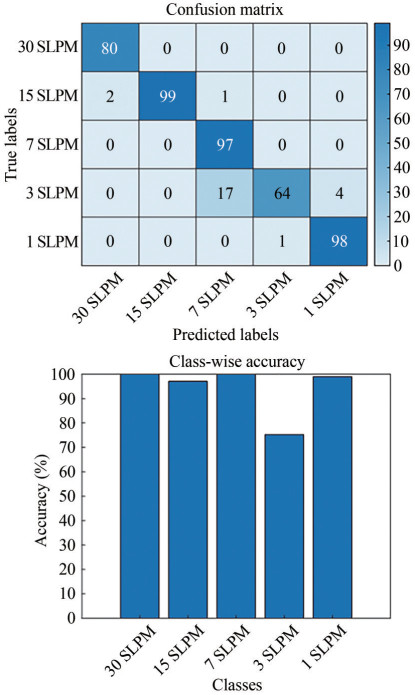 Figure 15 Original confusion matrix and accuracy
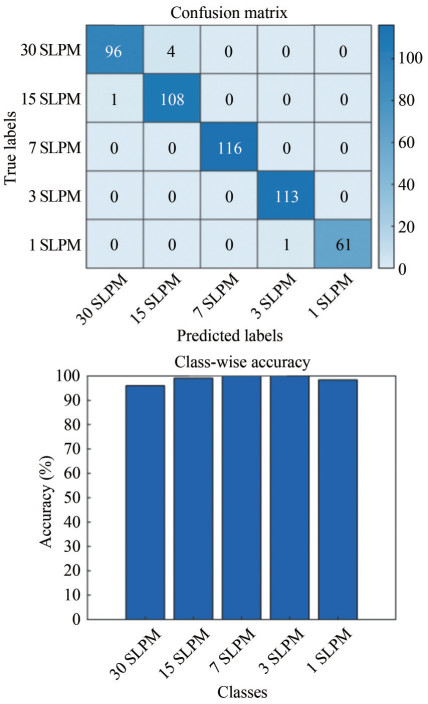 Figure 16 DT-CWT confusion matrix and accuracy
Experiments were conducted to identify flow on a test set of 500 random flow sample data. The experiments were run on a laboratory computer environment (i7‒12700 H). The results showed that the total classification time for the entire test set was 13.432 s, with an average recognition time of only 0.026 864 s per image. The model used DT-CWT and deep learning techniques, which demonstrated its high processing speed. The recognition accuracy and processing rate were significantly improved by optimizing compu-tational processes and algorithms. This improvement is particularly crucial for real-time gas leakage applications that require rapid and accurate diagnostics.
The recognition accuracy of the original test set was 94.60%, whereas the final test set achieved a validation accuracy of 98.80%, as shown in Figure 17. This outcome indicates that the model maintained high recognition performance while exhibiting excellent computational efficiency, demonstrating its feasibility and efficiency in practical underwater monitoring applications. The performance improvement provides robust technical support for real-time monitoring and big data analysis, making it applicable in various settings, such as small unmanned underwater observation systems.
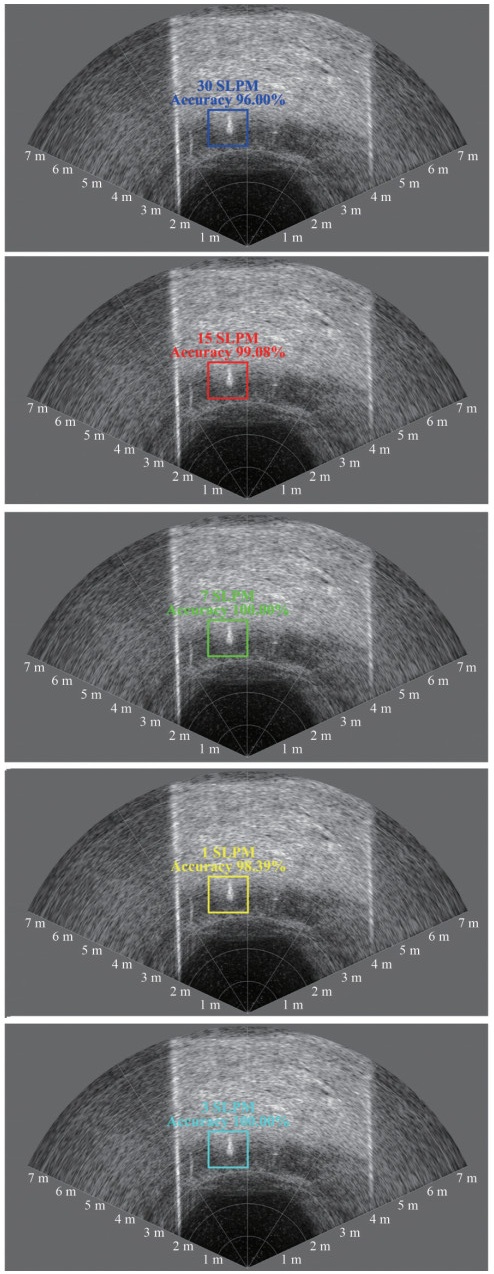 Figure 17 Results of test set traffic classification prediction under deep learning
Analysis reveals that images reconstructed through DT-CWT, compared with solely preprocessed original images, exhibit superior effectiveness when integrated with deep learning. The combined approach yields better performance and higher accuracy.
This study demonstrates that forward-looking sonar deployed in AUVs can effectively perform underwater operations. However, AUVs characterized by high nonlinearity, complexity, and uncertainty undergo changes in their depth motion characteristics with variations in speed and external disturbances (Pei et al., 2023; Zhong et al., 2022). They potentially result in lateral shifts of the front-view sonar targets within the image frame. Whether the deep learning model trained on the original dataset can still effectively differentiate underwater gas leakage flow rates should be investigated to address the challenge of unfamiliar and random small lateral shifts in the target. Using the methodology described in Section 2, image features are reconstructed from sonar images, and a deep learning model trained for flow rate recognition is employed. Random shifts (0% – 10%) are applied to the gas leakage images within the target cropping region, causing the bubble's position in the image feature to deviate from the training set's position. After standardization and center-offset calculation, a test set with randomly shifted and flipped images is generated. The accuracy of flow rate recognition for the shifted and flipped images is then computed. The results in Figure 18 indicate that the classification method proposed in this study maintains good recognition performance even in the presence of random shifts and flips, achieving an accuracy of 80% for the shifted and flipped test set.
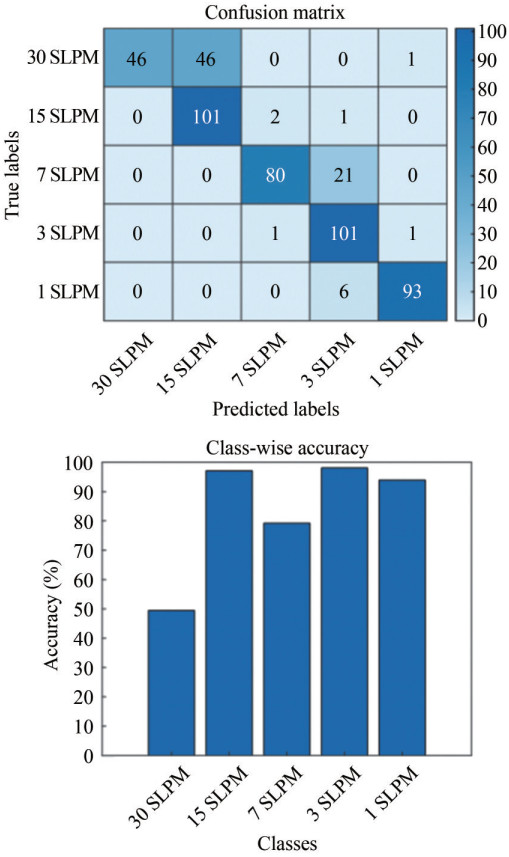 Figure 18 Random shift confusion matrix and accuracy
Combining DT-CWT and deep learning methods is effective in accurately identifying the predetermined flow rate levels. Moreover, this approach demonstrates adaptability to the random shifts of bubbles relative to the recognition window. These capabilities make the methodology suitable for integration and application in AUV operations focused on underwater gas leakage monitoring.
5 Conclusions
Aiming to achieve informalized intelligent monitoring for underwater gas leakage in offshore CCUS schemes, this study proposes a method for underwater gas leakage detection and its flow classification based on the DT-CWT and deep learning techniques. The approach is tested and validated using experimental data from a simulated underwater gas leakage setup. DT-CWT is applied to the single echo image of bubble leakage to extract texture features from sonar images. Sub-band images are decomposed, assigned different weights, and reconstructed to enhance underwater targets. The deep learning technology, enhanced by DT-CWT, demonstrates advantages and potential in underwater flow rate rapid classification testing. This study validates the reliability and robustness of flow rate classification under random translation and flipping conditions in anticipation of future deployments in actual AUV missions for underwater monitoring with forward-looking sonar. Current recognition and classification technologies still face challenges in adapting to complex underwater environments and enhancing accuracy. Future developments can involve integrating more lightweight, advanced deep learning models and feature extraction methods with high-resolution underwater imaging equipment mounted on actual AUVs and ROVs to closely realize intelligent underwater monitoring deployment.
Competing interest Jianghui Li is an editorial board member for the Journal of Marine Science and Application and was not involved in the editorial review, or the decision to publish this article. All authors declare that there are no other competing interests. -
Figure 1 DT-CWT filter set
Figure 2 DT-CWT decomposition of gas leakage images
Figure 3 Gas leakage image processed at low flow
Figure 4 Gas leakage image processed at high flow
Figure 5 Gas leak detection with forward-looking sonar under seabed echo interference
Figure 6 Constructed convolutional neural network structure
Figure 7 Flow chart of deep learning classification prediction
Figure 8 Schematic layout of the experimental setup
Figure 9 Confusion matrix of leakage feature extraction classification
Figure 10 Deep learning training process
Figure 11 Confusion matrix and accuracy
Figure 12 Preprocessed flipped images
Figure 13 Comparison chart of training accuracy
Figure 14 Comparison chart of training loss
Figure 15 Original confusion matrix and accuracy
Figure 16 DT-CWT confusion matrix and accuracy
Figure 17 Results of test set traffic classification prediction under deep learning
Figure 18 Random shift confusion matrix and accuracy
Table 1 Configuration of Oculus 750d parameters
Parameter Value Operating frequency 750 kHz/1.2 MHz Max range (m) 120/40 Min range (m) 0.1 Range resolution (mm) 4/2.5 Update rate (Hz) 40 Horizontal aperture (°) 130/60 Vertical aperture (°) 20 Table 2 Results of leakage feature extraction classification
Flow Level Level 1 Level 2 Level 3 Level 4 Level 5 Actual Level 1 97.60% 2.40% 0.00% 0.00% 0.00% Actual Level 2 0.00% 97.60% 1.60% 0.00% 0.00% Actual Level 3 0.00% 2.67% 96.00% 1.33% 0.00% Actual Level 4 0.00% 0.00% 5.33% 76.27% 18.40% Actual Level 5 0.00% 0.00% 0.00% 14.13% 85.87% Precision rate 97.60% 97.60% 96.00% 76.27% 85.87% Table 3 Computing platform parameters
CPU RAM GPU VRAM INTEL I7 12700 H 8 GB NVIDIA RTX3060 6 GB -
Arun PS, Shreyash AS, Gopi VP (2023) ResCoWNet: A deep convolutional neural network with residual learning based on DT-CWT for despeckling Optical Coherence Tomography images. Optik 284: 170924. https://doi.org/10.1016/j.ijleo.2023.170924 Colbo K, Ross T, Brown C, Weber T (2014) A review of oceanographic applications of water column data from multibeam echosounders. Estuarine, Coastal and Shelf Science 145: 41–56. https://doi.org/10.1016/j.ecss.2014.04.002 De Moustier C, Zabal X, Boelmann J, Kraft B, Zielinski O, Fox P (2013) Near-bottom acoustical detection of bubble streams emanating from natural seafloor seeps in the Gulf of Mexico. Offshore Technology Conference, Houston, OTC-24171-MS. https://doi.org/10.4043/24171-MS Fawad M, Mondol NH (2021) Monitoring geological storage of CO2: a new approach. Scientific Reports 11(1): 5942. https://doi.org/10.1038/s41598-021-85346-8 Friedl MJ (1998) Bubble plumes and their interactions with the water surface. PhD thesis, Swiss Federal Institute of Technology (ETH), Zurich, No. 12667 Friedl MJ, Fanneløp TK (2000) Bubble plumes and their interaction with the water surface. Applied Ocean Research 22(2): 119–128. https://doi.org/10.1016/s0141-1187(99)00022-x Gee L, Doucet M, Parker D, Weber T, Beaudoin J (2012) Is multibeam water column data really worth the disk space? Hydro12-Taking care of the sea, Rotterdam. https://doi.org/10.3990/2.236 Greinert J, Nützel B (2004) Hydroacoustic experiments to establish a method for the determination of methane bubble fluxes at cold seeps. Geo-Marine Letters 24(2): 75–85. https://doi.org/10.1007/s00367-003-0165-7 Humeau-Heurtier A (2019) Texture feature extraction methods: A survey. IEEE Access 7: 8975–9000. https://doi.org/10.1109/access.2018.2890743 Ju Z, Xue Y (2020) Fish species recognition using an improved AlexNet model. Optik 223: 165499. https://doi.org/10.1016/j.ijleo.2020.165499 Kingsbury N (1998) The dual-tree complex wavelet transform: A new efficient tool for image restoration and enhancement. 9th European Signal Processing Conference (EUSIPCO 1998), 1–4. https://ieeexplore.ieee.org/document/7089719 Leighton TG, White PR (2011) Quantification of undersea gas leaks from carbon capture and storage facilities, from pipelines and from methane seeps, by their acoustic emissions. Proceedings of the Royal Society A: Mathematical, Physical and Engineering Sciences 468(2138): 485–510. https://doi.org/10.1098/rspa.2011.0221 Li J, Roche B, Bull JM (2020) Passive acoustic monitoring of a natural CO2 seep site-Implications for carbon capture and storage. International Journal of Greenhouse Gas Control 93: 102899. https://doi.org/10.1016/j.ijggc.2019.102899 Li J, White PR, Bull JM, Roche B, Davis JW, Leighton TG, Deponte M, Gordini E, Cotterle D, Zhou T, Xu C (2021) Passive acoustic localization of a natural CO2 seep-Implications for carbon capture and storage. 2021 OES China Ocean Acoustics (COA), 392–396. https://doi.org/10.1109/COA50123.2021.9520019 Li M, Chen W, Zhang T (2017) Automatic epileptic EEG detection using DT-CWT-based non-linear features. Biomedical Signal Processing and Control 34: 114–125. https://doi.org/10.1016/j.bspc.2017.01.010 Mumtaz A, Gilani SAM, Jameel T (2006) A novel texture image retrieval system based on dual tree complex wavelet transform and support vector machines. 2006 International Conference on Emerging Technologies, 108–114. https://doi.org/10.1109/ICET.2006.335910 O'Neill B (2006) Euclidean geometry. Elsevier EBooks, 100–129. https://doi.org/10.1016/b978-0-12-088735-4.50007-9 Pachauri RK, Allen MR, Barros VR (2014) Climate change 2014: synthesis report. Contribution of Working Groups I, II and III to the Fifth Assessment Report of the Intergovernmental Panel on Climate Change. In R. K. Pachauri, L. Meyer (Eds.), EPIC3 Geneva, Switzerland, IPCC Pei T, Yu C, Zhong Y, Lian L (2023) Adaptive event-triggered mechanism-based online system identification framework for marine craft. Ocean Engineering 278: 114572. https://doi.org/10.1016/j.oceaneng.2023.114572 Qiao Y, Zhao Y, Song C, Zhang K, Xiang X (2021) Graph wavelet transform for image texture classification. Iet Image Processing 15(10): 2372–2383. https://doi.org/10.1049/ipr2.12220 Ren J, de Moustier C, Barzegar A, Smith C, Baksmaty LO, Minisini D (2023) Multi-instrument integration for natural seafloor seeps survey. OCEANS 2023 - MTS/IEEE U.S. Gulf Coast, 1–4. https://doi.org/10.23919/OCEANS52994.2023.10337333 Selesnick IW, Baraniuk RG, Kingsbury NC (2005) The dual-tree complex wavelet transform. IEEE Signal Processing Magazine 22(6): 123–151. https://doi.org/10.1109/msp.2005.1550194 Simonyan K, Zisserman A (2015) Very deep convolutional networks for large-scale image recognition. arXiv: 1409.1556. https://doi.org/10.48550/arXiv.1409.1556 Sun Y, Cao X, Liang F, Bian J (2020) Investigation on underwater gas leakage and dispersion behaviors based on coupled Eulerian-Lagrangian CFD model. Process Safety and Environmental Protection 136: 268–279. https://doi.org/10.1016/j.psep.2020.01.034 Urban P, Köser K, Greinert J (2016) Processing of multibeam water column image data for automated bubble/seep detection and repeated mapping. Limnology and Oceanography: Methods 15(1): 1–21. https://doi.org/10.1002/lom3.10138 Valdenegro-Toro M (2016) Object recognition in forward-looking sonar images with convolutional neural networks. OCEANS 2016 MTS/IEEE, Monterey, 1–6. https://doi.org/10.1109/OCEANS.2016.7761140 Veloso M, Greinert J, Jürgen M (2015) A new methodology for quantifying bubble flow rates in deep water using splitbeam echosounders: Examples from the arctic offshore NW-Svalbard. Limnology and Oceanography-Methods 13(6): 267–287. https://doi.org/10.1002/lom3.10024 Wang Q, Ma Y, Zhao K, Tian Y (2022) A comprehensive survey of loss functions in machine learning. Annals of Data Science 9(2): 187–212. https://doi.org/10.1007/s40745-020-00253-5 Wu P, Manjunath BS, Newsam S, Shin HD (2000) A texture descriptor for browsing and similarity retrieval. Signal Processing: Image Communication 16(1–2): 33–43. https://doi.org/10.1016/s0923-5965(00)00016-3 Xu C, Wu M, Zhou T, Li J, Du W, Zhang W, White PR (2020) Optical flow-based detection of gas leaks from pipelines using multibeam water column images. Remote Sensing 12(1): 119. https://doi.org/10.3390/rs12010119 Xu F, Zhang YJ (2006) Evaluation and comparison of texture descriptors proposed in MPEG-7. Journal of Visual Communication and Image Representation 17(4): 701–716. https://doi.org/10.1016/j.jvcir.2005.10.002 Xu L, Lin W, Kuo CCJ (2015) Image features and feature processing. In L. Xu, W. Lin, C. -C. J. Kuo (Eds.), Visual Quality Assessment by Machine Learning, Springer, 37–65. https://doi.org/10.1007/978-981-287-468-9_3 Yu C, Wilson PA (2023) Lumped hydrodynamics identification-based cascade control for vertical-plane tracking of a fin-driven autonomous underwater vehicle. Ocean Engineering 286: 115557. https://doi.org/10.1016/j.oceaneng.2023.115557 Zacchini L, Franchi M, Manzari V, Pagliai M, Secciani N, Topini A, Stifani M, Ridolfi A (2020) Forward-looking sonar CNN-based automatic target recognition: An experimental campaign with FeelHippo AUV. 2020 IEEE/OES Autonomous Underwater Vehicles Symposium (AUV), 1–6. https://doi.org/10.1109/AUV50043.2020.9267902 Zhang W, Zhou T, Li J, Xu C (2022) An efficient method for detection and quantitation of underwater gas leakage based on a 300-kHz multibeam sonar. Remote Sensing 14(17): 4301. https://doi.org/10.3390/rs14174301 Zhao J, Mai D, Zhang H, Wang S (2020) Automatic detection and segmentation on gas plumes from multibeam water column images. Remote Sensing 12(18): 3085. https://doi.org/10.3390/rs12183085 Zhao J, Meng J, Zhang H, Wang S (2017) Comprehensive detection of gas plumes from multibeam water column images with minimisation of noise interferences. Sensors 17(12): 2755. https://doi.org/10.3390/s17122755 Zhong Y, Yu C, Wang R, Liu C, Lian L (2022) Adaptive depth tracking of underwater vehicles considering actuator saturation: Theory, simulation and experiment. Ocean Engineering 265: 112517. https://doi.org/10.1016/j.oceaneng.2022.112517
