
Hcable for Time-Lapse Seismic Monitoring of Marine Carbon Capture and Storage
https://doi.org/10.1007/s11804-024-00438-x
-
Abstract
To ensure project safety and secure public support, an integrated and comprehensive monitoring program is needed within a carbon capture and storage (CCS) project. Monitoring can be done using many well-established techniques from various fields, and the seismic method proves to be the crucial one. This method is widely used to determine the CO2 distribution, image the plume development, and quantitatively estimate the concentration. Because both the CO2 distribution and the potential migration pathway can be spatially small scale, high resolution for seismic imaging is demanded. However, obtaining a high-resolution image of a subsurface structure in marine settings is difficult. Herein, we introduce the novel Hcable (Harrow-like cable system) technique, which may be applied to offshore CCS monitoring. This technique uses a high-frequency source (the dominant frequency > 100 Hz) to generate seismic waves and a combination of a long cable and several short streamers to receive seismic waves. Ultrahigh-frequency seismic images are achieved through the processing of Hcable seismic data. Hcable is then applied in a case study to demonstrate its detailed characterization for small-scale structures. This work reveals that Hcable is a promising tool for time-lapse seismic monitoring of oceanic CCS.Article Highlights● Seismic Hcable is introduced to monitor CCS. Compared to the conventional seismic method, it could provide high resolution image of subsurface small-scale structures.● Seismic Hcable technique uses a high frequency source and a combination of short streamers and a long streamer to acquire data.● Ultra-small bin data are presented. It has a bin size of 6.25 m×3.125 m, which is a great improvement.● The gas chimney and mass transport deposit are well characterized by using Hcable technique. This shows the potential of using Hcable to monitoring CCS project. -
1 Introduction
CCS is considered the most promising way to reduce CO2 emissions. In this technology, CO2 is captured and stored underground. The CCS project is complex and involves many aspects, including costs and benefits, ecological effects, safety, and public support. Integrated monitoring is required to ensure the success of the CCS project (Li et al., 2023), the purposes of which are 1) to guarantee project safety; 2) to assess the effectiveness of carbon sequestration; 3) to supply data to help in policy-making; 4) to improve understanding of the project by the public to gain their support. To achieve these goals, an integrated monitoring program should track the distribution of CO2 within the layers, detect whether an earthquake is induced, and offer a quantitative estimation of the amount of stored CO2.
Several geophysical methods have been used for CCS monitoring (Arts et al., 2008; Furre et al., 2017), e.g., seismic method, logging method, gravity method, and controlled source electromagnetic method. These methods are from various fields and are based on different principles. Together, they monitor areas ranging from storage reservoir units, shallow subsurface, seafloor, and water columns to the atmosphere. Among them, time-lapse seismic monitoring is proven to be the key monitoring tool (Chadwick et al., 2004; Harris et al., 2016; Furre et al., 2017). It is widely used in every running CCS project (Arts et al., 2004; Cheraghi et al., 2017; Trautz et al., 2020; Pevzner et al., 2021). For example, in the Sleipner project, a baseline three-dimensional (3D) seismic survey was conducted in 1994, and repeated surveys were done in 1999, 2001, 2004, 2006, 2008, 2010, 2013, and 2016 (Furre et al., 2017).
The seismic method has several advantages. First, compared with other techniques, it can produce an image of the subsurface structure with the highest resolution and accuracy (Arts et al., 2008; Chadwick et al., 2014; Furre et al., 2017). Second, rock physics can be derived from seismic data, which can be further used to quantitatively estimate the concentration of CO2 (Williams and Chadwick, 2012; Ghosh et al., 2015; Cowton et al., 2016). Third, it is very sensitive and can detect small changes (Chadwick et al., 2004). Thus, we use the seismic technique to determine the distribution of CO2 and image the plume development (Ringrose et al., 2009; Furre et al., 2017) and quantitatively estimate the concentration of CO2 and then determine how much is stored (Williams and Chadwick, 2012; Yan et al., 2019), which is an important aspect for assessing its effectiveness.
Because both the CO2 distribution and potential pathways may be spatially small-scale (Arts et al., 2008; Ajo-Franklin et al., 2013; Blackford et al., 2014; Chadwick et al., 2014; Cowton et al., 2016), it requires that the seismic method should provide a high-resolution image of the subsurface structure. In land seismic surveys, high-resolution seismic images are achieved by increasing data density and peak frequency. By contrast, in offshore settings, high-density data remains very challenging. The limitation comes from the fact that seismic streamers should be deployed with large spacing to ensure safety. For example, in conventional oil and gas exploration, the streamers are usually 50 or 100 m apart (Widmaier et al., 2020), and the bin size is about 6.25 m×12.5 m (Long, 2004; Widmaier et al., 2020), which is not sufficient for characterizing the small-scale CO2 distribution in subseafloor layers. In the Sleipner project, several attempts have been made to increase the seismic resolution, including through two-dimensional (2D) high-resolution seismic surveys and using dual streamers (Furre and Eiken, 2014). With these attempts, the peak frequency reaches 50 Hz. However, the 2D seismic survey is not sufficient for characterizing the 3D CO2 distribution. Moreover, 50 Hz is still not sufficient to characterize small-scale structures involved in CO2 migration.
Herein, we introduce a newly developed seismic Hcable technique for possible use in CCS project monitoring. This Hcable technique (Wen et al., 2021; Liu et al., 2022) uses a high-frequency GI gun (a dominant frequency of over 100 Hz) as the source and a combination of a long streamer and several short streamers as receivers. It has been used in several gas hydrate exploration programs and outperforms conventional 3D seismic methods in providing ultra-small bin size and high resolution (Liu et al., 2022).
2 Basic principle of Hcable technique
This section briefly summarizes the fundamental idea and some of the central features of the Hcable technique. The core idea of Hcable is to acquire 3D seismic data with high-frequency small-size bins in sea settings and then achieve a high-resolution image after processing. It attempts to increase the seismic resolution through data acquisition and processing. An example layout of the Hcable technique is illustrated in Figure 1. On the source side, several sources are used with a dominant frequency much higher than that in conventional 3D seismic surveys targeting oil and gas. On the receiver side, a long cable and several shot streamers are used to receive the seismic waves. The use of short streamers makes it safe to deploy streamers with small spacing. Seismic acquisition with a small-size bin can be achieved with this geometry. The use of a long cable is for velocity analysis because an accurate velocity analysis requires long offset data. Therefore, Hcable is characterized by short source spacing, short channel interval, and high dominant frequency. It is different from the conventional 3D seismic method in terms of acquisition, processing, and interpretation. More detailed information on the methodology of Hcable can be found in Wen et al. (2021) and Liu et al. (2022).
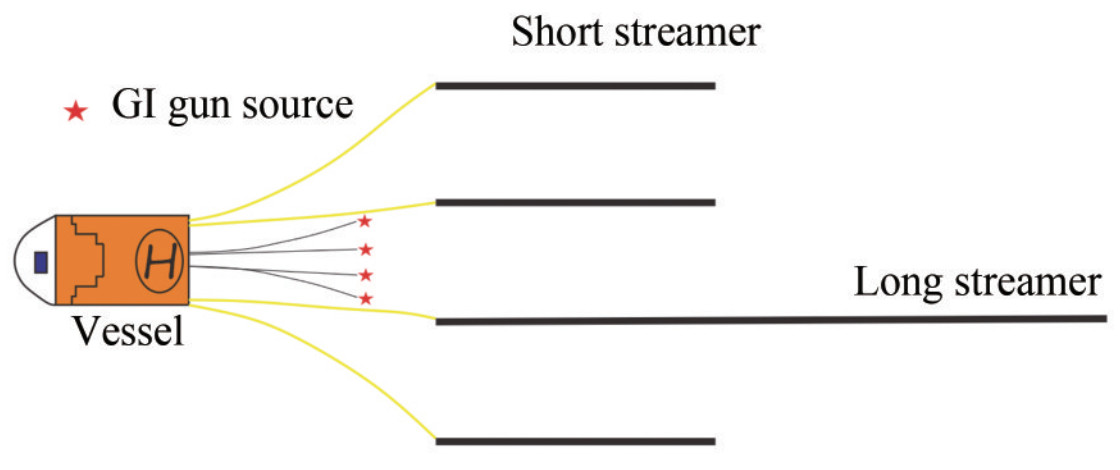 Figure 1 Illustration of the configuration of sources and receivers for the Hcable technique
3 A case study using Hcable
The case study area is located in the Qiongdong Sea area, on the northwestern slope of the South China Sea, which is rich in gas hydrates. Indicators of gas hydrates were well identified in previous studies. One of the indicators is the widespread presence of gas chimney structures revealed by multichannel seismic profiles (Liang et al., 2019). These gas chimney structures are very similar to small-scale structures associated with upward CO2 migration in the CCS project. Therefore, this case study can be a good demonstration of how the seismic method can be used for CCS monitoring.
The data were acquired in September 2020. The layout of all the acquisition equipment follows the configuration in Figure 1. Four GI guns of 210 cu. in were used as the source. The dominant frequency was about 100 Hz, as shown in the raw seismic shot gathers (Figures 2(a), 2(b)), which is much higher than that used in conventional oil and gas exploration (usually below 60 Hz, Figures 2(c), 2(d)). The GI guns are 12.5 m apart and deployed at 5 m below the sea surface. These four sources are triggered in a flip-flop model with an interval of 9.375 m. A combination of three short streamers and a long streamer are towed behind the vessel and 100 m apart. The short streamers are 900 m long, and the long streamer is 2 500 m long. All of them are solid streamers. The receiver streamers are deployed 4 m below the sea surface. The final Hcable data is of high signal-to-noise ratio and has a bin size of 6.25 m×3.125 m. More detailed information on data acquisition can be found in Liu et al. (2022).
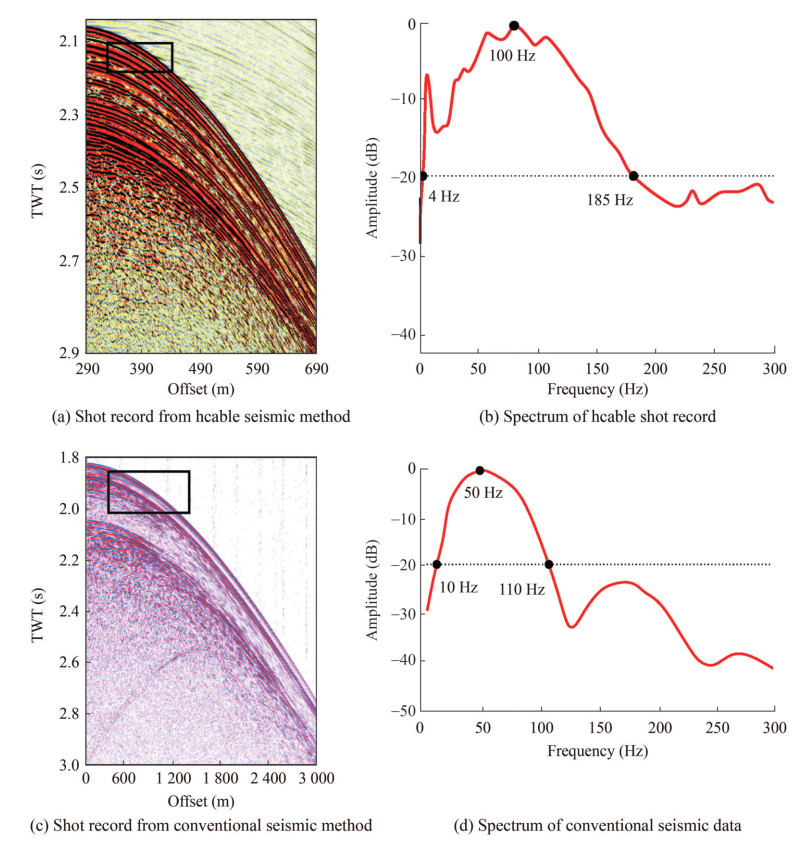 Figure 2 Comparison of seismic data from Harrow cable and conventional seismic method
A routine marine data processing workflow was applied to process the data, with the following steps: 1) geometry definition; 2) noise attenuation; 3) velocity analysis; 4) regularization; 5) time-domain migration. Although multiple attenuation is a fundamental step in marine seismic data processing, it is not used here because we are interested in only the shallow part, and the multiples are not involved in the target region. It should be noted that the velocity analysis of Hcable data is different from that of conventional seismic data because the short streamer data are not useful in velocity analysis. Only the long streamer data were extracted to perform velocity analysis. Prestack time migration was then applied to obtain the final image.
Figure 3 compares the images of a gas chimney structure with those of the conventional 3D seismic (Figure 3(a)) and Hcable seismic (Figure 3(b)) methods. Figure 4 compares the images of a mass transport deposit (MTD) from conventional 3D seismic (Figure 4(a)) and Hcable seismic (Figure 4(b)) methods. Figure 5 displays the slices at 2 200 ms. From these comparisons, it is clear that both the lateral and vertical resolutions are significantly improved by using the Hcable seismic method.
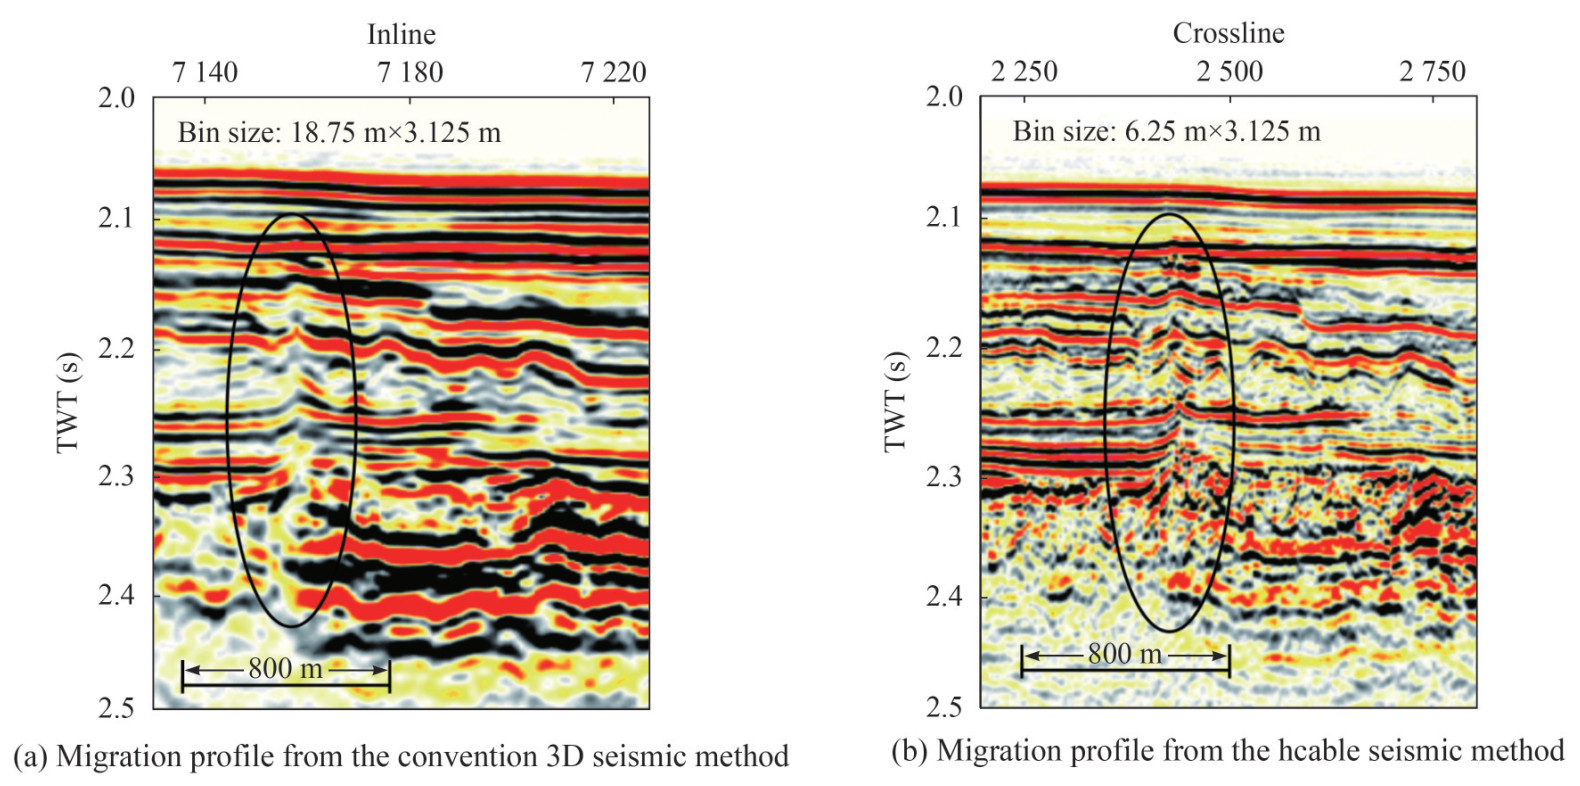 Figure 3 Seismic expressions of a gas chimney from different seismic data
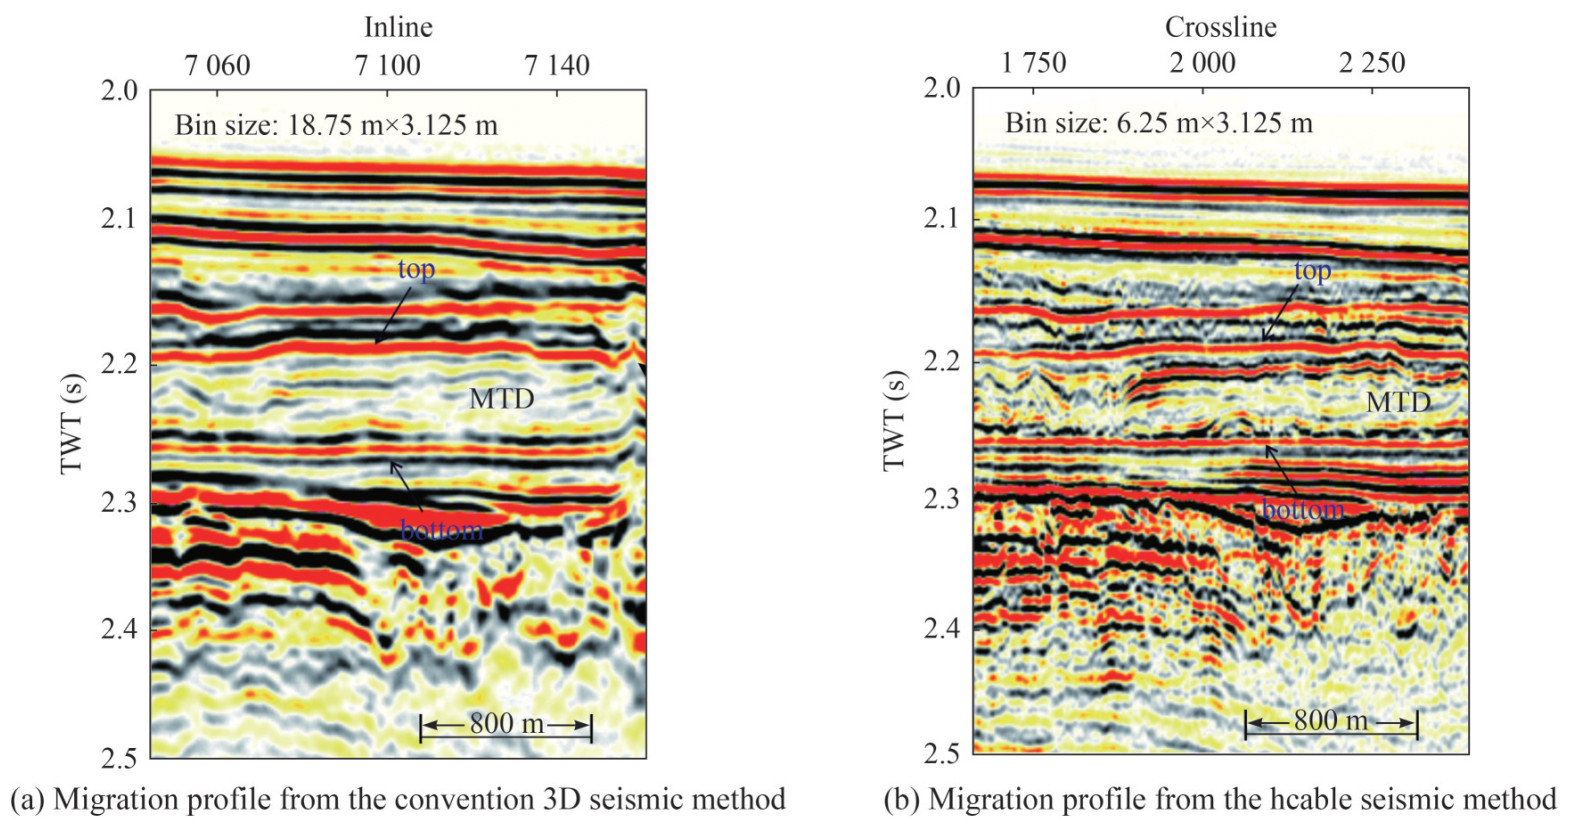 Figure 4 Seismic expressions of a mass transport deposit structure from different seismic data
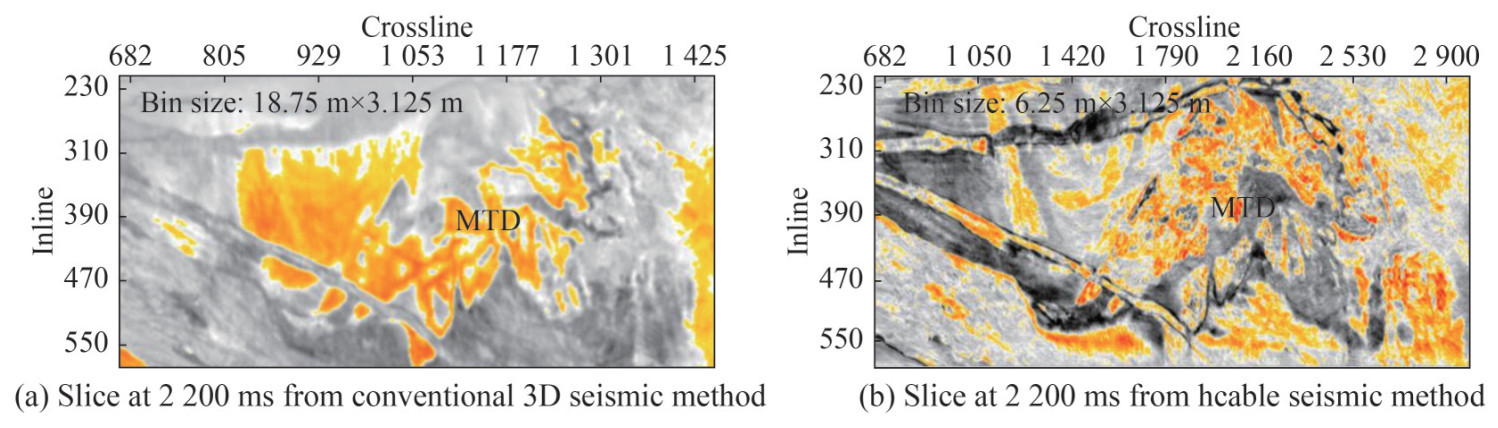 Figure 5 Comparison of Slices at 2 200 ms
4 Discussion on the use of Hcable in CCS
After injection of CO2 into the storage unit, it may migrate upward and spread over a large area. As stated above, the distribution of CO2 may be small scale. For the purposes of estimating the concentration and determining the growth of the CO2 plume, high-resolution seismic images are therefore necessary. Furthermore, when CO2 migrates upward, some fluid escapes the pipe structures or minor faults may be induced, which is similar to what occurs in cold seep areas (Riedel, 2007). In fact, the existing gas chimney structures are one of the focuses of the CCS project (Schramm et al., 2021; Robinson et al., 2021; Jedari-Eyvazi et al., 2023). Usually, these structures are small compared with the wavelength of the seismic wave used in conventional seismic surveys. A good monitoring program should characterize such small-scale structures with as high resolution as possible.
Seismic resolution is usually improved by widening the source frequency band (McGee, 2000; Wood et al., 2008), reducing the diameter of the Fresnel zone (Massret et al., 2014), and reducing the acquisition and migration bin size (Petersen et al., 2010). However, in most cases, only a 2D image is obtained. For example, in the Sleipner project, a 2D high-resolution survey was conducted in 2006 with a dominant frequency of 50 Hz.
The proposed Hcable seismic technique can produce a 3D high-resolution image of the subsurface structure. Improvement in resolution is achieved by using a high-frequency source with a dominant frequency over 100 Hz and a small bin of 6.25 m×3.125 m.
The potential of using Hcable to characterize small-scale structures is first demonstrated by the improved imaging of the gas chimney structure. This gas chimney structure provides an analog to possible CO2 leakage scenarios. For the Hcable seismic method, reflectors that cross through the gas chimney can be better traced. The boundary and the internal structure are also better delineated. All of these improvements could be useful for assessing the upward migration of CO2.
In addition, it is further demonstrated by the improved imaging of the internal structure of a MTD. The MTD is a sedimentary body formed due to the failure of the sediments on the shelf and may alter the original properties, generate traps, and influence migration pathways, which is similar to the case of CO2 migration. From this viewpoint, the MTD provides an analog to the storage unit of CO2. Even though the current 3D seismic approach is a very effective tool for investigating MTDs, imaging the internal structure remains difficult because MTDs experience complicated internal deformation. Comparisons in Figures 4‒5 reveal that the internal structure is well characterized on the Hcable profile but hard to distinguish on the conventional profile.
Given the usage of a high frequency source, the penetration depth may be an issue. In this work, only the shallow part (about 500 ms below he seafloor) is displayed because our primary attention is on the resolution issue in this work. However, in the previous work (Liu et al., 2022), reflection could be detected 4 s below the seafloor. Furthermore, a single GI gun of 210 cu. in is used in the current case study. A more powerful source can increase the penetration depth. So, the penetration depth of Hcable can cover the depth range of CCS project.
Based on the above results, we therefore expect that Hcable could be a promising tool for CCS project monitoring.
5 Conclusion
A CCS project must have integrated monitoring for a variety of reasons, including public support and safety assurance. It has long been established that seismic monitoring is an essential tool for CCS monitoring. However, one problem is that the large bin size and low dominant frequency (usually less than 50 Hz) of the typical 3D seismic approach prevent the creation of high-resolution, high-density seismic images. Herein, a newly developed Hcable method is presented for use in CCS monitoring. It uses high-frequency sources with a dominant frequency of over 100 Hz. It uses a harrow-like configuration to achieve a small-size bin (6.25 m×3.125 m). The case study demonstrates the ability of the developed Hcable to produce a 3D high-resolution image, within which a gas chimney structure and an MTD provide analogs to a potential leakage pathway and storage unit. The high-resolution characterization of the gas chimney structure and MTD demonstrates that Hcable is a promising tool for monitoring the subsurface structure within a CCS project.
Competing interest The authors have no competing interests to declare that are relevant to the content of this article. -
Figure 1 Illustration of the configuration of sources and receivers for the Hcable technique
Figure 2 Comparison of seismic data from Harrow cable and conventional seismic method
Figure 3 Seismic expressions of a gas chimney from different seismic data
Figure 4 Seismic expressions of a mass transport deposit structure from different seismic data
Figure 5 Comparison of Slices at 2 200 ms
-
Ajo-Franklin JB, Peterson J, Doetsch J, Daley TM (2013) High-resolution characterization of a CO2 plume using crosswell seismic tomography: Cranfield, MS, USA. International Journal of Greenhouse Gas Control 18: 497-509. https://doi.org/10.1016/j.ijggc.2012.12.018 Arts R, Chadwick A, Eiken O, Thibeau S, Nooner S (2008) Ten years' experience of monitoring CO2 injection in the Utsira Sand at Sleipner offshore Norway. First Break 26(1): 65-72. https://doi.org/10.3997/1365-2397.26.1115.27807 Arts R, Eiken O, Chadwick RA, Zweigel P, Van Der Meer L, Zinszner B (2004) Monitoring of CO2 injected at Sleipner using time-lapse seismic data. Energy 29: 1383-1393. https://doi.org/10.1016/j.energy.2004.03.072 Blackford J, Stahl H, Bull J M, Bergès BJP, Cevatoglu M, Lichtschlag A, Connelly D, James RH, Kita J, Long D, Naylor M, Shitashima K, Smith D, Taylor P, Wright I, Akhurst M, Chen B, Gernon TM, Hauton C, Widdicombe S (2014) Detection and impacts of leakage from sub-seafloor deep geological carbon dioxide storage. Nature Climate Change 4(11): 1011-1016. https://doi.org/10.1038/nclimate2381 Chadwick RA, Arts R, Eiken O, Kirby GA, Lindeberg E, Zweigel P (2004) 4D seismic imaging of an injected CO2 plume at the sleipner field, central North Sea. Geological Society Memoir 29(1): 311-320. https://doi.org/10.1144/GSL.MEM.2004.029.01.29 Chadwick RA, Marchant BP, Williams GA (2014) CO2 storage monitoring: Leakage detection and measurement in subsurface volumes from 3D seismic data at sleipner. Energy Procedia 63: 4224-4239. https://doi.org/10.1016/j.egypro.2014.11.458 Cheraghi S, White DJ, Draganov D, Bellefleur G, Craven JA, Roberts B (2017) Passive seismic reflection interferometry: A case study from the aquistore CO2 storage site, Saskatchewan, Canada. Geophysics 82(3): B79–B93. https://doi.org/10.1190/GEO2016-0370.1 Cowton LR, Neufeld JA, White NJ, Bickle MJ, White JC, Chadwick RA (2016) An inverse method for estimating thickness and volume with time of a thin CO2-filled layer at the Sleipner Field, North Sea. Journal of Geophysical Research: Solid Earth 121(7): 5068-5085. https://doi.org/10.1002/2016JB012895 Furre AK, Eiken O (2014) Dual sensor streamer technology used in Sleipner CO2 injection monitoring. Geophysical Prospecting 62(5): 1075-1088. https://doi.org/10.1111/1365-2478.12120 Furre AK, Eiken O, Alnes H, Vevatne JN, Kiær AF (2017) 20 years of monitoring CO2-injection at sleipner. Energy Procedia 114: 3916-3926. https://doi.org/10.1016/j.egypro.2017.03.1523 Ghosh R, Sen MK, Vedanti N (2015) Quantitative interpretation of CO2 plume from Sleipner (North Sea), using post-stack inversion and rock physics modeling. International Journal of Greenhouse Gas Control 32: 147-158. https://doi.org/10.1016/j.ijggc.2014.11.002 Harris K, White D, Melanson D, Samson C, Daley TM (2016) Feasibility of time-lapse VSP monitoring at the Aquistore CO2 storage site using a distributed acoustic sensing system. International Journal of Greenhouse Gas Control 50: 248-260. https://doi.org/10.1016/j.ijggc.2016.04.016 Jedari-Eyvazi F, Bayrakci G, Minshull TA, Bull JM, Henstock TJ, Macdonald C, Robinson AH (2023) Seismic characterization of a fluid escape structure in the North Sea: the Scanner Pockmark complex area. Geophysical Journal International 234(1): 597-619. https://doi.org/10.1093/gji/ggad078 Li JH, Yu FL, Niu XW, Zhou T, Zhang YX, Li WL (2023) Advances and future development of monitoring technologies for marine carbon storage. Advance in Earth Science 38(11): 1121-1144. DOI: 10.11867/j.issn.1001-8166.2023.071 Liang J, Zhang W, Lu JA, Wei JG, Kuang ZG, He Y (2019) Geological occurrence and accumulation mechanism of natural gas hydrates in the eastern Qiongdongnan Basin of the South China Sea: Insights from site GMGS5-W9-2018. Marine Geology 418: 106042. https://doi.org/10.1016/j.margeo.2019.106042 Liu B, Xu YX, Xue H, Wen PF, Meng DJ (2022) Seismic imaging of a seepage gas hydrate system with a harrow-like acquisition geometry. Acta Geophys 71: 1717-1728. https://doi.org/10.1007/s11600-022-00998-y Long AS (2004) The revolution in seismic resolution: High density 3D spatial sampling developments and results. ASEG Extended Abstracts 2004(1): 1-4. DOI:https://doi.org/ 10.1071/ASEG2004ab094 Marsset B, Menut E, Ker S, Thomas Y, Regnault JP, Leon P, Martinossi H, Artzner L, Chenot D, Dentrecolas S, Spychalski B, Mellier G, Sultan N (2014) Deep-towed high resolution multichannel seismic imaging. Deep-Sea Research Part Ⅰ: Oceanographic Research Papers 93: 83-90. https://doi.org/10.1016/j.dsr.2014.07.013 McGee TM (2000) A single-channel seismic reflection method for quantifying lateral variations in BSR reflectivity. Marine Geology 164(1-2): 29-35. https://doi.org/10.1016/S0025-3227(99)00124-3A Petersen CJ, Bünz S, Hustoft S, Mienert J, Klaeschen D (2010) High-resolution P-Cable 3D seismic imaging of gas chimney structures in gas hydrated sediments of an Arctic sediment drift. Marine and Petroleum Geology 27(9): 1981-1994. https://doi.org/10.1016/j.marpetgeo.2010.06.006 Pevzner R, Isaenkov R, Yavuz S, Yurikov A, Tertyshnikov K, Shashkin P, Gurevich B, Correa J, Glubokovskikh S, Wood T, Freifeld B, Barraclough P (2021) Seismic monitoring of a small CO2 injection using a multi-well DAS array: Operations and initial results of stage 3 of the CO2 CRC Otway project. International Journal of Greenhouse Gas Control 110: 103437. https://doi.org/10.1016/j.ijggc.2021.103437 Riedel M (2007) 4D seismic time-lapse monitoring of an active cold vent, northern Cascadia margin. Mar Geophys Res 28: 355-371. https://doi.org/10.1007/s11001-007-9037-2 Ringrose P, Atbi M, Mason D, Espinassous M, Myhrer Ø, Iding M, Mathieson A, Wright I (2009) Plume development around well KB-502 at the In Salah CO2 storage site. First Break 27(1): 85-89. https://doi.org/10.3997/1365-2397.27.1295.28744 Robinson AH, Callow B, Böttner C, Yilo N, Provenzano G, Falcon-Suarez IH, Marín-Moreno H, Lichtschlag A, Bayrakci G, Gehrmann R, Parkes L, Roche B, Saleem U, Schramm B, Waage M, Lavayssière A, Li J, Jedari-Eyvazi F, Sahoo S, Reinardy B (2021) Multiscale characterisation of chimneys/pipes: Fluid escape structures within sedimentary basins. International Journal of Greenhouse Gas Control 106. https://doi.org/10.1016/j.ijggc.2020.103245 Schramm B, Berndt C, Dannowski A, Böttner C, Karstens J, Elger J (2021) Seismic imaging of an active fluid conduit below Scanner Pockmark, Central North Sea. Marine and Petroleum Geology 133. https://doi.org/10.1016/j.marpetgeo.2021.105302 Trautz R, Daley T, Miller D, Robertson M, Koperna G, Riestenberg D (2020) Geophysical monitoring using active seismic techniques at the Citronelle Alabama CO2 storage demonstration site. International Journal of Greenhouse Gas Control 99. https://doi.org/10.1016/j.ijggc.2020.103084 Wen PF, Liu B, Xu YX, Xue HYZ, Li Y, Meng DJ, Lu YQ (2021) Novel seismic exploration technique targeting fine characterization of marine gas hydrates: seismic exploration with a harrow-like acquisition geometry. Progress in Geophysics 36(5): 2215-2221. DOI: 10.6038/pg2021EE0279 Widmaier M, Tønnessen R, Oukili J, Roalkvam C (2020) Recent advances with wide-tow multi-sources in marine seismic streamer acquisition and imaging. First Break 38(12): 75-79. https://doi.org/10.3997/1365-2397.fb2020093 Williams G, Chadwick A (2012) Quantitative seismic analysis of a thin layer of CO2 in the Sleipner injection plume. Geophysics 77(6): R245–R256. https://doi.org/10.1190/geo2011-0449.1 Wood WT, Hart PE, Hutchinson DR, Dutta N, Snyder F, Coffin RB, Gettrust JF (2008) Gas and gas hydrate distribution around seafloor seeps in Mississippi Canyon, Northern Gulf of Mexico, using multi-resolution seismic imagery. Marine and Petroleum Geology 25(9): 952-959. https://doi.org/10.1016/j.marpetgeo.2008.01.015 Yan H, Dupuy B, Romdhane A, Arntsen B (2019) CO2 saturation estimates at Sleipner (North Sea) from seismic tomography and rock physics inversion. Geophysical Prospecting 67(4): 1055-1071. https://doi.org/10.1111/1365-2478.12693
