
Simulation Study on the Migration Range of CO2 in the Offshore Saline Aquifer
https://doi.org/10.1007/s11804-024-00560-w
-
Abstract
The geological storage of carbon dioxide (CO2) is a crucial technology for mitigating climate change. Offshore deep saline aquifers have elicited increased attention due to their remarkable potential for storing CO2. During long-term storage, CO2 migration in a deep saline aquifer needs special attention to prevent it from reaching risk points and leading to security issues. In this paper, a mechanism model is established according to the geological characteristics of saline aquifers in an offshore sedimentary basin in China. The CO2 migration over 100 years is simulated considering geological changes such as permeability, dip angle, thickness, and salinity. The effects of injection conditions on the CO2 migration range are also investigated. Results reveal that the migration range of CO2 in the injection period exceeds 70%, even if the post-injection period's duration is five times longer than that of the injection period. As the values of the above geological parameters increase, the migration range of CO2 increases, and permeability has a particularly substantial influence. Moreover, the influences of injection rate and well type are considerable. At high injection rates, CO2 has a greater likelihood of displacing brine in a piston-like scheme. CO2 injected by long horizontal wells migrates farther compared with that injected by vertical wells. In general, the plane migration range is within 3 000 m, although variations in the reservoir and injection parameters of the studied offshore saline aquifers are considered. This paper can offer references for the site selection and injection well deployment of CO2 saline aquifer storage. According to the studied offshore aquifers, a distance of at least 3 000 m from potential leakage points, such as spill points, active faults, and old abandoned wells, must be maintained.Article Highlights● The migration behavior of CO2 plume over time is accurately simulated considering the structural, residual, and dissolution trapping mechanisms.● The influence of geological and injection parameters on long-term CO2 migration in the deep saline aquifers of an offshore sedimentary basin in China is systematically investigated.● The migration range of CO2 plume under the geological conditions of the study offshore saline aquifers is estimated. -
1 Introduction
The public is progressively expressing greater alarm over greenhouse gas emissions, and more countries are taking steps to solve the problems brought about by climate change (IPCC, 2023; Breton and Sbragia, 2017; Basseches et al., 2022; Wei et al., 2021). China has committed to achieving a CO2 emission peak before 2030 and carbon neutrality before 2060 (Xi, 2020). Carbon dioxide capture and storage (CCS) is a key technology for CO2 emission reduction. CCS primarily means the injection of the captured high-purity CO2 into selected safe geological structures for permanent storage. Generally, depleted oil and gas reservoirs, unminable coal beds, and deep saline aquifers are all possible formations for CO2 storage (Zhang et al., 2014; Yang et al., 2017; Wang et al., 2023; Wong et al., 2007; Medici et al., 2019a, 2019b). Deep saline aquifers are widely distributed and are the most feasible alternative for CCS (Bachu and Adams, 2003; Li et al., 2023). Previous research showed that over 1 000 billion tons of CO2 can be stored in deep saline aquifers of China (Dahowski et al., 2009; Guo et al., 2014). Over the decades, several pilot or commercial saline aquifer CO2 storage projects have been ongoing or suggested; examples include the Sleipner and Northern Lights in the North Sea (Furre et al., 2017; Zhou et al., 2023; Mi, 2023), In Salah in Algeria (Ringrose et al., 2013), and Gorgon in Australia (Li et al., 2019). In China, the storage of CO2 in saline aquifers remains in the exploratory stage. The Shenhua Ordos CCS project (Wu, 2013) and CNOOC's CCS project at the Enping 15-1 oilfield (Yi et al., 2023; Mi, 2023) are presently the only two demonstration projects that have been implemented, onshore and offshore, respectively.
Careful site selection, characterization, and injection practices are required for long-term security. After injection into saline aquifers, a combination of physical and geochemical processes occurs (IPCC, 2005; Seyyedi et al., 2016). The CO2 plume migrates longitudinally and laterally within the reservoir. Comprehending the lateral migration of the CO2 plume can facilitate answering the question of whether CO2 can reach possible risk points. Several researchers have forecast the CO2 migration range according to demonstration projects (Shi et al., 2019; Ahmadinia et al., 2020; Strandli et al., 2014; Liu et al., 2014). For example, Karstens et al. (2017) estimated the evolution of the CO2 plume in the Sleipner Project through iterative history matching. Their long-term simulations showed that under the current injection scheme, CO2 cannot reach the possible leakage pathway, namely, a chimney structure 7 000 m away from the injection well. Xie et al. (2015a, 2015b) forecast the dynamics of the plume in the Shenhua CCS Project by using numerical simulation. The maximum lateral distance of the CO2 plume would reach approximately 1 000 m 100 years after the injection. Ziemkiewicz et al. (2016) used CO2-PENS, a system analysis tool, to assess the CO2 plume radius in the Guantao and Donying formations of the Bohai Bay Basin. After ten years, the mean radius of the injection at 0.1 and 1 million tons per year (Mt/a) were 1.22 and 3.85 km, respectively.
Moreover, the effects of several parameters on CO2 migration have been studied through analytical and numerical modeling (Birkholzer et al., 2015; Dai et al., 2018). Jing (2021) simulated the effect of formation slope and brine salinity using an improved simulator based on TOUGH2-ECO2N. In situations of high brine salinity and large formation slope, the CO2 plume moves a longer distance. Sohal et al. (2021) analyzed the effect of geological parameters based on the characterization of the Hontomín saline aquifer. Heterogeneity in the permeability and porosity of the matrix slow down the migration of CO2. Afanasyev et al. (2023) focused on the migration in a sloping aquifer during the post-injection period. They found that the shape of the plume at the time the injection well is shut in influences the subsequent migration. They also proposed a new simple relationship to estimate the maximum migration distance of the plume.
The study area, located in the largest Meso – Cenozoic superimposed basin in offshore China, is one of the most promising sites for CO2 storage. However, few scholars have studied the migration of CO2 in deep saline aquifers in this area. This paper aims to obtain the migration range of CO2 under the geological conditions of the area. The goals are to utilize numerical simulation techniques to 1) describe the migration behavior of CO2 in the aquifers during and after injection, 2) determine the effects of the geological and injection parameters on the CO2 migration range, and 3) summarize the CO2 migration range under definite reservoir and injection parameter changes. The migration range of CO2 in deep saline aquifers can be considered the minimum safety distance between the injection and risk points when designing CCS projects in the study area.
2 Geological settings
The study area is situated in the greatest offshore sedimentary basin of China. The study area has tectonically undergone the evolution of a rifting stage, a thermal depression stage, and a regional subsidence stage. Studies reveal that the thickness of the Meso – Cenozoic stratum almost reaches 10 000 m. Saline aquifers are widely developed in the Miocene Series formation. According to the United States Department of Energy and the China Geological Survey, the CO2 storage capacity in the deep saline aquifers of the basin is approximately over 100 billion tons of CO2 (Dahowski et al., 2009; Guo et al., 2014). Hence, the basin is one of the most promising sites for storing CO2 emissions from the southeastern coastal areas of China.
The study area mainly features large anticlines with a formation dip of less than 10°. The study area has two sets of high-quality regional seals and several sets of local seals. Potential saline aquifers are situated at depths of about 1 000 m and contain high-salinity brine (20 000 mg/L). The study area develops the braided river delta-front sub-facies. The lithology is primarily sandstone dominated by quartz. Large thicknesses and favorable properties also render it appropriate for CO2 storage. The formation thickness, which is generally around 100 m, ranges from 10 m to 200 m. The porosity is about 20%, whereas the permeability varies greatly, ranging from 10 mD to 1 000 mD. Moreover, CO2 can arrive at the supercritical state under the formation temperature and pressure conditions, with a temperature range of 58–63 ℃ and a pressure coefficient of 0.99.
3 Model establishment
3.1 Base model description
The CO2STORE module of the Schlumberger Eclipse 300 simulator is used in this study. The reactions between CO2 and soil minerals are excluded from this study because mineral trapping takes a very long time, for example, hundreds or even thousands of years (IPCC, 2005). Three primary mechanisms, namely, structural trapping, residual trapping, and solubility trapping, are considered on the simulation time scale. The drainage and imbibition curves are computed using Killough's method (Killough, 1976) to represent residual trapping. The procedures proposed by Spycher and Pruess (2005, 2009) are used to determine the mutual solubilities of CO2 and H2O.
To study the migration behavior of CO2 in the aquifers during and after injection, a homogeneous saline aquifer model is established based on the geological characteristics of the target CO2 storage aquifers in the study area. The aquifer parameters of the base model are presented in Table 1, and the relative permeability curves used for simulation are shown in Figure 1. The model has dimensions of 5 000 m×5 000 m×100 m and an injection well at the center, as illustrated in Figure 2. CO2 is continuously injected into the aquifer for 20 years, and then the injection well is shut in while the simulation proceeds for another 100 years. In the base simulation scenario, a vertical well with a injection rate of 0.2 Mt/a of CO2 is implemented in this study.
Table 1 Aquifer parameters of the base modelParameter Value Model size (m×m×m) 5 000×5 000×100 Grid size (m×m×m) 50×50×5 Top depth (m) −1 000 Porosity (%) 20 Permeability (mD) 100 Dip angle (°) 0 Initial pressure (MPa) 10 Temperature (℃) 60 Brine salinity (mg/L) 20 000 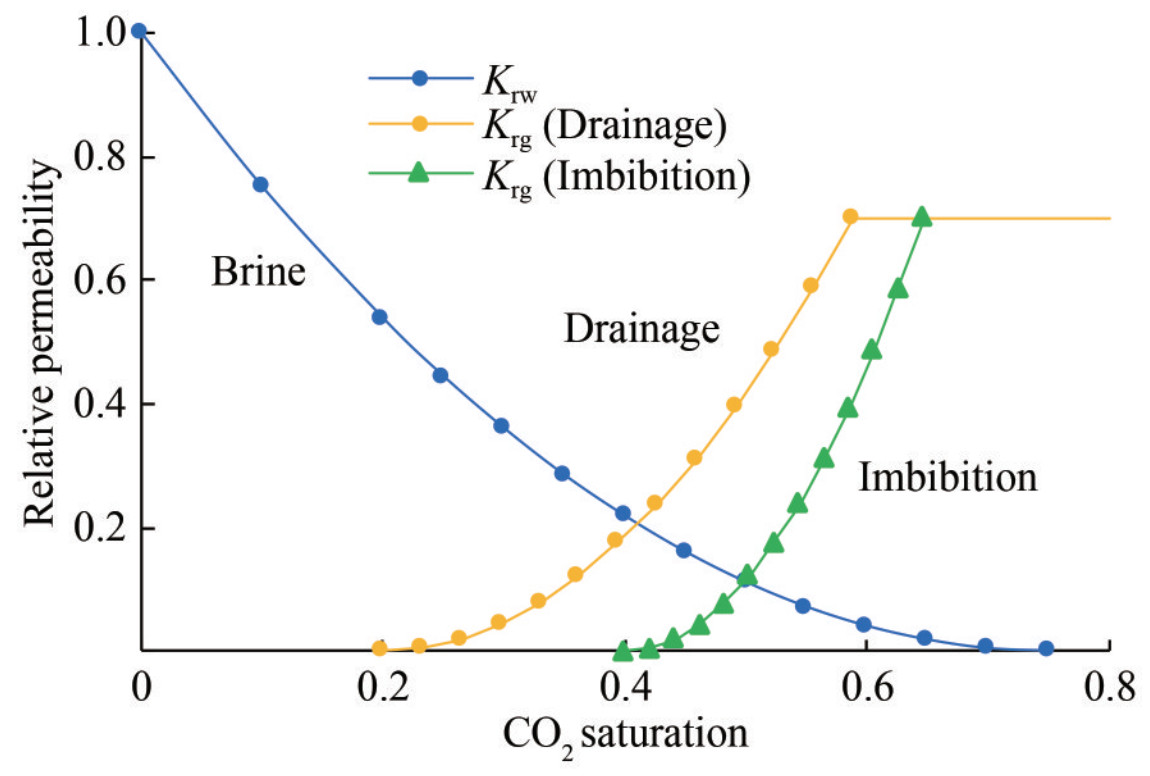 Figure 1 Relative permeability curves of CO2 and brine phase
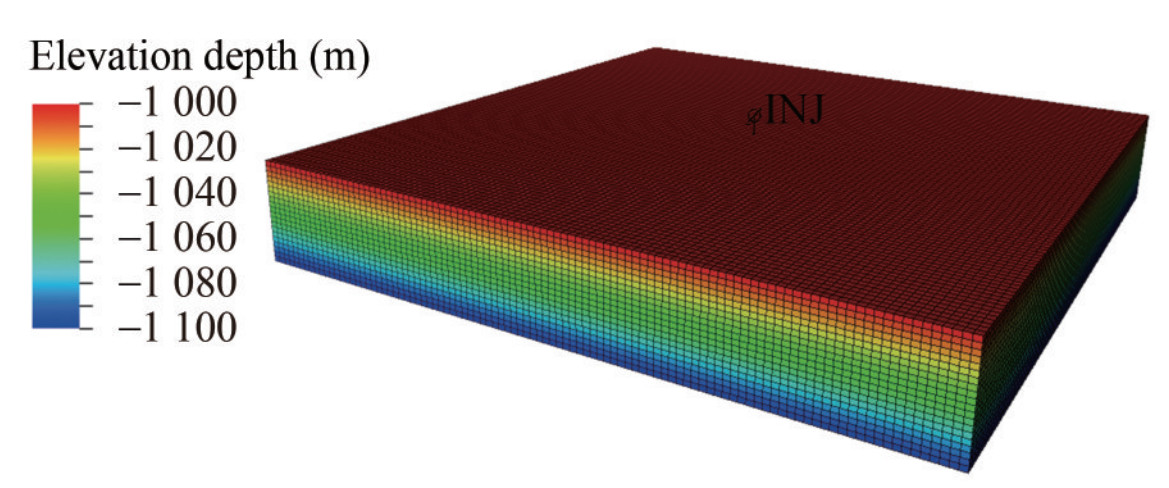 Figure 2 Mechanism model of CO2 storage in a saline aquifer
3.2 Case studies
Geological data from the seismic survey and petroleum exploration and production wells in the promising CO2 storage area indicate that reservoir thickness, permeability, and formation dip vary within a certain range. Some uncertainty regarding the brine salinity of the aquifers may exist owing to the lack of specialized CCS pilot wells. Thus, four geological parameters are considered in the case studies: reservoir permeability, reservoir slope angle, reservoir thickness, and formation brine salinity. In addition, the influence of injection rate and horizontal well length are studied. The changes in the geological and injection parameters are presented in Table 2, and the sensitivities of each parameter to the migration range are studied.
Table 2 Variable parameters in each case studyParameter Value Permeability (mD) [1, 10, 50, 100, 200, 500, 800, 1 000, 1 500] Dip angle (°) [0, 1, 3, 5, 8, 10] Thickness (m) [20, 50, 100, 120, 150, 200] Salinity (mg/L) [0, 5 000, 10 000, 20 000, 30 000, 40 000, 50 000] CO2 injection rate (Mt/a) [0.1, 0.2, 0.5, 0.8, 1] Horizontal well length (m) [0, 500, 1 000, 1 500, 2 000] 4 Results
4.1 CO2 migration in the base model
Figures 3 and 4 show the CO2 mole saturation profiles of the base case at four simulation time steps: 1, 10, 20, and 120 years. The injected CO2 is driven upward due to the buoyancy effect from the density difference with the formation brine. After reaching the impermeable overlaying cap layers, the CO2 begins to migrate laterally. Some of the CO2 dissolves into the aquifer as the plume moves longitudinally and laterally. Residual trapping happens when saturation decreases due to the buoyancy effects and dissolution processes. Consequently, the CO2 phase saturation gradually decreases from the injection well outward.
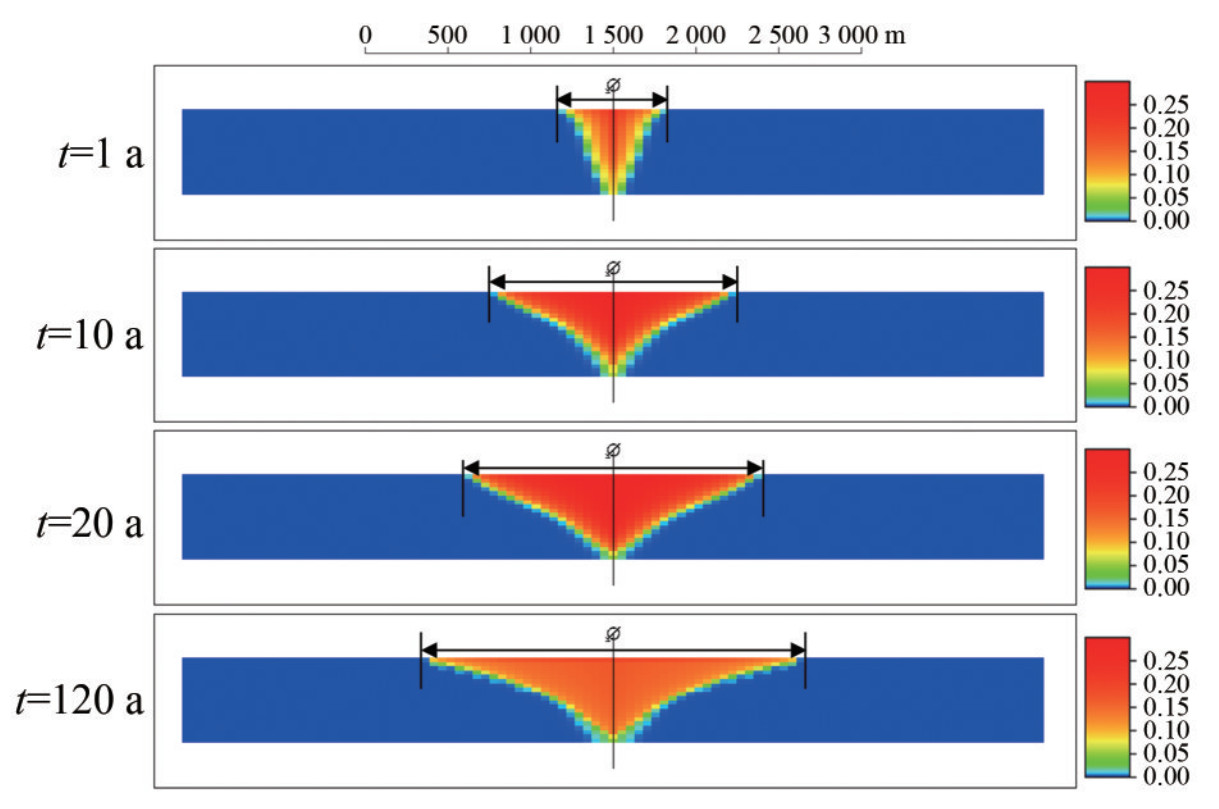 Figure 3 CO2 distributions in the base simulation case
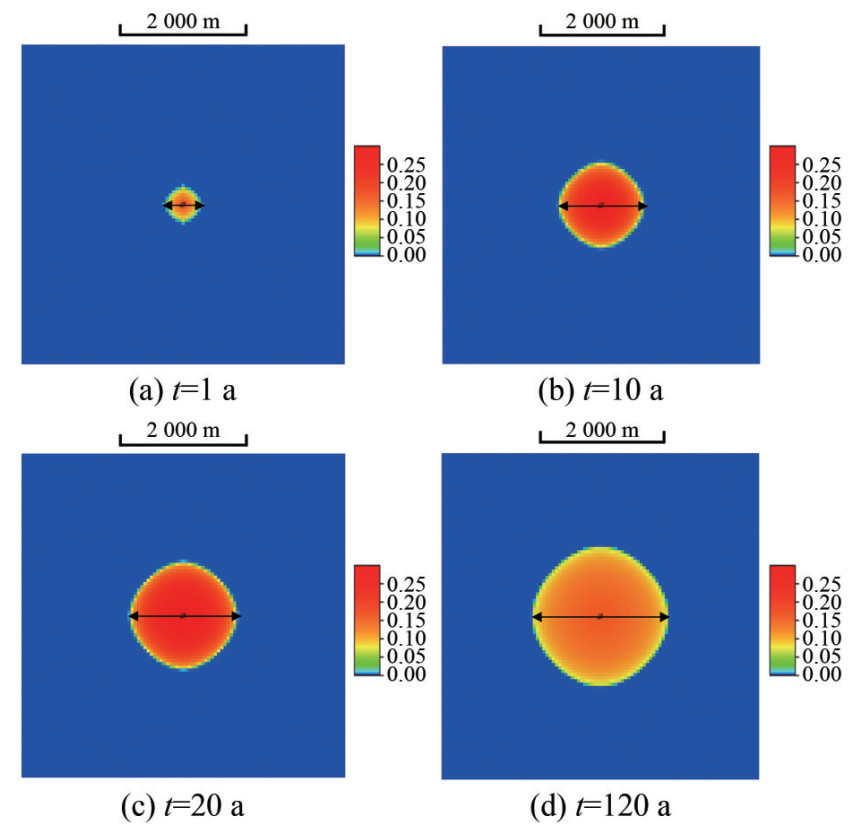 Figure 4 Plane migration of CO2 in the base simulation case
For convenience, the overall lateral distance of the CO2 plume is defined as the migration range, as shown in Figures 3 and 4. The migration range of the CO2 varies over simulation time, as shown in Figure 5. Results indicate that the CO2 plume primarily migrates during the injection period rather than the post-injection period, although the duration of the post-injection period is five times longer than that of the injection period. Specifically, the migration range at the end of the 20-year injection period accounts for over 70% of the total range within the simulated time scale.
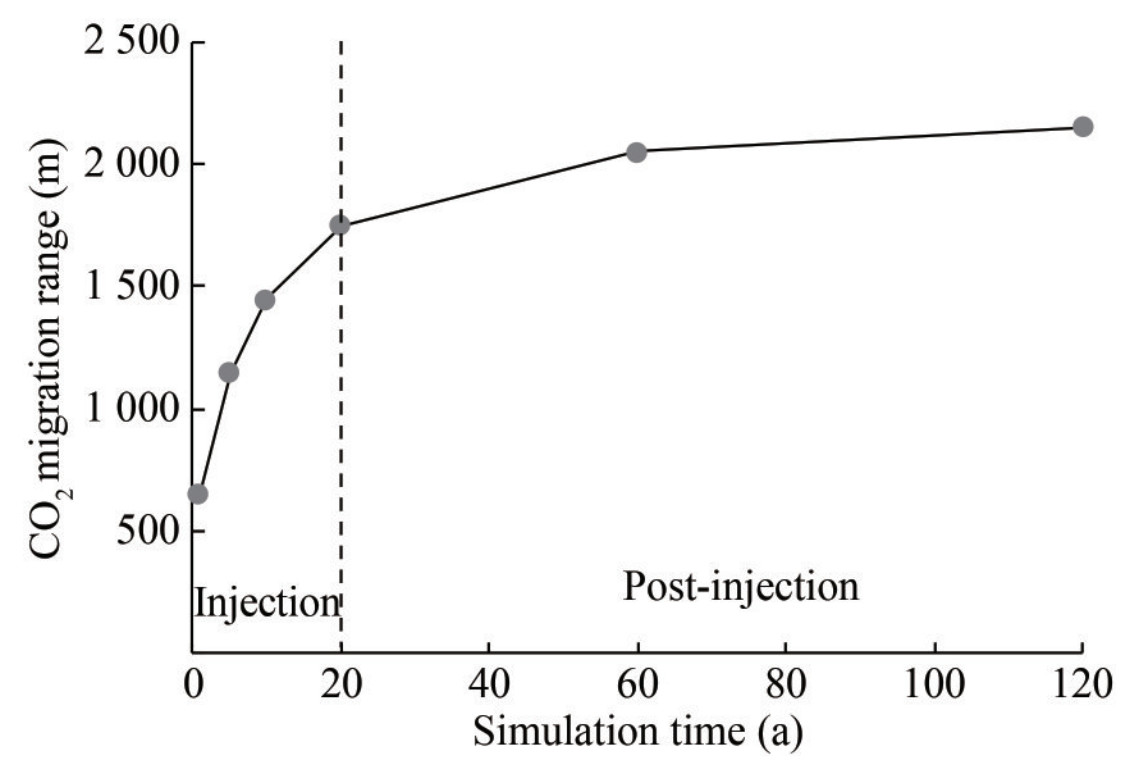 Figure 5 Variation of CO2 migration range with simulation time
4.2 Effect of geological parameters
4.2.1 Reservoir permeability
Figure 6 presents the distribution of CO2 mole fraction in aquifers under diverse permeability conditions after a 120-year simulation. High aquifer permeability increases the potential migration range of the CO2 plume. The longitudinal and lateral migration both become easier with an increase in aquifer permeability. Meanwhile, more CO2 dissolves in the brine of the upper formation, leading to convective mixing. In high-permeability aquifers, dense brine dissolved with CO2 falls, creating plumes that resemble fingers. The fingers become more evident as the permeability increases, which may slow down the lateral migration of CO2.
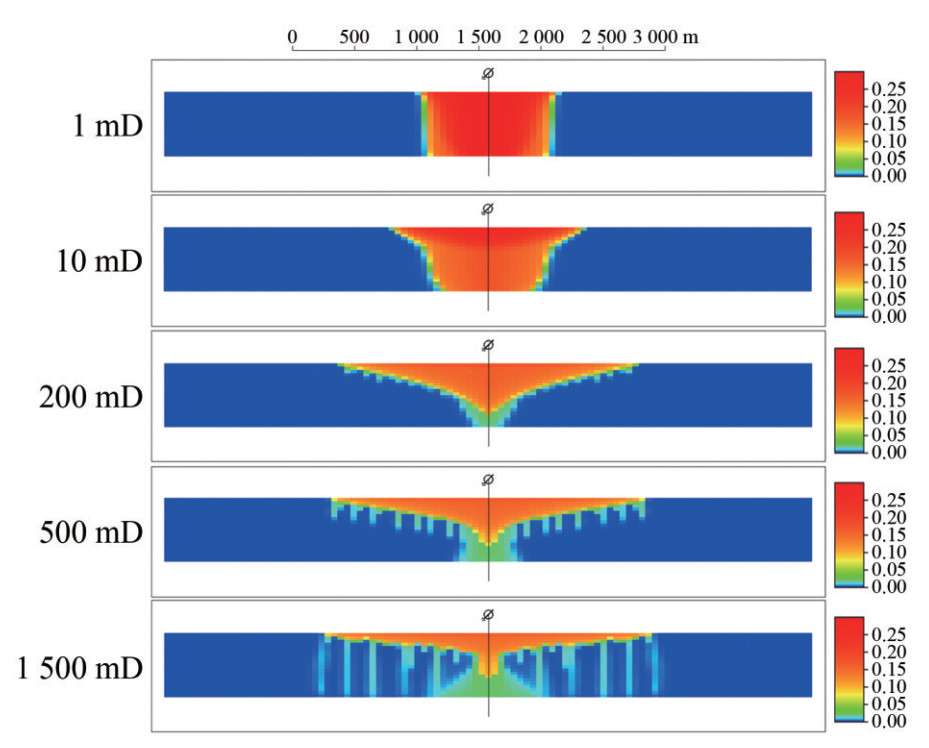 Figure 6 Distributions of CO2 in saline aquifers with various permeabilities (t = 120 a)
Figure 7 shows the migration range of the CO2 plume changes similarly with permeability at different simulation time steps. When the permeability is less than 200 mD, the migration range substantially increases with the increase of permeability. As the permeability increases further, the increase of the migration range becomes less substantial due to the influence of convective mixing. Moreover, the CO2 plume migration range increases substantially during the injection period, while the expansion of the CO2 plume is limited after the injection well is shut in. Taking the case with a 200 mD permeability as an example, the migration ranges at 10, 20, and 120 years are 1 550, 1 850, and 2 350 m, respectively. The migration range during the injection period accounts for 79%.
 Figure 7 Variation of CO2 migration range with reservoir permeability
4.2.2 Dip angle
The stratum of the target CO2 storage aquifers is almost horizontal, with a slight dip in areas. The distributions of the CO2 mole fraction in aquifers dipping at 0° – 10° are presented in Figures 8 and 9. The vertical scale of the map is 1:3.
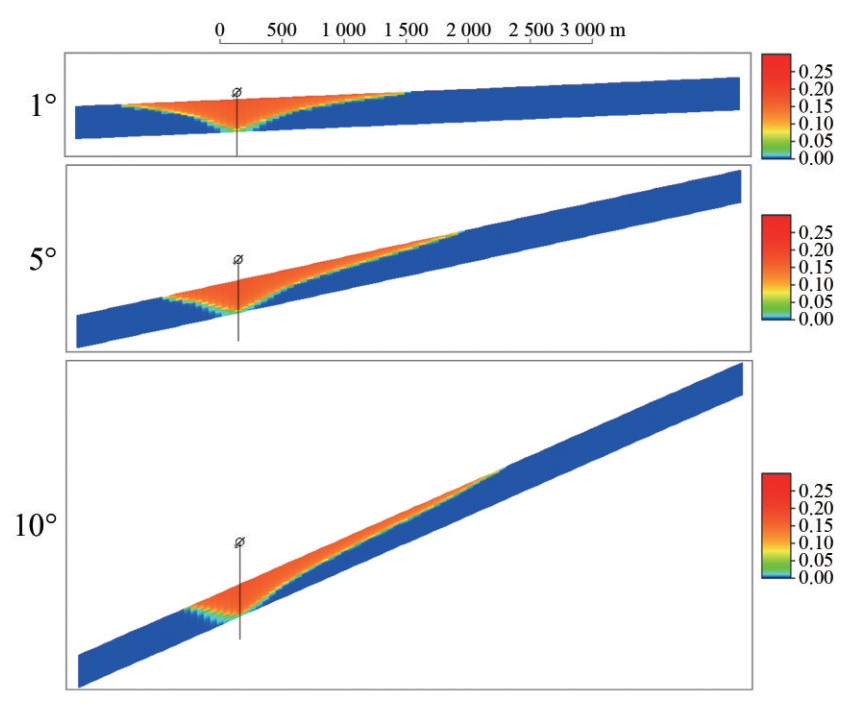 Figure 8 Distributions of CO2 in saline aquifers with various dip angles (t = 120 a)
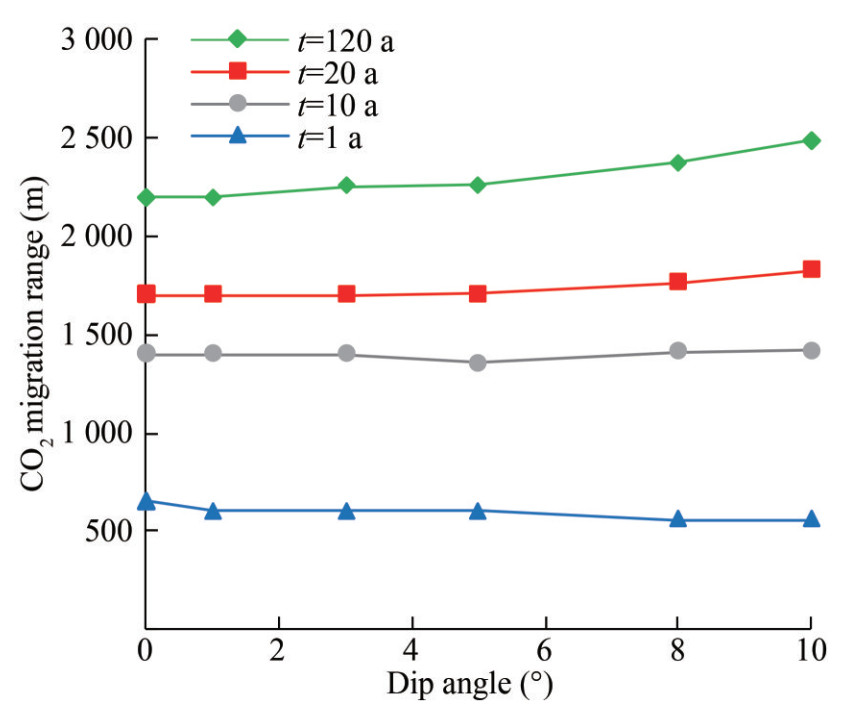 Figure 9 Variation of CO2 migration range with dip angle
Injection into dipping saline aquifers causes CO2 to behave differently compared with that in horizontal aquifers. When CO2 arrives at the bottom of the overlaying cap layer, it proceeds to move upward owing to the influence of buoyancy. Hence, more of the injected CO2 migrates to the updip direction. During the process, more fresh water comes into contact with the CO2 plume, which can enhance the process of dissolution.
The simulation presents that the greater the dip angle of the formation, the larger the upward migration range, while the smaller the downward migration range. However, the effect of reservoir dip angle on the entire range of CO2 plume migration is not substantial, as shown in Figure 8. After the 120-year simulation, the migration range of CO2 for the horizontal case is 2 200 m, whereas that in the case of an aquifer with a dip angle of 10° is 2 488 m, which is a 13% increase. Thus, aquifers with a slight dip angle, such as 1°–5°, can also be appropriate for CO2 storage because the effect on the entire migration range is restricted.
4.2.3 Reservoir thickness
The injected CO2 first migrates longitudinally due to the influence of buoyancy and then laterally after arriving at the bottom of the overlaying cap rocks. The thickness of the reservoir influences the longitudinal migration of CO2, which may also have a bearing on lateral migration.
At the end of the simulation (t =120 a), the CO2 plume distributions in saline aquifers with diverse reservoir thicknesses range from 20 m to 200 m, as shown in Figure 10. The results reveal that when the reservoir thickness is less than 120 m, the CO2 migration range continuously increases with the increase of thickness. When the reservoir thickness increases to 120 m, the injected CO2 is primarily distributed at the top and middle of the reservoir despite the same injection amount. The thickness of the reservoir no longer influences the lateral migration. The maximum migration range of the CO2 plume is approximately 2 250 m.
 Figure 10 Distributions of CO2 in saline aquifers with various reservoir thicknesses (t = 120 a)
Figure 11 shows that the 20-year injection period remains the primary period for migration, accounting for 78%–90% of the total. The CO2 lateral migration range varies with reservoir thickness over diverse observation times. In the early stages of injection, reaching the bottom of the cap rocks takes a longer time in thick reservoirs, causing smaller lateral migration ranges. The plume migration range in the 200 m reservoir is 15% smaller than that in the 50 m reservoir after CO2 injection for 1 year. In the middle to late stages of the simulation, the lateral migration range of CO2 is larger in thick reservoirs, but its effect is not substantial.
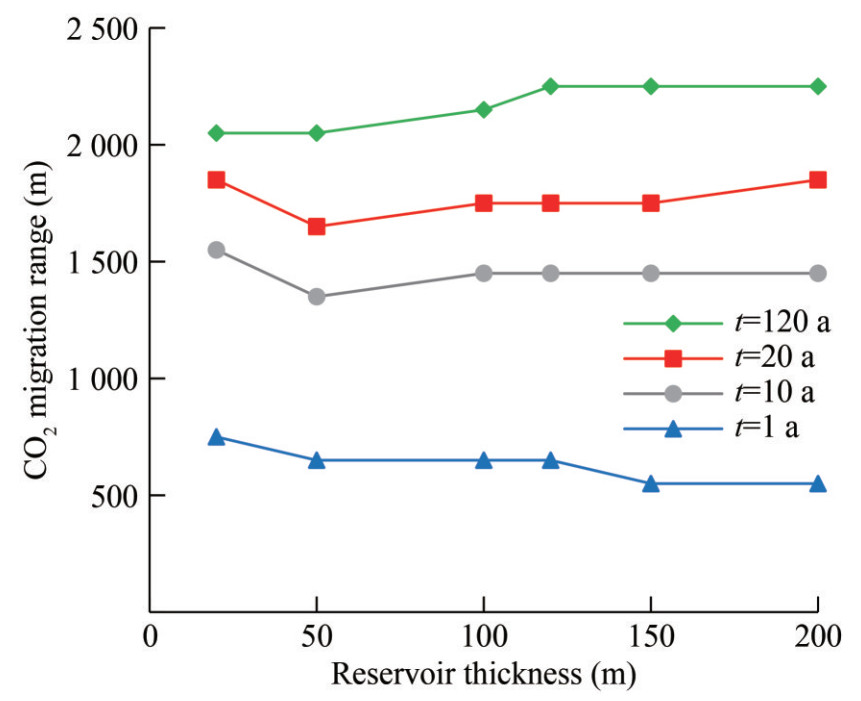 Figure 11 Variation of CO2 migration range with reservoir thickness
4.2.4 Brine salinity
Theoretically, low brine salinity is beneficial to CO2 dissolution. The migration of CO2 in aquifers with salinity ranging from 0 mg/L to 50 000 mg/L is simulated.
The effect of brine salinity on migration range is not substantial, as shown in Figures 12 and 13. At the end of the simulation, the range of the high-salinity case is slightly larger than that of the low-salinity cases. The primary reason is that the solubility of CO2 decreases in high-salinity brine, causing more CO2 to exist as a free phase. The CO2 plume migrates farther over time, and the migration range during the injection period accounting for 77%–90% of the total.
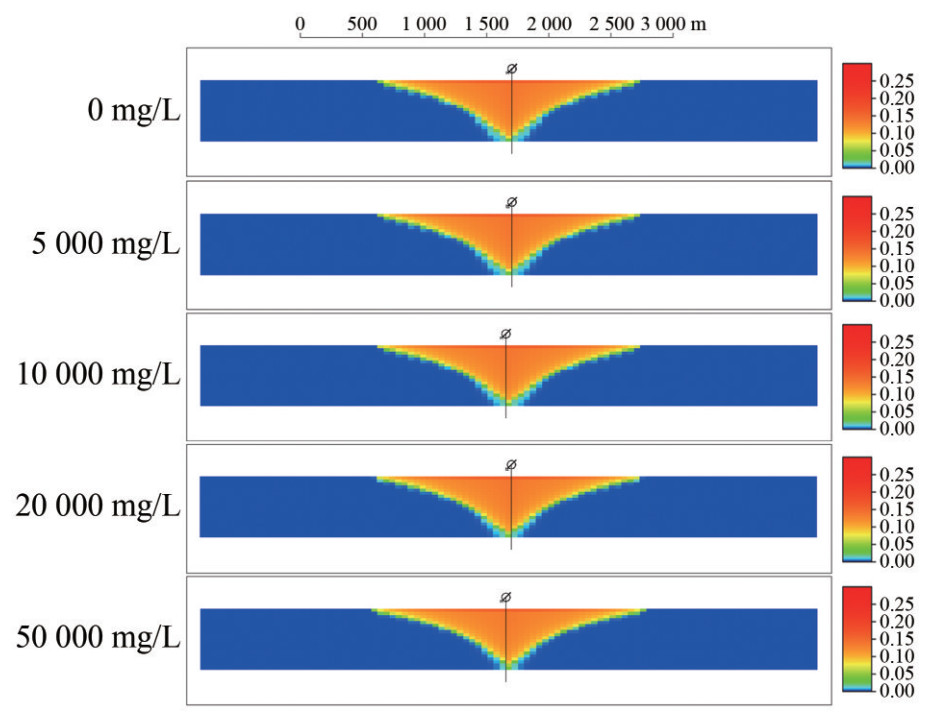 Figure 12 Distributions of CO2 in saline aquifers with various brine salinities (t = 120 a)
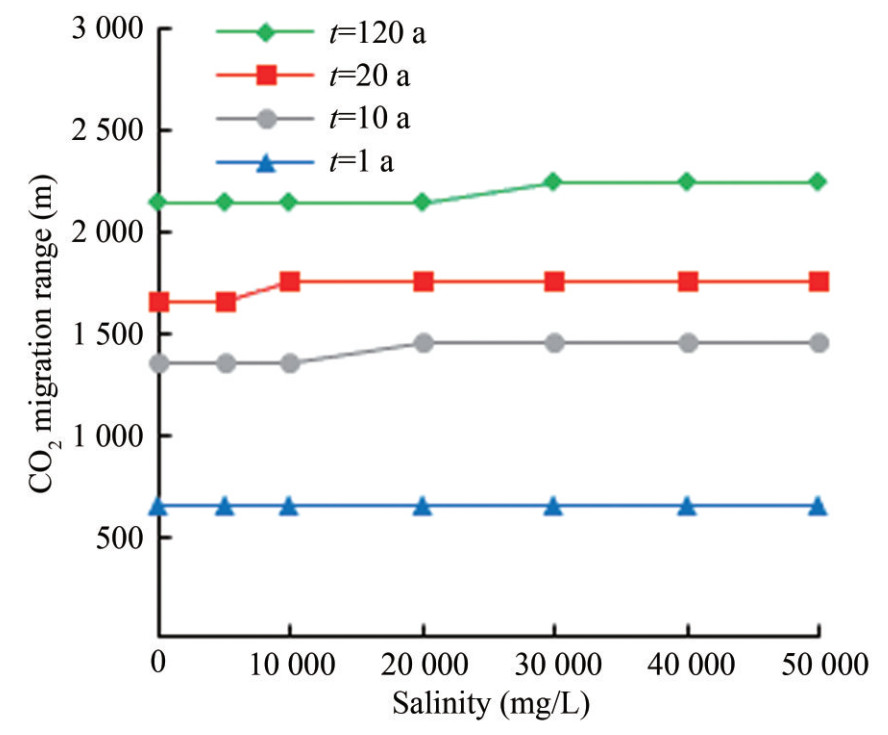 Figure 13 Variation of CO2 migration range with brine salinity
4.3 Effect of injection parameters
4.3.1 Injection rate
Based on worldwide pilot and commercial saline aquifer storage projects, the yearly CO2 injection rate of a single well ranges from 0.1 Mt to 1 Mt. Five different injection rates within this range are selected for sensitivity study in this section. A tolerant pressure limit is implemented in this study. When the average reservoir pressure is lower than the fracture pressure of the cap rock, CO2 can be continuously injected. None of the simulated scenarios reach the pressure limit during the injection.
Figure 14 presents the distributions of CO2 after a 120-year simulation. A remarkable difference is noted in the shape of these cases. At high injection rates, CO2 is more likely to displace the brine in a piston-like mode rather than form a plume. Therefore, the CO2 in the middle and lower parts of the reservoir migrates farther, whereas the overall migration range along the top of the reservoir only slightly increases. The injection rate is more influential on migration at low levels, as shown in Figure 15. The migration range at the end of the simulation increases by 26% when the annual injection rate of CO2 increases from 0.1 Mt to 0.5 Mt. For higher injection rates, the migration range remains basically unchanged. The higher average saturation and pressure in scenarios with a higher injection rate may help CO2 migrate further over the next few hundred years. Overall, the increase in migration range during the post-injection period is restricted, and the CO2 migration range remains within 3 000 m.
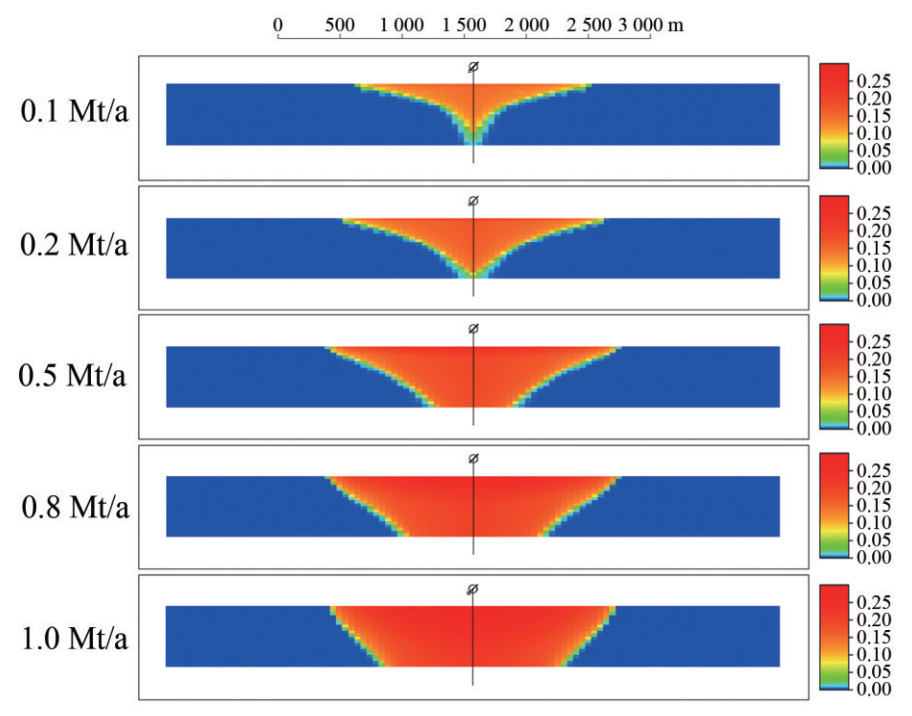 Figure 14 Distributions of CO2 in the saline aquifer at various injection rates (t = 120 a)
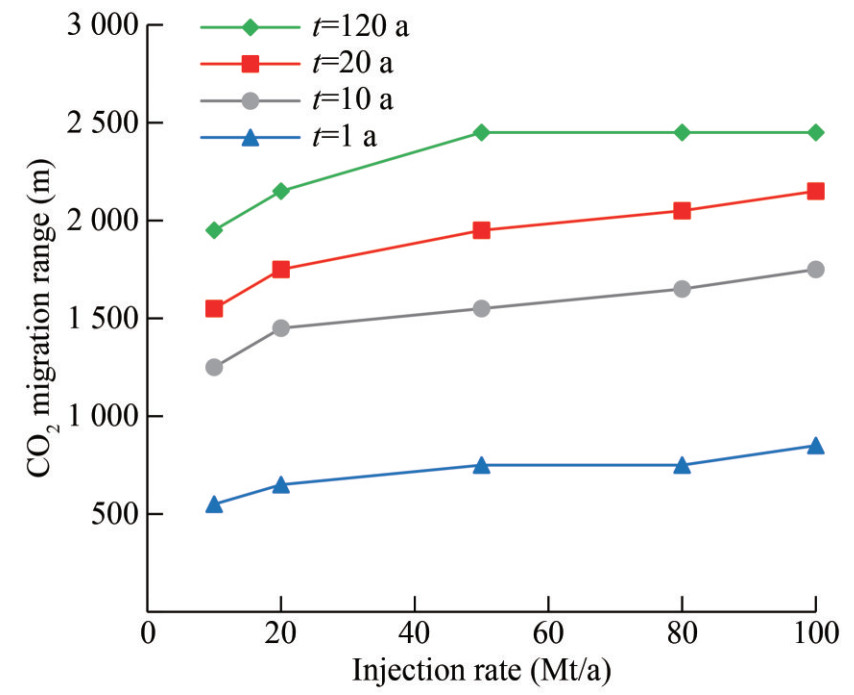 Figure 15 Variation of CO2 migration range with injection rate
4.3.2 Horizontal well length
The effect of injection well type, including vertical and horizontal wells, is discussed in this section.
Compared with a vertical well, the CO2 plume migrates farther when injected with a horizontal well, as illustrated in Figures 16 and 17. The migration range increases with the increase of horizontal well length. In particular, the CO2 plume is no longer symmetrically distributed in horizontal injection cases. A higher injection pressure difference at the heel of the horizontal well may cause an increase in CO2 saturation and migration range. For a horizontal well of 2 000 m, the migration range is almost 2 850 m at the end of the simulation, which represents a 33% increase compared with a vertical well.
 Figure 16 Distributions of CO2 in saline aquifers under various horizontal well lengths (t = 120 a)
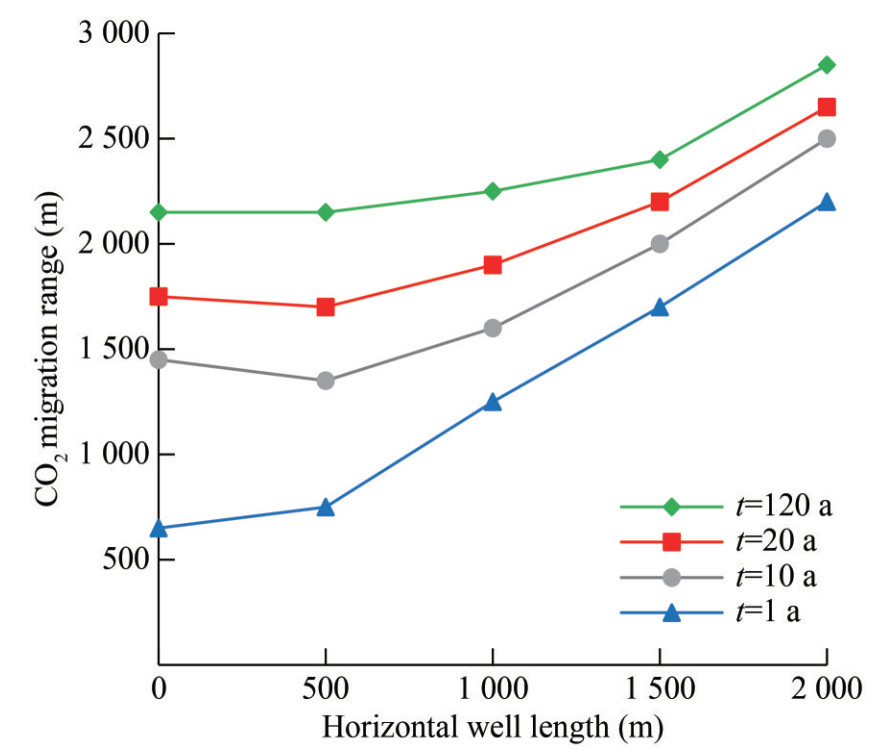 Figure 17 Variation of CO2 migration range with horizontal well length
Based on various geological simulation cases in Section 4.2, CO2 migration range and permeability, dip angle, thickness, and salinity always present a certain degree of positive correlation. To clarify the substantial parameter, the relative increases in the migration range under the variation of each parameter are summarized in Table 3. Within the statistical range of the above parameters, permeability has the most substantial effect, whereas the influences of other parameters are within 10%. Then, the CO2 migration range can be estimated considering the comprehensive effect of various geological parameters. In extreme cases, the migration range of CO2 may be 45% larger or 51% smaller than that in the base case. Therefore, a safety distance of 1 053–3 117 m from risk points during site selection in the study area is recommended. For safety reasons, a distance of over 3 000 m is more preferable.
Table 3 Variation of migration ranges under diverse geological parametersGeological parameter Value Relative change of migration range (%) Note Permeability (mD) 1 −46.5 10 −27.9 50 −4.7 100 0 Base case 200 9.3 500 14.0 800 18.6 1 000 18.6 1 500 23.3 Dip angle (°) 0 0 Base case 1 0 3 2.4 5 2.7 8 7.9 10 13.1 Thickness (m) 20 −4.7 50 −4.7 100 0 Base case 120 4.7 150 4.7 200 4.7 Salinity (mg/L) 0 0 Base case 5 000 0 10 000 0 20 000 0 30 000 4.7 40 000 4.7 50 000 4.7 Diverse injection scenarios have also been analyzed in Section 4.3. Long horizontal wells may also lead to greater risks, although they can increase the injectivity of CO2. In this way, the location of the injection well should be further optimized within the selected site after determining the horizontal length based on the injection amount requirement. For example, a 33% greater distance should be kept for a 2 000 m horizontal well.
5 Conclusions
Simulations of CO2 storage in saline aquifers reveal that CO2 mainly migrates during the injection period rather than the post-injection period, and the migration range of the injection period accounts for more than 70% of the total. Based on the geological characteristics of the saline aquifers in an offshore sedimentary basin, the overall range of CO2 migration in saline aquifers is approximately within 3 000 m, considering various geological and injection conditions.
The effect on the migration range follows the order permeability > formation dip angle > reservoir thickness, whereas brine salinity has a slight effect. As reservoir permeability, dip angle, and thickness increase, the migration range generally exhibits an increasing trend and stabilizes when the above factors increase to a specific value.
Injection rate and well type substantially affect the migration of CO2. When CO2 is injected at a low rate, the migration range increases with the injection rate increasing. At high rates, the additional increase in migration range is restricted. However, the distribution of CO2 varies from that at low rates, making it more likely to displace the brine in a piston-like mode. As for horizontal well injection, the CO2 plume is no longer symmetrically distributed due to the pressure difference between the toe and the heel. The longer the horizontal well length, the farther the CO2 migration.
Competing interest The authors have no competing interests to declare that are relevant to the content of this article. -
Figure 1 Relative permeability curves of CO2 and brine phase
Figure 2 Mechanism model of CO2 storage in a saline aquifer
Figure 3 CO2 distributions in the base simulation case
Figure 4 Plane migration of CO2 in the base simulation case
Figure 5 Variation of CO2 migration range with simulation time
Figure 6 Distributions of CO2 in saline aquifers with various permeabilities (t = 120 a)
Figure 7 Variation of CO2 migration range with reservoir permeability
Figure 8 Distributions of CO2 in saline aquifers with various dip angles (t = 120 a)
Figure 9 Variation of CO2 migration range with dip angle
Figure 10 Distributions of CO2 in saline aquifers with various reservoir thicknesses (t = 120 a)
Figure 11 Variation of CO2 migration range with reservoir thickness
Figure 12 Distributions of CO2 in saline aquifers with various brine salinities (t = 120 a)
Figure 13 Variation of CO2 migration range with brine salinity
Figure 14 Distributions of CO2 in the saline aquifer at various injection rates (t = 120 a)
Figure 15 Variation of CO2 migration range with injection rate
Figure 16 Distributions of CO2 in saline aquifers under various horizontal well lengths (t = 120 a)
Figure 17 Variation of CO2 migration range with horizontal well length
Table 1 Aquifer parameters of the base model
Parameter Value Model size (m×m×m) 5 000×5 000×100 Grid size (m×m×m) 50×50×5 Top depth (m) −1 000 Porosity (%) 20 Permeability (mD) 100 Dip angle (°) 0 Initial pressure (MPa) 10 Temperature (℃) 60 Brine salinity (mg/L) 20 000 Table 2 Variable parameters in each case study
Parameter Value Permeability (mD) [1, 10, 50, 100, 200, 500, 800, 1 000, 1 500] Dip angle (°) [0, 1, 3, 5, 8, 10] Thickness (m) [20, 50, 100, 120, 150, 200] Salinity (mg/L) [0, 5 000, 10 000, 20 000, 30 000, 40 000, 50 000] CO2 injection rate (Mt/a) [0.1, 0.2, 0.5, 0.8, 1] Horizontal well length (m) [0, 500, 1 000, 1 500, 2 000] Table 3 Variation of migration ranges under diverse geological parameters
Geological parameter Value Relative change of migration range (%) Note Permeability (mD) 1 −46.5 10 −27.9 50 −4.7 100 0 Base case 200 9.3 500 14.0 800 18.6 1 000 18.6 1 500 23.3 Dip angle (°) 0 0 Base case 1 0 3 2.4 5 2.7 8 7.9 10 13.1 Thickness (m) 20 −4.7 50 −4.7 100 0 Base case 120 4.7 150 4.7 200 4.7 Salinity (mg/L) 0 0 Base case 5 000 0 10 000 0 20 000 0 30 000 4.7 40 000 4.7 50 000 4.7 -
Afanasyev A, Vedeneeva E, Mikheev I (2023) Monte Carlo simulation of the maximum migration distance of CO2 in a sloping aquifer. Gas Science and Engineering 117: 205078. DOI: 10.1016/j.jgsce.2023.205078 Ahmadinia M, Shariatipour SM, Andersen O, Nobakht B (2020) Quantitative evaluation of the joint effect of uncertain parameters in CO2 storage in the Sleipner project, using data-driven models. International Journal of Greenhouse Gas Control 103: 103180. DOI: 10.1016/j.ijggc.2020.103180 Bachu S, Adams JJ (2003) Sequestration of CO2 in geological media in response to climate change: capacity of deep saline aquifers to sequester CO2 in solution. Energy Conversion and Management 44(20): 3151-3175. DOI: 10.1016/S0196-8904(03)00101-8 Basseches JA, Bromley-Trujillo R, Boykoff MT, Culhane T, Hall G, Healy N, Hess DH, Krause RM, Prechel H, Roberts JT, Stephens JC (2022) Climate policy conflict in the US states: a critical review and way forward. Climatic Change 170: 32. DOI: 10.1007/s10584-022-03319-w Birkholzer JT, Oldenburg CM, Zhou Q (2015) CO2 migration and pressure evolution in deep saline aquifers. International Journal of Greenhouse Gas Control 40: 203-220. DOI: 10.1016/j.ijggc.2015.03.022 Breton M, Sbragia L (2017) Adaptation to climate change: Commitment and timing issues. Environmental and Resource Economics 68: 975-995. DOI: 10.1007/s10640-016-0056-9 Dahowski RT, Li X, Davidson CL, Wei N, Dooley JJ (2009) Regional opportunities for carbon dioxide capture and storage in China: A comprehensive CO2 storage cost curve and analysis of the potential for large scale carbon dioxide capture and storage in the People's Republic of China. Pacific Northwest National Lab. (PNNL), Richland, USA Dai Z, Zhang Y, Bielicki J, Amooie MA, Zhang M, Yang C, Zou Y, Ampomah W, Xiao T, Jia W, Middleton R, Zhang W, Sun Y, Moortgat J, Soltanian MR, Stauffer P (2018) Heterogeneity-assisted carbon dioxide storage in marine sediments. Applied Energy 225: 876-883. DOI: 10.1016/j.apenergy.2018.05.038 Furre AK, Eiken O, Alnes H, Vevatne JN, Kiær AF (2017) 20 years of monitoring CO2-injection at Sleipner. Energy Procedia 114: 3916-3926. DOI: 10.1016/j.egypro.2017.03.1523 Guo J, Wen D, Zhang S, Xu T, Hu Q, et al. (2014) Suitability evaluation and demonstration project of CO2 geological storage in China. Geology Press, Beijing (in Chinese) IPCC (2005) Special report on carbon dioxide capture and storage. Cambridge University Press, New York IPCC (2023) AR6 Synthesis Report Climate Change 2023. IPCC, Geneva Jing J (2021) Numerical simulation of multiple factors influence on CO2 storage process: A case study of Shiqianfeng Formation in Ordos Basin. PhD thesis, China University of Geosciences, Wuhan Karstens J, Ahmed W, Berndt C, Class S (2017) Focused fluid flow and the sub-seabed storage of CO2: Evaluating the leakage potential of seismic chimney structures for the Sleipner CO2 storage operation. Marine and Petroleum Geology 88: 81-93. DOI: 10.1016/j.marpetgeo.2017.08.003 Killough JE (1976) Reservoir simulation with history-dependent saturation functions. Society of Petroleum Engineers Journal 16(1): 37-48. DOI: 10.2118/5106-PA Li J, Li P, Li Y, Tong F (2023) Technology system of offshore carbon capture, utilization, and storage. Strategic Study of CAE 25(2): 173-186. (in Chinese) Li Q, Zhao N, Liu L, Xu L (2019) Environmental risk assessment methon for geologic carbon dioxide storage: Case study of Australian Gorgon Project. Environmental Engineering 37(2): 22-26+34. (in Chinese) Liu H, Hou Z, Were P, Guo Y, Sun X (2014) Simulation of CO2 plume movement in multilayered saline formations through multilayer injection technology in the Ordos Basin, China. Environmental Earth Sciences 71(10): 4447-4462. DOI: 10.1007/s12665-013-2839-4 Medici G, West LJ, Mountney NP (2019a) Sedimentary flow heterogeneities in the Triassic UK Sherwood Sandstone Group: insights for hydrocarbon exploration. Geological Journal 54(3): 1361-1378. DOI: 10.1002/gj.3233 Medici G, West LJ, Mountney NP, Welch M (2019b) Permeability of rock discontinuities and faults in the Triassic Sherwood sandstone Group (UK): insights for management of fluvio-aeolian aquifers worldwide. Hydrogeology Journal 27(8): 2835-2855. DOI: 10.1007/s10040-019-02035-7 Mi L (2023) Current status of global CO2 ocean sequestration and opportunities and challenges in China offshore areas. China Offshore Oil and Gas 35(1): 123-135. (in Chinese) Ringrose PS, Mathieson AS, Wright IW, Selama F, Hansen O, Bissell R, Saoula N, Midgley J (2013) The In Salah CO2 storage project: lessons learned and knowledge transfer. Energy Procedia 37: 6226-6236. DOI: 10.1016/j.egypro.2013.06.551 Seyyedi M, Rostami B, Pasdar M, Pazhoohan J (2016) Experimental and numerical study of the effects of formation brine salinity and reservoir temperature on convection mechanism during CO2 storage in saline aquifers. Journal of Natural Gas Science and Engineering 36: 950-962 DOI: 10.1016/j.jngse.2016.11.002 Shi JQ, Durucan S, Korre A, Ringrose P, Mathieson A (2019) History matching and pressure analysis with stress-dependent permeability using the In Salah CO2 storage case study. International Journal of Greenhouse Gas Control 91: 102844. DOI: 10.1016/j.ijggc.2019.102844 Sohal MA, Gallo YL, Audigane P, de Dios JC, Rigby SP (2021) Effect of geological heterogeneities on reservoir storage capacity and migration of CO2 plume in a deep saline fractured carbonate aquifer. International Journal of Greenhouse Gas Control 18: 103306. DOI: 10.1016/j.ijggc.2021.103306 Spycher N, Pruess K (2005) CO2-H2O mixtures in the geological sequestration of CO2. Ⅱ. Partitioning in chloride brines at 12-100 ℃ and up to 600 bar. Geochimica et Cosmochimica Acta 69(13): 3309-3320. DOI: 10.1016/j.gca.2005.01.015 Spycher N, Pruess K (2009) A phase-partitioning model for CO2-brine mixtures at elevated temperatures and pressures: Application to CO2-enhanced geothermal systems. Transport Porous Media 82(1): 173-196. DOI: 10.1007/s11242-009-9425-y Strandli CW, Mehnert E, Benson SM (2014) CO2 plume tracking and history matching using multilevel pressure monitoring at the Illinois Basin–Decatur project. Energy Procedia 63: 4473-4484. DOI: 10.1016/j.egypro.2014.11.483 Wang H, Oyenowo OP, Okuno R (2023) Aqueous formate solution for enhanced water imbibition in oil recovery and carbon storage in carbonate reservoirs. Fuel 345: 128198. DOI: 10.1016/j.fuel.2023.128198 Wei N, Li X, Liu S, Lu S, Jiao Z (2021) A strategic framework for commercialization of carbon capture, geological utilization, and storage technology in China. International Journal of Greenhouse Gas Control 110: 103420. DOI: 10.1016/j.ijggc.2021.103420 Wong S, Law D, Deng X, Robinson J, Kadatz B, Gunter WD, Ye J, Feng S, Fan Z (2007) Enhanced coalbed methane and CO2 storage in anthracitic coals-Micro-pilot test at South Qinshui, Shanxi, China. International Journal of Greenhouse Gas Control 1(2): 215-222. DOI: 10.1016/S1750-5836(06)00005-3 Wu X (2013) Carbon dioxide capture and geological storage: the first massive exploration in China. Science Press, Beijing. (in Chinese) Xi J (2020) Carry on the past and face the future, Start a new journey of global response to climate change—Speech at the Climate Ambition Summit. Gazette of the State Council of the People's Republic of China 35: 7. (in Chinese) Xie J, Zhang K, Hu L, Pavelic P, Wang Y, Chen M (2015a) Field-based simulation of a demonstration site for carbon dioxide sequestration in low-permeability saline aquifers in the Ordos Basin, China. Hydrogeology Journal 23(7): 1465-1480. DOI: 10.1007/s10040-015-1267-9 Xie J, Zhang K, Hu L, Wang Y, Chen M (2015b) Understanding the carbon dioxide sequestration in low-permeability saline aquifers in the Ordos Basin with numerical simulations. Greenhouse Gases: Science and Technology 5(5): 558-576. DOI: 10.1002/ghg.1499 Yang W, Peng B, Liu Q, Wang S, Dong Y, Lai Y (2017) Evaluation of CO2 enhanced oil recovery and CO2 storage potential in oil reservoirs of Bohai Bay Basin, China. International Journal of Greenhouse Gas Control 65: 86-98. DOI: 10.1016/j.ijggc.2017.08.012 Yi H, Guo X, Jia J, Tian Y, Yin X, Zhang M, Liu M, Lu Z (2023) Research of CO2 re-injection and storage engineering scenario of EP15-1 oilfield development. China Offshore Oil and Gas 35(1): 163-169. (in Chinese) Zhang C, Zhou D, Li P, Li F, Zhang Y, Sun Z, Zhao Z (2014) CO2 storage potential of the Qiongdongnan Basin, northwestern South China Sea. Greenhouse Gases-Science and Technology 4(6): 691-706. DOI: 10.1002/ghg.1430 Zhou Y, Wang R, He Y, Zhao S, Zhou Y, Zhang Y (2023) Analysis and comparison of typical cases of CO2 geological storage in saline aquifer. Petroleum Geology and Recovery Efficiency 30(2): 162-167. (in Chinese) Ziemkiewicz P, Stauffer PH, Sullivan-Graham J, Chu S, Bourcier WL, Buscheck TA, Carr T, Donovan J, Jiao Z, Lin L, Song L, Wagoner JL (2016) Opportunities for increasing CO2 storage in deep, saline formations by active reservoir management and treatment of extracted formation water: Case study at the GreenGen IGCC facility, Tianjin, PR China. International Journal of Greenhouse Gas Control 54: 538-556. DOI: 10.1016/j.ijggc.2016.07.039
