
Experimental Investigation on Condensate Revaporization During Gas Injection Development in Fractured Gas Condensate Reservoirs
https://doi.org/10.1007/s11804-024-00500-8
-
Abstract
The gas field in the Bohai Bay Basin is a fractured metamorphic buried-hill reservoir with dual-media characteristics. The retrograde vaporization mechanism observed in this type of gas condensate reservoir differs significantly from that observed in sand gas condensate reservoirs. However, studies on improving the recovery of fractured gas condensate reservoirs are limited; thus, the impact of retrograde vaporization on condensate within fractured metamorphic buried-hill reservoirs remains unclear. To address this gap, a series of gas injection experiments are conducted in pressure-volume-temperature (PVT) cells and long-cores to investigate the retrograde vaporization effect of condensate using different gas injection media in fractured gas condensate reservoirs. We analyze the variation in condensate volume, gas-to-oil ratio, and condensate recovery during gas injection and examine the influence of various gas injection media (CO2, N2, and dry gas) under different reservoir properties and varying gas injection times. The results demonstrate that the exchange of components between injected gas and condensate significantly influences condensate retrograde vaporization in the formation. Compared with dry gas injection and N2 injection, CO2 injection exhibits a superior retrograde vaporization effect. At a CO2 injection volume of 1 PV, the percentage shrinkage volume of condensate is 13.82%. Additionally, at the maximum retrograde condensation pressure, CO2 injection can increase the recovery of condensate by 22.4%. However, the condensate recovery is notably lower in fractured gas condensate reservoirs than in homogeneous reservoirs, owing to the creation of dominant gas channeling by fractures, which leads to decreased condensate recovery. Regarding gas injection timing, the effect of gas injection at reservoir pressure on improving condensate recovery is superior to that of gas injection at the maximum retrograde condensation pressure. This research provides valuable guidance for designing gas injection development plans and dynamic tracking adjustments for fractured gas condensate reservoirs.Article Highlights• This article presents the first experimental study on retrograde vaporization at the maximum pressure of retrograde condensation in fractured condensate gas reservoirs.• Gas injection experiments conducted under the maximum pressure of retrograde condensation, both in PVT cells and in the long-core apparatus, demonstrate the effectiveness of revaporization of gas condensate in fractured reservoir conditions.• The revaporization effect of condensate under different gas injection times in fractured gas condensate reservoirs is studied.• The revaporization effect of condensate under different reservoir properties is studied. -
1 Introduction
The Bohai Bay Basin features a gas field with a fractured metamorphic buried-hill gas condensate reservoir. Under high temperature and pressure conditions, the reservoir contains a condensate content exceeding 600 g/m3 (Li and Qin, 2022; Liao et al., 2023). Unlike sandstone gas condensate reservoirs, fractured reservoirs feature more complex fluid phase changes and mechanics, resulting in relatively lower recovery rates (Zhang et al., 2023; Bai et al., 2023). Understanding the intricate fluid flow behavior within deep natural gas reservoirs is challenging owing to the complex geological environment and gas behavior at high pressures (Shen et al., 2022). Consequently, enhancing the recovery of such gas condensate reservoirs is a crucial objective in gas reservoir development. During gas condensate reservoir development, retrograde condensation occurs in the reservoir when the gas reservoir pressure falls below the dew point pressure (Hassan et al., 2019; Wang et al., 2022a). Part of the condensate is carried out with the gas flow, while the remaining portion is retained in the formation and cannot be produced (Wang et al., 2022b). This leads to the blockage of the gas condensate flowing channel, resulting in reduced gas production (Muskat, 1950; Fevang and Whiston, 1996), which represents the primary challenge in the development of condensate gas reservoirs (Li et al., 2015). To mitigate the impact of retrograde condensation pollution on condensate gas reservoir development, gas injection is often employed (Chen et al., 2012; Li et al., 2016; Jiang et al., 2021).
Considering the phase characteristics of gas condensate reservoirs, the revaporization of condensate through gas injection media is a prominent focus in addressing retrograde condensate blockage near the wellbore zone. Common gas injection media include CO2, N2, and dry gas. Standing et al. (1948) noted that condensate can be completely revaporized with sufficient dry gas injection. Since Standing's pioneering work, scholars worldwide (Weinaug and Cordell, 1948; Smith and Yarborough, 1968; Abel et al., 1970; Sigmond and Cameron, 1977) have explored the revaporization phenomenon during gas injection development in gas condensate reservoirs. Smith and Yarborough (1968) conducted four flow experiments, and the results demonstrated that the revaporization of condensate resulted in equilibrium gas, and a brief mixing zone existed between the equilibrium gas and the injected dry gas. The quantity of dry gas needed to fully revaporize condensate through contact varies depending on the heavy hydrocarbon content in the condensate. Abel et al. (1970) conducted four revaporization experiments below the dewpoint pressure (at 3 300, 2 700, 1 750, and 800 psig) using a Beaverhill Lake core pack and synthesized original reservoir samples from the Carson Creek field. The findings indicated that higher pressures resulted in greater condensate recovery. To investigate the microscopic mechanism of revaporization, Sigmond and Cameron (1977) conducted a series of experiments in sand packs and cores to assess the impact of initial condensate saturation on the revaporization of immobile liquid trapped in porous media. Their analysis revealed that the revaporization rate increased with rising condensate saturation.
Nitrogen is a potentially attractive substitute for dry gas (Moses and Wilson, 1981; Donohoe and Buchanan, 1981; Sänger and Hagoort, 1998). A major concern is the increase in the dewpoint pressure of gas condensates as the nitrogen volume increases. Moses and Wilson (1981) conducted a series of experiments using a sand-packed tube to compare the flooding efficiency of actual gas condensate fluids with nitrogen and lean gas injection. The results indicated that the nitrogen flood process exhibited a piston-type behavior with minimal mixing of nitrogen and gas condensate fluid.
CO2-enhanced oil recovery is a practical and viable large-scale carbon reduction technology, pivotal in significantly enhancing the recovery of low-permeability oil fields (Yuan et al., 2022; Song et al., 2023). Chaback and Wuliams. (1994) conducted high-pressure PVT tests and demonstrated that CO2 is more effective in revaporization compared with nitrogen. These findings suggest that condensate formed during depletion development exhibited revaporization upon contact with adequate amounts of CO2, N2, or dry gas, leading to decreased condensate saturation and improved recovery. Goricnik et al. (1995) presented pressure-composition and pressure-retrograde liquid dropout diagrams. The results indicated that CO2 was more proficient in revaporizing condensate liquids within gas condensate systems than dry natural gas.
The revaporization rate directly impacts the effectiveness of gas injection development in gas condensate reservoirs. Previous experimental studies on condensate revaporization predominantly utilized retrograde condensates of C4, C5, C6, C7, and other reservoirs (Luo et al., 2001) in PVT cells or homogeneous sandstone cores. The applicability of this approach to fractured gas condensate reservoirs remains unstudied. This paper addresses this gap by employing actual fluids from a gas field in the Bohai Bay Basin to investigate condensate revaporization under various gas injection media in PVT cells and fractured reservoir cores. Such research holds significant importance for the gas injection development of fractured condensate gas reservoirs.
2 Experimental apparatus, principle, and procedure
2.1 Apparatus
The long-core flooding apparatus primarily consisted of an injection pump system, a long-core holder system, a back pressure regulator, observation windows, a differential pressure meter, a temperature control system, a liquid fraction collector, and a gas meter. The long-core holder system served as the key component of the apparatus, comprising a long-core outer cell, a rubber sleeve, and axial connectors. The apparatus operated at a maximum working pressure of 70 MPa and a maximum working temperature of 200 ℃.
2.2 Principles
The retrograde vaporization experiment aimed to revaporize condensate that had precipitated during the depletion production of a gas condensate reservoir via gas injection. During the gas injection process, the extent of condensate oil revaporization was determined through the collection and analysis of the gas and condensate produced at various gas injection volumes.
2.3 Experimental procedure
2.3.1 Fluid
Samples of oil and gas were collected from the separator in a gas field in the Bohai Bay Basin, and representative formation condensate gas samples were prepared according to the on-site gas-to-oil ratio (GOR). The composition of the recombined fluid is presented in Table 1.
Table 1 Composition of gas condensateComp Mole (%) CO2 8.55 N2 0.79 C1 69.82 C2 8.64 C3 2.75 nC4 0.51 iC4 0.85 nC5 0.36 iC5 0.43 C6 0.37 C7 0.57 C8 0.94 C9 0.98 C10 0.71 C11+ 3.73 ∑ 100.00 The reservoir temperature was approximately 172 ℃, and the reservoir pressure was 48.7 MPa. PVT analysis indicated that the dewpoint pressure of the gas condensate reservoir was 44.3 MPa, with the maximum pressure for retrograde condensation at 24.0 MPa and the maximum liquid dropout volume at 33.5%. Figure 1 illustrates the retrograde curves during the constant composition expansion (CCE) and constant volume depletion (CVD) processes.
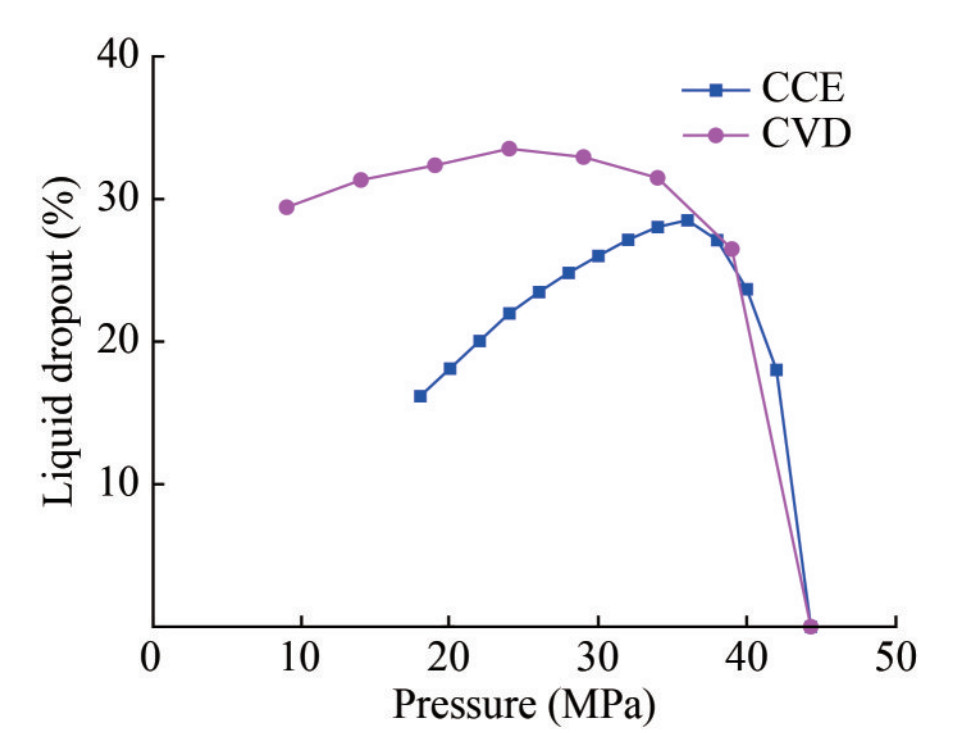 Figure 1 Retrograde Curves in CCE and CVD Processes
The injected CO2 and N2 have a purity of 99.9%, and the composition of the injected dry gas is provided in Table 2.
Table 2 Composition of injected dry gasComp Mole (%) CO2 0.28 N2 0.96 C1 86.97 C2 7.02 C3 3.06 nC4 0.63 iC4 0.66 nC5 0.24 iC5 0.12 C6 0.06 ∑ 100.00 2.3.2 Core
The core analysis of the gas condensate field revealed a permeability range of 0.1–1 mD, averaging approximately 0.4 mD, which was chosen as the absolute permeability of the matrix. According to well-test interpretation, an effective permeability of 4 mD was selected for the fracture. Following fracturing, the cores (Figure 2) were combined to create a long-core sample. This composite core spanned a total length of 99.70 cm, featuring an average porosity of 14.09% and an average effective permeability of 5.39 mD. In the experimental setup, 20 small plunger cores were employed. To mitigate the end effects of the rocks, filter paper was utilized to connect each core. The arrangement of the long core from inlet to outlet was determined through the harmonic average method of permeability. This ensured that cores were positioned according to their respective permeabilities, thus facilitating a more accurate characterization of reservoir characteristics.
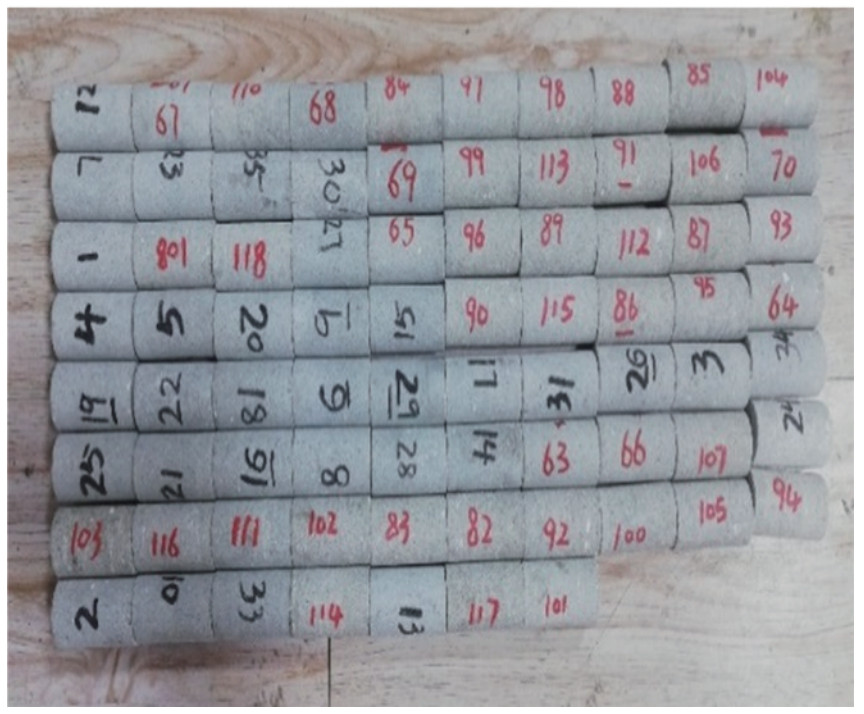 Figure 2 Core Sample
The essential data for this experiment, including permeability values, porosities, and other pertinent parameters, are presented in Table 3.
Table 3 Long-core property dataCore No. Porosity (%) Permeability (mD) 1 12.38 9.98 2 10.47 3.49 3 11.60 6.46 4 13.75 3.59 5 13.84 6.33 6 15.16 6.29 7 14.11 3.80 8 13.99 6.22 9 15.12 6.06 10 14.33 4.17 11 16.74 5.96 12 16.18 4.29 13 13.11 4.33 14 13.62 5.64 15 13.91 4.40 16 15.74 5.61 17 15.69 5.57 18 15.52 5.43 19 13.19 5.37 20 13.39 4.80 2.3.3 Procedures
During the gas injection in the PVT cell, after the fluid was charged into the cell. The sample was initially depleted to 24 MPa to produce liquid condensate. Subsequently, gas (CO2/N2/dry gas) was injected into the PVT cell at the same pressure. Throughout the experiment, the gas volume, condensate volume, and injected gas volume were recorded every 0.5 HCPV. The experiment concluded when the condensate recovery no longer increased.
At the formation temperature of 172 ℃, the long core was initially pressurized to the formation pressure of 48.7 MPa using dry gas. Subsequently, the prepared condensate gas sample was employed to displace the core at a low speed to replace the dry gas (maintained at 48.7 MPa). The GOR of the fluid produced at the outlet end of the core was then measured. A close match between the GOR of the fluid at the outlet end and that of the displaced condensate gas indicates that the long core has been saturated by the condensate gas sample, signifying the completion of the condensate gas saturation process. In gas injection below the dew point in the long-core system, gas injection was initiated after the rich gas condensate fluid was depleted to a certain pressure level below the dew point to generate in situ liquid condensate. In this experiment, the pressure was gradually reduced at a specific rate from the formation pressure until production was depleted to the maximum condensate saturation pressure (24 MPa). First, the sample was depleted from 48.7 MPa to 24 MPa, following which gas (CO2/N2/dry gas) was injected at this pressure. Throughout the experiment, gas production, oil production, pressure (inlet and outlet), and injected fluid volume at the outlet were recorded every 0.1 HCPV. The experiment was concluded when the condensate oil recovery no longer increased.
3 Results of gas injection experiment
3.1 Gas injection in PVT cell after depletion
The gas injection experiment in the PVT cell was conducted before the long-core gas injection experiment. Figure 3 illustrates the schematic diagram of the PVT analysis device. The results obtained under phase equilibrium conditions in the PVT cell remain unaffected by porous media and displacement effects. Any observed phenomena can be interpreted within the framework of thermodynamics.
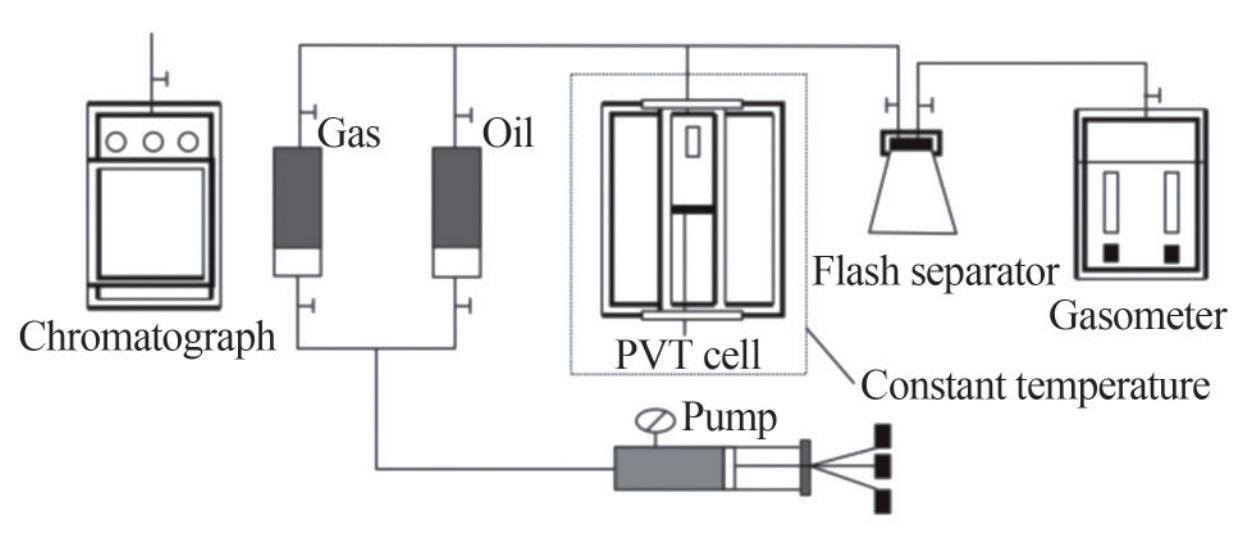 Figure 3 Schematic of PVT experimental system
At a formation temperature of 172 ℃, the original formation pressure is reduced to 24 MPa in the PVT cell. Subsequently, at this pressure, retrograde vaporization experiments with CO2, N2, and dry gas are conducted individually to examine the differences in retrograde vaporization degree of condensate under different gas injection media. A significant reduction in liquid volume (Note: the percentage shrinkage volume of condensate =(V0-Vpv)Vpv×100, where V0 is the volume of condensate deposited in the process of depletion to 24 MPa, Vpv is the volume of condensate measured at the given injected gas volume, or pore volume [PV]) occurs as the injection of CO2, N2, and dry gas continues, as illustrated in Figure 4. As the CO2 injection volume increases, the liquid volume decreases markedly, indicating a pronounced revaporization effect. At 1 PV of CO2 injection, the condensate experiences a 13.82% shrinkage volume. The retrograde vaporization effect is notably poor for N2 condensate, with a mere 0.33% shrinkage volume observed at 1 PV of N2 injection. Conversely, condensate exhibits a robust retrograde vaporization effect during dry gas injection. At 1 PV of dry gas injection, the shrinkage volume of condensate is 2.91%, increasing slightly to 3.68% at 2 PV injected. These experimental findings highlight that CO2 demonstrates a stronger retrograde vaporization effect on condensate compared with dry gas and N2.
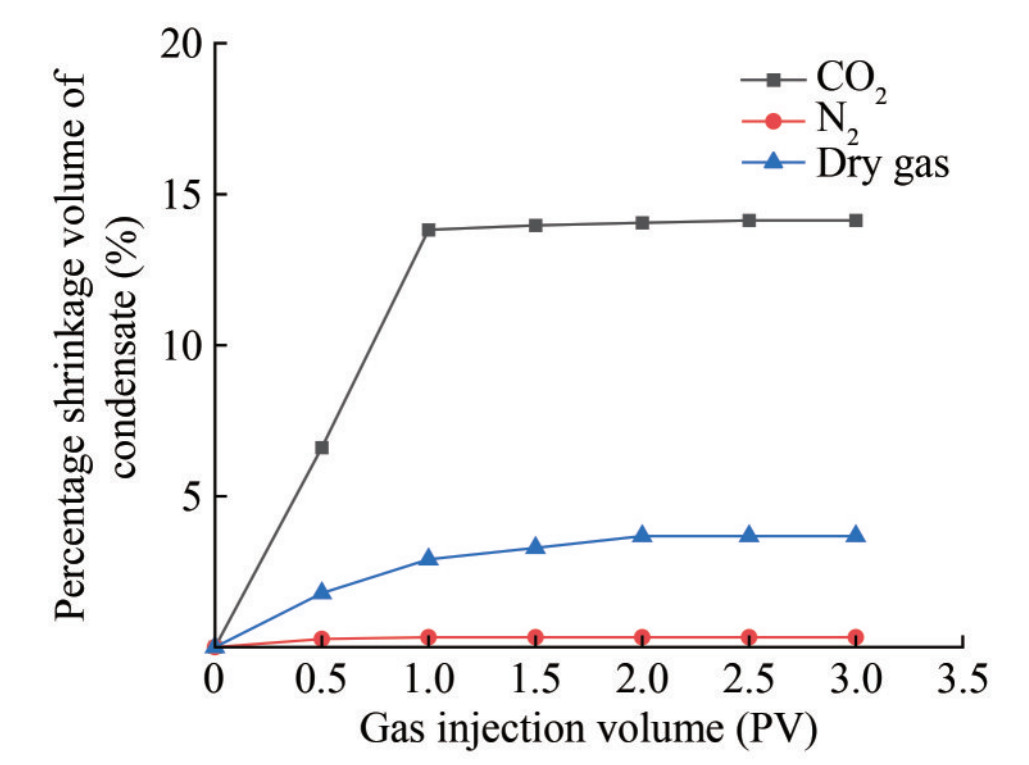 Figure 4 Effect of gas injection on the shrinkage ofliquid volume at 24 MPa in the PVT cell
3.2 Gas injection in long-core apparatus after depletion
3.2.1 Different gas injection media
Figure 5 illustrates the relationship curve between the GOR and gas injection volume during gas (CO2/N2/dry gas) injection at 24 MPa post-depletion. When the CO2 injection volume is below 0.8 HCPV, the GOR remains relatively constant, indicating a piston displacement process. Between injection volumes of 0.8 HCPV and 1.2 HCPV, although the GOR increases, the change is not significant. This phase involves displacement and revaporization effects due to component exchange between the injected CO2 and the condensate oil and gas. During this process, there is a phenomenon of increased dew point pressure, leading to the retrograde condensation of some condensate gas, followed by revaporization by the subsequent CO2 injection. Hence, the phenomenon of GOR increasing with injection volume at this stage is not pronounced. As gas injection volume continues to rise, although retrograde condensation of condensate persists, the volume of revaporized condensate is smaller than that of the injected CO2. Consequently, the GOR of the output gas increases rapidly. The GOR reaches as high as 11 × 104 m3/m3 when the gas injection volume is 1.6 HCPV. Conversely, when the gas injection volume is below 0.4 HCPV, the GOR remains relatively stable with increasing gas injection volume, indicating a piston displacement process. Between injection volumes of 0.4 HCPV and 0.9 HCPV, although the GOR increases, the change is not very significant, reflecting a phase involving displacement and revaporization effects. As the gas injection volume continues to increase, the output GOR exhibits a sharp upward trend. At a gas injection volume of 1.4 HCPV, the GOR reaches as high as 20×104 m3/m3. When the dry gas injection volume is below 0.6 HCPV, the GOR remains relatively constant with increasing gas injection volume, indicating a piston displacement process at this stage. Between injection volumes of 0.6 HCPV and 1.1 HCPV, although the GOR increases, the change is not very significant, suggesting a phase involving displacement and revaporization effects. Furthermore, as the gas injection volume continues to increase, the output GOR maintains a rapid upward trend. At a gas injection volume of 1.7 HCPV, the GOR reaches as high as 18×104 m3/m3.
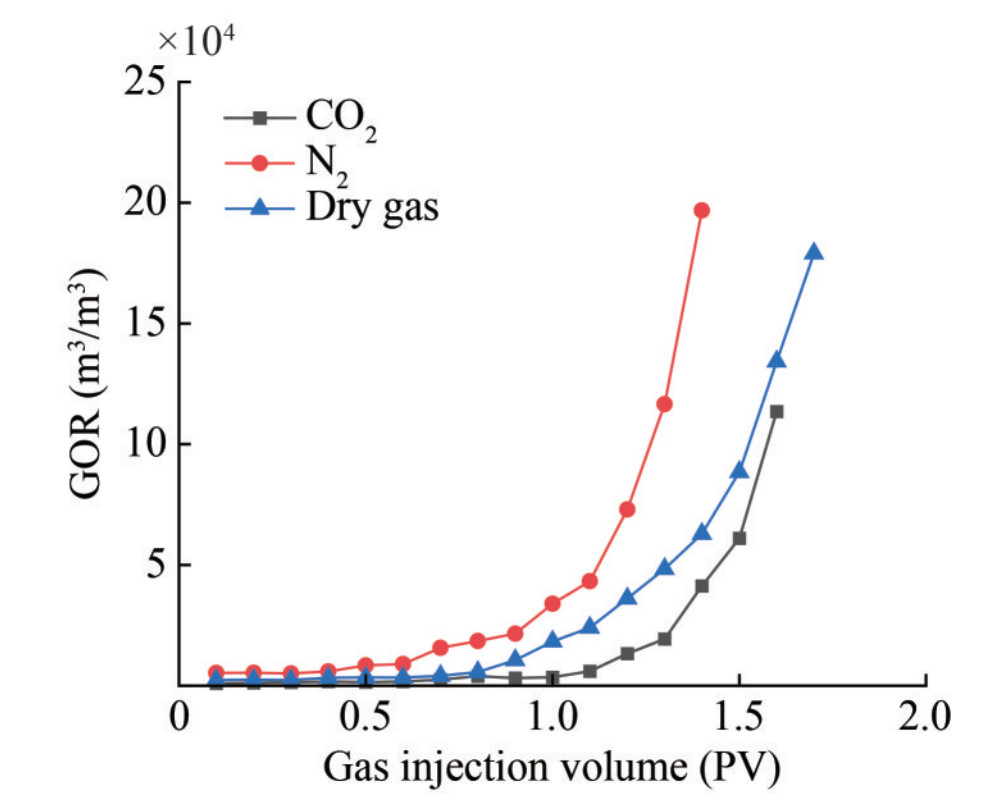 Figure 5 Variation curve of gas-to-oil ratio with gas injection volume during gas injection
Figure 6 illustrates the relationship curve between condensate recovery and gas injection volume during gas (CO2/N2/dry gas) injection. Prior to gas injection, the recovery obtained from the initial depletion to 24 MPa is 16.1%. For CO2 injection volumes below 0.8 HCPV, the condensate recovery exhibits an almost linear upward trend. As CO2 injection volume exceeds 0.8 HCPV but remains below 1.2 HCPV, the condensate recovery curve gradually slows down but still exhibits an upward trend. However, when the CO2 injection volume surpasses 1.2 HCPV, the condensate recovery almost no longer increases with the increase in the CO2 injection volume. At a CO2 injection volume of 1.6 HCPV, the condensate recovery reaches 38.5%. At N2 injection volumes below 0.4 HCPV, the condensate recovery follows an almost linear trend. With the increase in the N2 injection volume from > 0.4 HCPV to < 0.9 HCPV, the condensate recovery curve gradually decelerates, but it still displays an upward trend. However, with N2 injection volume exceeding 0.9 HCPV, the condensate recovery shows a negligible increase. At a gas injection volume of 1.4 HCPV, the condensate recovery is 21.2%. For dry gas injection volumes below 0.6 HCPV, the condensate recovery exhibits an almost linear trend. Between dry gas injection volumes of greater than 0.6 HCPV and less than 1.1 HCPV, the condensate recovery curve becomes gentler but maintains an upward trend. However, at dry gas injection volumes exceeding 1.1 HCPV, the condensate recovery demonstrates minimal increase. At a dry gas injection volume of 1.7 HCPV, the condensate recovery reaches 29.1%.
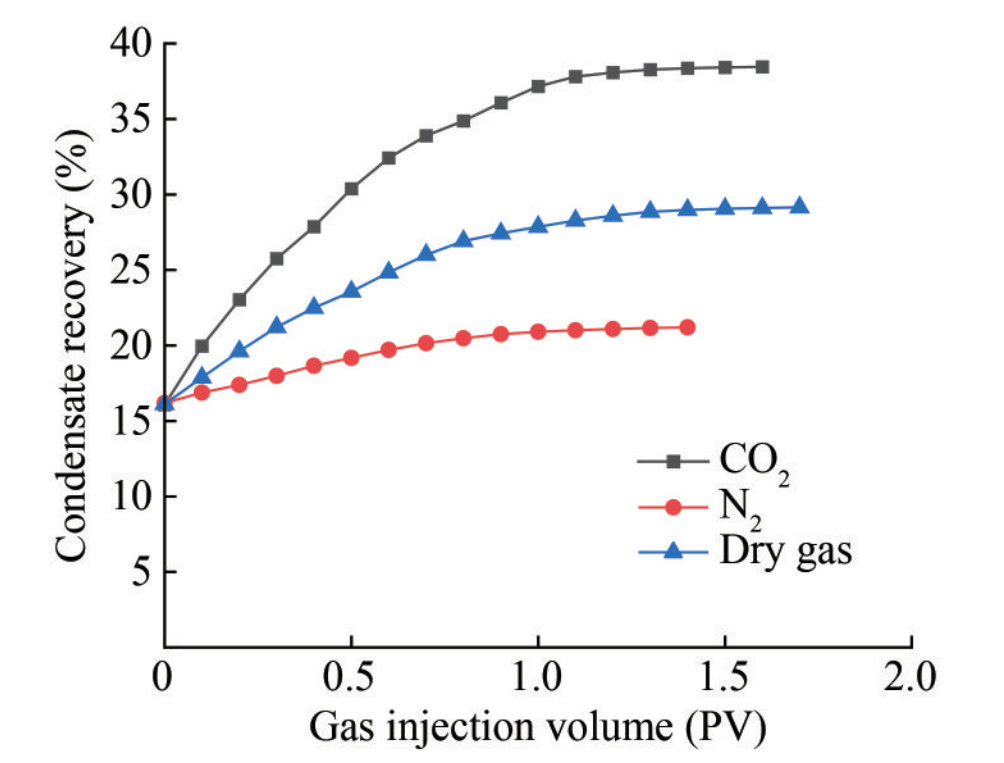 Figure 6 Curve illustrating condensate recovery with gas injection volume during gas injection
The GOR and condensate recovery results for three groups of gas injection experiments under different gas injection media are compared in Figure 5 and Figure 6. The injection of CO2, N2, and dry gas enhances condensate recovery. Specifically, CO2 injection improves condensate recovery by 22.4%, surpassing the 13.0% improvement observed with dry gas injection and the 5.0% improvement with N2 injection.
3.2.2 Different reservoir properties
The dynamic curve illustrating gas injection development (performed under the maximum retrograde condensation pressure of 24 MPa) for three types of reservoirs is presented in Figure 7. As observed in Figure 7, gas injection significantly enhances condensate recovery. In homogeneous cores, during the gas injection stage, the recovery of core 1 (0.4 mD) increases from 18.1% to 37.0%, and that of core 2 (1 mD) increases from 18.8% to 37.9%, representing a similar increase of ~19%. Under the same injection pressure and volume, the gas injection effect in homogeneous reservoirs shows little correlation with permeability. Conversely, for fractured buried-hill reservoirs, the recovery during the gas injection stage increases from 17.6% to 33.9%, less than the increase observed in non-fractured reservoirs. The presence of fractures tends to create dominant gas channels, weakening matrix supply capacity and leading to more condensate retention in matrix pores. Consequently, displacing this condensate with dry gas becomes challenging, resulting in reduced condensate recovery. In Figure 8, the GOR curve displays a distinct inflection point: At a gas injection volume of 0.8 HCPV, the GOR undergoes a rapid increase, indicating gas channeling along the fracture. Moreover, the GOR curve of non-fractured reservoirs also exhibits a rapid increase after the injection of a gas volume of 1.0 HCPV, highlighting the microscopic heterogeneity of the matrix in buried-hill reservoirs.
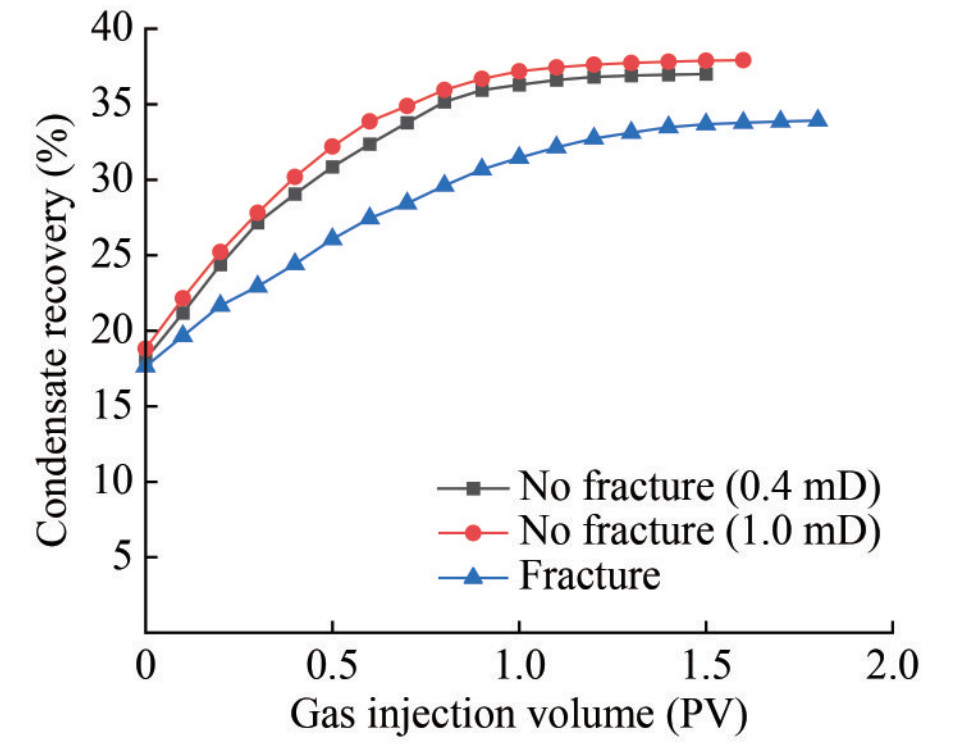 Figure 7 Condensate recovery vs. gas injection volume under various reservoir properties
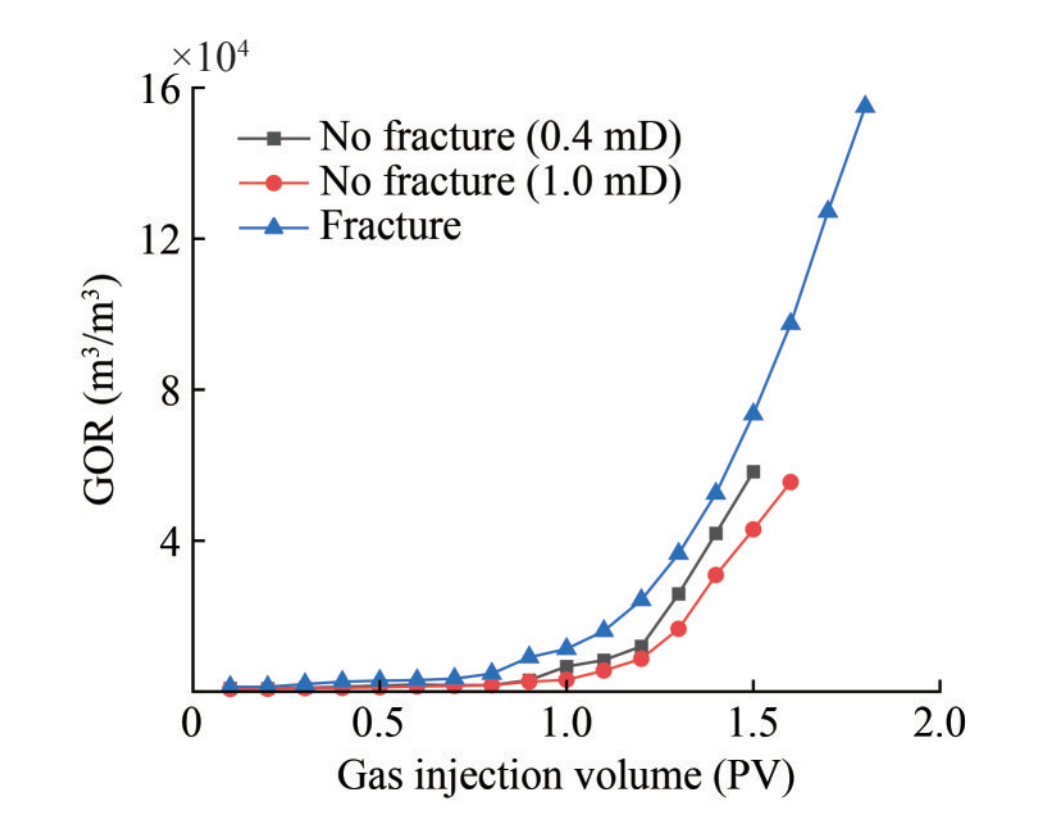 Figure 8 GOR vs. gas injection volume under different reservoir properties
3.2.3 Different gas injection times
For fractured metamorphic buried-hill reservoirs, as illustrated in Figure 9, gas injection at reservoir pressure (48.7 MPa) yields a condensate recovery of 46.8%, surpassing the 35.9% recovery achieved by gas injection at the maximum retrograde condensation pressure (24.0 MPa). This finding suggests that reservoir pressure gas injection is more effective in enhancing condensate recovery. Analysis indicates that when gas is injected above the dew point pressure, the retrograde condensation phenomenon has not yet occurred, allowing all condensate components to dissolve in the gas phase, thereby facilitating their production in large quantities. Conversely, at the maximum retrograde condensation pressure, the condensate volume peaks, resulting in significant liquid phase blockage. Despite the revaporization effect of gas injection, some condensate remains insoluble in the gas phase; they remain trapped within the reservoir and are thus unrecoverable. This inefficiency leads to a condensate displacement efficiency below 100%, subsequently limiting condensate recovery. Gas injection above the dew point pressure is preferred for maximizing condensate recovery. However, opting for gas injection above the high dew point pressure of 44.3 MPa entails a larger initial investment. Therefore, conducting a comprehensive economic evaluation is imperative to determine the optimal method and the suitable pressure maintenance level.
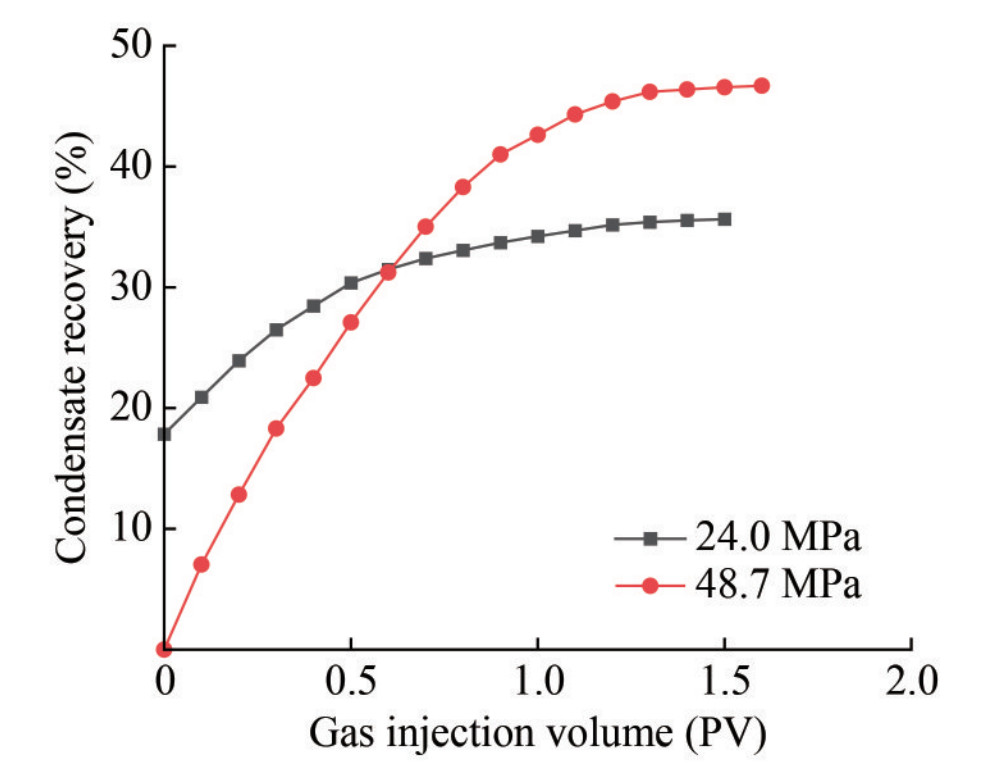 Figure 9 Condensate recovery vs. gas injection volume at different gas injection durations
4 Discussion of results
The mechanism underlying gas cycling to enhance condensate recovery primarily involves pressure maintenance, retrograde evaporation, miscible extraction, and gas flooding. Among the considered gases, CO2 exhibits the highest condensate recovery. This is attributed to the robust extraction effect of CO2 on the condensate, as evidenced by the retrograde evaporation experiment results. Furthermore, compared with dry gas and N2, CO2 possesses greater solubility in condensate, resulting in lower gas– oil interfacial tension and enhanced miscibility (Ayub and Ramadan, 2019). Consequently, CO2 facilitates higher condensate displacement efficiency, leading to superior condensate recovery compared with dry gas and N2.
Under the same injection pressure and volume, the effectiveness of gas injection in homogeneous reservoirs shows minimal correlation with permeability. Conversely, the increase in recovery is less pronounced in fractured buried-hill reservoirs than in homogeneous reservoirs. The presence of fractures facilitates the formation of dominant gas channels (Qu et al., 2020), resulting in weakened matrix supply capacity and increased retention of condensate within matrix pores. This condensate is less susceptible to displacement by dry gas, leading to reduced condensate recovery.
Injecting gas at reservoir pressure can more effectively enhance condensate recovery compared with injecting gas at the maximum retrograde condensation pressure. When gas injection occurs above the dew point pressure, retrograde condensation has not yet occurred, allowing all condensate components to remain dissolved in the gas phase, facilitating their efficient production. However, injecting gas at the maximum retrograde condensation pressure results in the largest volume of condensate at that point. Despite the retrograde evaporation effect of gas injection, some condensate remains trapped in the reservoir, unable to enter the gas phase and therefore remains unrecoverable. Consequently, the condensate displacement efficiency cannot reach 100%, limiting condensate recovery.
5 Conclusions
The impact of retrograde vaporization on condensate within fractured gas condensate reservoirs was investigated through a series of gas injection experiments conducted in PVT cells and long-cores. The variations in condensate volume, gas-to-oil ratio, and condensate recovery during gas injection were analyzed, and the impacts of different gas injection media, reservoir properties, and gas injection times on condensate revaporization were investigated. The main conclusions are as follows:
1) The PVT cell gas injection experiment demonstrates that CO2, N2, and dry gas injection can reduce condensate saturation. Among them, CO2 exhibits the most pronounced revaporization effect on condensate, with a condensate shrinkage volume of 13.82% at a CO2 injection volume of 1 PV. The long-core gas injection experiment indicates that the development effect of CO2 injection in fractured reservoirs surpasses those of dry gas and N2. At the maximum retrograde condensation pressure, CO2 injection can increase condensate recovery by 22.4%.
2) Under identical injection pressure and volume conditions, the gas injection effect in homogeneous reservoirs shows minimal correlation with permeability. Condensate recovery is notably lower in fractured gas condensate reservoirs than in homogeneous reservoirs. The presence of fractures tends to create dominant gas channeling, weakening the matrix supply capacity. Consequently, more condensate becomes trapped within the matrix pores, ultimately leading to a decrease in condensate recovery.
3) In fractured gas condensate reservoirs, injecting gas at reservoir pressure (48.7 MPa) results in a condensate recovery of 46.8%. This is attributed to the pressure being above the dew point pressure, thereby preventing the occurrence of retrograde condensation. Consequently, all condensate components dissolve in the gas phase, enabling their efficient and abundant production. Conversely, when gas injection occurs at the maximum retrograde condensation pressure, the volume of retrograde condensate peaks. Despite the revaporization effect of gas injection, some condensate remains trapped within the reservoir, limiting the recovery to only 35.9%.
Competing interestThe authors have no competing interests to declare that are relevant to the content of this article. -
Figure 1 Retrograde Curves in CCE and CVD Processes
Figure 2 Core Sample
Figure 3 Schematic of PVT experimental system
Figure 4 Effect of gas injection on the shrinkage ofliquid volume at 24 MPa in the PVT cell
Figure 5 Variation curve of gas-to-oil ratio with gas injection volume during gas injection
Figure 6 Curve illustrating condensate recovery with gas injection volume during gas injection
Figure 7 Condensate recovery vs. gas injection volume under various reservoir properties
Figure 8 GOR vs. gas injection volume under different reservoir properties
Figure 9 Condensate recovery vs. gas injection volume at different gas injection durations
Table 1 Composition of gas condensate
Comp Mole (%) CO2 8.55 N2 0.79 C1 69.82 C2 8.64 C3 2.75 nC4 0.51 iC4 0.85 nC5 0.36 iC5 0.43 C6 0.37 C7 0.57 C8 0.94 C9 0.98 C10 0.71 C11+ 3.73 ∑ 100.00 Table 2 Composition of injected dry gas
Comp Mole (%) CO2 0.28 N2 0.96 C1 86.97 C2 7.02 C3 3.06 nC4 0.63 iC4 0.66 nC5 0.24 iC5 0.12 C6 0.06 ∑ 100.00 Table 3 Long-core property data
Core No. Porosity (%) Permeability (mD) 1 12.38 9.98 2 10.47 3.49 3 11.60 6.46 4 13.75 3.59 5 13.84 6.33 6 15.16 6.29 7 14.11 3.80 8 13.99 6.22 9 15.12 6.06 10 14.33 4.17 11 16.74 5.96 12 16.18 4.29 13 13.11 4.33 14 13.62 5.64 15 13.91 4.40 16 15.74 5.61 17 15.69 5.57 18 15.52 5.43 19 13.19 5.37 20 13.39 4.80 -
Abel W, Jackson RF, Wattenbarger RA (1970) Simulation of a partial pressure maintenance gas cycling project with a compositional model, Carson Creek Field, Alberta. J. Pet. Technol. 22(1): 38-46. DOI: 10.2118/2580-PA Ayub M, Ramadan M (2019) Mitigation of near wellbore gas-condensate by CO2 huff-n-puff injection: a simulation study. J. Petrol. Sci. Eng. 175: 998-1027 DOI: 10.1016/j.petrol.2018.12.066 Bai WP, Cheng SQ, Wang Y, Cai DN, Guo XY, Guo Q (2023) A transient production prediction method for tight condensate gas wells with multiphase flow. Petroleum Exploration and Development. (in Chinese) DOI: 10.11698/PED.20230382 Chaback JJ, Williams ML (1994) P-x behavior of a rich-gas condensate in admixture with CO2 and (N2+CO2). SPE Res. Eng. 9(2): 44-50. DOI: 10.2118/24132-PA Chen WL, Liao FM, Lv B, Miao JJ, Chang ZQ (2012) Retrograde vaporization dynamic phase behaviors in gas injection development of Yaha condensate gas reservoir. Nat. Gas Ind. 32(8): 67-70. (in Chinese) DOI: 10.3787/j.issn.1000-0976.2012.08.014 Donohoe CW, Buchanan RD (1981) Economic evaluation of cycling gas-condensate reservoirs with nitrogen. J. Pet. Technol. 33(2): 263-270. DOI: 10.2118/7494-PA Fevang Ø Whiston CH (1996) Modeling gas-condensate well deliverability. SPE Res. Eng. 11(4): 221-230. DOI: 10.2118/30714-PA Goricnik B, Sarapa M, and Csisko M (1995) Phase equilibria in a rich-gas condensate-CO2 and natural gas mixtures. NAFTA 46(9): 371-377 Hassan A, Mahmoud M, Al-Majed A, Elkatatny S, Bataweel M, Alnakhli A (2019) Gas condensate treatment: A critical review of materials, methods, field applications, and new solutions. J. Petrol. Sci. Eng. 177: 602-613. DOI: 10.7623/syxb201005022 Jiang TW, Sun LD, Xie W, Xiao XJ, Wang Y, Xia J (2021) Three-element development mechanism of cyclic gas injection in condensate gas reservoirs and a new technique of enhancing condensate oil recovery. Acta Petrolei Sinica 42(12): 1654-1664. (in Chinese) DOI: 10.7623/syxb202112010 Li JQ, Yang ZL, Zhang CY, Zhang ZL, Chen QW, Wang ZJ (2015) Impacts of retrograde condensation on the development of Upper Paleozoic gas reservoirs in the Sulige Gasfield, Ordos Basin. Nat. Gas Ind. 35(4): 45-51. (in Chinese) DOI: 10.3787/j.issn.1000-0976.2015.04.007 Li XY, Qin RB (2022) Method of fracture characterization and productivity prediction of 19-6 buried-hill fractured reservoirs, bohai bay basin. Earth Science 48(2): 475-487. (in Chinese) DOI: 10.3799/dqkx.2022.299 Li ZY, Wang LG, Zhang A, Huang J, Zhang K, Yao TW, He YF (2016) Effect evaluation criteria for cyclic gas injection in watered-out condensate gas reservoirs: A case study of the Dalaoba condensate gas reservoir, Tarim Basin. Nat. Gas Ind. 36(12): 51-8. (in Chinese) DOI: 10.3787/j.issn.1000-0976.2016.12.007 Liao XW, Xie RC, Zhou W, Wang Y, Liu WC, Liu WL, Cheng Q, Xiong XS, Luo ZW (2023) The effects of paleogeomorphology on the development of fractures in reservoirs of weathering metamorphic zone in an exposed Archean burial hill, Block B, Bohai Bay Basin. Oil & Gas Geology 44(2): 406-417. (in Chinese) DOI: 10.11743/ogg20230212 Luo K, Li S, Zheng XT, Chen G, Dai ZJ, Liu N (2001) Experimental investigation into revaporization of retrograde condensate. SPE Production and Operations Symposium, Oklahoma City, USA. DOI: 10.2118/67283-MS Moses PL, Wilson K (1981) Phase equilibrium considerations in using nitrogen for improved recover from retrograde condensate reservoirs. J. Pet. Technol. 33(2): 256-262. DOI: 10.2118/7493-PA Muskat M (1950) Some theoretical aspects of cycling-part 2: retrograde condensation about well bores. Oil Gas J. 48(39): 53-55 Qu M, Hou JS, Wen YC, Liang T (2020) Nitrogen gas channeling characteristics in fracture-vuggy carbonate reservoirs. J. Petrol. Sci. Eng. 186: 106723. DOI: 10.1016/j.petrol.2019.106723 Sänger PJ, Hagoort J (1998) Recovery of gas-condensate by nitrogen injection compared with methane injection. SPE J. 3(1): 26-33. DOI: 10.2118/30795-PA Shen WJ, Ma TR, Li XZ, Sun BJ, Hu Y, Xu JC (2022) Fully coupled modeling of two-phase fluid flow and geomechanics in ultra-deep natural gas reservoirs. Physics of Fluids 34(4): 043101. DOI: 10.1063/5.0084975 Sigmund P, Cameron AM (1977) Recovery of retrograde condensed liquids by revaporization during dry gas injection. J. Can. Pet. Technol. 16(1): 64-77. DOI: 10.2118/77-01-06 Smith LR, Yarborough L (1968) Equilibrium revaporization of retrograde condensate by dry gas injection. SPE J. 8(3): 87-94. DOI: 10.2118/1813-PA Song XM, Wang F, Ma DS, Gao M, Zhang YH (2023) Progress and prospect of carbon dioxide capture, utilization and storage in CNPC oilfields. Petroleum Exploration and Development 50(1): 206-218. (in Chinese) DOI: 10.11698/PED.20220366 Standing MB, Lindblad EN, Parsons RL (1948) Calculated recoveries by cycling from a retrograde reservoir of variable permeability. Trans. AIME 174: 165-190. DOI: 10.2118/948165-G Wang YJ, Kang YL, Wang DF, You LJ, Chen MJ, Yan XP (2022a) Liquid phase blockage in micro-nano capillary pores of tight condensate reservoirs. Capillarity 5(1): 12-22. DOI: 10.46690/capi.2022.01.02 Wang WC, Wu KL, Chen ZX, Li ZY, Chen SY, He YF, Yuan JL, Liu HQ (2022b) Non-equilibrium pressure drop method for alleviating retrograde condensate effect on gas condensate well deliverability. Acta Petrolei Sinica 43(5): 719-726. (in Chinese) DOI: 10.7623/syxb202205012 Weinaug CP, Cordell JC (1948) Revaporization of butane and pentane from sand. J. Pet. Technol. 2(11): 457-465. DOI: 10.2118/949303-G Yuan SY, Ma DS, Li JS, Zhou TY, Ji ZM, Han HS (2022) Progress and prospects of carbon dioxide capture, EOR-utilization and storage industrialization. Petroleum Exploration and Development 49(4): 828-834. (in Chinese) DOI: 10.11698/PED.20220212 Zhang LJ, Bu WG, Li N, Tan XH, Liu YW (2023) Numerical simulation of multiarea seepage in deep condensate gas reservoirs with natural fractures. Energies 16(1): 10. DOI: 10.3390/en16010010
