
Assessment of Onshore Renewable Energy Power Supply for Ship's Emissions Reduction in Port Said West Port
https://doi.org/10.1007/s11804-024-00423-4
-
Abstract
Air pollution from shipping is becoming a critical issue, particularly in dense hub port cities. One proposed solution to minimize ship-based emissions at ports is the implementation of an Onshore Power Supply (OPS) system. OPS allows ships to shut off their auxiliary engines and instead connect to the port grid. While there have been numerous studies conducted on ports in Europe and the United States, little research has been done on Egyptian ports. Therefore, this paper aims to investigate the feasibility of implementing OPS at Port Said West Port in Egypt, aligning with Egypt Vision 2030os goals for addressing climate change. The research primarily focuses on analyzing data collected from calling ships to generate socio-economic and cost-effectiveness analyses of OPS. To further enhance the environmental benefits of OPS, the paper proposes the use of solar energy as the OPS electricity source. The findings of the study revealed that by relying on the national grid, emissions can be reduced by 28%. Moreover, it is predicted that this reduction could reach 100% if electricity generation is solely based on solar energy. Additionally, the economic analysis demonstrates promising profitability, with a payback period of approximately two years.Article Highlights● Implementing Onshore Power Supply (OPS) at Port Said West Port reduces shipping emissions by 28%.● Emissions reduction can reach near or 100% if solar energy is the primary OPS electricity source.● OPS adoption at the targeted Egyptian port shows promising profit‐ ability.● The barriers facing OPS-wide implementation in Egypt are out‐ lined. -
1 Introduction
Maritime transportation is widely considered the most efficient mode of transport and it is responsible for more than 80% of international trade (IMO, 2020). Ships can carry all types of products, regardless of their size, over long distances and offer safer transportation at competitive freight rates. With the expected continuous growth in global trade, an increase in both the number and size of ships is expected to cover the increase in shipping service demand. As of early 2019, the worldwide number of ships was around 95 402 (Paulauskas et al., 2020). However, maritime shipping has several negative impacts on the marine environment, air quality, climate change, and human health. These negative impacts are due to relying predominantly on fossil fuels to provide the required energy, which produces harmful air pollutants and Greenhouse Gas (GHG) emissions. The contribution of the shipping sector to anthropogenic emissions is 15% and 5%‒8% for NOx and SOx, respectively (Corbett et al., 2007). Furthermore, international shipping contributed to almost 2.89% of total global CO2 emissions in 2018 (IMO, 2020). The International Maritime Organization (IMO) indicated that maritime CO2 emissions from the international shipping industry could increase by 50% relative to the 2018 level until 2050 unless further actions are taken (IMO, 2020).
The negative environmental impact of marine transportation is highly noticeable throughout the surrounding areas around ports and the main commercial navigational waterways, such as the Suez Canal. Ports are concentrated areas of fossil-fueled activities, and an estimated 70% of ships' air emissions occur within 400 km of land (Corbett et al., 2007). In city harbors, shipping air emissions' share in total emissions can be as high as 54% (Merk, 2014). As a consequence, these emissions have several serious health risks for both local and regional populations. Furthermore, berthed ships' auxiliary diesel generators are a primary source of noise pollution. Besides being unpleasant, noise has a significant impact on human health, such as cardiovascular disease and hearing loss (Badino et al., 2012). According to the (ODS register, 2010), ships should be anchored at least 600 meters away from the harbor to comply with the IMO's noise limit. In addition, auxiliary diesel generators cause vibration that exceeds human sensitivity, especially in the frequency range up to 30 Hz.
The IMO has implemented mandatory legislative and operational measures aimed to reduce the negative impact of shipping on the environment. These measures include the Energy Efficiency Design Index (EEDI) for new ships and the Ship Energy Efficiency Management Plan (SEEMP) for all ships. In January 2013, the SEEMP and the EEDI came into force (IMO, 2020). Additionally, ships currently have to estimate their operating Carbon Intensity Indicator (CⅡ) annually and meet a specific Energy Efficiency Existing Ship Index (EEXI) standard (IMO, 2020). Besides, strict limitations on nitrogen and sulfur emissions have been set with the introduction of Emission Control Areas (ECA) as applied in the Yangtze River Delta region, China (Cheng et al., 2022). As a result, a distinguished reduction (16% ‒ 22%, p < 0.01) in vanadium concentrations and an overall reduction of 17% in the SO2 concentrations were observed in the period from 2014 to 2018 after the shift from Heavy Fuel Oil (HFO) to a lower-sulfur marine fuel (Cheng et al., 2022). Furthermore, the Tier Ⅲ NOx standard and the 0.50% global sulfur limit in ship fuel have been set to minimize the negative impact of shipping (Ni et al., 2020). Also, in 2012, IMO adopted a code on noise, aiming to minimize the harmful impacts on humans and marine life (Badino et al., 2012). The IMO strategy is a short-term signal to the shipping sector, but more investment in low-carbon and zero-carbon fuels and energy-efficient technologies is urgently needed.
One of the technologies available to encourage the adoption of IMO's strategy for port emissions reduction is known as the On-shore Power Supply (OPS) system. OPS allows ships to shut down their auxiliary engines and connect to an onshore electrical power grid. While the ship is connected to the port grid, emergency equipment, cooling, refrigeration, heating, lighting, and other hoteling activities are still able to receive continuous electricity (Zis, 2019).
The OPS technology has several benefits for the port authority, shipowner, and crew. For port authorities, OPS leads to significant reductions in emissions from berthed ships and highly improves the local air quality in port area (Gilbert et al., 2015). As a result, the use of OPS helps in eliminating harmful effects on public health, such as asthma and heart failure risks (Zis, 2019). Additionally, the OPS system has a positive impact on the environment by reducing noise pollution and vibration caused by diesel generators that exceed the human sensitivity threshold, particularly for the frequency range of up to 30 Hz (Esteve-Pérez and Gutiérrez-Romero, 2015). Furthermore, the OPS system has operated since 2000 without any major incidents or problems typically associated with ship auxiliary machinery operations while berthing.
Ship owners can benefit greatly from using the OPS system. OPS reduces fuel consumption and its associated costs, particularly in situations where fuel prices are high. In addition, OPS reduces the auxiliary engines' wear, tear, and maintenance costs, which reduces the ship's lifecycle costs (Ballini and Bozzo, 2015). Moreover, the availability of the OPS equipment onboard provides the ship with a green profile. OPS systems are now mandatory for newly built ships during the construction process to minimize their capital cost.
Many ports around the world offer OPS as an alternative to auxiliary engines, with 574 seagoing ships installing OPS equipment onboard in 2019 (Kraemer and Czermanski, 2020). In addition, 43 ports and approximately 150 berths worldwide have already installed or plan to install the OPS system. By the end of 2025, all European ports will be required to adopt the OPS system (Zis, 2019).
It should, however, be noted that real environmental benefits from OPS systems can be further improved by utilizing Renewable Energy Sources (RES) to generate electricity rather than conventional fossil fuels (Kotrikla et al., 2017). Several types of renewable energy have been investigated for OPS applications, including wind energy (Gutierrez-Romero et al., 2019), geothermal energy (Acciaro et al., 2014), tidal and hydropower (Naty et al., 2016), and solar energy (Yarova et al., 2017).
In addition, it's important to consider the costs and benefits associated with implementing OPS. The associated costs refer to the port-side infrastructure, the electricity supplied from the national grid (Zis, 2019), and the environmental damage costs associated with the use of OPS compared with the ship's auxiliary engines. It is important to address the fact that adjusting all ships and ports to use OPS will be almost impossible due to the high initial costs. Therefore, the implementation of OPS must be focused on the national ports located in highly populated cities and also on frequent callers' ships (Zis, 2019). For these previous reasons, this case study will focus on containerships and general cargo ships.
At the national level of Egypt, Port Said West Port is considered one of the most important Egyptian ports and an integrated system for maritime transport. The port occupies a key position in the Egyptian national economy due to its geo-strategic location on the Suez Canal. The goods transmitted across the Suez Canal are responsible for 10%–15% of global trade (MFAT market report, 2021). In the period 2015 – 2020, nearly 90 000 ships crossed the Suez Canal with 27.2 billion USD in revenues (SCZONE, 2021). For Egypt, OPS is considered a key factor in achieving the sustainable port concept and shifting towards green port operations. In 2019, Damietta Port was the first Egyptian port to apply the OPS system to berthed ships. In addition, Alexandria and Eldekhela ports own some designed berths that could be prepared for providing the berthed ships with onshore electricity (Mohamed and Salah-Eldine, 2020). Furthermore, a study was carried out on the adaptability of OPS for high-speed crafts berthed at Safaga port (Seddiek et al., 2014).
In order to enhance the potential of OPS in Egypt, shifting towards RES instead of conventional energy resources is essential. There are various available renewable energy resources in Egypt, which include wind, bioenergy, geothermal, hydropower, and solar energy. Regarding solar energy, Egypt is considered a sunbelt country with an average direct solar irradiation ranging from 5.5 to 9.0 kWh/m2/day and a 9–11 hrs/day of sunshine duration (IRENA, 2021). Therefore, Egypt has a globally suitable location to generate electricity with solar energy. Furthermore, Egypt is ranked second in Africa and thirty-first worldwide in solar energy utilization (IRENA, 2021). In 2020, 1.9% of total electricity in Egypt was generated by solar energy, which makes it the second-highest renewable energy source in the country (IRENA, 2021).
As can be seen, little research work has been done on the application of OPS in Egyptian ports and shifting towards RES to enhance the potential of OPS in Egypt as well. Therefore, the aim of this study is to investigate the application of OPS in Port Said West Port in Egypt, to align with Egypt Vision 2030's goals of addressing climate change and preserving the environment. The study presents a socio-economic and cost-effectiveness analysis of OPS and investigates the environmental benefits expected from solar energy as the electricity source for OPS.
The structure of the paper is as follows: In the following section, a literature review is provided about previous studies concerning the OPS application in different ports around the world while focusing on the status of OPS applications in the Egyptian ports. Section 3 includes a detailed description of the study location and the collected data. Section 4 introduces the methodology to conduct the shipping emissions inventory, national grid emissions estimation, socio-economic and cost-effectiveness analyses, electricity price analysis, and an investigation of solar energy integration with OPS in Port Said West Port. Moreover, Section 5 presents the output results and a discussion of the challenges facing OPS applications in Egypt. Finally, conclusions and references are listed.
2 Literature review
There have been numerous studies to investigate the ships' emissions in city harbors and the OPS system as a potential abatement method. As in Europe, if all ports were to use an OPS system, a potential reduction of carbon emissions of 800 000 tons could be achieved (Winkel et al., 2016). In the United Kingdom (UK), the implementation of the OPS system has an expected reduction of 25%, 46%, and 92% in CO2, SOx, and NOx emissions, respectively (Wang et al., 2021). Additionally, in the Taranto port, Italy, ship-based emissions could be reduced at berth by 94% for NOx, 42% for CO2, and 90% for PM emissions when using OPS (Andria et al., 2014). For the same port, NOx and CO2 emissions could be reduced by almost 1.1 and 25.7 tonnes per year, respectively, while using OPS (Adamo et al., 2014). In the Ege port, Turkey, a potential reduction of 41%, 23%, 97%, and 88% in CO2, SO2, NOx, and PM emissions with a total emissions reduction of 43% could be achieved while using OPS (Yıldırım and Alkan, 2018). Furthermore, a potential reduction of 57.2%, 49.2%, 63.2%, and 39.4% in CO2, NOx, SOx, and PM emissions could be obtained if all ships in the Kaohsiung port were requested to use the OPS system instead of their generators (Chang and Wang, 2012). For the same port, if 60% of the total visiting ships used an OPS system, NOx and CO2 emissions reduction could be between 428 and 25 391 tonnes per year (Tseng and Pilcher, 2015). Moreover, the use of OPS for a typical containership during a 24-hour berth could reduce the NOx and SOx emissions by 450 and 32 kg (Kraemer and Czermanski, 2020). Also, the OPS application for six containership terminals in different regions of the world could achieve a potential reduction in CO2, SOx, and NOx emissions by 48%–70%, 3%–60%, and 40%–60%, respectively (Zis et al., 2014).
It should be noted that real environmental benefits from OPS systems can be improved when the energy source is green. In the port of Cartagena, Spain, a significant environmental benefit could be achieved by deploying RES as the main electricity source for OPS for both port workers and the population of Cartagena, which could be equivalent to eliminating emissions of nearly 178 000 cars from the city streets (Esteve-Pérez and Gutiérrez-Romero, 2015). At the same port, an analysis of the RES available in the Cartagena area, including solar and wind energy, was conducted for berthed ships' energy demand, and the results showed a CO2 emissions reduction of more than 10 000 tonnes per year could be obtained (Esteve-Pérez and Gutiérrez-Romero, 2015). Moreover, at the port of Mytilene, Greece, a considerable reduction in CO2 and PM10 emissions could be achieved if all the electricity required for the OPS project were produced from a hybrid system comprising 5 MW of photovoltaics combined with 4 wind turbines of 1.5 MW each (Kotrikla et al., 2017).
Regarding the investigation of OPS-related costs and benefits in the Piraeus Port, Greece, external costs of 10.8 and 1.4 million euros were estimated for the use of MGO and OPS by ships calling (Tzannatos, 2010). Also, in Copenhagen port, Denmark, the total OPS port-side installation costs of 37 million euros and annual external costs savings of 2.8 million euros, resulting in a payback period of almost 13 years, were reported (Ballini and Bozzo, 2015).
In Egypt, Damietta Port was the first Egyptian port to apply OPS for supplying the berthed ship's needs of electric power (EMICS Egypt, 2018). The construction of an electric substation and the provision of an OPS system raised the ranking of Damietta's port as a green port. The ships berthed at Damietta Port were compelled to get their electrical power from the shore for 50 US cents/kWh. Nowadays, the Egyptian Ministry of Transport has changed the obligatory use of the OPS system to optional. Additionally, the port authorities of Alexandria and Eldekhela ports own some designed berths that could be prepared to provide the berthed ships with onshore electricity (Mohamed and Salah-Eldine, 2020). Nevertheless, the port authorities make this service optional and do not oblige the berthed ships to stop their auxiliary generators and depend on the onshore power stations that existed on the berths (Mohamed and Salah-Eldine, 2020). Furthermore, the adaptability of OPS for high-speed crafts berthed at Safaga port, Egypt, was studied, and the results showed an annual reduction in exhaust gas emissions of CO2, NOx, PM, and SOx by 276, 18.87, 0.825, and 3.84 tonnes, respectively (Seddiek et al., 2014). The results also indicated that the national grid concept as the main source of electricity was the most economical selection, with a 49% annual cost savings (Seddiek et al., 2014). Additionally, an investigation of an OPS integrated with a PV system for a small inland ferry across the Suez Canal indicated that it is feasible economically and environmentally to install an OPS with an emissions reduction of 1 420 tonnes/year and that the investment costs of the PV system and the OPS infrastructure can be recovered within 7.4–12 years (Bassam et al., 2023).
From the above, it can be seen that most of the current literature has investigated ports in Europe and the US, and little work has been done on Egyptian ports and coastal cities. Therefore, the aim of this paper is to fill this gap by investigating the OPS application at Port Said West Port. The research focuses on analyzing data collected from berthed ships calling at Port Said West Port for one year spanning from January 1st, 2019 to December 31st, 2019. The analysis includes the estimation of the expected reduction values of berthed ships' emissions and their contribution to local atmospheric air pollution. The paper also examines the environmental benefits of OPS through an electricity price analysis. Furthermore, the paper will explore the use of renewable solar energy as a primary electricity source for OPS, by assessing the potential for installing a photovoltaic (PV) system on the unused deck areas of buildings and warehouse ceilings located within the port. A detailed cost-effectiveness analysis of different scenarios will be provided to identify the most profitable way to implement OPS. Finally, the paper will discuss the challenges facing the application of OPS in Egypt.
3 Case study and data description
Port Said West Port is one of the most important ports in Egypt in terms of ship traffic density, the amount of cargo handled, and its proximity to the city center and residential urban clusters. It is located on the northern entrance of the Suez Canal at Latitude 31°15' North and Longitude 32°18' East (SCZONE, 2021). The port is considered a trading hub that occupies 3 km2 and has a berth length of 4 km, with a theoretical annual capacity of 13 million tons and a maximum capacity of 90 000 TEU per year (SCZONE, 2021). The port consists of container, multipurpose, and passenger terminals. Figure 1 shows the map view of Port Said West Port.
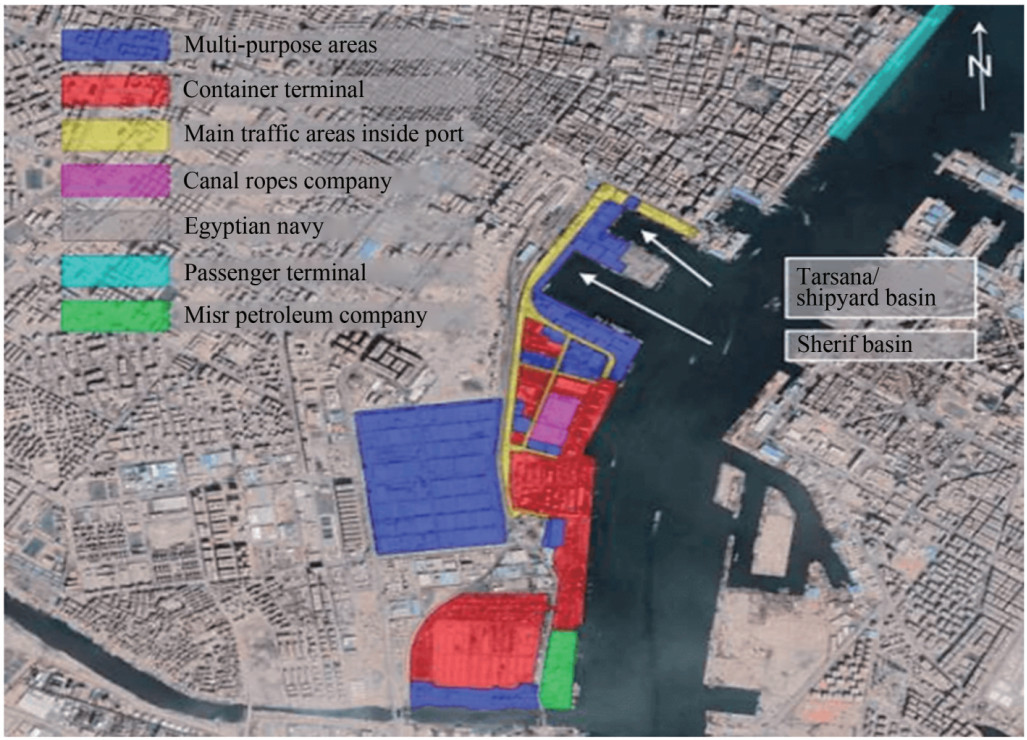 Figure 1 Map view of Port Said West Port (SCZONE, 2021)
As a result of the rapid economic development of the Suez Canal region and the importance of marine transportation, more concerns have been focused on the air quality along this waterway. The seagoing ships berthing at Port Said West Port are taken into consideration while the inland units such as tugs, ferries, and fishing boats were not included in this study due to their lower share of total emissions in the port compared to the seagoing ships and the lack of their operational parameters. Moreover, the research data was collected through the main administration of the Port Said West Port Authority at the Port Said branch. Meanwhile, the collected data contains only the names of the ships, their arrival and departure dates, and the number of containerships and general cargo ships' port calls in 2019. Thus, additional data was needed to initiate the emissions inventory. Significant efforts were made to obtain this data as in 2019, the total number of ships' port calls at the examined port was 786, of which 642 containership port calls and 144 general cargo ship port calls. Due to the lack of some basic ships' information, such as IMO numbers, 28 general cargo ships' port calls were neglected, which makes 758 port calls available for the study. The required data was attained through classification societies databases such as the American Bureau of Shipping (ABS, 2021), Nippon Kaiji Kyokai (ClassNK, 2021), and Det Norske Veritas (DNV, 2021).
4 Methodology
Several studies have investigated emissions from maritime traffic and presented various methodologies to develop emission inventories. It is necessary to create an emission inventory to indicate the impacts of shipping at the port and plan for further mitigation techniques.
4.1 Data processing
In order to estimate the total power demand of berthed ships during their calls at the port, certain assumptions had to be made to obtain a realistic estimation of ship auxiliary engines' emissions. Once the ship arrives at docks to load or unload the cargo, it is called a berthed ship, and the time spent loading and unloading the cargo is called the berth time. The ship berth time depends on the quantity of cargo to be loaded or discharged, the type and characteristics of the ship, the type of equipment, and other resources used at berth. The berth time may be obtained by previously conducted emissions inventories for the port being analyzed, for a similar port, or also from pilot records (Slack et al., 2018). In this study, the berth time of each calling ship to the port during the study period was obtained directly from the Port Said West Port Authority.
Furthermore, the auxiliary engine power requirements for ships of various sizes vary, and this influences how many kilowatts of electricity must be generated on board to sustain basic services while berthed. Installed auxiliary engine power is typically not publicly available. In addition, many peer-reviewed studies from the last two decades have assessed that engine specifications for auxiliary engines are not commonly available. As a result, existing studies address this problem either by setting the auxiliary power demand constant or by deriving a value of auxiliary power as a function of the ship's main power, which is publicly available (Stolz et al., 2021). Therefore, the auxiliary engine to main engine power ratios based on ship category were derived from (CARB, 2007; EPA, 2017) and assumed to be 22% and 19.1% for containerships and general cargo ships, respectively. Also, it is assumed that the main engine is stopped and one auxiliary engine is running while hoteling activity (Peng et al., 2020).
Moreover, the ship's auxiliary engines are not usually operated at full capacity. The percentage of full capacity at which the ship auxiliary engine is operated is defined as the load factor. The exact value of the ship auxiliary engine load factor may be attained through interviews conducted with ship technical staff, captains, chief engineers, pilots, and even accessing some of their onboard technical documents, which is not always possible, especially with limited access to port facilities and limited resources to perform such activities (Peng et al., 2020). In most cases, the value of the load factor for each ship calling into port needed to be assumed. In addition, the California Air Resources Board (CARB) methodology has mainly used vessel surveys to estimate vessel-type-specific auxiliary engine load factors. The values of auxiliary engines' load factors based on ship category were derived from CARB's 2005 Ocean Going Vessel Survey (CARB, 2007; EPA, 2017) and assumed to be 17% and 22% for containerships and general cargo ships, respectively.
Additionally, it is assumed that all ships' auxiliary engines use 0.5% sulfur-content Marine Diesel Oil (MDO) during their call at the port. Using HFO at ports is not a common practice. Besides, international legislation requires the marine engines of ships to be run on low-sulfur fuel at ports. Note that Egypt is not within Sulfur Emission Control Area (SECA) zones; therefore, the permissible share of sulfur in marine fuel in Egyptian ports remains at 0.5%.
4.2 Ship emissions inventory
For ship emissions estimation, two main approaches are normally used in the literature, which are the Top-Down and Bottom-Up approaches. On the one hand, the Top-Down approach is a fuel-based approach in which ship emissions are estimated based on total fuel consumption and fuel emission factors (Peng et al., 2020). However, due to the dispersion and scattered distribution of ships, information on their fuel consumption is hard to acquire (Huang et al., 2017). On the other hand, the Bottom-Up approach is considered to be an activity-based approach in which the emitted emissions are calculated for each specific ship activity and then scaled up over activities and trips to figure out the total volume of emissions (Lee et al., 2021; Kotrikla et al., 2017). Therefore, in this study, the ship activity-based approach is applied to the ships calling at Port Said West Port due to its higher accuracy. Also, the hoteling mode, which refers to operations that occur while ships are berthed alongside piers, is classified as the main case of operation mode (Tzannatos, 2010).
Due to the lack of similar in-port environmental studies in coastal areas and regions in Egypt, there is no specific guide for emissions factors that could be used in emission inventories. Therefore, the current ship emissions investigation is based on the estimation of ship auxiliary engines' emissions using two common methodologies: the Environmental Protection Agency (EPA) (EPA, 2017), and IMO (IMO, 2020) methodologies. Then a comparison between the two methodologies is carried out for a better representation and understanding of the actual ship auxiliary engines' emissions in the port. Note that both methodologies' estimations are based on the Bottom-Up approach. In this study, a programmed spreadsheet is developed for data analysis and emissions estimation.
4.2.1 EPA methodology
The EPA methodology is based on calculating the total auxiliary engine emissions emitted from each ship engine during a specific activity (EPA, 2017). Equation 1 is used to estimate the auxiliary engines' emissions (Ei) for pollutant i, during hoteling, where (Pj) is the total auxiliary engine power demand in port, (LFj) is the hoteling load factor, (Cj) are the ship port calls, and (T j) is the hoteling time. The emissions factors (EFi) of MDO fuel for auxiliary engines are shown in Table 1 (CARB, 2011; EPA, 2017).
$$ E_i=P_j \times L F_j \times C_j \times T_j \times E F_i $$ (1) Table 1 Auxiliary engine emissions factors (g/kWh) (EPA, 2017)Fuel type CO2 SOx NOx PM10 PM2.5 Tier 0 Tier 2 MDO 690 2.1 13.9 9.7 0.38 0.35 4.2.2 IMO methodology
The fourth IMO GHG study drives an estimate of ships' fuel consumption and emissions (IMO, 2020). In order to estimate ship auxiliary engines' emissions, the auxiliary engine's Fuel Consumption (FCi) needs to be calculated first. As shown in Equation 2, (WAE) is the auxiliary engine's power output, and (SFCbase) is the Baseline Specific Fuel Consumption, which is the auxiliary engine's lowest SFC seen in their loading curve. According to (IMO, 2020), the (SFCbase) of an auxiliary engine can be determined with regard to its year of build as shown in Table 2.
$$ \mathrm{FC}_i=\mathrm{SFC}_{\text {base }} \times W_{\mathrm{AE}} $$ (2) Table 2 Auxiliary engines SFCbase (g/kWh) for different years of build (IMO, 2020)Engine type Fuel type Before 1983 1984‒2000 2001+ Auxiliary engines MDO 210 190 185 In the IMO methodology, pollutants such as CO2 and SOx are defined as fuel-based emissions, and their emissions factors (EFf) depend on the amount of pollutants found in the used fuel, as shown in Table 3 (IMO, 2020). For these fuel-based emissions, Equation 3 can be used to calculate the auxiliary engines' emissions as follows:
$$ E_i=\mathrm{FC}_i \times \mathrm{EF}_f $$ (3) Table 3 Auxiliary engines emissions factors for different air pollutants (IMO, 2020)CO2 (g/g fuel) SOx (g/g fuel) NOx (g/kWh) Tier 0 Tier 2 3.206 0.001 4 11.2 9.7 The estimation of air pollutants depending on the auxiliary engine's output power is defined as energy-based emissions (EFe) such as NOx, PM10, and PM2.5, as shown in Table 3. These energy-based emissions can then be calculated as shown in Equation 4. Note that PM10 is an energy-based emission factor that varies as a function of engine load and year of build (IMO, 2020). IMO estimated the PM10's emission factors based on the updated sulfur content reported in 2018, MDO fuel type, and auxiliary engine generation. Therefore, it's a yearly-based emission factor based on the updated sulfur content in the fuel used (IMO, 2020). The energy-based emission factor of PM10 for Generation Ⅰ engines, built before 1984, is about 0.17 g/kWh, while for Generation Ⅱ engines, built between 1984 and 2000, and for Generation Ⅲ engines, built after 2000, it is about 0.18 g/kWh (IMO, 2020). In addition, the emission factor of PM2.5 is assumed to make up 92% of PM10 (IMO, 2020).
$$ E_i=W_{\mathrm{AE}} \times \mathrm{EF}_e $$ (4) 4.3 OPS electricity emissions
In order to evaluate the environmental benefits of shifting from onboard auxiliary engines to OPS, it is necessary to estimate the emissions generated by the electricity grid. These emissions depend primarily on the source of power generation. In the case of Port Said West Port, the electricity source of OPS is the Egyptian national grid. Note that most of the electric power generation plants in Egypt are running on diesel fuel, and only a few of them are using natural gas. The only available electricity-specific CO2 emission factors from electricity generation in Egypt are based on (Zhai et al., 2011), while the other electricity-specific emission factors are based on (Seediek and Elgohary, 2020). Equation 5 gives the emissions from electricity generation by the national grid (Eport) as a function of the consumed power (P), the working time (H), and the grid emissions factor (EF) as presented in Table 4.
$$ E_{\text {port }}=P \times H \times \mathrm{EF} $$ (5) Table 4 National grid electricity-specific emission factors (g/kWh)CO2 SOx NOx PM10 436 2.4 0.72 0.36 4.4 Socio-economic analysis
The damage cost of the air emissions to the surrounding ecosystem, human health, and quality of life can be derived from the available handbook on the external costs of transport. The handbook defines the external costs of European Union countries and seas due to specific air pollutants (Essen et al., 2020). In this study, a socio-economic analysis of OPS is conducted based on the external factors of the Mediterranean Sea, which is considered the nearest related point to the study location. These factors have been widely used in the literature, and this assumption is made to localize the factors as much as possible due to the lack of specific external costs of shipping in Egypt. The damage costs (Eex) as a function of the emissions weight are calculated as shown in Equation 6. The estimated emissions from the above formulas will be used to calculate the damage costs. Table 5 shows marginal external factors for each pollutant after conversion to USD instead of Euros.
$$ E_{\mathrm{ex}}=E_i \times \mathrm{EF}_s $$ (6) Table 5 External cost factors due to specific air pollutants in ($/tonne) (Essen et al., 2020)CO2 SOx NOx PM10 PM2.5 40.1 9 151.1 2 984.1 13 925.6 24 469.2 It is evident that CO2 acts as a GHG independent of where it is released, and it stays so long in the air that it accumulates there. This behavior is different in the case of SOx and NOx, which are deposited by rain in canals and soil, contributing to acidization and eutrophication (Tzannatos, 2010). Furthermore, it is difficult to make a precise assessment of the damage costs of CO2 gas emissions for every country due to the global scale of the damage that occurred (Tzannatos, 2010). Therefore, the average external factor of emitted CO2, was based on (Maibach et al., 2008), which is considered to be a good estimate despite the global variations.
4.5 Assessment of solar energy resource
The OPS technology is a system that aims to improve air quality in port regions and surrounding areas by reducing ship auxiliary engine emissions. To achieve tangible environmental benefits, the system should be powered by electricity generated from RES rather than the conventional local electricity grid (Seddiek, 2019). Solar energy is a promising renewable energy source available around the selected port. Therefore, this paper proposes to conduct a sensitivity analysis of the available area inside Port Said West Port to assess its potential for generating the required OPS electricity using a PV system. The PV system is widely used due to its reliability, flexibility, and long lifetime. Figure 2 presents a map of the average annual solar irradiation in Egypt. The annual direct normal irradiation in Port Said city is 2 051.1 kWh/m2 (SolarGIS, 2018). The average monthly sun hours over the year in Port Said city are collected from (Climate Data, 2019) and presented in Figure 3. Port Said city experiences 11.7 hours of sunshine on average per month in June, making it the sunniest month of the year (Climate Data, 2019). At the same time, December and January have the fewest daily solar hours, with an average sunshine of about 7.7 hours per day, as shown in Figure 3 (Climate Data, 2019).
 Figure 2 Map of average annual solar irradiation in Egypt (SolarGIS, 2018)
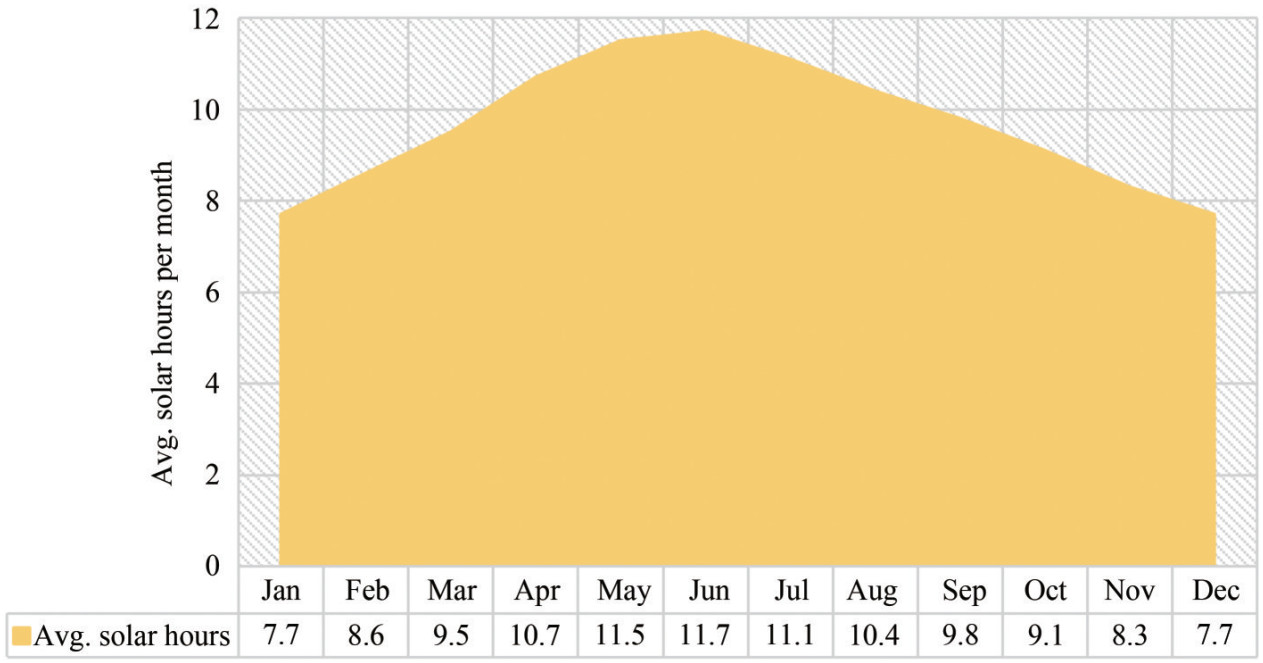 Figure 3 Average solar hours per month in Port Said City
In order to generate the required electricity, it is proposed to benefit from the unused deck areas of buildings and warehouse ceilings located inside the port area, which reduces the visual impact of the solar system. The selected areas are about 0.09 km2 (SCZONE, 2021). Figure 4 indicates where the solar panels may be placed. Then, the total electrical energy output (ES) generated from the solar resource can be estimated, as shown in Equation 7 by the total solar panel's area (A), the solar panel's efficiency (r), the annual average solar irradiation (Hs), and the performance ratio (PR). The PR is defined as a coefficient that includes all losses that depend on the size of the system, the technology used, and the site location, and its value ranges between 0.5 and 0.9 with an average value of 0.75 in this study (Tiwari and Arvind, 2016). The efficiency of the selected monocrystalline solar panels for this study ranges between 15% and 20%, and an average efficiency of 17.5% is assumed for the installed panels (Tiwari and Arvind, 2016).
$$ E_S=A \times r \times H_s \times \mathrm{PR} $$ (7) 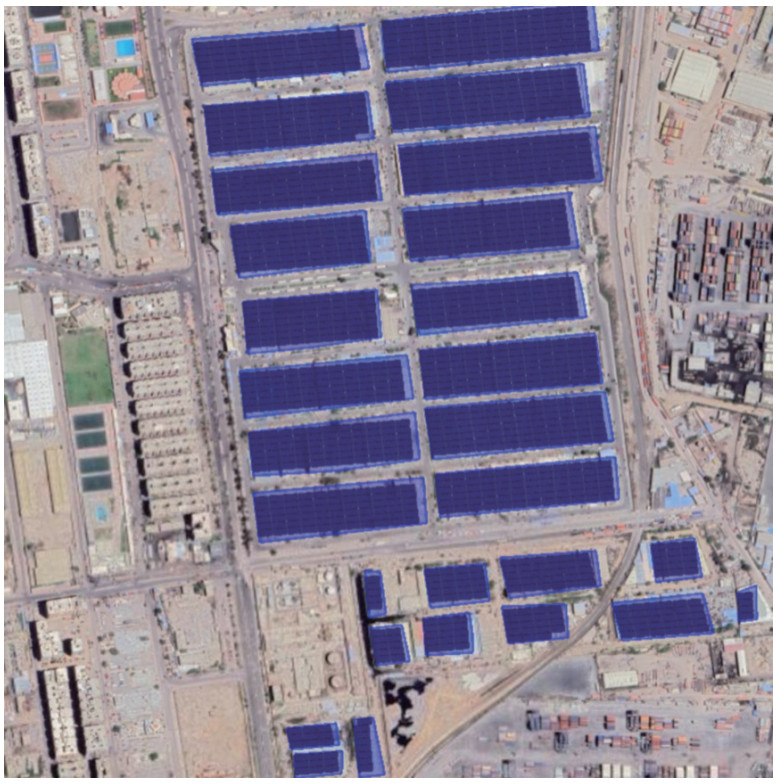 Figure 4 Aerial view of the area available for solar panels in Port Said West Port
In the sensitivity analysis, four different scenarios are being considered with respect to the available area inside Port Said West Port. It is important to note that any of these scenarios may not provide adequate power capacity, which could mean that the PV system is insufficient and the required electric power may need to be compensated by the local national grid. The scenarios analyzed are panels installed on 100%, 75%, 50%, and 25% of the available area inside Port Said West Port.
4.6 Cost-effectiveness analysis
Correspondingly, part of the conducted research and recent publications emphasize the high capital cost and long pay-back period issues of OPS, considering these issues as the main barrier to the massive implementation of OPS. Therefore, a cost-effectiveness analysis is necessary to evaluate the economic viability of OPS. The Net Present Value (NPV) and the Payback (PB) period are chosen in this study as economic evaluation indices. It should be noted that electricity prices tend to fluctuate with the global geopolitical situation, which will affect the overall costs of OPS. Hence, a sensitivity analysis is also provided to identify the most profitable scenario from the four applicable scenarios, considering the PV system application inside Port Said West Port.
Furthermore, a number of recent studies have examined the financial aspects of OPS and offered a range of solutions from many different perspectives and in varied contexts. This case study focuses on the port perspective on OPS adoption, which seeks to motivate the port authority and stakeholders to invest and maximize the benefits of OPS implementation, particularly in reducing emissions from berthed ships at Port Said West Port terminals. It should also be mentioned that this type of cost-effectiveness analysis involves using assumptions and general figures; therefore, the findings ought to be considered as best estimates.
4.7 Port perspective cost analysis
Port authorities' primary concerns during OPS adoption decision-making are the potential savings in capital costs as well as the financial advantages. Their decision to invest in the system can only be justified when the financial benefits outweigh the costs. In order to minimize OPS-related costs, it is vital to limit the OPS facilities to berths with high occupancy rates. Afterward, when there is higher demand and enough budget, the facilities could be expanded to many other berths. Therefore, the OPS-related equipment will be retrofitted for a single berth in Port Said West Port.
Moreover, the total investment costs are classified as capital, operation, and maintenance costs (Kurt et al., 2023). The Capital Expenditure (CAPEX) of OPS was given by (De Jonge et al., 2005) and updated to 2019 levels based on the changes in EU-27 (Gore et al., 2023). Table 6 lists the CAPEX and Operational Expenditure (OPEX) of port-based OPS equipment, in addition to the CAPEX of the PV system required to generate the electricity for OPS as retrieved from (IRENA, 2021).
Table 6 Associated costs of port-based OPS equipmentItem Cost Lifespan(years) High voltage electricity connection ($) 647 976 30 High voltage cable installation ($) 221 676 40 Fixed cable reel system ($) 185 136 30 Electricity converter ($) 532 875 20 PV installation ($/kW) 883 20 PV system O&M ($/kW/year) 17.66 ‒ OPS maintenance ($/year) 5% of CAPEX ‒ OPS replacement ($/year) 5%‒10% less than CAPEX ‒ In the case of the OPEX, it is divided into electricity purchased from the grid costs, replacement costs, and maintenance of the OPS and PV system costs. The evaluation of OPS electricity costs relies on the industrial price of grid electricity in Egypt. The national grid electricity price in 2022 is 0.061 $/kWh, as retrieved from the Egyptian Ministry of Electricity. In addition, the used fuel price is 1 430 $/metric tonne in the same year, based on available international data (Ship and bunker, 2022). The operation and maintenance costs of the PV system are given as 17.66 $/kW (IRENA, 2021). The OPS maintenance cost is assumed to be 5% of the capital cost, and the replacement cost is assumed to be 5%–10% less than the capital cost (Gore et al., 2023), as listed in Table 6. Furthermore, the economic life of the system is 20 years, and the discount rate is assumed to be 4%.
Furthermore, the OPS return on investment comes from selling green electricity to berthed ships and the national grid, in addition to the socio-economic advantage of reducing ships' emissions. The addition of socio-economic advantage relied on the assumption that external damage costs would prompt an accelerated payback period in order to balance CAPEX (Ballini and Bozzo, 2015). Furthermore, the analysis of the port authority perspective towards the use of OPS is assumed to be either:
• Neutral port that sells green electricity at the same price as purchasing it from the national grid with no electricity taxes
• Profitable port that gains a profit on selling green electricity, ensuring that the electricity cost is less than relying on ships' fuel during port stays.
Equation 8 describes the NPV for the investment, where (CAPEXOPS) is the total capital costs of the OPS and PV system ($), (n) is the economic life of the system (years), (BEC) is the total saving in external damage costs of air pollution and the profit gain of the green electricity sold to the berthed ships and national grid ($), (OPEXOPS) is the annual electricity, replacement, and maintenance cost of the installed OPS system as well as the Operation and Maintenance costs (O&M) of the PV system ($), (rD) is the discount rate, and (t) is time periods. Equation 9 describes the payback period of the investment in years, where (CAPEXOPS) is the total capital costs of the OPS and PV systems ($) and (Cii) is the total cash inflows.
$$ \mathrm{NPV}=-\mathrm{CAPEX}_{\mathrm{OPS}}+\sum\limits_{\mathrm{t}=1}^{\mathrm{n}}\left(\left(B_{\mathrm{EC}}-\mathrm{OPEX}_{\mathrm{OPS}}\right) /\left(1+r_D\right) \mathrm{t}\right. $$ (8) $$ \mathrm{PB}=\mathrm{CAPEX}_{\mathrm{OPS}} / C \mathrm{ii} $$ (9) 5 Results and discussion
5.1 Statistical analysis
The current study presents a statistical analysis of the seagoing vessels calling at Port Said West Port in 2019. The data for each ship category is collected, tabulated, and plotted. All data is used to build up a database in spreadsheets. Once the database is built, data are extracted and elaborated to carry out a statistical analysis for a better understanding of data behavior through the Statistical Package for the Social Sciences (SPSS) and MATLAB software. Figure 5 presents the percentage of containerships and general cargo ships calling at Port Said West Port, categorized by their deadweight. As can be seen in Figure 5(b), almost 50% of the general cargo ships calling at the port have a deadweight of less than 5 000 tonnes. In the case of containerships, ships with a deadweight of less than 30 000 tonnes and between 90 000 and 130 000 tonnes are most frequently called at the port, as shown in Figure 5(a). Figure 6 plots the average electricity consumption for these ship categories while hoteling. It is clear that when the ship's deadweight increases, higher electrical power is demanded while hoteling. However, as can be seen in Figure 6(b), general cargo ships with a deadweight of less than 5 000 tonnes consume more electricity than general cargo ships with a deadweight of 5 000 – 10 000 tonnes. This can be justified by the fact that general cargo ships with a deadweight of less than 5 000 tonnes have more hoteling time than general cargo ships with a deadweight of 5 000 – 10 000 tonnes which is considered a key factor in increasing power demand as well. Figure 7 plots relations for containerships and general cargo ships calling at Port Said West Port in reference to their deadweight versus Gross Tonnage (GT), Length Overall (LOA), and Auxiliary Engine Power (PAE).
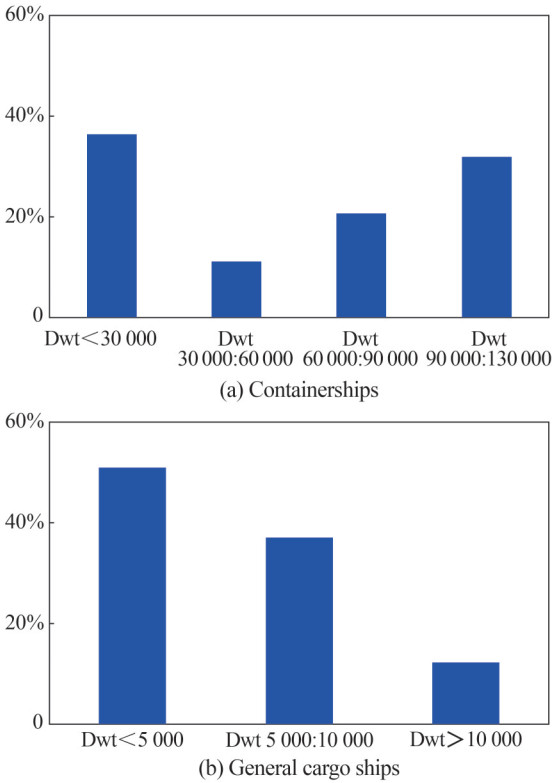 Figure 5 Ships calling at Port Said West Port categorized by deadweight for (a) Containerships and (b) General cargo ships
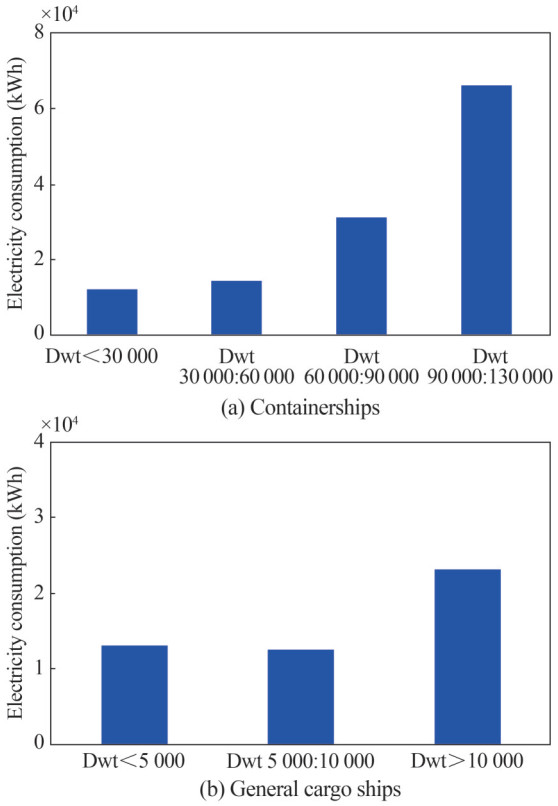 Figure 6 Calling ships' electricity consumption versus deadweight for (a) Containerships and (b) General cargo ships
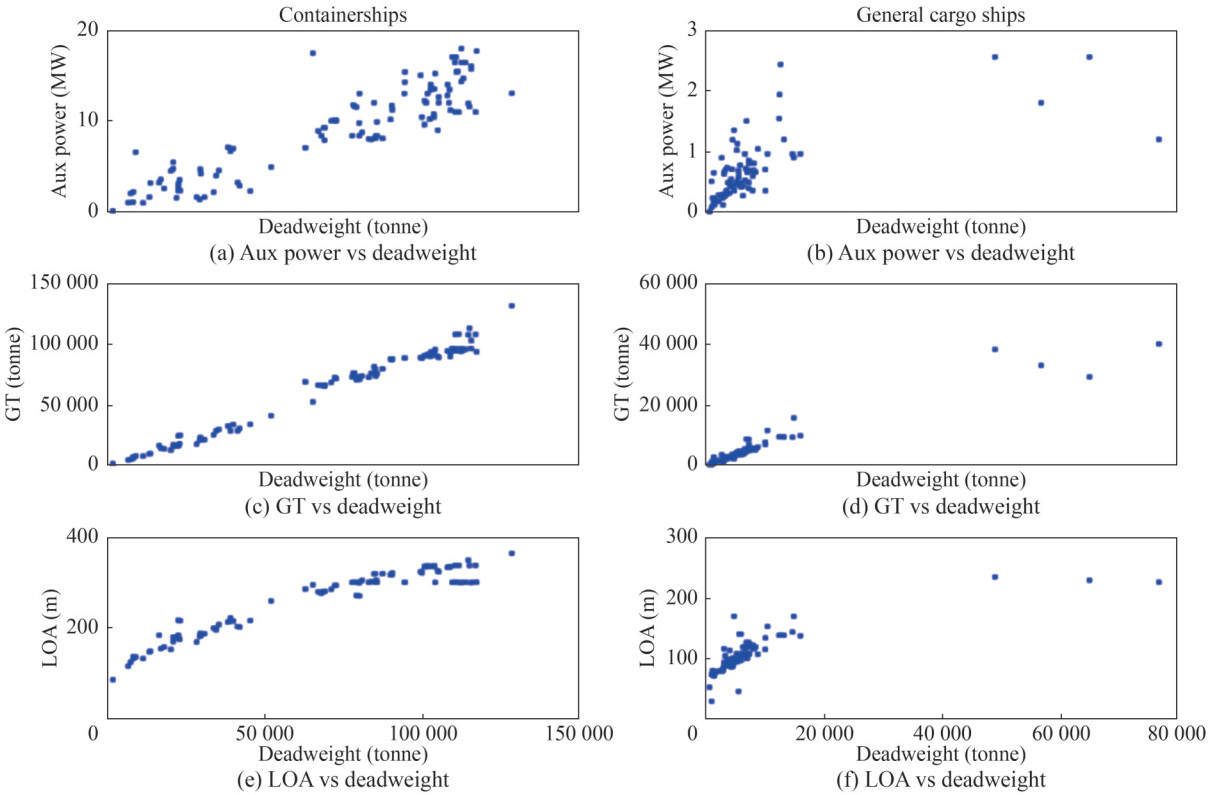 Figure 7 Calling ships length, tonnage and auxiliary power versus deadweight
5.2 Ship emissions inventory
The results of the ship emissions inventory based on the EPA methodology indicated that the containerships' emissions are estimated to be almost 15 168 tonnes while the general cargo ships' emissions were 1 147 tonnes. The emissions estimated by the IMO methodology are in line with those calculated by the EPA methodology. The containerships' emissions, in this case, are estimated to be nearly 13 058 tonnes while the general cargo ships' emissions were nearly 1 025 tonnes. Overall, there is a marked increase of 15% in the total auxiliary emissions evaluated using the EPA methodology compared with the IMO methodology, which is associated with the utilized emission factors and recent fuel data as shown in Figure 8. Furthermore, IMO covered the bottom-up approach by classifying each of the air pollutants with its emission factor estimation methodology. Therefore, the following analyses will be based on the results of the IMO emissions inventory.
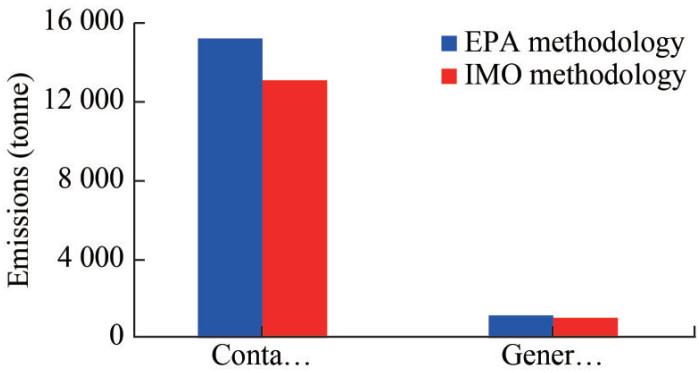 Figure 8 Total estimated emissions categorized by ship type
Apparently, the amount of auxiliary engines' emissions from general cargo ships is considerably lower than the containerships' emissions in both cases. This difference is due to the variation in the number of ships' port calls, as containerships are dominant because of their frequent port calls, unlike general cargo ships. Also, the ship size represents a significant factor in the resulting ship auxiliary engines' emissions, as the large size of containerships requires larger installed auxiliary engines. Figure 9 plots the comparison between the estimated total air pollutants using EPA and IMO methodologies. As can be seen, CO2 gas emissions are the dominant air pollutant, accounting for almost 98% of the total emissions in both cases.
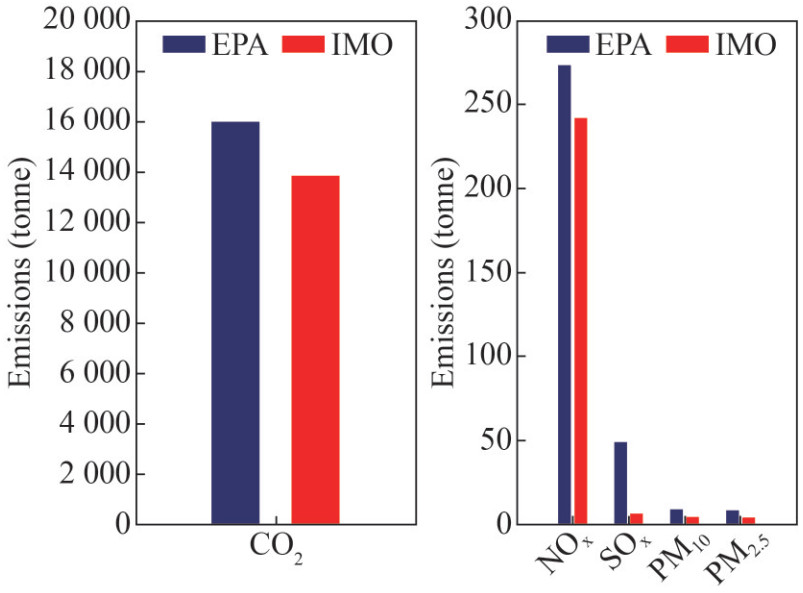 Figure 9 Total air pollutants estimated using EPA and IMO methodologies
Among the rest, NOx gas emissions are the second most common air pollutant, accounting for almost 81% and 95% of the total non-CO2 gas emissions estimated by the EPA and IMO, respectively. The difference is due to the variance in reported NOx emissions factors between the two methodologies. The third air pollutant is SOx gas emissions, which account for 14% and 2% of the total non-CO2 emissions in the EPA and IMO, respectively. This difference is due to the fact that the IMO methodology defines SOx as fuel-based emissions, and their emission factors depend on the pollutants found in the fuel. In the case of the EPA methodology, SOx gas emissions are estimated depending on the auxiliary engine's output power, and their emissions factors depend on engine load. In addition, these results indicate that the contribution of ships and hoteling activities to the carbon footprint may be significant regarding the air quality of the port region and surroundings. Therefore, the implementation of an emissions reduction technology for auxiliary engines such as the OPS system is a must.
5.3 OPS electricity emissions
The total emissions resulting from using the national grid as the OPS source of electricity are estimated to be approximately 10 183 tonnes, compared with the auxiliary engines' emissions of nearly 14 083 tonnes in the study period. The results revealed that relying on the electricity grid decreases total emissions by almost 28%, and this reduction is predicted to be higher if the electrical power is generated from a clean source. This prediction may be the key to initiating a power generation facility dependent on RES to cover the port's needs. Table 7 compares the port air emissions estimates from the berthed ships' auxiliary engines and the OPS system powered by the national grid. It was observed that the CO2 and NOx gas emissions resulting from using the national electricity grid decreased by almost 27% and 93%, respectively. This decrease is due to the low emission factor values resulting from the difference in fuel type used in generating the electrical power as well as the machinery used. However, SOx and PM emissions increased by 89% and 50%, respectively. This variation is due to the high emission factor values resulting from the assumption of sulfur content in the used fuel.
Table 7 Resulted national grid and auxiliary engines' emissions in (tonne)Source of emissions CO2 SOx NOx PM10 PM2.5 Auxiliary engines (AE) 13 827.2 6.0 242.1 4.2 3.8 National grid 10 095.1 55.6 16.7 8.3 7.7 These findings are also in good agreement with the results obtained in the literature. In this study, the CO2 and NOx emissions of the ships' auxiliary engines can be reduced by 3 732 and 225 tonnes, respectively, by using an OPS system powered by the national grid. This means an emissions reduction of 27% in CO2 emissions, 93% in NOx emissions, and a 28% reduction in total port emissions. For a medium-sized port in Aberdeen, an annual emission saving of 4 767 and 108 tonnes of CO2 and NOx emissions can be achieved by using OPS technology (Innes and Monios, 2018). Also, a probable emission saving of 42% for CO2 emissions and 94% for NOx emissions can be achieved by using an OPS system in the port of Taranto, which is a coastal city on the Mediterranean Sea such as Port Said (Adamo et al., 2014). Similar emissions reduction estimates were also reported in (Yıldırım and Alkan, 2018) for the port of Ege in Turkey, with a CO2 emissions reduction of 41% and NOx emissions reduction of 97%.
On the one hand, higher emissions reduction can be achieved for larger ports by adopting the onshore power concept. For example, the possible CO2 emission reduction at the port of Kaohsiung, Taiwan, can reach 25 391 tonnes/year by using OPS at an adoption rate of only 60% (Tseng and Pilcher, 2015). Also, a CO2 emission cut of 70% at berth would be achieved in the UK by shore power deployment (Bullock et al., 2023). On the other hand, a lower reduction in emissions is expected at smaller ports. For instance, an annual reduction in the exhaust gas emissions of CO2 of 276 tonnes can be delivered by adopting OPS technology at Safaga Port in Egypt (Seddiek et al., 2014). Therefore, detailed studies are required to investigate the potential of OPS technology, the challenges of its implementation in small ports, and the regulatory timeline of this implementation.
5.4 Socio-economic analysis
The damage costs of auxiliary engines' emissions are estimated to be almost $1 483 548 while the damage costs of OPS electricity emissions are estimated to be almost $1 265 673 in the study period. The results revealed that relying on the national grid as the OPS source of electricity decreases damage costs by nearly 15%. This is clear evidence that the OPS system has real socio-economic benefits, considering the improvement in the air quality of port regions and surroundings. Figure 10 illustrates the estimated damage costs of air emissions by their source. In the case of auxiliary engines' emissions, NOx gas emissions have the highest damage costs of all other emitted emissions, representing approximately 49% of the total damage costs. This variation is due to its large share of total non-CO2 emissions, which account for almost 95% of the total non-CO2 gas emissions. In the case of OPS electricity emissions, NOx gas emissions represent approximately 4% of the total damage costs due to its low share of total non-CO2 emissions, which account for only 19%. Moreover, the SOx gas emissions resulting from the national grid have the highest damage costs of all other emissions, representing nearly 40% of the total damage costs. This variation is due to its large share of total non-CO2 emissions accounting for approximately 63% of the total non-CO2 gas emissions, while in the case of ship auxiliary engines' emissions, SOx gas emissions represent almost 4% of the total damage costs due to its low share of total non-CO2 emissions accounting for only 2%. Furthermore, the cost of electricity consumed from the national grid at 0.061 $/kWh is $1 412 393, while the estimated cost of MDO consumed by ships' auxiliary engines is $6 167 459 at a fuel price of 1 430 $/metric tonne. After adding the damage costs in both cases, the results of analyzing cost differences in fuel and electricity prices show that the total electricity cost was reduced by 65% compared with the fuel cost consumed by berthed ships, as shown in Figure 11.
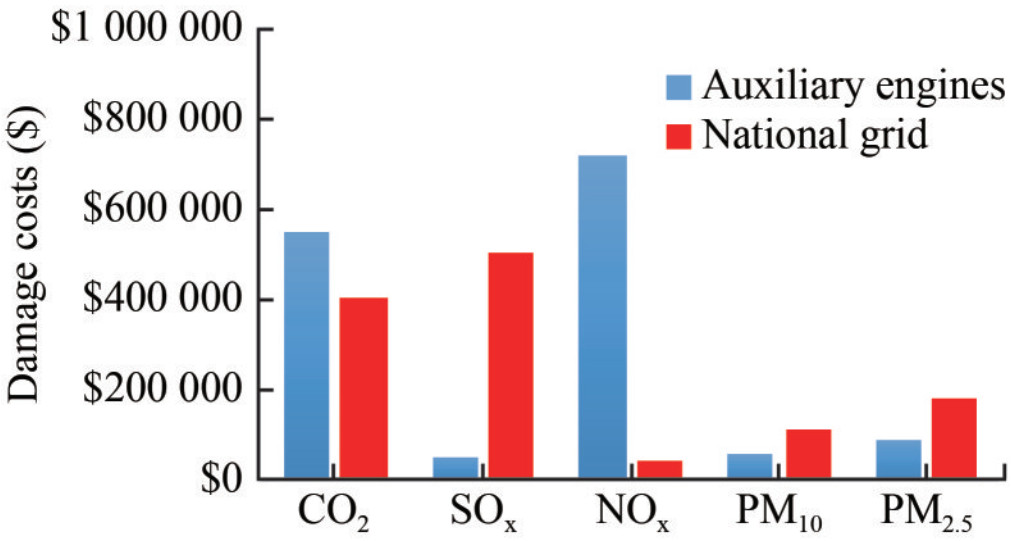 Figure 10 External costs of air pollutants emitted by auxiliary engines and OPS electricity grid
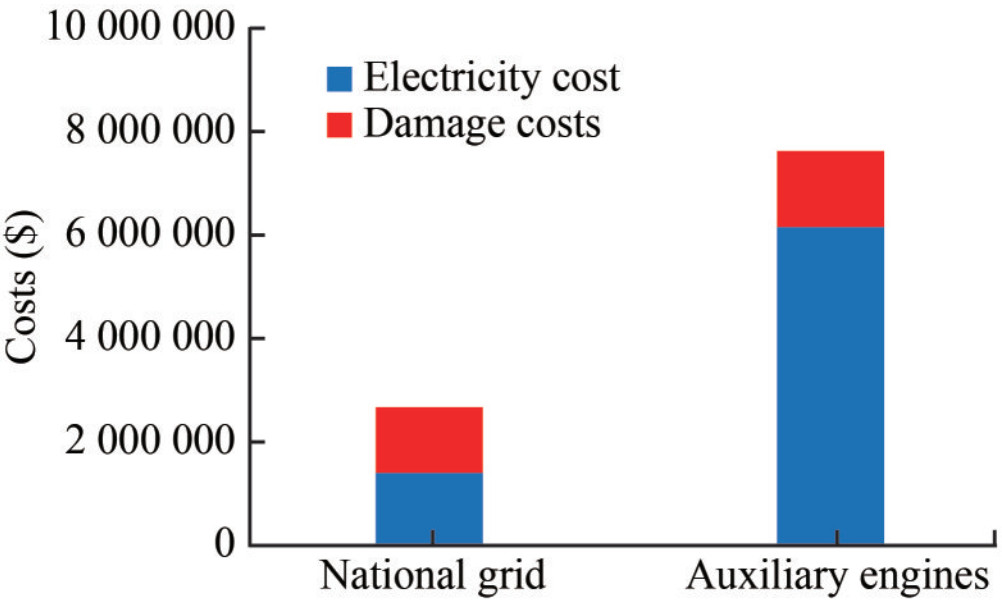 Figure 11 Total electricity cost categorized by its source
Figure 12 presents the analysis of different electricity and MDO prices regarding the change in total electricity and fuel costs, with the damage costs added in both cases. As can be seen in Figure 12, the total costs of electricity consumed by berthed ships at the port at every electricity price remain almost less than the total fuel costs consumed by the same ships during hoteling activity. This is an indication that the national grid option could be economical even though the price of electricity shows any increment in the upcoming years, particularly with the yearly increment of ships' MDO prices. In addition, a reasonable electricity price for the OPS connection will encourage the ships to plug into the system at the port, which enhances the process of shifting Port Said West Port into a green port. Furthermore, a reasonable electricity price is also feasible for the ships' owners when compared with the expected rise in fuel prices. Also, relying on OPS reduces the auxiliary engines' wear, tear, and maintenance costs, which increase the ship's lifecycle.
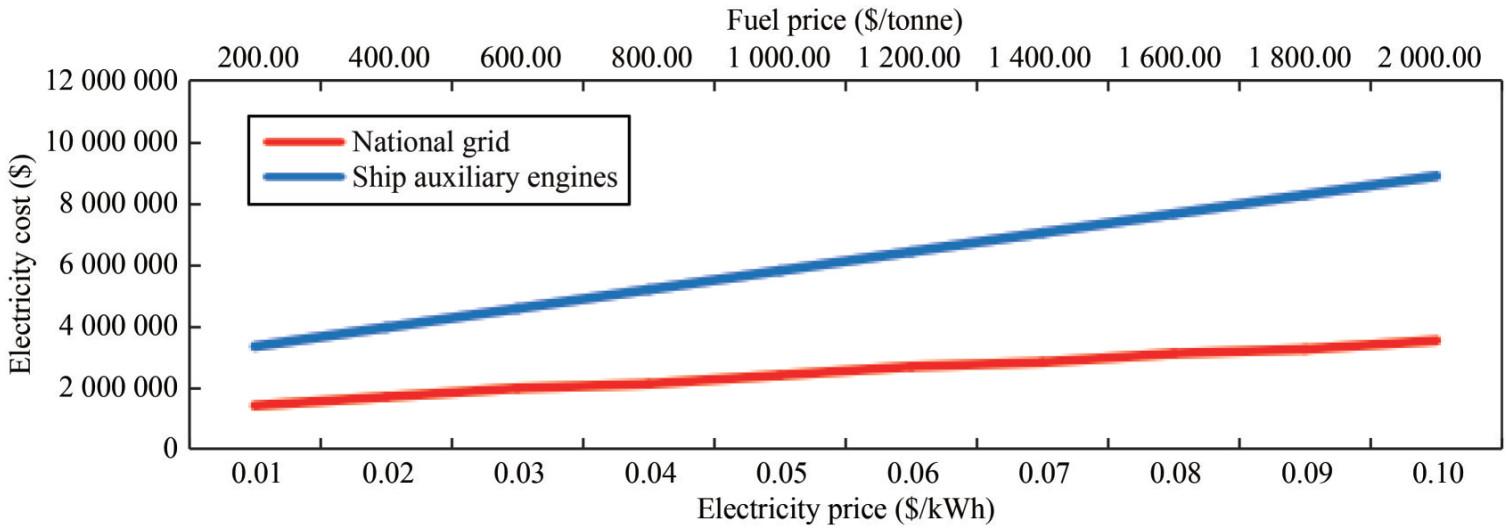 Figure 12 Change in total electricity and fuel costs with different prices
As a gauge of the impact of changes in input costs on prices, policymakers frequently rely on cost pass-through mechanisms (Guo and Gissey, 2019). Depending on the country's targets and sector structure, the degree to which electricity input costs are reflected in the energy price varies. In this case, the results of cost pass-through mechanisms indicate that if the electricity costs change by 50%, then an increase of 174%, or 0.10 $/kWh, is expected in the electricity price offered to ship owners, which in turn will result in a reduction of 18% in ship fuel cost savings. Moreover, if the electricity costs change by 100%, then a rise of 266%, or 0.16 $/kWh, is expected in the electricity price and a reduction of 35% in ship fuel cost savings. It should be noted that the improved pollution-control technologies and environmental restrictions may have a positive impact on the productivity and profitability of both the national grid and ship owners.
5.5 Assessment of solar energy resource
In order to improve the environmental performance of the proposed OPS system, the RES should be poured into the national grid, and then OPS could provide berthed ships with electricity from a clean source such as solar energy. Therefore, a sensitivity analysis is conducted, considering the available areas inside the port to set up the solar panels. As shown in Figure 13, when using 100% of the available area, the solar panels are enough to cover the power needs of the traffic selected. However, by using 75% of the available area for the PV system, 21.5% of the electricity required will be supplied by the national electricity grid, and by reducing the available area, more electricity from the national electricity grid will be required, as shown in Figure 13. Therefore, the national grid emissions resulting from feeding the OPS system with electricity can be reduced by 26%, 52%, 78%, and 100% by installing a PV system on 25%, 50%, 75%, and 100% of the available area inside the port, respectively, as plotted in Figure 14. Consequently, the total emissions reduction of 28% in Port Said West Port mentioned in Section 5.3 can also be further improved. This means that by using solar energy to power the OPS system, the port emissions' reduction can be increased from 28% to 47%, 66%, 84%, and 100% by installing a PV system on 25%, 50%, 75%, and 100% of the available area inside the port, respectively, as shown in Figure 14.
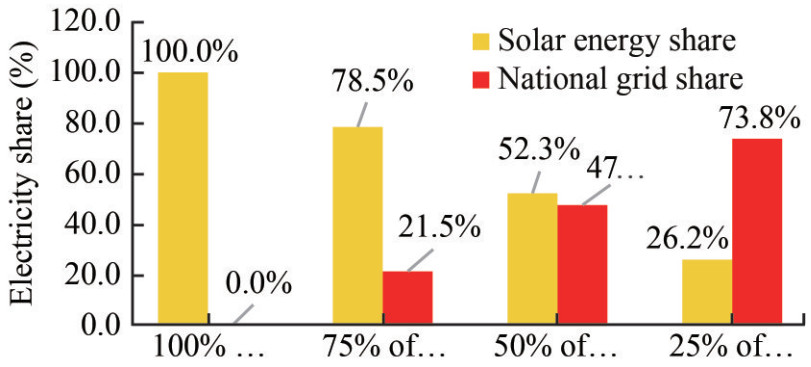 Figure 13 Change in electricity share by its source with the available areas inside the port
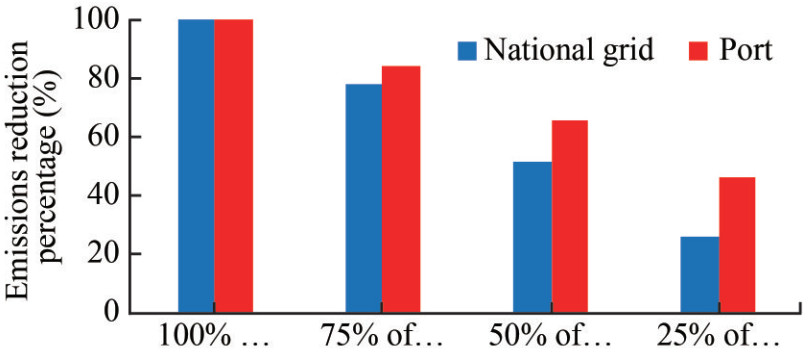 Figure 14 Reduction percentages of the port and national grid emissions for different available areas of the PV system
Figure 15 shows the monthly power requirement of the calling ships versus the power production estimated for each scenario. On the one hand, solar energy availability in May, June, July, August, and September is greater than the demanded energy consumption of berthed ships during these months when the solar panels are installed in 100% of the available area. At the same time, the maximum monthly solar energy was 2 498 343 kWh in May. Therefore, the PV system is sufficient and can cover the power needs of the calling ships during these months. On the other hand, the solar energy availability in October, November, December, January, February, March, and April is less than the demanded energy consumption of berthed ships during these months. The PV system, even when the solar panels are installed in 100% of the available area, cannot cover the power needs of the calling ships when demand is higher. In the case of the other three scenarios, the PV system cannot provide enough energy for the calling ships all year except for the 75% area available option, which can almost cover the power needs in the summer months.
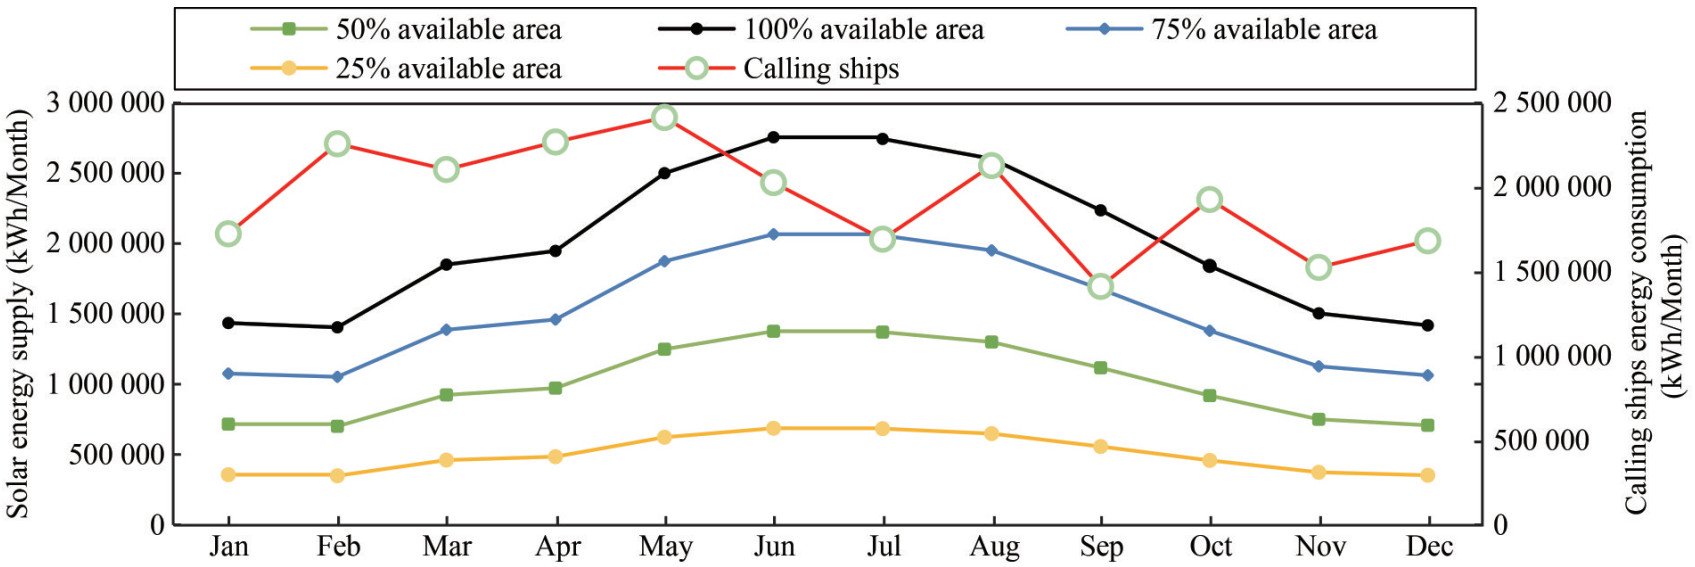 Figure 15 Monthly energy demand for Ships versus power capacity of each PV system scenario
5.6 Cost-effectiveness analysis
In order to evaluate the overall feasibility of OPS, NPV analysis is conducted for different scenarios of the OPS application. Positive NPV means that the OPS system is feasible, and the higher associated NPV scenario will be more attractive to apply. The OPS scenario is considered profitable when the total savings in external and electricity costs exceed the total private costs over the identified time period. These savings are analyzed from the perspective of the port authorities in the transition from the national electricity grid to the PV system.
The results of the considered indices are shown in Figure 16. As can be seen, both scenarios of 50 and 25% of the available area inside the port are not considered profitable due to the negative NPV. The scenario of covering 75% of the available area inside the port with a PV system is considered profitable due to the positive NPV of $8 025 000 with a payback period of almost three years. However, the best option is the one associated with 100% of the available area inside the port, which presents a lower payback period of almost two years to recover the system investment costs with a higher positive NPV of nearly $16 184 022. This scenario is considered the best investment choice due to the higher revenues from the increased sale of electricity to the berthed ships, the full dependence on the PV system instead of the purchased electricity from the national grid, and the lower annualized costs of the OPS system set side by side with the savings in external costs. Figure 17 plots the annualized costs of OPS with different scenarios of PV system areas, taking into consideration the OPS return on investment. As can be seen, the CAPEX of OPS is about $1 587 663 for retrofitting a single berth in Port Said West Port. The annual maintenance and replacement costs of OPS, which depend on the CAPEX of the system, are $79 383 and $1 428 896, which are constant for different PV area scenarios. In contrast, the CAPEX and O&M costs of the PV system vary with each scenario according to the available area inside the port. This change impacts the electricity costs purchased from the national grid and finally controls the return on system investment, as shown in Figure 17.
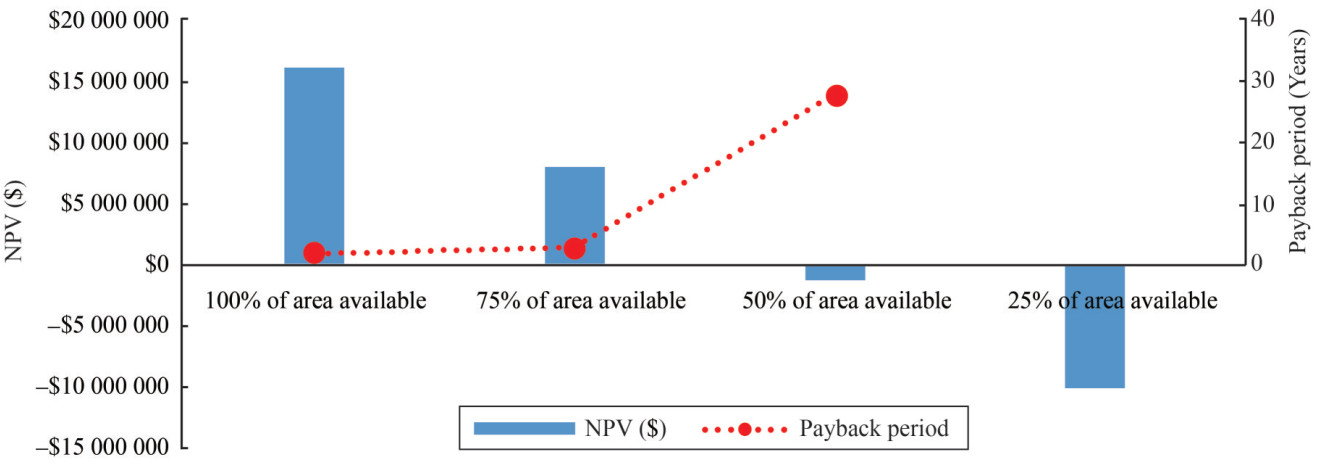 Figure 16 Estimated NPVs and payback periods for four scenarios of OPS and PV systems implementation
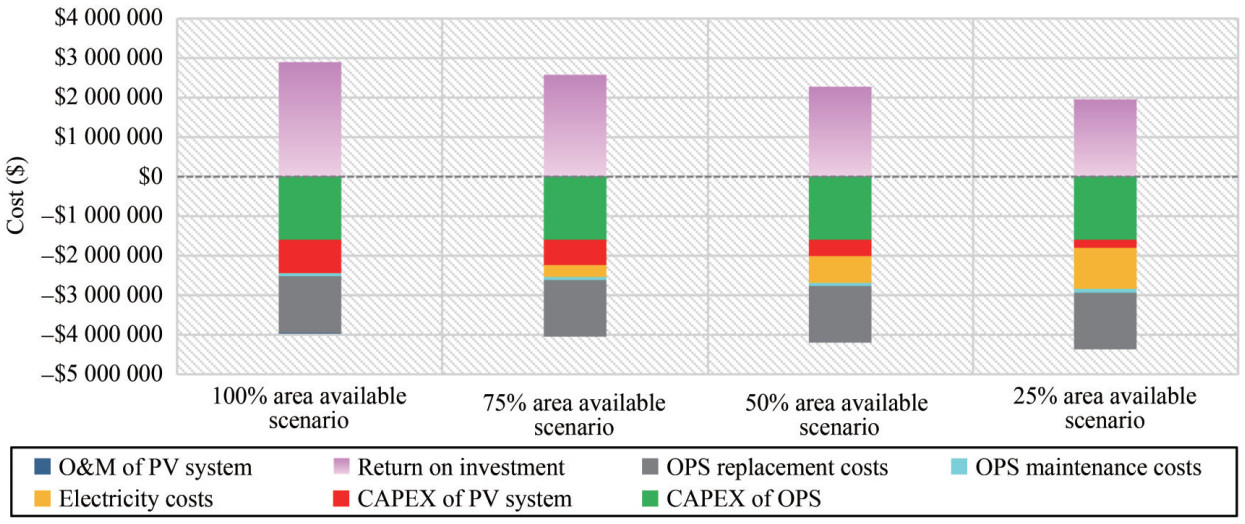 Figure 17 Annualized costs of OPS system at different scenarios of PV system areas with regards to the return on investment
Meanwhile, the OPS's economic performance can be highly affected by the sale prices of electricity, which fluctuate with the global geopolitical situation. The cost-effectiveness analysis reported to this extent corresponds to a national grid electricity price of 0.061 $/kWh as retrieved from the Egyptian Ministry of Electricity. Therefore, a sensitivity analysis is conducted on varying electricity prices to analyze the impact on the feasibility of the system with different PV system areas with regard to NPVs. Different sale prices of electricity are analyzed, as summarized in Figure 18. Apparently, the sale price of electricity represents a significant factor in the resulting NPVs. Any increase in electricity sale prices produces higher NPVs because of the high rates of cash inflow gained from selling green electricity to berthed ships and the national grid. Accordingly, low electricity sale prices produce negative NPVs because of the higher investment costs compared to the return on system investment. In addition, the variation in NPVs of the four scenarios depends on the change in electricity share by its source with the available areas inside the port, which affects the external cost savings and the expected revenues from selling green electricity. On the one hand, 100% of the available area inside the port scenario introduces a positive NPV at different electricity prices due to its complete dependence on the PV system. On the other hand, 75% and 50% of the area scenarios present negative NPV at low prices of electricity and positive NPV at higher electricity prices. In the case of the remaining option, the NPV can be negative at any price of electricity due to the low share of solar power compared to the national grid, as shown in Figure 18. These results indicated that the contribution of RES may be significant regarding the real economic benefits of OPS.
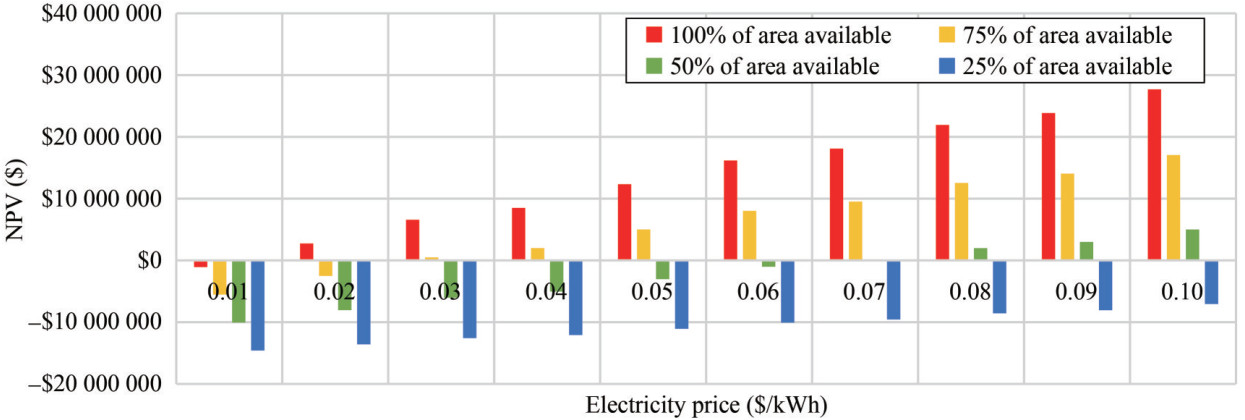 Figure 18 NPV sensitivity analysis to electricity price variation
For the sake of improving the economic performance of OPS and enjoying more economic gains, the perspective of port authority towards the use of OPS could not remain neutral. The port should sell green electricity at a higher price than purchasing it from the national grid. Therefore, a sensitivity analysis of OPS electricity tariff costs and its impact on NPVs is essential. The price of the electricity purchased from the national grid is kept at 0.061 $/kWh, while a range from 0.07 to 0.10 $/kWh tariff cost is selected to be investigated, as shown in Figure 19. Analyzing price differences' results revealed that the feasibility of OPS, in terms of NPVs, increases at higher sale prices of electricity, as can be seen in the three scenarios of 50%, 75%, and 100% area available. Furthermore, a tariff cost of 0.10 $/kWh is a profitable sale price for electricity because it covers the OPEX costs of the system with a reasonable share of profit for the port. The maximization of port profit can then be achieved by increasing income from providing OPS services to ships and selling green electricity to the grid.
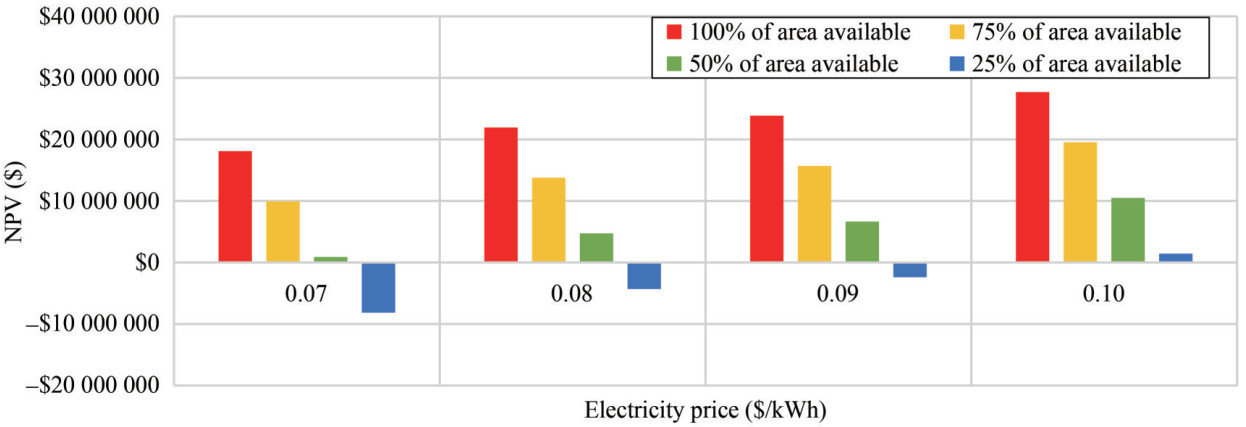 Figure 19 NPV sensitivity analysis to OPS electricity tariff cost
5.7 Challenges facing OPS application in Egypt
Despite the successful adoption of OPS in major ports around the world, there are some challenges to the adoption of OPS in Egypt. A major applicable barrier standing in the way of OPS employment is the lack of strict regulations. This legislation's absence may set the uptake of OPS back as it occurs in European ports while strict regulations in the United States (US) led to the successful adoption of OPS at US ports. In addition, ports cannot invest in OPS if there are not enough seagoing ships that are retrofitted and adopt the system. The fact is that investments in OPS systems are surrounded by high risks since there is no guarantee for the use of the available installations once employed. Also, OPS is not universally effective for all ship types, as it works better when seagoing ships operate in liner-type services (Sciberras et al., 2015). Liner-type services refer to the same ships calling frequently over several years to the same berths. Liner-type services typically include containerships, cruise ships, some bulk cargo, general cargo, and chemical tanker operations. Liner-type services are critical because the costs of ship retrofitting and upgrading berth infrastructure depend on frequent calls from retrofitted ships to these upgraded berths.
While challenges are identified, the study could be expanded to start addressing these issues by outlining essential regulations and cooperation between port stakeholders, decision-makers, and interested parties in order to encourage ports to adopt OPS. Furthermore, an appropriate funding proposal by means of financial subsidies, lower taxation rates, and fee adjustments is essentially required to encourage seagoing ships to adopt OPS onboard. Additionally, providing concessions at ports for the vessels that employ OPS through a preferential berthing plan could be a promising proposal to encourage other ships to use OPS during port stays.
6 Conclusion
Ships are a significant source of pollution in port regions and coastal areas. A significant decrease in ship emissions at ports could be achieved with the implementation of the OPS system. This paper investigates the OPS system application in Port Said West Port in Egypt, and covers a period of one year spanning from January 1st, 2019 to December 31st, 2019, where different seagoing ships berthing at the port are taken into consideration. As seen in the results, the total annual ship auxiliary engines' emissions are estimated to be almost 14 083 tonnes. The total emissions resulting from using the national grid as the OPS electricity source are estimated to be nearly 10 183 tonnes. The findings of the study revealed that by relying on the national grid, emissions can be reduced by 28%. Moreover, it is predicted that this reduction could reach 100% if electricity generation is solely based on solar energy. In addition, relying on a PV system as the main source of electricity for OPS significantly minimizes the total emissions when 100% of the available area inside the port is covered with solar panels. Furthermore, the damage costs of OPS electricity emissions can be reduced by 15% compared with the damage costs of ship auxiliary engines' emissions, and this reduction could be increased when relying on a clean source for generating electricity.
In order to evaluate the overall feasibility of OPS, a cost-benefit analysis is conducted across four scenarios of OPS application using the NPV methodology. Overall, the most profitable scenario by NPV is the one associated with 100% of the available area inside the port, which presents a lower payback period of almost two years and a higher NPV of nearly $16 184 022. This scenario is the best investment choice due to the higher revenues from the increased sale of electricity to the berthed ships, being fully dependent on the PV system instead of the purchased electricity from the national grid, and the low annualized costs of the OPS system set side by side with the savings in external costs.
Nevertheless, a more comprehensive economic analysis of the OPS system's profitability for both port authorities and ship owners is essential while taking into account an appropriate funding program to encourage ports to install the OPS, employing financial subsidies or tax and fee adjustments. In addition, internalization of external costs is highly required to further enhance the OPS's economic viability. This study can be used to evaluate the OPS's effectiveness and compare it to alternative ship emissions reduction options. Meanwhile, the methodological framework presented in this study could be a baseline for future research on different in-port environmental studies in similar regions and coastal areas of Egypt and could be expanded to other ship types, such as passengers and bulk carriers. In fact, Egypt has several ports located on the Suez Canal, Mediterranean Sea, and Red Sea that can take huge advantage of adopting the OPS system on their terminals to investigate the feasibility of adopting OPS with existing and future energy mixes on a larger scale.
Acknowledgement: The authors greatly acknowledge the support of Port Said West Port Authority in the Port Said branch towards the availability of the research data.Competing interest The authors have no competing interests to declare that are relevant to the content of this article. -
Figure 1 Map view of Port Said West Port (SCZONE, 2021)
Figure 2 Map of average annual solar irradiation in Egypt (SolarGIS, 2018)
Figure 3 Average solar hours per month in Port Said City
Figure 4 Aerial view of the area available for solar panels in Port Said West Port
Figure 5 Ships calling at Port Said West Port categorized by deadweight for (a) Containerships and (b) General cargo ships
Figure 6 Calling ships' electricity consumption versus deadweight for (a) Containerships and (b) General cargo ships
Figure 7 Calling ships length, tonnage and auxiliary power versus deadweight
Figure 8 Total estimated emissions categorized by ship type
Figure 9 Total air pollutants estimated using EPA and IMO methodologies
Figure 10 External costs of air pollutants emitted by auxiliary engines and OPS electricity grid
Figure 11 Total electricity cost categorized by its source
Figure 12 Change in total electricity and fuel costs with different prices
Figure 13 Change in electricity share by its source with the available areas inside the port
Figure 14 Reduction percentages of the port and national grid emissions for different available areas of the PV system
Figure 15 Monthly energy demand for Ships versus power capacity of each PV system scenario
Figure 16 Estimated NPVs and payback periods for four scenarios of OPS and PV systems implementation
Figure 17 Annualized costs of OPS system at different scenarios of PV system areas with regards to the return on investment
Figure 18 NPV sensitivity analysis to electricity price variation
Figure 19 NPV sensitivity analysis to OPS electricity tariff cost
Table 1 Auxiliary engine emissions factors (g/kWh) (EPA, 2017)
Fuel type CO2 SOx NOx PM10 PM2.5 Tier 0 Tier 2 MDO 690 2.1 13.9 9.7 0.38 0.35 Table 2 Auxiliary engines SFCbase (g/kWh) for different years of build (IMO, 2020)
Engine type Fuel type Before 1983 1984‒2000 2001+ Auxiliary engines MDO 210 190 185 Table 3 Auxiliary engines emissions factors for different air pollutants (IMO, 2020)
CO2 (g/g fuel) SOx (g/g fuel) NOx (g/kWh) Tier 0 Tier 2 3.206 0.001 4 11.2 9.7 Table 4 National grid electricity-specific emission factors (g/kWh)
CO2 SOx NOx PM10 436 2.4 0.72 0.36 Table 5 External cost factors due to specific air pollutants in ($/tonne) (Essen et al., 2020)
CO2 SOx NOx PM10 PM2.5 40.1 9 151.1 2 984.1 13 925.6 24 469.2 Table 6 Associated costs of port-based OPS equipment
Item Cost Lifespan(years) High voltage electricity connection ($) 647 976 30 High voltage cable installation ($) 221 676 40 Fixed cable reel system ($) 185 136 30 Electricity converter ($) 532 875 20 PV installation ($/kW) 883 20 PV system O&M ($/kW/year) 17.66 ‒ OPS maintenance ($/year) 5% of CAPEX ‒ OPS replacement ($/year) 5%‒10% less than CAPEX ‒ Table 7 Resulted national grid and auxiliary engines' emissions in (tonne)
Source of emissions CO2 SOx NOx PM10 PM2.5 Auxiliary engines (AE) 13 827.2 6.0 242.1 4.2 3.8 National grid 10 095.1 55.6 16.7 8.3 7.7 -
Acciaro M, Vanelslander T, Sys C, Ferrari C, Roumboutsos A, Giuliano G, Kapros S (2014) Environmental sustainability in seaports: a framework for successful innovation. Maritime Policy & Management, 41(5): 480-500. https://doi.org/10.1080/03088839.2014.932926 Adamo F, Andria G, Cavone G, De Capua C, Lanzolla AML, Morello R, Spadavecchia M (2014) Estimation of ship emissions in the port of Taranto. Measurement, 47, 982-988. https://doi.org/10.1016/j.measurement.2013.09.012 American Bureau of Shipping (ABS) (2021) Retrieved online from https://ww2.eagle.org/en.html (Accessed 13 May 2021) Andria G, Attivissimo F, Cavone G, Lanzolla AML, Spadavecchia M (2014) Environmental impact of the marine transport in port of Taranto. 5th IMEKO TC19 Symposium on Environmental Instrumentation and Measurements, 16-19. IMEKO-International Measurement Federation Secretariat Badino A, Borelli D, Gaggero T, Rizzuto E, Schenone C (2012) Noise emitted from ships: impact inside and outside the vessels. Procedia - Social and Behavioural Sciences. 48: 868-879. https://doi.org/10.1016/j.sbspro.2012.06.1064 Ballini F, Bozzo R (2015) Air pollution from ships in ports: The socio-economic benefit of cold-ironing technology. Research in Transportation Business & Management, 17: 92-98. https://doi.org/10.1016/j.rtbm.2015.10.007 Bassam AM, Phillips AB, Turnock SR, Wilson PA (2023) A solar energy-based shore side power system for a ferry service across the Suez Canal, Ships and Offshore Structures, https://doi.org/10.1080/17445302.2023.2245187 Bullock S, Hoolohan C, Larkin A (2023) Accelerating shipping decarbonization: A case study on UK shore power. Heliyon 9.7. https://doi.org/10.1016/j.heliyon.2023.e17475 CARB (2007) Technical support document: Initial statement of reasons for the proposed rulemaking-Regulations to reduce emissions from diesel auxiliary engines on ocean-going vessels while at-berth at a California port. Sacramento, CA: California Air Resources Board. Retrieved from http://www.arb.ca.gov/regact/2007/shorepwr07/shorepwr07.htmls CARB (2011) Initial statement of reasons for proposed rulemaking-Proposed amendments to the regulations fuel sulfur and other operational requirements for ocean-going vessels within California waters and 24 nautical miles of the California baseline. Sacramento, CA: California Air Resources Board. http://www.arb.ca.gov/regact/2011/shorepwr11/shorepwr11.html Chang CC, Wang CM (2012) Evaluating the effects of green port policy: Case study of Kaohsiung harbour in Taiwan. Transportation Research Part D: Transport and Environment, 17(3), 185-189. https://doi.org/10.1016/j.trd.2011.11.006 Cheng K, Chang Y, Kuang Y, Ling Q, Zou Z, Huang R (2022) Multiple-Year Changes (2014-2018) in Particulate Vanadium Linked to Shipping Regulations in the World's Largest Port Region. ACS Earth and Space Chemistry. 6: 415-420. https://doi.org/10.1021/acsearthspacechem.1c00402 Climate Data (2019) Climate-data. org, Port Said Climate: Average temperature, weather by month. Available at: https://en.climate-data.org/africa/egypt/port-said-governorate/port-said-504/ (Accessed: 02 October 2023) Corbett JJ, Winebrake JJ, Green EH, Kasibhatla P, Eyring V, Lauer A (2007) Mortality from ship emissions: a global assessment. Environ Sci Techno, 41(24): 8512-8518. https://doi.org/10.1021/es071686z De Jonge E, Hugi C, Cooper D (2005) European commission directorate general environment service contract on ship emissions: Assignment, abatement and market-based instruments. Task 2a-Shore-Side Electricity Final Report ENTEC UK Limited. Det Norske Veritas (DNV) (2021) Retrieved online from https://vesselregister.dnv.com/vesselregister/(Accessed 13 May 2021) EMICS Circular (2018) EMICS Egypt. Retrieved online from https://www.emicsegypt.com/ (Accessed 15 May 2021) Essen H, van Wijngaarden L, van Sutter D, Bieler C, Maffii S, Fiorello D, Fermi F, Parolin R, Schroten A, Brambilla M (2020) Handbook on the external costs of transport: version 2019-1.1. Publications Office of the European Union. https://doi.org/10.2832/51388 Esteve Pérez J, Gutiérrez Romero JE (2015) Renewable energy supply to ships at port. SARTI. https://raco.cat/index.php/Instrumentation/article/view/316007 Gilbert P, Bows-Larkin A, Mander S, Walsh C (2015) Technologies for the high seas: meeting the climate challenge. Carbon Management, 5(4): 447-461. https://doi.org/10.1080/17583004.2015.1013676 Gore K, Rigot-Müller P, Coughlan J (2023) Cost-benefit assessment of shore side electricity: An Irish perspective. Journal of environmental management, 326(Pt B): 116755. https://doi.org/10.1016/j.jenvman.2022.116755 Guo B, Gissey GC (2019) Cost Pass-through in the British Wholesale Electricity Market: Implications of Brexit and the ETS reform. Energy Policy Research Group, University of Cambridge. http://www.jstor.org/stable/resrep30333 Gutierrez-Romero J, Esteve-Pérez J, Zamora B (2019) Implementing Onshore Power Supply from renewable energy sources for requirements of ships at berth. Applied Energy. 255. 113883. https://doi.org/10.1016/j.apenergy.2019.113883 Huang L, Wen Y, Geng X, Zhou C, Xiao C, Zhang F (2017) Estimation and spatio-temporal analysis of ship exhaust emission in a port area. Ocean Engineering. 140: 401-411. https://doi.org/10.1016/j.oceaneng.2017.06.015 IMO (2020) Fourth IMO greenhouse gas study. MEPC 75/7/15: Reduction of GHG Emissions from Ships-Final report. https://www.imo.org/en/ourwork/Environment/Pages/Fourth-IMO-Greenhouse-Gas-Study-2020.aspx IRENA (2021) Renewable Capacity Statistics 2021. Technical Report, Abu Dhabi. https://www.irena.org/publications/2021/March/Renewable-Capacity-Statistics-2021s Kotrikla AM, Lilas T, Nikitakos N (2017) Abatement of air pollution at an Aegean Island port utilizing shore side electricity and renewable energy. Marine Policy, 75: 238-248. https://doi.org/10.1016/j.marpol.2016.01.026 Kraemer I, Czermanski E (2020) Onshore power one option to reduce air emissions in ports. Sustainability Management Forum. https://doi.org/10.1007/s00550-020-00497-y Kurt I, Boulougouris E, Pachakis D (2023) Comparative Technical-Economic Evaluation of Offshore Containerships Port Systems. Ships and Offshore Structures. https://doi.org/10.1080/17445302.2023.2226502 Lee H, Pham H, Chen M, Choo S (2021) Bottom-Up Approach Ship Emission Inventory in Port of Incheon Based on VTS Data. Advanced Transportation. 2021. https://doi.org/10.1155/2021/5568777 Maibach M, Schreyer C, Sutter D, Van Essen HP, Boon BH, Smokers R, Schroten A, Doll C, Pawlowska B, Bak M (2008) Handbook on estimation of external costs in the transport sector Internalisation Measures and Policies for All external Cost of Transport (IMPACT), Version 1.1. http://www.cedelft.nl/ Merk O (2014) Shipping emissions in ports. Paris: The International Transport Forum's Discussion Paper. https://doi.org/10.1787/5jrw1ktc83r1-en MFAT market report NZ (2021) The Importance of the Suez Canal to Global Trade Market Report Egypt: The New Zealand Embassy. https://www.mfat.govt.nz/assets/Trade/MFAT-Market-reports/The-Importance-of-the-Suez-Canal-to-Global-Trade-18-April-2021 Mohamed S, Salah-Eldine M (2020) Evaluating the sustainable green seaports (SGP) in Egypt: Case Study of Alexandria and Eldekhila Seaports, Journal of Alexandria University for Administrative Sciences, 57 (1). https://acjalexu.journals.ekb.eg/article_79839 Naty S, Viviano A, Foti E (2016) Wave Energy Exploitation System Integrated in the Coastal Structure of a Mediterranean Port. Sustainability. 8(12). https://doi.org/10.3390/su8121342 Ni P, Wang X, Li H (2020) A review on regulations, current status, effects and reduction strategies of emissions for marine diesel engines fuel. https://doi.org/10.1016/j.fuel.2020.118477 Nippon Kaiji Kyokai (ClassNK) (2021) Retrieved online from https://www.classnk.or.jp/hp/en/index.html (Accessed 13 May 2021) ODS register (2010) Noise from ships in ports Possibilities for noise reduction. Retrieved from https://mst.dk/media/mst/66165/978-87-92668-35-6 Paulauskas V, Filina-Dawidowicz L, Paulauskas D (2020) The Method to Decrease Emissions from Ships in Port Areas. Sustainability, 12(11): 4374. https://doi.org/10.3390/su12114374 Peng Y, Liu H, Li X, Huang J, Wang W (2020) Machine learning method for energy consumption prediction of ships in port considering green ports. Journal of Cleaner Production. https://doi.org/10.1016/j.jclepro.2020.121564 Sciberras EA, Zahawi B, Atkinson DJ (2015) Electrical characteristics of cold ironing energy supply for berthed ships. Transportation Research Part D: Transport and Environment. https://doi.org/10.1016/j.trd.2015.05.007 SCZONE (2021) West Port Said port. Retrieved from: https://sczone.eg/services/west-portsaid-port/ (Accessed 30 May 2021) Seddiek I, Mosleh M, Banawan A (2014) Fuel saving and emissions cut through shore-side power concept for high-speed crafts at the red sea in Egypt. Journal of Marine Science and Application, 12: 463-472. https://doi.org/10.1007/s11804-013-1218-6 Seddiek I (2019) Application of renewable energy technologies for eco-friendly sea ports. Ships and Offshore Structures. https://doi.org/10.108017445302.2019.1696535 Seediek I, Elgohary M (2020) Assessment of renewable energy supply for green ports with a case study. Environmental Science and Pollution Research. 27(5): 5547-5558. https://doi.org/10.1007/s11356-019-07150-2 Ship and bunker (2022) Retrieved from https://shipandbunker.com/prices#MGO (Accessed 2 June 2022) Slack B, Comtois C, Wiegmans B, Witte P (2018) Ships time in port. International Journal of Shipping and Transport Logistics. https://doi.org/10.1504/IJSTL.2018.10008534 SolarGIS Freemaps (2018) Global Horizontal Irradiation. Country maps: Egypt. Solar resource map 2018 Retrieved from https://solargis.com/maps-and-gis-data/download/egypt (Accessed 4 July 2022) Stolz B, Held M, Georges G, Boulouchos K (2021) The CO2 reduction potential of shore-side electricity in Europe. Applied Energy, 285: 116425. https://doi.org/10.1016/j.apenergy.2020.116425 The United States Environmental Protection Agency (EPA) (2017) Shore Power Technology Assessment at U.S. Ports. Transportation and Climate Division Office of Transportation and Air Quality U. S. Environmental Protection Agency. Retrieved from https://www.epa.gov/sites/default/files/2017-05/documents/420r17004-2017-update Tiwari GN, Arvind K (2016) Handbook of solar energy: theory, analysis and applications (energy systems in electrical engineering). Singapore: Springer. https://doi.org/10.1007/978-981-10-0807-8 Tseng P, Pilcher N (2015) A study of the potential of shore power for the port of Kaohsiung, Taiwan: to introduce or not to introduce. Research in Transportation Business & Management, 17: 83-91. https://doi.org/10.1016/j.rtbm.2015.09.001 Tzannatos E (2010) Ship emissions and their externalities for the port of Piraeus-Greece. Atmospheric Environment. 44. 400-407. https://doi.org/10.1016/j.atmosenv.2009.10.024 Wang L, Liang C, Shi J, Molavi A, Lim G, Zhang Y (2021) A bilevel hybrid economic approach for optimal deployment of onshore power supply in maritime ports. Applied energy, 292. https://doi.org/10.1016/j.apenergy.2021.116892 Winkel R, Weddige U, Johnsen D, Hoen V, Papaefthimiou S (2016) Shore Side Electricity in Europe: Potential and environmental benefits. Energy Policy, 88: 584-593. https://doi.org/10.1016/j.enpol.2015.07.013 Yarova N, Vorkunova O, Khoteyeva N (2017) Economic assessment of the alternative energy sources implementation for port enterprises. Economic Annals-ХХI, 166(7-8): 46-50. https://doi.org/10.21003/ea.V166-09 Yıldırım Pekşen D, Alkan G (2018) Application of Alternative Maritime Power (AMP) Supply to Cruise Port. J. ETA Maritime Science, 6(4): 307-318. https://doi.org/10.5505/jems.2018.15870 Zhai Q, Cao H, Zhao X, Yuan C (2011) Cost Benefit Analysis of Using Clean Energy Supplies to Reduce Greenhouse Gas Emissions of Global Automotive Manufacturing. Energies 4, no. 10: 1478-1494. https://doi.org/10.3390/en4101478 Zis T, North R, Angeloudis P, Ochieng W, Harrison Bell M (2014) Evaluation of cold ironing and speed reduction policies to reduce ship emissions near and at ports. Maritime Economics & Logistics, 16(4): 371-398. https://doi.org/10.1057/mel.2014.6 Zis T (2019) Prospects of cold ironing as an emissions reduction option. Transportation Research Part A: Policy and Practice, 119: 82-95. https://doi.org/10.1016/j.tra.2018.11.003
