
A Design Approach to Assess Effects of Non-Contact Underwater Explosions on Naval Composite Vessels
https://doi.org/10.1007/s11804-024-00421-6
-
Abstract
Despite the non-contact underwater explosion phenomena (UNDEX) have been studied for decades and several numerical methods have been proposed in literature, its effects on military structures, especially composite ones, are even nowadays matter of research. In early design phases, it is not always possible to verify the shock resistance of hull structures modelling the whole phenomenon, in which fluid, gas and solid properties must be properly set in a fully coupled fluid-structure interaction (FSI) numerical model. These ones are extremely complex to set, computationally demanding and certainly not suitable for everyday design practice. In this paper, a simplified finite element (FE) model, easy to use in an early design phase, is proposed. Both, the structure and the fluid are simulated. In this approximation, the fluid behaviour is simplified, using special finite elements, available in a commercial software environment. This choice reduces the computational time and numerical efforts avoiding the problem of combining computational fluid dynamics (CFD) and FE domains and equations in a fully coupled fluid-structure interaction model. A typical parallel body block of a minesweeper is modelled, using two-dimensional multi-layered shell elements to properly account for the composite materials behaviour. For the fluid instead, three dimensional volumetric elements, directly coupled to the structural elements, are placed. In addition, the same calculation is performed, modelling separately fluid in the CFD environment and structures in the finite element one. Thus, realizing a fully coupled fluid-structure interaction model. The results obtained by applying both numerical models are compared with the structural response measured on board of a composite ship during a full-scale shock test. The simplified proposed procedure provides results in satisfactory agreement with experiments, allowing the validation of the model. Approximations are discussed and differences with the real phenomenon and fully coupled CFD+FE method are shown, providing a better understanding of the phenomena. Eventually, the modelling strategy has been considered a valuable and cost-effective tool for the concept and preliminary design of composite structures subject to underwater explosions.Article Highlights● Underwater explosions (UNDEX), because of complex fluid-structure interaction (FSI) phenomena, can be particularly severe on naval composite structures.● Numerical methods in which FSI is simulated are not feasible in early design phase.● An approximate finite element model is validated to predict UNDEX shock response.● Numerical results are compared with data achieved by full-scale tests, showing that the modeling strategy is a valuable tool for preliminary shock design of ships. -
1 Introduction
Naval vessels are subjected to dangerous threats when they are in an operational scenario, among which conventional and non-conventional mines threats play an important role even nowadays. The effects of non-contact underwater explosions can be particularly severe on naval structures, from damage to machinery, to cracks in hull shell plating, until likelihood of sinking (Szturomski, 2015). Military ships should be properly designed to withstand to these hazards according to navies standards.
The requirements become even stricter and the challenges harder when minesweepers are under design as they are generally made by composite materials, which can be useful for their low weight properties and for their reduced magnetic signature but need to have excellent shock resistance.
Shock tests, realized using standard shock machines, which details are described in rules (NAV 30 A001, 1986), (MIL S 901 D, 1989), (STANAG 4141, 1976), are always used to verify shock resistance of machinery and related foundations. Their shock response can also be predicted by calculations, using DDAM method (NAVSEA 0908-LP-000-3010, 1995), quasi-static and dynamic methods (SMM/CN 300 DVD, 1978). Some guidelines to assess their dynamic response are explained in (Mannacio et al., 2021) and (Mannacio et al., 2022). Full scale shock tests are, instead, used even now to assess the shock response of hull structures (SMM/CN 300 DVD, 1978). However, they are expensive, hardly practicable, and certainly not feasible in an early phase of design. Some theoretical and numerical methods should therefore be used to predict shock resistance.
Underwater explosions phenomena (UNDEX) have been studied for several years. Cole (1914) analysed shock waves analytically, providing equations to determine the peak pressure and the related decay from experimental tests in open water. Swisdak (1978) proposed coefficients to predict peak pressure, energy, and impulse, according to different explosion scenarios such as shallow water or different types of charge. Shock wave propagation in fluids have been studied experimentally and numerically (Sommerfeld and Müller, 1988). Costanzo (2010) described the whole phenomenon from the shock wave to the bubble pulse, explaining physical reasons of cavitation event. Geers and Hunter (2002) provided an integrated model to predict the bubble pulse effect in the fluid. Keil (1961) provide indicators to estimate severity of shock phenomenon on naval structures.
Nowadays several numerical methods are available, that can be used to model the UNDEX phenomenon, in which fluid-structure interaction (FSI) is simulated in the attempt to predict the structural response. A good summary of the available approaches is reported in (Vannucchi de Camargo, 2019), where fluid descriptions, constitutive materials for naval panels, and different solving methods such as FEM (Finite Element Method), FVM (Finite Volume Method), BEM (Boundary Element Method), and SPH (Smooth Particle Hydrodynamics) are described. A benchmark of computation methods organized by different numerical codes is reported by Mair (Mair, 1999). An approximate technique, commonly used to predict UNDEX response (Scavuzzo and Pusey, 2002) is the Doubly Asymptotic Approximation (DAA). The principles of this special boundary element method are shown by Geers (1971; 1978). Felippa and DeRuntz (1991) modified the method to include cavitation effects. An example of application of this method to predict the shock response of a battleship is reported by Liang and Tai (2006). The Acoustic-Lagrangian approach, which consists in simulating the fluid using the acoustic approximation and the structures referring to the classical FE lagrangian environment is a widely accepted method for non-contact underwater explosions. As an example, Zong et al. (2013) used the commercial finite element code ABAQUS-explicit to simulate the effects of a stiffened plate and compared results with experimental data, then applying the same numerical set-up to a whole ship. Zhang et al. (2022) studied the effects of bubble jet impacts on steel plates using a coupled Eulerian and Lagrangian method. Li et al. (2023) used a finite volume method with five-equation model for multi-fluid to predict underwater explosions near a rigid cylinder. Gannon (2019) modelled the close-in explosion in the proximity of a submerged cylinder using an E-L explicit method, available in LS-DYNA, including explosion gases in the simulation and comparing results with experimental data. Ming et al. (2016) made SPH calculation considering a close-in explosion on a naval ship, obtaining preliminary good results. Gong et al. (2023) investigated the responses of simplified hull girder structures subjected to underwater explosions using coupled Eulerian and Lagrangian methods. Kong et al. (2023) proposed the use of machine learning algorithms to rapidly assess the damage of stiffened plates subjected to underwater explosions. In any case, no examples validated by experimental data nor robust and cost-effective methods in which only a FE approach is applied have been found in open literature to the best of the authors' knowledge.
Numerous approaches have been employed to include effects on composite structures in numerical methods. A strain rate dependence, governed by the impact velocity, is shown by fiber-reinforced glass laminates (Barrè et al., 1996; Welsh and Harding, 1985). Historically, effects of UNDEX to E-glass composites are predicted by assuming that the material inputs are determined from quasi-static tests data (LeBlanc and Shukla, 2010). Strain rate effects have been sometimes included in UNDEX shock prediction (Batra and Hassan, 2007; Wei et al., 2013). Latourte et al. (2011) included failure mechanisms in numerical calculations. Arora et al. (2012) highlighted the importance of boundary conditions on the structural response caused by the underwater blast to glass fiber-reinforced plastics and sandwiches.
A complete review of experimental and numerical methods particularly used to assess the UNDEX response of composites is reported in the work of Tran et al. (2021). However, these methods cannot be easily included in an early phase of design.
In this paper, an approximate FE approach, easy-to-apply in an early design phase, is used to predict the UNDEX effects on board of a typical single skin fiberglass, single hull, minesweeper. It is part of a wider project, described in (Mannacio, 2023), which has the target of reducing the vulnerability of naval vessels. Material and structural features are openly reported (Green Associates, 1999). Calculations are performed using both, the proposed approximate method and a classical fully-coupled FSI approach encompassing Computational Fluid Dynamics (CFD) and finite element method (FEM). In the following, they are mentioned respectively as approximate FE and full FSI for simplicity's sake.
Within the approximate FE approach, the fluid is simulated using 3-D fluids elements, available in the finite element environment, without the need to apply CFD software. The orthotropic behaviour of E-glass polyester resin laminates is considered as well. Numerical results, obtained by both approaches (approximate FE and full FSI), are compared with experimental data obtained by a full-scale test realized in past years, whose comprehensive description is reported in (Mariperman, 1988). Namely, strain measurements on a hull plating are compared with numerical estimates. Eventually, it is shown that the proposed modelling strategy, validated by experimental data, can lead to time-and cost-effective design assessments.
2 Test description
The full-scale shock test used as validation reference is that realized on board of a typical composite minesweeper vessel by Mariperman (1988) in late eighties. A trinitrotoluene (TNT) charge of 130 kg of weight (W) is suspended by a buoy at a depth of 29 m in a 30 m deep seabed. The shock test geometry is reported in Figure 1. The charge is set on the starboard side of the ship, perpendicular to the centre in longitudinal coordinates of the ship reference system. The distance between the charge and the keel line is R1=103.6 m, while its distance to the closest point of the ship is R2=100 m. The angle between the seabed and the theoretical line that connects the charge with the keel is of 15.2°. The ship draught is 2.8 m, while the beam at waterline is 9.1 m.
 Figure 1 Shock test geometry (MARIPERMAN, 1988)
For this configuration, it is possible to assess the attack severity using classical indexes called Shock Factors, whose meanings are well explained by Keil (1961).
In particular, the formula used for the Shock Factor, in which the minimum distance of the charge is considered (R2), is:
$$ \mathrm{SF}=\frac{\sqrt{A \cdot W}}{R_2} $$ (1) It is also useful to define a parameter that considers the distance of the charge from the keel line (R1) and the angle of incidence of the shock wave (φ in Figure 1). In this case the formula becomes:
$$ \mathrm{KSF}=\frac{\sqrt{A \cdot W}}{R_1} \cdot \frac{1+\cos (\varphi)}{2} $$ (2) The value A in Equations (1) and (2) is used to include the fact that the explosion happens in proximity of the seabed. In this case, considering that there is a sandy ground in this scenario, the A value is set to a value close to 1.5 according to experimental values found by Petralia (2000).
As a result, the shock factor values calculated for this geometry of explosion are approximately SF" ≈ 0.14 and KSF" ≈ 0.08.
Two pressure sensors (reported as S1 and S2 in Figure 1) are set to measure the shock wave pressure close to the ship, respectively at about 15 m and 5 m of distance from the keel line. They are piezoresistive transducers type ENDEVCO 8511A, full-scale value of 35 MPa, suspended to buoys at the desired depth. Their sampling frequency is set to 40 kHz.
The signal measured by S2 sensor is reported in Figure 2, showing the comparison with the pressure calculated analytically. This pressure time history will be used as load input in the numerical calculation. It can be noted that the first peak of pressure is followed by the rarefaction wave, which causes negative values of pressure. Then, the phenomenon of cavitation closure occurs, and several peaks of lower size are measured by the sensor. These phenomena are well explained by Costanzo (2010). Classical formulas proposed by Cole (1914), are used to determine the peak pressure Pmax and the angle decay θ of shock pressure time history (Equations 3-4).
 Figure 2 Experimental and analytical pressure time history measured by S2 sensor
$$ P_{\max }=K\left(\frac{W^{1 / 3}}{R}\right)^\alpha $$ (3) $$ \theta=K W^{1 / 3}\left(\frac{W^{1 / 3}}{R}\right)^a $$ (4) In these formulas coefficients K and α are set considering those proposed by Keil (1961) for TNT: in Table 1 coefficients for each equation are shown. SI measurement system is used, therefore Pmax is in megapascal (MPa), W in kilogram (kg), R in meter (m), and θ in millisecond (ms). The pressure in the time domain is given by the following equation provided by Cole (1914), that is considered valid when time t is less than θ value:
Table 1 Coefficients in peak pressure and angle decay formulasEquation K α Pmax 52.4 1.13 θ 92.5 −0.22 $$ P(t)=P_{\max } e^{-\frac{t}{\theta}} $$ (5) A novel approach for the dynamics of oscillating bubbles such as cavitation bubbles, underwater explosion bubbles, and air bubbles has been proposed by Zhang et al. (2022). This theory proposed bubble dynamics equations that can simultaneously take into consideration the effects of boundaries, bubble interaction, ambient flow field, gravity, bubble migration, fluid compressibility, viscosity, and surface tension while maintaining a unified mathematical form. The far-field shock wave pressure, calculated by using the approach based on the weakly compressible assumption of Zhang et al. (2022), is in agreement with theoretical and experimental results.
Monoaxial strain gauges type KIOWA KFW-5-C1-11-L100 (5 mm long, 120 Ω of resistance, 2.09 of gauge factor) are used to measure the structural response. In particular, three of them are set on the panel of the hull between the bottom keel and the bilge keel, in the midsection, on the right side, in correspondence of the direction of the explosion. They are oriented in the transversal direction in order to measure the local structural response of the considered panel. Gauge no. 1 is placed in way of the bottom keel, no. 2 in the centre of the panel and no. 3 close to the bilge keel (see Figure 3). The ship section has the following features:
 Figure 3 Monoaxial strain gauges setup in midship section-frontal view (Mariperman, 1988)
⋅Breadth: 9 m;
⋅Draugth: 2.8 m;
⋅Height: 14.5 m;
⋅Distance between decks: 4 m;
⋅Distance between Ω-shaped stiffeners: 1 m.
Some pictures of the TNT charge and the detonation are reported in Figures 4-5.
 Figure 4 130 kg TNT charge (MARIPERMAN, 1988)
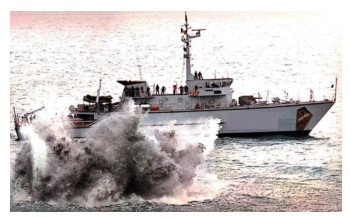 Figure 5 Underwater shock test explosion (MARIPERMAN, 1988)
3 Numerical models
The FE software used for this application is ADINA (2015). Two different numerical models are built in which the approximate FE method and the full FSI approaches are used separately to predict the structural response of the same explosion scenario. Differences in modelling and simulation are presented. In particular, in the approximate FE method a coupled fluid-interaction model is built in which fluid and solid elements are modelled in the FE environment only, without the necessity of solving Navier-Stokes equations as used in CFD methods. Both approaches request the structure modelling in the FE environment: details are reported in the following text.
3.1 Structural modelling
A typical minehunter ship parallel body block is modelled in the FE environment, using two-dimensional multi-layered shell elements, having 4-nodes, 500 mm×500 mm size and Mixed Interpolated Tensorial Components (MITC) formulation, already used to model composite behaviour of ship structures (Gaiotti and Rizzo, 2013; Gaiotti et al., 2014), and further described by Dvorkin and Bathe (1984) (see Figure 6). In the numerical representation, shell plating, decks and longitudinal stiffeners are modelled duly considering their mechanical properties and shapes. In particular, Ω -shaped stiffeners are modelled using shell elements as well for webs and top-hat. About the structural properties of this minesweeper, a rather heavy single skin construction was employed, without stiffening frames on the hull shell. Therefore, no stiffeners are modelled in the software environment accordingly. Thicknesses of shell plates and stiffeners do vary from 10 to 220 mm, according to standard values for minehunter vessels (Green Associates, 1999).
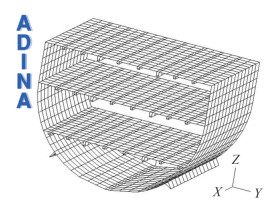 Figure 6 Midship section in finite element environment
The considered ship block is 6 m long in longitudinal direction to represent the central compartment of the minesweeper. Simply supports are set at the free edges to approximate the transversal bulkheads constraints. In particular, in proximity of the transversal bulkheads the translations have been fixed, while rotations have been set free. In addition, calculations are performed using also constraints type all fixity at the free edges. No significant differences in the numerical results are obtained, compared to the previous case, therefore, results computed by the simply support modelling are shown in the following text.
Orthotropic material properties are set in the FE calculation considering standards proposed by Smith (1990) for naval vessels. E-glass polyester balanced woven-roving (WR) material is considered, whose properties are shown in Table 2.
Table 2 Composite material properties proposed by Smith (1990)Material Fibre volume fraction, Vf Density(kg/m3) Young's modulus E (GPa) Poisson modulus [ν] Shear modulus(GPa) Tensile strength (MPa) Comp. strength(MPa) Shear strength(MPa) E-glass polyester(balanced WR) 0.34 1 700 15 0.2 3.5 250 210 100 Balanced biaxial properties are considered, therefore Young's modulus value is set equal in longitudinal and transversal direction. To assess the missing transversal properties, the well-established Halpin-Tsai (Halpin and Nicolais, 1971) equations are used, already satisfactorily applied (Gaiotti and Rizzo, 2013; Gaiotti et al., 2014). Therefore, orthotropic properties in longitudinal, transversal and normal direction can be assessed and set as input for the calculation. The complete material characterization is shown in Table 3. As it is reported by Green Associates (1999) "balanced" laminates should have a proportion of fibres in 0° and 90° directions. Hence, the laminate is reproduced using a stacking sequence of layers, which orientation in 0°/90° direction can be easily set in ADINATM (2015) using multi-layered shell elements (Dvorkin and Bathe, 1984).
Table 3 Orthotropic composite material properties used as input of the calculationEL(GPa) ET(GPa) EN(GPa) GLT(GPa) GLN(GPa) GTN(GPa) νLT νLN νTN 15 15 10 4.5 3.6 3.6 0.2 0.4 0.4 3.2 Approximate finite element approach: fluid modelled in finite element environment
The approximate FE approach consists in simulating fluid, structures and their interaction in the FE environment, without the necessity of computing CFD calculations. Fluid around the ship slice is modelled using 3-D potential-based fluid elements, available in the structural part of the FE software. Eight nodes volumetric elements, characterized by a 500 mm × 500 mm × 500 mm mesh size are chosen. These elements can be directly coupled to the structures, considering that the structural motions cause fluid flows normal to the structural boundary, while the fluid pressures cause additional forces to act on the structure. As reported in the ADINATM (2015) manual, some assumptions are made, when using these special elements. The medium is assumed to be inviscid, irrotational, with no heat transfer, compressible or almost incompressible, with relatively small displacements of the fluid boundary, and maximum fluid velocity below the sound speed. Non-linear subsonic formulation for fluid velocity, well described by Sussman and Sundqvist (2003), is used to reproduce the fluid flow. To employ this formulation, fluid pressure p is assumed to depend only by the density ρ and by no other variables, such as e. g. the temperature. The numerical relationship (ADINA, 2015) is the following:
$$ \rho=\rho_0\left(1+\frac{p}{k}\right) $$ (6) in which ρ0 is the fluid density when p = 0 and k is the bulk modulus of the fluid.
As a result, in the FE calculation, an additional nodal degree of freedom is set, associated to the fluid potential φ. Therefore, only an additional equation per node is solved by the software, referring to a classical FE formulation, where only structural elements are imposed. Material properties of sea water are set in the 3-D fluid elements formulation, considering that only bulk modulus (2.2 GPa) and fluid density (1 023 kg/m3) are necessary.
A corresponding slice of sea water, having the same longitudinal length of the minesweeper section, is modelled starting from the position of S2 pressor sensor in Figure 1. Transversally, it is extended to about 30 m on the left side of the ship, to avoid reflection of the shock wave from boundaries, when it passes over the ship (see Figure 7). The shock pressure is applied in the same position (S2) of the measurement signal on a spherical surface where the shock front is supposed to be distributed when it moves from the charge. In Figure 7, the shock wave position is highlighted using the largest indicators. In addition, atmospheric pressure is set on the free surfaces of the fluid, as shown from the vertical indicators, and hydrostatic pressure is placed on the outlet surface on the slice of modelled sea portion, referring to the triangular ones.
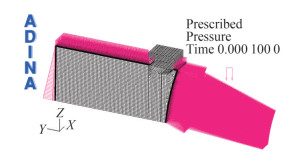 Figure 7 Complete fluid-structure model with prescribed pressures
Boundary conditions are simulated on the surfaces of the fluid domain using interface elements. When fluid surfaces are in contact with shell structural elements, fluid-structural interface elements are built by the software. Each node contains both, potential degree of freedom and displacement degrees of freedom. To obtain this result, fluid mesh must be compatible with the structural one. Namely, related nodes are set coincident. In the simulation environment, this happens along the minesweeper hull, in the submerged part. Mesh resulting in fluid and structure, and node positioning are shown in the YZ planar view of Figure 8. A sensitivity analysis is performed in order to analyse different conditions of grid size and time step, which does not request a consistent increase of the computational time but can be useful in the first phases of design. In Figure 9, a different type of mesh is shown, in which 4-nodes tetrahedral fluid elements, characterized by a 250 mm×250 mm×250 mm of size are chosen. In this case, considering that fluid nodes must be coincident with the structural ones, the mesh size of the ship is refined using 250 mm × 250 mm size MITC elements. Results of calculations will be reported also referring to this specific case.
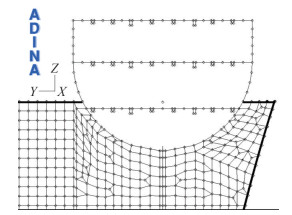 Figure 8 Fluid and structural mesh in YZ plane view
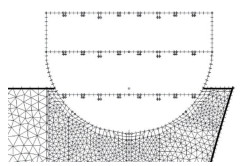 Figure 9 Fluid and structural mesh in YZ plane view-Refined model
Potential interfaces type inlet-outlet are placed on surfaces where shock and hydrostatic inputs of pressure are set respectively, assuming that the displacements of the boundary are not significant for the calculation. In addition, a free-surface boundary condition is considered on surfaces where atmospheric pressure is applied. In this case, the free surfaces show some displacements when the shock pressure moves. Rigid-wall boundary conditions are automatically imposed by the software on the other surfaces where no other boundary conditions are placed and where no structural interface elements are set. A slip condition of the fluid is assumed, without any tangential flow constriction. No potential interface elements are set on these walls.
A non-linear dynamic analysis is performed applying the implicit Bathe method time-integration (ADINA, 2015; Bathe, 2014), using a time step of 10−4 seconds, shown to be valid to assess the shock response of structures (Mannacio et al., 2021; Mannacio et al., 2022).
3.3 Full FSI approach: fluid modelled in CFD environment
The simulation is also carried out, performing calculations using the CFD routines of the ADINA environment, i.e. by applying the general Navier-Stokes equations. This full FSI approach requests the modelling of fluid in CFD environment, while structures are built in the FE simulator. Also, the FSI logic is different, considering that solid and fluid mesh are treated separately and then coupled by the solver, uploading step by step their coordinates.
In this model, the geometry of the problem and the choice of the mesh remain the same of the previous approximate FE model. And as before, a "slightly compressible" model of the fluid, in which density changes with pressure, is chosen, according to Eq. 6. However, unlike the approximate FE method, for the fluid Navier Stokes equations are numerically solved, as reported by the ADINATM manual (ADINA, 2015) and explained by Bathe (2014). These three equations express the conservation of masses, momentums and energy, and can be written in a fixed Cartesian coordinates frames, neglecting heat transfer contribute, as:
$$ \frac{\partial \rho}{\partial t}+\nabla \cdot(\rho \boldsymbol{v})=0 $$ (7) $$ \frac{\partial \rho \mathbf{v}}{\partial t}+\nabla \cdot(\rho \boldsymbol{v} \boldsymbol{v}-\boldsymbol{\tau})=\boldsymbol{f}^B $$ (8) $$ \frac{\partial \rho E}{\partial t}+\nabla \cdot(\rho \boldsymbol{v} E-\boldsymbol{\tau} \cdot \boldsymbol{v})=\boldsymbol{f}^B \cdot \boldsymbol{v} $$ (9) where ρ is the density of the fluid, t is the time, v is the velocity vector, τ is the stress tensor, f B is the body force vector of the fluid medium and E is the specific total energy.
The stress tensor and the specific total energy are expressed as follows:
$$ E=\frac{1}{2} \boldsymbol{v} \cdot \boldsymbol{v}+e $$ (10) $$ \boldsymbol{\tau}=(-p+\lambda \nabla \cdot \boldsymbol{v}) \boldsymbol{I}+2 \mathtt{μ} \boldsymbol{e} $$ (11) in which e is the specific internal energy, p is the pressure, λ and μ coefficients of fluid viscosity and e is the velocity strain tensor, defined as:
$$ \boldsymbol{e}=\frac{1}{2}\left(\nabla \mathbf{v}+\nabla \mathbf{v}^{\mathrm{T}}\right) $$ (12) However, different coordinate frames of reference must be applied. An Arbitrary-Lagrangian-Eulerian (ALE) approach is used to properly account for the deformations of the interface panels in the computational domain, caused by the fluid-structure interaction. The fluid flow is described by an arbitrary coordinate system to consider the fact that fix boundaries are described in a Eulerian system, while the deformed structures are in a Lagrangian system. Therefore, the Navier-Stokes equations discussed so far need to be rewritten in the ALE system. Details are reported in the software manual (ADINA, 2015). A transient analysis is performed, in which a dynamic implicit method, Runge-Kutta second order type, reported as "ADINA composite scheme" in the software environment (ADINA, 2015), is used. Detailed explanations about this integration method are given by Bathe and Zhang (1999). The default integration parameter $\alpha=1 / \sqrt{2}$ is chosen, following the guidelines reported in (ADINA, 2015), considering that this value is proven to give minimum truncation error for linear systems. This method has a second order accuracy and is unconditionally stable.
Structure and fluid model are built separately. Two fluid-structure interfaces are set respectively in the FE and the CFD environment, in which a no-slip condition of the fluid is assumed (ADINA, 2015). A two-way, fully coupled, FSI is performed, where the deformation of the solid influences the fluid flow and the fluid traction affects the structural deformations. A direct solution method, also called the simultaneous solution method, well-explained by Zhang and Bathe (2001), is used, where fluid equations and the solid ones are combined and treated in one matrix system, i.e. using a monolithic scheme. To solve the linearized equation of the coupled system, the Newton-Raphson method is performed (Zhang and Bathe, 2001). ALE boundary conditions are set on geometry. This means that displacements of boundary nodes defined on fluid-structure interface geometry are obtained using ALE formulation, solving Laplace equation (ADINA, 2015; Zhang and Bathe, 2001). Pressure loads are set as normal tractions in the same positions as those employed in finite element method shown in Figure 7. Also, free surfaces are set, where atmospheric pressure is imposed. Wall-boundaries are used on the other surfaces, in which a slip condition of the fluid is applied. This implies that the normal component of the velocity vector of the flow is prescribed to be zero, while the tangential components is left free.
Eight nodes 3-D ADINA-F fluid elements of 500 mm×500 mm×500 mm mesh size are used, defining a laminar material, in which sea water properties are set. In this full FSI analysis, each ADINA-F node requires four degrees of freedom, while each node in the interior of a potential-based mesh of the approximate FE method requires only one degree of freedom. Bulk modulus and fluid density are considered with the same values reported in section 3.2, but the water viscosity is added with a value of 8.9·10−4 Pa·s.
4 Results and comparison
The pressure of the shock wave is moving from the initial surface, where the input loading condition is set, to the section of ship. It hurts the ship, deviating its trajectory, until it reaches the free surface where hydrostatic pressure is imposed. Using this setting, problems of wave reflection caused by the opposite wall are avoided. In Figure 10 and Figure 11 the pressure trend along the fluid in the approximate FE and in the CFD environment of the full FSI approach at a significant time step is shown. It can be noted that in structural FE elements the positive peak of pressure is preceded by a negative one of reduced magnitude. A different behaviour is seen in full FSI calculation, where only the positive peak pressure is shown, when the shock wave is moving in the fluid.
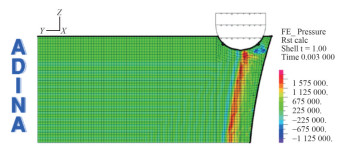 Figure 10 Shock wave pressure in approximate FE environment at time step 3 ms
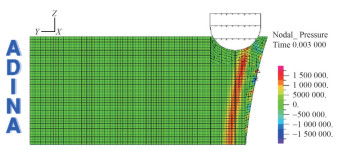 Figure 11 Shock wave pressure in CFD environment of the full FSI approach at time step 3 ms
In both cases, instead, as expected, this positive pressure is followed by a negative pressure. It depends on the fact that cavitation phenomenon is not modelled. This phenomenon is evident in the time histories comparison of the pressure on the fluid elements below the centre of the panel and close to the wall constraint (respectively position A and B in Figure 12). It can also be noted that background noise is higher in the approximate FE calculation than in the full FSI one. However, energy of the positive pressure peak of the full FSI calculation is similar to that of the approximate FE method, considering that in this last case a higher positive pressure is preceded by a negative one. In fact, the energetic contribution of these positive and negative peak pressure in approximate FE calculation is close to the positive one obtained by CFD results in full FSI method. In addition, it is shown that peak pressure is reduced from the wall (position "B") to the centre of the panel (position "A"), caused by the deformation of the structure itself. See Figures 13 and 14.
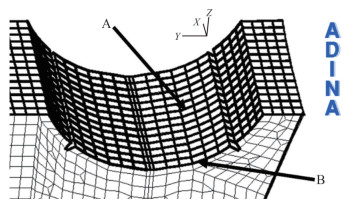 Figure 12 Pressure time histories elements in position "A" and "B" for comparison
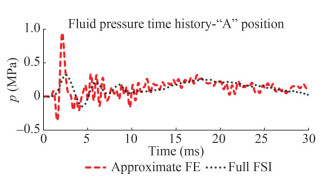 Figure 13 Approximate FE and full FSI fluid pressure time history comparison in the fluid element at the centre of the panel-"A" position
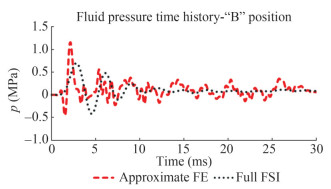 Figure 14 Approximate FE and full FSI fluid pressure time history comparison in the fluid element close to the wall constraint- "B" position
A sensitivity analysis has been performed on the approximate FE model to verify if the background noise can be numerically reduced in the pressure signal. However, reducing the mesh size to 50 mm×50 mm×50 mm and the time step to 10−5 seconds does not involve a major "cleanliness" of the signal. Same considerations can be done, if order of integration is increased, passing from eight-nodes to twentyseven-nodes volumetric elements for the fluid. No significative differences in the results are shown. In any case, the global effects on structures are less influenced by this phenomenon, as it can be seen in the strain comparison, described in the following text.
An example of strain calculation in transversal direction is shown in Figure 15, where the elements corresponding to the actual position of the strain gauges in the experimental test are highlighted. In Figures 16-18, the complete comparison in the time domain of the experimental and the numerical results obtained by approximate FE model and the full FSI model is reported. In addition, results are shown referring to a first model in which fluid (250 mm×250 mm× 250 mm) and structural (250 mm×250 mm) mesh size is reduced, as the one shown in Figure 9, named as Approximate FE Remesh model. A second approach is considered in which not only grid but also time step is reduced to 10−5 s. This last one is reported in the graphs as Approximate FE Refined model. The choice of reducing the mesh size does not provide a significant increase of the computational burden, as the 4-nodes tetrahedral fluid elements request less numerical effort than the 8-nodes cubic elements (ADINA, 2015). It can be noted that the numerical response is slower than the experimental one. In fact, the numerical pressure peak appears after the experimental one, and the decay is slower. It depends by the fact that in real phenomenon cavitation occurs, causing the faster response of the structure. In the numerical models, instead, only water is represented, slowing down the response of the structure. In addition, in the numerical results the maximum strain values are obtained at the centre of the panel, that is acceptable, considering that the hull keels and the bilge keels works as constraints for the platings. This behaviour is not shown in the real data, where it seems that all the panel behaves in the same way, as if the whole hull is responding as a single shell. This global behaviour is not represented in the numerical results, where only a block of the hull is modelled. The using of 4-nodes tetrahedral fluid elements, reducing mesh size, has shown to be a feasible approach for the first design phases, but it does not provide any significant increase in the accuracy of the results. The same considerations are valid when time step is reduced, but in this case the computational time increases slightly. Despite these considerations, the average percentage errors of numerical results referring to experimental data are satisfactory. In particular, the numerical error in percentage of the approximate FE is −22.6%, while the one of the full FSI method is −23.8 %.
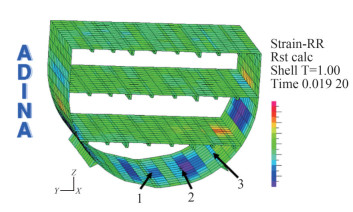 Figure 15 Example of transversal strain calculation-Elements corresponding to strain gauges setup
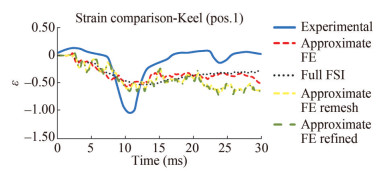 Figure 16 Numerical and experimental transversal strain comparison-Strain gauge 1
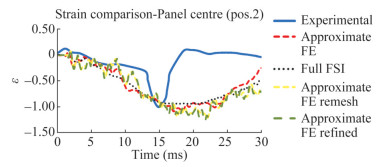 Figure 17 Numerical and experimental transversal strain comparison-Strain gauge 2
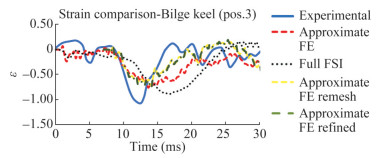 Figure 18 Numerical and experimental transversal strain comparison-Strain gauge 3
Calculations performed using combination full FSI model and the approximate FE one provide similar results, showing differences lower than 2% in the maximum strain calculation, as reported in Table 4. In addition, the transversal strains follow the same trend. As it happens in the pressure comparison, the signal of the approximate FE model strain has a higher noise than the full FSI one. However, this phenomenon is negligible, considering that both methods provide very close results.
5 Conclusions
A numerical method, fully developed in the FE environment, has been built to predict the effects of non-contact underwater explosion on a minesweeper. As a summary, FSI has been approximated, modelling water using special 3-D potential-based fluid elements, available in the structural part of the FE software ADINATM. A typical section of minesweeper has been modelled, constrained at its edges, in which the E-glass biaxial polyester resin materials are characterized with their orthotropic behaviour. The shock wave pressure, known in position and magnitude from experimental data, has been applied on the hull surface in the FE model. The equivalent explosion scenario of a real test has been simulated, realizing a slice of sea water, and including free-surface and hydrostatic pressure effects. Calculation has been performed twice, using both the approximation of only finite element simulation (approximate FE) and the fully coupled CFD+FE=FSI method. A sensitivity analysis has been performed in order to analyse different conditions of grid size and time step, which can be useful in an early phase of design. The numerical structural response of a keel panel has been compared for both methods with experimental results.
The comparison shows a satisfactory result, despite all the approximation in modelling. Only the peak pressure of the shock wave is considered, neglecting effect of the gas bubble pulse. In addition, only water is modelled, without considering cavitation phenomena. While the gas bubble pulse provides mainly a global effect, appearing late in time, with negligible influence on the panel response, the effects of neglecting cavitation are evident. In the transversal strain time histories comparison, a slower response of the structure is shown referring to the numerical results with respect to the experimental ones. Also, cavitation has a negative effect on structures, therefore test results are higher in absolute values compared to the finite element ones. However, a relatively low error is obtained in the comparison of maximum values of strain.
The choice of using 3-D potential-based fluid elements involves some approximations, considering the medium as inviscid, irrotational, with no heat transfer, slightly compressible, and relatively small displacements of the fluid boundary. In any case, the same calculation is performed, using the full FSI approach, showing a negligible difference in the results. Only a slight increment of numerical noise in the approximate FE signal is reported, while the computational efforts are reduced.
In an early phase of design, the full FSI method is computer demanding, extremely complex to set, and often not suitable for the purpose. Therefore, the relatively straightforward and cost-effective approximate FE model proposed in this paper, validated by experimental data, demonstrates to be useful for the designer in order to obtain a satisfactory approximation of the effects of non-contact underwater explosion on board composite minesweepers. The choice of not including bubble pulsation in the simulation in terms of pressure variation only allows for computational burden reduction and appears to be still suitable for design purposes. At least in the initial phases of the design process. Cavitation effects and their simulation will be also object for future works, using more refined methods, such as Volume of Fluid methods, reducing the approximations, but at the same time increasing of the computational burden. The same considerations are valid for the water jets effects. More refined explicit CFD methods are necessary to perform these specific calculations.
Competing interest The authors have no competing interests to declare that are relevant to the content of this article. -
Figure 1 Shock test geometry (MARIPERMAN, 1988)
Figure 2 Experimental and analytical pressure time history measured by S2 sensor
Figure 3 Monoaxial strain gauges setup in midship section-frontal view (Mariperman, 1988)
Figure 4 130 kg TNT charge (MARIPERMAN, 1988)
Figure 5 Underwater shock test explosion (MARIPERMAN, 1988)
Figure 6 Midship section in finite element environment
Figure 7 Complete fluid-structure model with prescribed pressures
Figure 8 Fluid and structural mesh in YZ plane view
Figure 9 Fluid and structural mesh in YZ plane view-Refined model
Figure 10 Shock wave pressure in approximate FE environment at time step 3 ms
Figure 11 Shock wave pressure in CFD environment of the full FSI approach at time step 3 ms
Figure 12 Pressure time histories elements in position "A" and "B" for comparison
Figure 13 Approximate FE and full FSI fluid pressure time history comparison in the fluid element at the centre of the panel-"A" position
Figure 14 Approximate FE and full FSI fluid pressure time history comparison in the fluid element close to the wall constraint- "B" position
Figure 15 Example of transversal strain calculation-Elements corresponding to strain gauges setup
Figure 16 Numerical and experimental transversal strain comparison-Strain gauge 1
Figure 17 Numerical and experimental transversal strain comparison-Strain gauge 2
Figure 18 Numerical and experimental transversal strain comparison-Strain gauge 3
Table 1 Coefficients in peak pressure and angle decay formulas
Equation K α Pmax 52.4 1.13 θ 92.5 −0.22 Table 2 Composite material properties proposed by Smith (1990)
Material Fibre volume fraction, Vf Density(kg/m3) Young's modulus E (GPa) Poisson modulus [ν] Shear modulus(GPa) Tensile strength (MPa) Comp. strength(MPa) Shear strength(MPa) E-glass polyester(balanced WR) 0.34 1 700 15 0.2 3.5 250 210 100 Table 3 Orthotropic composite material properties used as input of the calculation
EL(GPa) ET(GPa) EN(GPa) GLT(GPa) GLN(GPa) GTN(GPa) νLT νLN νTN 15 15 10 4.5 3.6 3.6 0.2 0.4 0.4 -
ADINA (2015) Theory and Modeling Guide, Volumes Ⅰ-Ⅲ. ADINA R & D, Inc. Watertown Arora H, Hooper P, Dear J (2012) The effects of air and underwater blast on composite sandwich panels and tubular laminate structures. Experimental Mechanics 52(1): 59-81. https://doi.org/10.1007/s11340-011-9506-z Barrè S, Chotard T, Benzeggagh ML (1996) Comparative study of strain rate effects on mechanical properties of glass fibre reinforced thermoset matrix composites. Composites Part A 27A: 1169-1181. https://doi.org/10.1016/1359-835X(96)00075-9 Bathe KJ (2014) Finite element procedures. Bathe KJ. Watertown Bathe KJ, Zhang H, Ji S (1999) Finite element analysis of fluid flows fully coupled with structural interactions. Computers & Structures 72: 1-16. https://doi.org/10.1016/S0045-7949(99)00042-5 Batra RC, Hassan NM (2007) Response of fiber reinforced composites to underwater explosive loads. Composites Part B 38: 448-468. https://doi.org/10.1016/j.compositesb.2006.09.001 Clough RW, Penzien J (1995) Dynamics of structures. Computer & Structures inc. Berkeley Cole RH (1914) Underwater explosions. Woods Hole Oceanographic Institution Costanzo FA (2010) Underwater Explosion Phenomena and Shock Physics. Society for Experimental Mechanics Inc Dvorkin E, Bathe KJ (1984) A continuum mechanics based four-node shell element for general nonlinear Analysis. Engineering Computations Vol. 1: 77-88. https://doi.org/10.1108/eb023562 Ewins DJ (2000) Modal Testing: Theory, Practice and Application. Research Studies Press LTD, Hertfordshire Felippa CA, DeRuntz JA (1991) Acoustic fluid volume modeling by the displacement potential formulation, with emphasis on the wedge element. Computers & Structures 41(4): 669-686. https://doi.org/10.1016/0045-7949(91)90179-P Gaiotti M, Rizzo CM (2013) Finite element modeling strategies for sandwich composite laminates under compressive loadings. Ocean Engineering 63: 44-51. https://doi.org/10.1016/j.oceaneng.2013.01.031 Gaiotti M, Rizzo CM, Branner K, Berring P (2014) A high order Mixed Interpolation Tensorial Components (MITC) shell element approach for modeling the buckling behavior of delaminated composites. Composite Structures 108: 657-666. https://doi.org/10.1016/j.compstruct.2013.10.003 Gannon L (2019) Simulation of underwater explosions in close-proximity to a submerged cylinder and a free-surface or rigid boundary. Journal of Fluids and Structures 87: 189-205. https://doi.org/10.1016/j.jfluidstructs.2019.03.019 Geers TL (1978) Doubly asymptotic approximation for transient motions of submerged structures. J. Acoust. Soc. Am. 64(5): 1500-8. https://doi.org/10.1121/1.382093 Geers TL (1971) Residual potential and approximate method for three-dimensional fluid structure interaction problems. J. Acoust. Soc. Am. 49 (5, Part 2): 1505-10. https://doi.org/10.1121/1.1912526 Geers TL, Hunter KS (2002) An integrated wave-effects model for an underwater explosion bubble. Acoustical Society of America. https://doi.org/10.1121/1.1458590 Gong Y, Zhang W, Du Z (2023) Damage mechanisms of a typical simplified hull girder with thinner plates subjected to near-field underwater explosions. Ocean Engineering 285(2): 115403. https://doi.org/10.1016/j.oceaneng.2023.115403 Green Associates E (1999) Marine Composites. Eric Greene Associates Halpin JC, Nicolais L (1971) Materiali compositi: relazioni tra proprietà e struttura. Ingegnere Chimico Italiano Keil AH (1961) The Response of Ships to Underwater Explosions. Society of Naval Architects and Marine Engineers Kong X, Gao H, Jin Z, Zheng C, Wang Y (2023) Predictions of the responses of stiffened plates subjected to underwater explosion based on machine learning. Ocean Engineering 283: 115216. https://doi.org/10.1016/j.oceaneng.2023.115216 Latourte F, Gregoire D, Zenkert D, Wei X, Espinosa HD (2011) Failure mechanisms in composite panels subjected to under water impulsive loads. J. Mech. Phys. Solids. https://doi.org/10.1016/j.jmps.2011.04.013 LeBlanc J, Shukla A (2010) Dynamic response and damage evolution in composite material subjected to underwater loading: experimental and computational comparisons. Composite Structures 92: 2421-2430. https://doi.org/10.1016/j.compstruct.2010.02.017 Li L, Airaudo FN, Löhner R (2023) Study of underwater explosion near rigid cylinder column with numerical method. Ocean Engineering 270: 113294. https://doi.org/10.1016/j.oceaneng.2022.113294 Liang C, Tai Y (2006) Shock responses of a surface ship subjected to noncontact underwater explosions. Ocean Engineering 33: 748-772. https://doi.org/10.1016/j.oceaneng.2005.03.011 Mannacio F (2023) The effect of underwater explosion on a mine countermeasures vessel: structural response and material design. PhD Thesis. University of Genoa Mannacio F, Barbato A, Gaiotti M, Rizzo CM, Venturini M (2021) Analysis of the underwater explosion shock effects on a typical naval ship foundation structure: experimental and numerical investigation. MARSTRUCT 2021 Congress. 7-9 June 2021. Trondheim. https://doi.org/10.1201/9781003230373-8 Mannacio F, Barbato A, Di Marzo F, Gaiotti M, Rizzo CM, Venturini M (2022) Shock effects of underwater explosion on naval ship foundations: Validation of numerical models by dedicated tests. Ocean Engineering 253 111290. https://doi.org/10.1016/j.oceaneng.2022.111290 Mair HU (1999) Benchmarks for submerged structure response to underwater explosions. Shock and Vibration 6: 169-181 https://doi.org/10.1155/1999/743708 Mariperman (1988) Relazione n. 02747. Commissione Permanente per gli Esperimenti del Materiale da Guerra, La Spezia ME'scope VES (2014) Tutorial Manual. Volume IA. Vibrant Technology, Inc. Scotts Valley. MIL-S-901-D (1989) Shock tests, h. i. (high-impact) shipboard machinery, equipment, and systems, requirements. United States Department of Defense Ming FR, Zhang AM, Xue YZ, Wang SP (2016). Damage characteristics of ship structures subjected to shockwaves of underwater contact explosions. Ocean Engineering 117: 359-38. https://doi.org/10.1016/j.oceaneng.2016.03.040 NAV-30-A001 (1986) Norme per l'esecuzione delle prove d'urto su macchinari ed apparecchiature di bordo. Ministero della Difesa, Istituto Poligrafico dello Stato NAVSEA 0908-LP-000-3010, Rev. 1 (1995) Shock Design Criteria for Surface Ships. Naval Sea Systems Command Petralia S (2000) Compendio di esplosivistica. MARIPERMAN. La Spezia Scavuzzo RJ, Pusey HC (2002) Naval Shock Analysis and Design. The Shock and Vibration Analysis Center. HI-TEST Laboratories Inc Smith C. S (1990) Design of Marine Structures in Composite Materials. Elsevier, Applied Science SMM/CN 300 DVD (1978) Criteri e metodi per il proporzionamento e la qualificazione antiurto dei componenti destinati alle Unità navali. Stato Maggiore Marina. Istituto Poligrafico dello Stato Sommerfeld M, Müller HM (1988) Experimental and numerical studies of shock wave focusing in water. Experiments in Fluids 6: 209-216. https://doi.org/10.1007/BF00230733 STANAG 4141 (1976) Shock testing of equipment for surface ships. NATO Standardization Agreement Sussman T, Sundqvist J (2003) Fluid-structure interaction analysis with a subsonic potential-based fluid formulation. Computers & Structures Vol. 81; 949-962. https://doi.org/10.1016/S0045-7949(02)00407-8 Swisdak Jr MM (1978) Explosion effects and properties. Part Ⅱ. Explosion effects in water. Naval Surface Weapons Center White Oak Lab Silver Spring Md Szturomski B (2015) The effect of an underwater explosion on a ship. Scientific Journal of Polish Naval Academy. https://doi.org/10.5604/0860889X.1172074 Tran P, Wua C, Saleh M, Neto LB, Nguyen-Xuan H, Ferreira AJM (2021) Composite structures subjected to underwater explosive loadings: a comprehensive review. Composite Structures 263 113684. https://doi.org/10.1016/j.compstruct.2021.113684 Vannucchi de Camargo F (2019) Survey on Experimental and Numerical Approaches to Model Underwater Explosions. Journal of Marine Science and Engineering. https://doi.org/10.3390/jmse7010015 Wei X, Tran P, De Vaucorbeil A, Ramaswamy RB, Latourte F, Espinosa HD (2013) Three-dimensional numerical modeling of composite panels subjected to underwater blast. Journal of the Mechanics and Physics of Solids 61: 1319-1336. https://doi.org/10.1016/j.jmps.2013.02.007 Welsh L, Harding J (1985) Effect of strain rate on the tensile failure of woven reinforced polyester resin composites. Journal de Physique Colloques 46(C5): 405-414. https://doi.org/10.1051/jphyscol:1985551 Zhang A, Shi-Min L, Pu C, Shuai L, Yun-Long L (2023) A unified theory for bubble dynamics. Physics of Fluids: 35(3): 033323. https://doi.org/10.1063/5.0145415 Zhang H, Bathe KJ (2001) Direct and Iterative Computing of Fluid Flows fully Coupled with Structures. Computational Fluid and Solid Mechanics. KJ Bathe. Elsevier Science Zhang Y, Liu L, Wang J, Tang K, Ma T (2022) Study on the impact characteristics of underwater explosion bubble jets induced by plate structure. Ocean Engineering 266: 112641. https://doi.org/10.1016/j.oceaneng.2022.11264 Zong Z, Zhao Y, Li H (2013) A numerical study of whole ship structural damage resulting from close-in underwater explosion shock. Marine Structures 31: 24-43. https://doi.org/10.1016/j.marstruc.2013.01.004
