
Characterization of Underwater Explosive Loads of Blasting and Shaped Charges
https://doi.org/10.1007/s11804-024-00422-5
-
Abstract
Blasting and shaped charges are the main forms of underwater weapons, and their near-field underwater explosions (UNDEX) can severely damage structures. Therefore, it is of great importance to study underwater explosive load characteristics of different forms of charges. The full physical process of a typical underwater explosion of a sphere/column blasting charge and a shaped charge was simulated using the Eulerian method. The loading characteristics of the underwater blast shock wave and bubble, as well as the projectile, were studied. The results show that the shock wave loads of spherical, cylindrical, and polygonal charges propagate outward in spherical, ellipsoidal-spherical and ellipsoidal-spherical wavefronts, respectively. When the shock wave reaches 16 times the distance-to-diameter ratio, its surface is approximately spherical. In addition, in the shaped charge underwater explosion, the shaped charge liner cover absorbs 30°–90° of the shock wave energy and some of the bubble energy to form a high-speed shaped penetrator. Spherical, ellipsoidal, and ellipsoidal bubbles are generated by underwater explosions of spherical, cylindrical, and shaped charges, respectively. The obtained results provide a reference for evaluating the power of underwater weapons.-
Keywords:
- Blasting charge ·
- Shaped charge ·
- Load characteristics ·
- Shock wave ·
- Bubble
Article Highlights● The full physical process of a shaped charge associated with UNDEX was investigated.● The loading characteristics of the shock wave, projectile and bubble were studied.● The liner absorbs the shock wave energy of 30°-90° and some of the bubble energy, and a shaped projectile is consequently formed. -
1 Introduction
Blasting and shaped charges are mainly used to design underwater weapons. A strong intermittent shock wave (Tatlısuluoğlu and Beji, 2021) and long-lived bubble (Li et al., 2023; Zhang et al., 2023a) are generated during the process of the underwater explosion of a blasting charge. For a shaped charge, in addition to the above two loads, a high-speed shaped penetrator (Zhang et al., 2022) is also produced in the process of its underwater explosion, which can cause different modes of damage to targets. Therefore, load characteristics must be investigated to assess the power of underwater weapons (Huang et al., 2022).
Current studies on shock waves (Wang et al., 2022; Zhang et al., 2012; Zhou et al., 2012) and bubble loads (Han et al., 2022; Cui et al., 2018) generated by UNDEX (Emamzadeh, 2022) of blasting charges are listed as follows. Hung and Hwangfu (2010) conducted an experimental study of the behavior of underwater explosive bubbles near various boundaries. Daramizadeh and Ansari (2015) numerically studied the interaction of excitation waves with gas-liquid two-phase flow interfaces and the dynamic generation and evolution of volumetric cavitation under free surfaces. The above scholars have investigated the explosive load characteristics of explosives underwater, laying a theoretical foundation for subsequent research.
Liang et al. (2016) used the Eulerian method to simulate the explosion process of a 50 g trinitrotoluene (TNT) spherical charge packet in a water depth range of 100–2 000 m. Underwater blast shock wave pressure decay processes and bubble pulsation processes were obtained. Shi et al. (2020) used the Eulerian method to obtain pressure time-range curves at multiple distances inside a water surge tube with different shell thicknesses. The above scholars combined numerical and experimental methods to verify that the Eulerian method has good reliability in simulating shock wave loads during underwater explosions. However, high-speed-shaped charge projectiles and bubble loads were ignored.
Zhang et al. (2019) used a hybrid algorithm based on smoothed particle hydrodynamics (SPH) (Wang et al., 2019) and the boundary element method (Liu et al., 2023) to simulate the entire process of free and near-field UNDEX, and its feasibility and applicability were verified through comparison with the experimental data. Zhang et al. (2015) developed a numerical model of bubble jet–wall coupling under the potential flow assumption. The boundary integral method was used to perform the calculations. By combining simulation and experiment, the above scholars verified the accuracy of the Eulerian method in modeling the process of underwater explosion bubbles. However, few papers about underwater explosions associated with shaped charges have been published.
In terms of underwater explosive shock wave loading of shaped charges, Wang et al. (2017; 2018) experimentally and numerically researched shock wave loading patterns and structural damage. It is found that a strong pressure disturbance occurs in the aqueous medium at the front of the intruder, and aggregate charges can severely damage structures. Ma et al. (2019) experimentally and numerically studied the shock waves and intruder loads generated during the underwater explosion of a polymer charge. The difference in damage to water-bedded composite targets by combatants with and without shaped charge liners and the destructive effects of shock waves and polymer intruders were analyzed. These scholars discussed the characteristics of shock wave loads and intruder loads generated by the underwater explosion of a polymer charge. However, few studies on the loading characteristics of shock waves, penetrators, and bubbles in UNDEX with polymer charges have been published despite being of great importance for increasing the power of underwater weapons.
To study the loading characteristics of typical sphere/column blasting and shaped charges, this paper adopted the Eulerian method to establish a numerical model of an underwater explosion. Comparative analyses of the shock wave, bubble, and penetrator loading characteristics of UNDEX (Zong et al., 2012) with three charge types were conducted. For underwater blast shock wave loading, the time–history curve P(t), peak pressure Pm, decay constant θ, and specific shock wave energy Es were analyzed. Forbubble loading, the bubble pulsation period Tb, maximum radius Rb, expansion and contraction rate of the bubble boundary V, and specific bubble energy Eb were discussed. As for the UNDEX of shaped charges, in addition to shock waves and bubbles, the load characteristics of shaped penetrators were also discussed. The structure of its energy output for various loads was given, and the source of the kinetic energy of the penetrator was obtained.
2 Theory of UNDEX
Shock wave and bubble energies are generated by an underwater explosion of a blasting charge. Notably, projectile kinetic energy is observed during an underwater explosion of a shaped charge. To make the results more scientific, specific shock wave and bubble energies are defined as shock wave energy and bubble energy per unit mass, respectively. For bubble load, the feature parameters include the bubble pulsation period Tb, the maximum radius Rb, the bubble boundary expansion and contraction velocity V, and the specific bubble energy Eb. For shock wave load, the feature parameters include the evolution of pressure P(t), the peak pressure Pm, the decay constant θ, and the specific shock wave energy Es. To assess warhead power, the above key parameters of the shock wave and bubble loads of an underwater explosion of a blasting charge must be analyzed. For shaped charges, another energy—projectile kinetic energy—should also be considered because it can cause local damage to underwater structures. However, few studies about the relationships among these three loads have been published. It is of great importance to investigate the energy output characteristics of underwater explosions associated with shaped charges.
2.1 Bubble theory
The phenomenon of bubble pulsation is observed after a charge is exploded underwater. Based on the initial shape of the bubble boundary surface and the initial distribution of pressure and velocity, the exact solution for the bubble and the surrounding water medium is obtained with the help of the basic kinetic equations.
The present unified theory of bubble dynamics is based on Equation (1), which describes the oscillations of migrating bubbles. The basic equations of the unified bubble kinetic theory are derived from the fundamental conservation laws, expressed as (Zhang et al., 2023b):
$$ \left(\frac{C-\dot{R}}{R}+\frac{\mathrm{d}}{\mathrm{d} t}\right)\left(\frac{R}{C-\dot{R}} \frac{\mathrm{d} F}{\mathrm{~d} t}\right)=2 R \dot{R}^2+R^2 \ddot{R} $$ (1) Dynamic boundary conditions are introduced into Equation (1). The bubble vibration equation is derived. During the bubble oscillation, the deformation of fluid particles provides extra viscous stress components. Equation (2) applies to various settings, including multiple-bubble interaction and bubble dynamics near boundaries.
$$ \left(\frac{C-\dot{R}}{R}+\frac{\mathrm{d}}{\mathrm{d} t}\right)\left[\frac{R^2}{C}\left(\frac{1}{2} \dot{R}^2+\frac{1}{4} v^2+H\right)\right]=2 R \dot{R}^2+R^2 \ddot{R} $$ (2) The unified bubble theory (Zhang equation) unifies the Rayleigh–Plesset equation, the Gilmore equation, and the Keller–Miksis equation.
The maximum radius of bubble expansion and the period of bubble pulsation (Cole and Weller, 1948) are respectively written as:
$$ R_{\mathrm{m}}=3.38\left(\frac{W_0}{H_0+10}\right)^{1 /3} $$ (3) $$ T=0.308 \frac{W_0{ }^{1 /3}}{\left(1.03\left(1+0.1 H_0\right)\right)^{5 /6}} $$ (4) where Rm is the maximum radius of bubble expansion (m), T is the bubble pulsation period (s), W0 is the mass of the charge (kg), and H0 is the initial depth of the explosive center of the charge (m).
The specific bubble energy Eb is defined as the bubble energy wave energy per unit mass. Eb is a key parameter for characterizing the shock wave load of an underwater explosion, given by (Bjarnholt, 1980):
$$ E_{\mathrm{b}}=0.683\;9 \frac{T^3 P_0^{5 /2}}{W_0 \rho_0^{3 /2}} $$ (5) where T is the bubble pulsation period (s), P0 is the hydrostatic pressure of the charge at the depth of the water (Pa), W0 is the mass of the charge (kg), and ρ0 is the density ofwater (kg/m3).
2.2 Bubble-induced pressure fields
A shock wave is characterized by extremely high pressure and duration on the order of milliseconds. To verify the accuracy of the numerical results for shock wave load, the theoretical formula obtained by Zhang and Zamyshlyayev is used. The equations of motion of the bubble are solved. The velocity and pressure fields due to the bubble can be calculated. The Bernoulli equation at any position r is given by (Zhang et al., 2023b):
$$ \frac{\partial \varphi}{\partial t}+\frac{1}{2}\left(|\boldsymbol{u}|^2-\left|\boldsymbol{u}_{\mathrm{a}}\right|^2\right)+\frac{p-P_{\mathrm{a}}}{\rho}=0 $$ (6) Substituting the relevant equations into Equation (6) and neglecting the ambient velocity ua yields the formula for the pressure at r as (Zhang et al., 2023b):
$$ \begin{aligned} & p(\boldsymbol{r}, t)= \\ & P_{\mathrm{a}}+\left.\rho\left\{\begin{array}{l} \frac{R}{|\boldsymbol{r}|}\left(H+\frac{1}{2} \dot{R}^2\right) \\ -\frac{1}{2} \frac{R^2}{|\boldsymbol{r}|^4}\left[R \dot{R}+\frac{|\boldsymbol{r}|-R}{C}\left(H+\frac{1}{2} \dot{R}^2\right)\right]^2 \end{array}\right\}\right|_{\left(R, t-\frac{|r|-R}{C}\right)} \\ & \end{aligned} $$ (7) The corresponding equation for degradation in incompressible fluids is expressed as (Zhang et al., 2023b):
$$ p(r, t)=-\rho \frac{R^4 \dot{R}^2}{2|r|^4}+\rho \frac{2 R \dot{R}^2+R^2 \ddot{R}}{|r|}+P_{\mathrm{a}} $$ (8) In addition to the bubble, the shock wave is an important part of the physical process of an underwater explosion. Appendix B1 contains the method for calculating the near-field shock wave (Zhang et al., 2023b). The empirical formula obtained by Zamyshlyayev is used, expressed as (Zamyshlyaev, 1973):
$$ P_m= \begin{cases}4.41 \times 10^7\left(\frac{W_0^{1 /3}}{R}\right)^{1.5} & 6 \leqslant \frac{R}{R_0}<12 \\ 5.24 \times 10^7\left(\frac{W_0^{1 /3}}{R}\right)^{1.13} & 12 \leqslant \frac{R}{R_0}<240\end{cases} $$ (9) where W0 is the mass of the charge (kg), R is the distance from the center of the explosion to the observation point(m), R0 is the initial radius of the charge (m), r is the distance-to-diameter ratio (DDR), and c is the speed of sound in water (m/s).
The specific shock wave energy is defined as the shock wave energy per unit mass, which is a main parameter for characterizing the shock wave load of an underwater explosion, given by (Bjarnholt, 1980):
$$ E_{\mathrm{s}}(R)=\frac{4 \pi R^2}{W_0 \rho_0 c} \int_0^t p^2(t) \mathrm{dt} $$ (10) where p(t)is the shock wave pressure (Pa), t is the upper limit of integration, taking 6.7θ, θ is a time constant, time elapses from peak pressure Pm to pressure Pm/e(s), and e is the Euler number.
2.3 Numerical theory
2.3.1 Equation of state (EoS)
(1) EoS of water
Hydrostatic pressure must be considered in the numerical calculations. Therefore, a polynomial EoS is utilized. It has several analytic forms for states of compression and tension and is a generalization of the Mie–Gruneisen form of the EoS. The specific parameters are listed in Table 1. The polynomial EoS is given by (USA, 2003):
Table 1 Main parameters of the EoS for waterρ0(g/cm3) A1(GPa) A2(GPa) A3(GPa) B0 B1 T1(GPa) T2(GPa) 1.00 2.20 9.54 14.57 0.28 0.28 2.20 0.00 Compression state:
$$ p=A_1 u+A_2 u^2+A_3 u^3+\left(B_0+B_1 u\right) \rho_0 e_0, u>0 $$ (11) Tension state:
$$ p=T_1 u+T_2 u+B_0 \rho_0 e_0, u<0 $$ (12) where $u=\frac{\rho}{\rho_0}-1$, and e is the internal energy per unit mass.A1, A2, A3, B0, B1, T1, and T2 are material constants in Table 1.
To simulate shock wave loads as well as bubble pulsation loads at different blast depths, the specific internal energy of water is altered. The water pressure is calculated using the following formula:
$$ e_0=\frac{P_0}{\rho_0 B_0} $$ (13) $$ P_0=\rho_0 g H_0+P_{\mathrm{atm}} $$ (14) where P0 is the hydrostatic pressure of the charge at the depth of the water (Pa), Patm is the standard atmospheric pressure (Pa), and H0 is the initial depth of the explosive center of the charge (m). To simulate a shock wave and bubble load in deep water environments, the water depth H0 is chosen to be 100 m in this paper, and the specificinternal energy is e0 = 3.862×10³ kJ/kg.
(2) EoS of air
The ideal gas equation is used to simulate air. The EoS for an ideal polytropic gas, which may be utilized in many applications involving gas motion, is one of the most basic types. This EoS may be deduced from Boyle and Gay-Lussac's laws and phrased as follows:
$$ P_{\text {air }}=(\gamma-1) \rho_{\text {air }} e_{\text {air }} $$ (15) where Pair is the air pressure (Pa), ρair is the air density (kg/m3), the adiabatic exponent γ = 1.4, and the specific internal energy eair = 2.068×10⁵ kJ/kg.
(3) EoS of detonation products
Jones, Wilkins, and Lee (JWL) proposed the JWL EoS, which characterizes the detonation product expansion down to a pressure of 1 kbar for high-energy explosive materials. The form of the JWL equation is displayed below:
$$ p_e=A_4\left(1-\frac{\omega}{R_1 \bar{V}}\right) \mathrm{e}^{-R_1 \bar{V}}+B_2\left(1-\frac{\omega}{R_2 \bar{V}}\right) \mathrm{e}^{-R_2 \bar{V}}+\frac{\omega_1 E}{\bar{V}} $$ (16) where V = ρb0/ρb, ρb, ρb0 are the density of the blast products and the initial density (kg/m3), respectively. E is the internal energy per unit volume of charge (GJ/m3), A4, B2, R2, R3, and w1 are material constants whose values aredetermined according to specific experiments, e is the Euler number, and pe is the burst product pressure (Pa). The density of the charges (cyclotetramethylene tetranitramine, HMX) and TNT are 1 891 kg/m3 and 1 630 kg/m3, respectively, and the main parameters of their JWL equations are shown in Table 2.
Table 2 Main parameters of the JWL equationCharge A4(GPa) B2(GPa) R2 R3 ω1 DCJ(m/s) E(GJ/m3) PCJ(GPa) HMX 778.28 7.07 4.20 1.00 0.30 9 110 10.50 42.00 TNT 371.20 3.23 4.15 0.95 0.30 6 930 7.00 21.00 2.3.2 Material model
The metal liner is a key component of a shaped charge. It is often made of purple copper (CU-OFHC). Its EoS and strength model are chosen as linear and Johnson–Cook (J–C), respectively. The J–C strength model is ideally suited for simulating the strength limits and failure processes of metallic materials at high temperatures caused by rapid impact or explosive shock, expressed as:
$$ Y_0=\left(A_5+B_3 \varepsilon_{\mathrm{p}}{ }^n\right)\left(1+C \ln \varepsilon_{\mathrm{p}}^*\right)\left(1-T_{\mathrm{H}}{ }^{m_2}\right) $$ (17) where εp is the effective plastic strain, and εp* is the normalized effective plastic strain rate. TH is the homologous temperature (K), and TH = (T-Troom)/(Tmelt-Troom). A5, B3, m2, C, and n are the basic yield stress, hardening constant, thermal softening index, strain rate constant, and hardening index, respectively. The expression in the first pair of brackets gives the stress as a function of strain when εp* = 1.0 sec-1 and TH = 0 (i.e., for laboratory tests at room temperature). The formulas in the second set of brackets show how strain rate affects the material's yield strength. The plastic strain rate augmentation is normalized using the reference strain rate against which the material data were measured. By default, 1.0/second is employed. The formula in the third pair of brackets describes thermal softening, which causes the yield stress to drop to zero at Tmelt, the melting temperature. The specific values are shown in Table 3.
Table 3 Main parameters of the J–C model for CU-OFHCA5(GPa) B3(GPa) m2 C n Tm(K) 0 0.292 1.09 0.025 0.31 1 356 3 Load characteristics of UNDEX of different types of charges
3.1 Numerical model
To explore the difference between spherical, cylindrical, and shaped charges subjected to underwater explosion, the cases were set as shown in Table 4. The radius of the spherical charge is 14 mm. The height and diameter of the cylindrical charge are 40 mm and 20 mm, respectively. Both charge masses are 21.7 g. To study the energy output structure for the shaped charge subjected to an underwater explosion, a two-dimensional axisymmetric model of an underwater explosion of a shaped charge was established in Figure 1. The charge height L1 is 40 mm. The length L2 of the air cavity is 30 mm. The charge radius CR is 10 mm. The liner is made of copper and designed with variable thickness. The inner and outer diameter centers are (47.00, 0.00) and (50.18, 0.00), respectively. The inner and outer diameters are R4 = 12.20 mm and R5 = 13.99 mm, respectively. The location of the detonation point is (0.00, 0.00). The DDR of the measuring points on the circle with a radius of 1/2/3/4 corresponds to 7/10/13/16 times the DDR, respectively, which are arranged every 30° between 0° and 180° in Figure 1.
Table 4 Case settingCases Charge types Sphere Column Shaped 1 √ 2 √ 3 √  Figure 1 Numerical simulation model
3.2 Numerical validation
This paper focuses on analyzing shock wave load and bubble load caused by an underwater explosion. To validate the numerical model, the numerical results for the peak pressure of the shock wave and the period, radius, and shape of the bubble are compared with the theoretical sections. In addition, a convergence analysis was conducted, and different mesh sizes were selected to simulate underwater explosions. First, the pressure measuring points were set at different DDR values. The values of the overpressure peak are compared between the Zamyshlyayev and Zhang equations in Table 5. The maximum relative error does not exceed 8%. This result shows the reliability of the Zhang equation in calculating the shock wave overpressure peak. The comparison results are illustrated in Figure 2. Within DDRs of 6 to 16, the maximum error of the results for a grid size of 0.20 mm×0.20 mm does not exceed 10% compared to the results of the Zhang and Zamyshlyayev equations. Second, the accuracy of the numerical method in the period, radius, and shape of the bubble is verified. The numerical simulation results are compared with the theoretical value of the Geers–Hunter equation (Geers and Hunter, 2002) and the Zhang equation (Zhang et al., 2023b). Moreover, in Figures 3 and 4, the bubble shape is compared with that of 55 g TNT in the experiment (Klaseboer et al., 2005) of 3.5 m water depth.
Table 5(a) Relative error of the overpressure peak (Zamyshlyaev, 1973)DDR Numerical(MPa) ZM(MPa) Relative error (%) 8 163.4 161.59 1.12% 10 117.8 115.63 1.88% 12 90.3 88.15 2.44% 14 72.3 74.05 -2.36% 16 59.8 63.68 -6.09% 18 50.7 55.75 -9.06% 20 43.9 49.49 -11.30% 5(b) Relative error of the overpressure peak (Zhang et al., 2023b)DDR Numerical(MPa) ZM(MPa) Relative error (%) 8 163.4 169.74 -3.74% 10 117.8 118.38 -0.49% 12 90.3 94.32 -4.26% 14 72.3 77.31 -6.48% 16 59.8 65.76 -9.06% 18 50.7 56.88 -10.86% 20 43.9 50.13 -12.43%  Figure 2 Shock wave overpressure peaks at different grid densities and distance ratios (Zamyshlyaev, 1973; Zhang et al., 2023b)
 Figure 4 Comparison of the experimental data (Klaseboer et al., 2005) and the numerical simulation of bubble shape
In terms of shock wave load, the error increases with increasing grid size when the DDR is unchanged. The larger the DDR is, the larger the error for a given grid size. Considering the number of grid cells and computational efficiency, the grid size is set to 2.00 mm×2.00 mm. The numerical error of the shock wave is less than 10% when the test point is arranged within 6–16 times the DDR, and the results are reliable. On the basis of this grid size, the bubble load was simulated. The errors in the maximum radius and period obtained using numerical simulation and the Geers–Hunter equation are 4.40% and 2.38%, respectively.
In this paper, the maximum radius of the bubble is 54 cm at approximately t = 45 ms. However, in Klaseboer's experiment, the bubble grows to its maximum radius, measuring 56 cm at approximately t = 50 ms. The experimental maximum radius and oscillation times could be larger because the calculations are based on TNT equivalent charges. However, the maximum error does not exceed 10%. Meanwhile, the bubble radius vs. time curve is compared using the Geers-Hunter (Geers and Hunter, 2002) and the Zhang (Zhang et al., 2023b) equations. The bubble shape is consistent with the experimental data (Klaseboer et al., 2005). The mesh density is reasonable, and the numerical method is reliable. It involves the underwater explosion of a shaped charge. The minimum grid of the shaped charge liner is 0.20 mm× 0.20 mm (Zhang et al., 2023c). To ensure the accuracy of the load kinetic energy of the high-speed shaped charge projectile, the following methods are adopted. A grid size of 0.20 mm×0.20 mm was used to calculate the load of the high-speed shaped charge projectile in the early stage, and then the grid size was changed to 2.00 mm×2.00 mm to calculate the bubble load. Therefore, the target of high-precision simulation of a shock wave, high-speed shaped charge projectile, and bubble can be realized throughout the process of an underwater explosion associated with a shaped charge.
3.3 UNDEX load characteristics of a spherical charge
3.3.1 Shock wave load
The pressure distribution of an underwater explosion shock wave of a spherical charge at typical moments is illustrated in Figure 5. At t = 5 μs, the detonation wave is formed after the initiation of the spherical charge and propagates in the charge. At t = 10 μs, the detonation wave arrives at the water, forming a spherical shock wave in the water. At t = 15–20 μs, the internal pressure continues to decrease, and the high-pressure zone shifts outward. It is observed that the propagation velocity and wave surface strength of the shock wave are isotropic. At t = 65 μs and t = 110 μs, the shock wave front reaches 10 and 16 times the DDR, respectively. The propagation velocity and wave surface intensity are isotropic.
 Figure 5 Shock wave propagation process of a spherical charge
At the same angle, the peak value of shock wave overpressure decreases with increasing distance. A peak overpressure between 10 and 16 times the DDR is attenuated by approximately 50%. This result reflects the attenuation rate of the shock wave in the process of water medium propagation, as shown in Table 6. The attenuation constant θ can be used to explain the degree of pressure attenuation in the process of shock wave propagation of an explosive in water. θ does not change considerably in the range of the same DDR. At the same angle, the attenuation constant θ increases with increasing distance, and the action time is at the millisecond level.
Table 6 Shock wave overpressure peak and time constant for a spherical chargeLocation angle (°) 10 times DDR 16 times DDR Pm (MPa) θ (ms) Pm (MPa) θ (ms) 0 114.67 0.099 63.52 0.146 30 112.61 0.097 61.86 0.151 60 114.72 0.090 62.33 0.151 90 117.72 0.099 64.07 0.151 120 113.98 0.091 61.87 0.151 150 112.61 0.097 61.26 0.153 180 112.88 0.100 62.68 0.153 To evaluate the shock wave load more comprehensively, the shock wave energy released by an underwater explosion of unit mass explosive was calculated. The specific shock wave energy is shown in Figure 6.
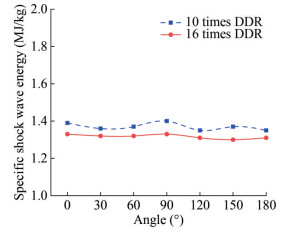 Figure 6 Specific shock wave energy of a spherical charge
3.3.2 Bubble load
For the bubble load, the characterization parameters are mainly the bubble pulsation period Tb, the maximum radius Rb, the bubble boundary expansion and contraction velocity V, and the specific bubble energy Eb. At a time of t = 0.1 ms and t = 0.5 ms, the bubble is spherical because of the spherical charge. This shape reflects that the expansion velocity and displacement of the bubble boundary in the directions of 0°, 90°, and 180° are not considerably different, as shown in Figures 7 and 8. At t= 1.0–6.0 ms, the bubble expands rapidly and is spherical. At t= 6.0 ms, the maximum bubble radius is 230 mm. The internal pressure of the bubble decreases to the minimum and gradually begins to shrink. During t = 8.0–11.0 ms, the bubble slowly shrinks because of inertia, and the radius shrinks from 220 mm to 130 mm. The average shrinkage velocity is approximately 30 m/s. The first expansion of the bubble consumes most of the energy. The late load is basically over. According to Equation (5), the specific bubble energy Eb = 2.00 MJ/kg can be obtained.
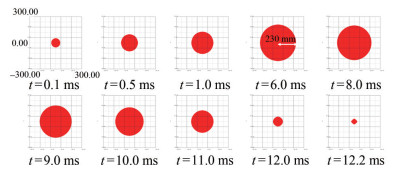 Figure 7 Bubble shape and period of a spherical charge
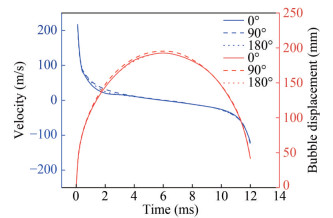 Figure 8 Expansion velocity and displacement of the bubble boundary of a spherical charge
The charge type adopts a spherical charge, and its detonation mode adopts center point detonation, leading to little difference in the expansion velocity and displacement of the bubble boundary in the three directions. The speed of outward and inward radial expansion is positive and negative, respectively. The difference in the expansion and contraction velocity and the displacement of the cylindrical charge bubble boundary in the three directions of 0°, 90°, and 180° is studied, as shown in Figure 8. At the initial stage of bubble expansion, the maximum velocity in all three directions reached 200 m/s. The bubble boundary expands outward rapidly to perform external work. Because of the presence of external water medium pressure, the expansion rate first decays rapidly and then slowly. At approximately t = 6.0 ms, the bubble boundary changes in the velocitydirection in the three directions, and the bubble begins to shrink. At the initial stage of contraction, the velocity of the bubble boundary increases slowly. At approximately t = 11.0 ms, the bubble boundary shrinks rapidly in the three directions at a much larger contraction speed than in the early stage of contraction.
3.4 UNDEX load characteristics of a cylindrical charge
3.4.1 Shock wave load
The pressure distribution of the shock wave generated by the underwater explosion of a cylindrical charge at typical times is shown in Figure 9. At t = 5 μs, the detonation wave propagates instantaneously after detonation initiation and enters the water medium to form a shock wave. At t = 10 μs, the shock wave front propagates in an ellipsoid shape. At t = 15 μs, the internal pressure of the explosive decreases, and its chemical energy is converted into energy forms such as a shock wave and heat loss. At t = 20 μs, the internal pressure continues to decrease, and the high-pressure zone shifts outward. The figure shows that the shock wave propagation velocity and wave surface strength are greater in the 0° direction of the cylindrical charge than in other azimuth angles. At t = 65 μs, the shock wave surface propagates to 10 times the DDR at the azimuth angle of 0° (Point 2). However, the propagation distance decreases when the azimuth angle changes counterclockwise from 0° to 180° with the same DDR. The wave surface strength is the weakest in the range of 120°-180°. At t= 110 μs, the shock wave front propagates to 16 times the DDR at the azimuth angle of 0° (Point 4). The shock wave surface still maintains the propagation velocity and wave surface strength in the direction of 0°, which is greater than those in the other directions because of the shape of the charge and the manner of detonation. It is seen that the wave surface strength of the shock wave decays rapidly during propagation. At 16 times the DDR, the wave surface strength of the shock wave is not considerably different in each direction. The shape of the charge no longer affects the shock wave load. The subsequent shock wave is approximately spherical. The shock wave of the cylindrical charge first propagates outward as an ellipsoidal wave and then propagates as a spherical wave after 16 times the DDR.
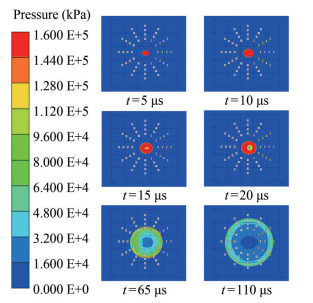 Figure 9 Shock wave propagation process of a cylindrical charge
For a given DDR, the peak value of shock wave overpressure gradually decreases from 0° to 180° and differs slightly from 0° to 90°. However, taking 90° as the dividing line, the difference between 90°–180° and 0° gradually increases. The difference in the overpressure peak between 0° and 180° is 43%. At the same azimuth angle, the peak value of shock wave overpressure decreases with increasing distance. When the DDR is equal to 6, the peak value of overpressure is reduced by approximately 50%. The peak value can reflect the attenuation rate of a shock wave during propagation in water, as shown in Table 7. The attenuation constant θ can be used to explain the degree of pressure attenuation during the propagation of an explosive shock wave in water. At the same DDR, θ changes slightly in the range of 0°–90°. However, the azimuth angle of 90°-180° changes greatly, and its action time increases gradually. The difference in the overpressure peak between 0° and 180° is approximately 45%. At the same azimuth angle, the attenuation constant θ increases with increasing distance, and the action time is at the millisecond level.
Table 7 Shock wave overpressure peak and time constant of a cylindrical chargeLocation angle (°) 10 times DDR 16 times DDR Pm (MPa) θ (ms) Pm (MPa) θ (ms) 0 142.801 0.085 71.758 0.136 30 140.959 0.083 70.116 0.138 60 142.146 0.077 71.289 0.146 90 130.092 0.086 69.608 0.154 120 105.096 0.110 60.158 0.166 150 85.261 0.118 52.068 0.174 180 80.153 0.124 49.916 0.180 To evaluate the shock wave load more comprehensively, the shock wave energy released by an underwater explosion of unit mass explosive is calculated. The specific shock wave energy is shown in Figure 10. For a given DDR, the specific shock wave energy decreases with increasing azimuth angle, and the specific shock wave energy in the radial direction (0°) is the largest. When the azimuth angle is 0°–90°, the specific shock wave energy decreases with increasing DDR. With 90° as the dividing line, the subsequent specific shock wave energy is insensitive to a change in the DDR.
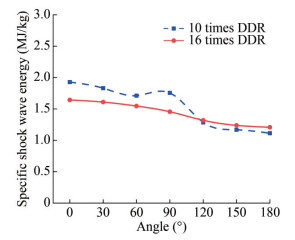 Figure 10 Specific shock wave energy of a cylindrical charge
3.4.2 Bubble load
At t= 0.1 and 0.5 ms, the shape of the charge is ellipsoidal because of the cylindrical charge, as shown in Figure 11. This shape reflects that the expansion velocity and displacement of the bubble boundary in the directions of 0°, 90°, and 180° are different. At t = 1.0 and 6.0 ms, the bubble expands rapidly. The difference in boundary velocity decreases, resulting in a spherical bubble shape. At t = 6.0 ms, the bubble expands to a maximum radius of 226 mm. The internal pressure is reduced to a minimum, and the bubble begins to shrink. In the range of t= 8.0–11.0 ms, because of inertia, the inertial bubbles shrink slowly. The radius shrinks from 220 mm to 140 mm. The average shrinkage velocity is approximately 73 m/s. The first expansion of the bubble consumes most of the energy. The late load is basically over. According to the specific bubble energy formula in Section 2, the specific bubble energy Eb = 2.16 MJ/kg can be obtained.
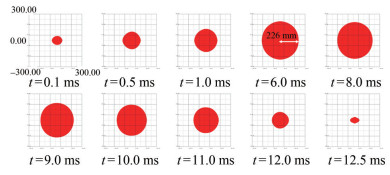 Figure 11 Bubble shape and period of a cylindrical charge
To study the difference in expansion and contraction velocities and the displacement of the bubble boundary of a cylindrical charge in the directions of 0°, 90°, and 180°, as shown in Figure 12. At the initial stage of bubble expansion, the velocities differ in the three directions, but the maximum velocity reaches 200 m/s. The bubble boundary expands outward rapidly to do external work. Because of the presence of external water medium pressure, the expansion rate decays rapidly and then decays slowly. At approximately t = 7.0 ms, the bubble boundary changes in the velocity direction in the three directions, and the bubble begins to shrink. At the initial stage of contraction, the velocity of the bubble boundary increases slowly. At t = 11.0 ms, the bubble boundary shrinks rapidly in the three directions at a much larger rate than in the early stage of shrinkage. The maximum velocity value reaches 100 m/s in the 0° direction and 150 m/s in the 90° direction. The difference in shrinkage velocity leads to ellipsoidal bubbles. The maximum displacement of the bubble boundary differs in the three directions. In the 0°, 90°, and 180° directions, the maximum radius is approximately 226, 215, and 187 mm, respectively.
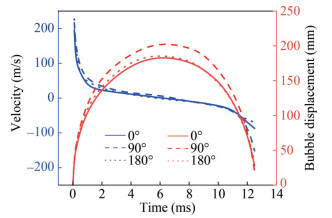 Figure 12 Expansion velocity and displacement of the bubble boundary of a cylindrical charge
3.5 UNDEX load characteristics of a shaped charge
3.5.1 Shock wave load
The pressure distribution of a shock wave generated by an underwater explosion of a shaped charge at a typical time is shown in Figure 13. At t = 5 μs, the detonation wave propagates instantaneously after detonation. At t = 10 μs, the liner is crushed with the effect of the detonation wave. A shaped charge projectile with certain kinetic energy is formed in the reserved airfield. At the same time, the shock wave surface with an ellipsoidal shape propagates outward. At t = 15 μs, the internal pressure of the explosive is reduced, and its chemical energy is converted into such energy forms as shock wave, heat loss energy, and the kinetic energy of the projectile. At t = 20 μs, the pressure inside the explosive continues to decrease, and the high-pressure zone shifts outward. The shaped charge projectile enters water quickly from the reserved air domain, and its head generates ballistic waves to propagate outward. At t = 65 μs, because of the high-speed impact of the shaped charge projectile, the shock wave surface strength is much larger in the 0° direction than in other directions. At this time, the shock wave surface propagates to 10 times the DDR at the azimuth of 0° (Point 2). However, the propagation distance decreases when the azimuth angle of the same DDR changes from 0° to 180°. The propagation distance decreases with changing azimuth angle, and the wave surface strength is the weakest at 120°-180°. At t =110 μs, the shock wave front propagates to 16 times the DDR at the azimuth angle of 0° (Point 4). The wave surface strength of the shock wave is not considerably different in each direction, and then the shock wave is approximately spherical. That is, the shock wave of a shaped charge first propagates outward as an ellipsoidal wave and then propagates as a spherical wave after 16 times the DDR.
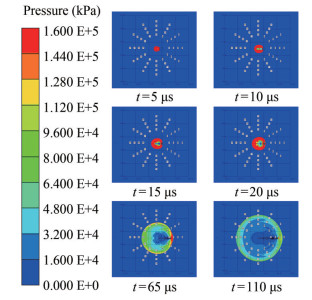 Figure 13 Shock wave propagation cloud of a shaped charge
To more accurately study the shock wave caused by the invasion body, the overpressure peak values at the points of 10 and 16 times the DDR and azimuth angles of 0° -180° are shown in Figure 14 and Table 8. Comparing the peak pressure Pm and attenuation constant θ at the measuring point, the peak overpressure of the shock wave decreases gradually from 0° to 180° at the same DDR. Because of the superposition of the head ballistic wave and the initial shock wave of the shaped charge penetration, the wave surface strength is much larger in the 0° direction than in the other directions. The peak value of overpressure does not change considerably in the range of 30° -90° but varies greatly from 90° to 180°. The difference in overpressure between 0° and 180° is 81%. At the same azimuth angle, the peak value of shock wave overpressure decreases with increasing distance. Except for the 0° direction, the DDR is 6 times different, and the overpressure peak is attenuated by approximately 50%. This phenomenon is also observed during the underwater explosion process of spherical and cylindrical charges. θ can be used to explain the degree of pressure attenuation during the propagation of an explosive shock wave in water. For a given DDR, θ increases with increasing azimuth angle, and the action time increases gradually. At the same azimuth angle, θ increases with increasing distance, and the action time is at the millisecond level.
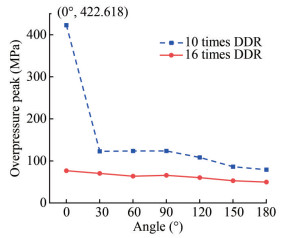 Figure 14 Peak overpressure of the shock wave of a shaped chargeTable 8 Shock wave overpressure peak and time constant of a shaped charge
Location angle (°) 10 times the DDR 16 times the DDR Pm (MPa) θ (ms) Pm (MPa) θ (ms) 0 422.618 0.052 76.673 0.130 30 122.729 0.070 70.275 0.123 60 123.602 0.066 63.608 0.130 90 123.699 0.073 65.710 0.127 120 108.175 0.083 60.281 0.138 150 86.185 0.091 52.785 0.147 180 79.016 0.098 49.697 0.152 To evaluate the shock wave load more comprehensively, the shock wave energy released by the underwater explosion of a unit mass explosive is analyzed in Figure 15. For a given DDR, the specific shock wave energy decreases gradually with increasing azimuth angle. Because of the superposition of the ballistic wave and shock wave generated by the high-speed water entry of the projectile, the specific shock wave energy in the radial direction reaches a maximum of 11 MJ/kg. When the azimuth angle is 0°–90°, the specific shock wave energy decreases with increasing DDR. With 90° as the dividing line, the subsequent specific shock wave energy is insensitive to a change in the DDR.
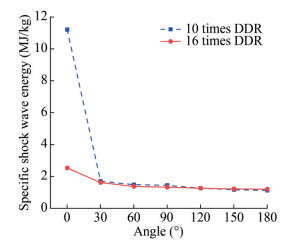 Figure 15 Specific shock wave energy of a shaped charge
3.5.2 Bubble load
After the shaped charge is detonated underwater, the main characterization parameters of the bubble load are as follows: the bubble pulsation period Tb, the maximum radius Rb, the bubble boundary expansion and contraction velocityV, the specific bubble energy Eb, etc. At t = 0.1 ms and t =0.5 ms, because of the presence of the liner and the reserved holes, the energy is converged. Some of the energy is converted into the kinetic energy of the intrusion, as shown in Figure 16. The bubble shape is flat, reflecting the difference in the speed and displacement of the expansion and contraction of the bubble boundary in the directions of 0°, 90°, and 180°. At t = 1.0 ms and t = 6.0 ms, the bubble gradually expands, and the boundary velocity difference decreases, resulting in an approximately spherical bubble. At t = 6.0 ms, the bubble expands to a maximum radius of 200 mm. The internal pressure decreases to a minimum, and the bubble begins to shrink. In the range of t = 8.0–10.0 ms, the bubble slowly shrinks because of inertia. The radius shrinks from 180 mm to 120 mm, with an average shrinkage speed of approximately 30 m/s. At t = 10.0–11.0 ms, the radius is reduced from 120 mm to 60 mm, with an average contraction speed of approximately 60 m/s. The first expansion of the bubble consumes most of the energy, and the later load is basically over. At the same time, according to Equation (5), the specific bubble energy Eb = 1.68 MJ/kg can be obtained.
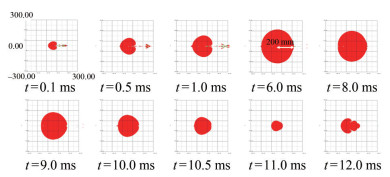 Figure 16 Bubble shape and period of a shaped charge
In this paper, the difference in expansion and contraction velocity and the displacement of the bubble boundary of a cylindrical charge in the directions of 0°, 90°, and 180° is studied in Figure 17. At the initial stage of bubble expansion, some of the energy is taken away because of the formation and movement of the projectile. The velocities of bubble boundary expansion in the directions of 0° and 90° peak at 75 m/s and 200 m/s, respectively. Because of the presence of external water medium pressure, the expansion rate decays rapidly and then slowly. At approximately t= 6.0 ms, the bubble boundary changes in the three velocity directions. The bubble began to shrink, and the velocity of the bubble boundary increased slowly in the early stage of contraction. At approximately t = 10.0 ms, the bubble boundary shrinks rapidly in the three directions. The contraction velocity becomes much higher. The maximum velocities in the directions of 0° and 90° reach 90 m/s and 120 m/s, respectively. The difference in shrinkage velocity leads to ellipsoidal bubbles. The maximum displacement of the bubble boundary in the three directions is different. The maximum radius of the bubble boundary in the direction of 0°-180° is approximately 190 mm, 187 mm, and 162 mm, respectively.
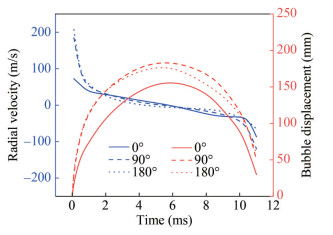 Figure 17 Expansion velocity and displacement of the bubble boundary of a shaped charge
3.5.3 Projectile load
Under the pressure of the underwater explosion detonation wave of a shaped charge, the liner is crushed and forms a shaped projectile with certain kinetic energy in the reserved air domain. The shape and velocity contours are shown in Figure 18. At t= 5 μs, the liner is not crushed. In the range of t= 10–20 μs, under the action of the detonation wave, the shaped charge liner forms a shaped charge projectile with a maximum kinetic energy of 4.78 kJ. The kinetic energy of the projectile released by the underwater explosion of unit mass explosive is 0.23 MJ/kg. At t = 30–80 μs, the shaped projectile moves forward in the water, its speed gradually decays, and the head gradually wears and presents a "mushroom shape, " Because of the velocity gradient before and after, the shaped charge projectile breaks, and the penetration ability is weakened. When the projectile moves to 8 times the DDR, its head speed is approximately 1 200 m/s, and it still has strong damage ability. This result indicates that the projectile produced by the underwater explosion of the shaped charge has a strong penetration ability and can damage the target.
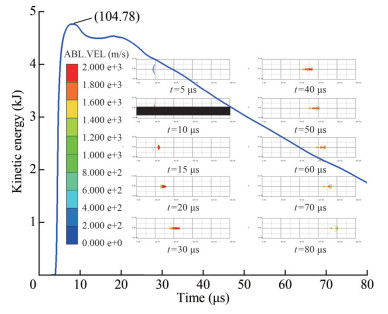 Figure 18 Morphology and kinetic energy curve of a projectile
4 Discussion and analysis
4.1 Comparison results for shock wave load
The underwater explosion load characteristics of shaped, spherical, and cylindrical charges are compared and analyzed. First, in terms of shock wave load, the shock waves of spherical, cylindrical, and shaped charges propagate outward in spherical, ellipsoid–spherical, and ellipsoid–spherical shapes, respectively. The propagation velocity and intensity of a spherical shock wave are isotropic. The velocity and intensity of ellipsoidal shock wave propagation are the largest in the radial direction (0°) and the smallest in the range of 120°–180°. The pressure distribution of the shock wave in Sections 3.3.1, 3.4.1 and 3.5.1 shows that when the shock wave reaches 16 times the DDR, its surface is approximately spherical.
The peak shock wave pressure P1 of the spherical charge was utilized as the standard to assess the effect of charge shape on shock wave pressure at different spatial positions. Therefore, the relative error percentage of the peak pressure, i.e., the value of the percentage of (P-P1)/P1, at positions 7, 10, 13, and 16 times the DDR can be obtained. The difference between a cylindrical charge and a shaped charge compared with a spherical charge is shown in Figures. 19 and 22. Figure 19 shows that the relative error in peak pressure decreases substantially from 7 times to 10 and 13 times the DDR. The range of decrease from 13 times to 16 times the DDR is limited, and the relative error value is approximately 10%. This value indicates that the shock waves of the two charges are not considerably different after 16 times the DDR. Figure 20 shows that when the distance is larger than 16 times the DDR, the shock wave of the shaped and spherical charges is similar, with the error of the pressure value lower than 10%.
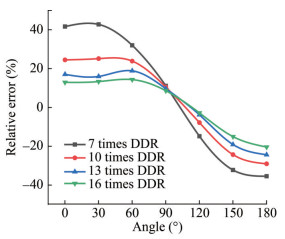 Figure 19 Relative error of cylindrical and spherical charges
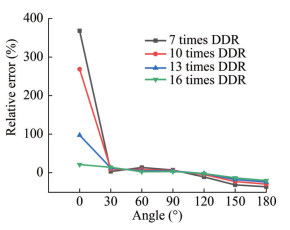 Figure 20 Relative error of shaped and spherical charges
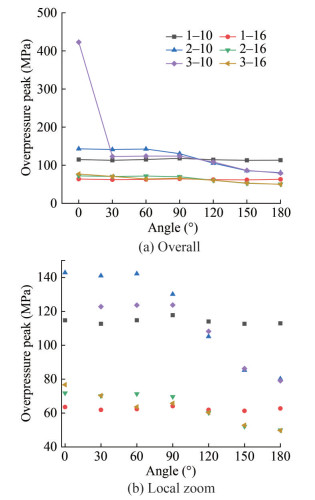 Figure 21 Comparison of the peak shock wave overpressure of spherical/cylindrical/shaped charges
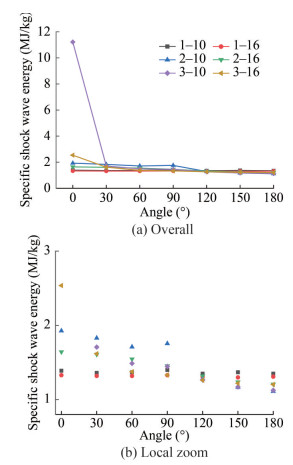 Figure 22 Comparison of the specific shock wave energy of spherical/cylindrical/shaped charges
The overpressure peak and specific shock wave energy curves of different DDR values and azimuth angles under three working conditions are shown in Figures 21 and 22. In Figure 21, 1-10 represents the value of the measuring point at 10 times the DDR in Case 1. The underwater explosion of a spherical charge produces a shock wave, and its overpressure peak is independent of spatial position at the same DDR. However, the magnitude of the overpressure peak under the cylindrical charge condition is related to the spatial position, and the difference is not large in the range of 0°–90°. With 90° as the dividing line, it gradually decreases in the range of 90°–180°. Under the condition of a shaped charge, the peak overpressure in 30°–90° is smaller than that of a cylindrical charge. With 90° as the dividing line, the overpressure peaks of shaped and cylindrical charges are not considerably different in the range of 90°-180°. This comparison indicates that the liner absorbs the energy of the shock wave from 30° -90°, thus forming a high-speed shaped charge projectile. The projectile entering water rapidly forms a ballistic wave at the head. The superposition of the shock wave and the ballistic wave increases the peak overpressure in the radial direction (0°). At the same azimuth angle in the three working conditions, the peak value of shock wave overpressure decreases with increasing distance. For the shaped charge, when the measuring points not in the 0° direction are 6 times the DDR, the overpressure peak is attenuated by approximately 50%.
The specific shock wave energy curves of different DDR and azimuth angles under the three cases are shown in Figure 22. The specific shock wave energy is related to the shape of the charge between 0° and 90° and not considerably different between 90° and 180°. In addition, the specific shock wave energy between 30° and 90° is smaller than that of the cylindrical charge. This finding also shows that the liner absorbs the shock wave energy from 30°–90°. Thus, the crushed liner forms a high-speed shaped charge projectile, which quickly enters the water to form a ballistic wave at the head. This result is reflected in the specific shock wave energy in the 0° direction of the shaped charge being much larger than those of spherical and cylindrical charges.
4.2 Bubble load comparison
Second, the specific bubble energy and the specific kinetic energy of the projectile for the three cases are shown in Figure 23. It is seen that only shaped charges produced projectiles. Therefore, the specific bubble energy of shaped charges is smaller than that of spherical and cylindrical ones. This finding indicates that projectile formation also absorbs some of the bubble energy. The bubble period Tb of spherical, cylindrical, and shaped charges is 12.20 ms, 12.50 ms, and 11.00 ms, respectively; the maximum radius Rb is 230 mm, 226 mm, and 200 mm, respectively; and the specific bubble energy Eb is 2.00 MJ/kg, 2.16 MJ/kg, and 1.68 MJ/kg, respectively. The underwater explosion of spherical charges produces spherical bubbles. The expansion and contraction speeds in the directions of 0°, 90°, and 180° are basically identical. The differences in the expansion and contraction velocities of bubbles in the three directions cause the bubbles to appear ellipsoidal for cylindrical and shaped charges.
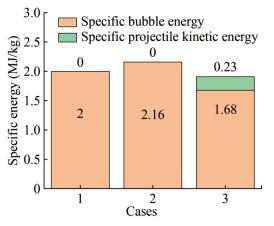 Figure 23 Comparison of the specific bubble energies of spherical/cylindrical/shaped charges
5 Conclusion
In this paper, a numerical model of underwater explosions of spherical, cylindrical, and shaped charges was established using the Eulerian method. The type of charge is HMX. The characteristics of shock wave load, bubble load, and shaped charge projectile load of different charges were analyzed. The differences in the shock wave propagation, overpressure peak, time constant, and specific shock wave energy of the three types of charges were discussed. The bubble shape, period, radius, expansion and contraction velocity, and specific bubble energy at different spatial positions of the three charges were explored. Through comparison with the traditional cylindrical blasting charge, the source of the kinetic energy of the projectile during the underwater explosion of a shaped charge was obtained. The specific conclusions are as follows:
(1) The shock waves generated by underwater explosions of spherical, cylindrical, and shaped charges propagate outward in spherical, ellipsoid–spherical, and ellipsoid-spherical waves, respectively. The propagation velocity and intensity of the spherical shock wave surface are isotropic. The propagation velocity and intensity of the ellipsoidal shock wave are the largest in the radial direction (0°) and the weakest in the range of 120° -180°. When the shock wave reaches 16 times the distance–diameter ratio, the shock wave surface is approximately spherical. In the range of 0°-30°, the overpressure peak and specific shock wave energy of a shaped charge are obviously larger by 280% and 550%, respectively, than those of a cylindrical charge during an underwater explosion, while in 30°–90° they are smaller than those of the cylindrical charge. In the range of 90°–180°, these two cases have similar overpressure peaks and specific shock wave energies.
(2) The bubble period, maximum radius, and specific bubble energy of shaped charges are lower than those of spherical and cylindrical charges. They are reduced by 2% and 4%, 13% and 12%, and 16% and 22%, respectively. The bubble shapes of spherical, cylindrical, and shaped charges are spherical, ellipsoidal, and ellipsoidal, respectively. The overall trend of bubbles for these three cases is similar. The bubble expands rapidly after detonation with a velocity of approximately 200 m/s. Then, the internal and external pressure balance remains stable. It shrinks slowly at first and then collapses rapidly in a very short period at a speed of approximately 100 m/s.
(3) For the shaped charge, the kinetic energy of the projectile should be considered. The liner absorbs the shock wave energy of 30° -90° and some of the bubble energy, and a shaped projectile is consequently formed. The high-speed projectile has a certain kinetic energy, and the ballistic wave is formed after entering the water at high speed. Some of the energy is reflected in the 0°–30° direction as waves, and that in the 0° direction is the most prominent. In addition, the shaped charge projectile has a strong penetration ability. When the projectile moves to 8 times the distance-diameter ratio, it can still damage the target.
Competing interest Prof. Zhi Zong is an editorial board member for the Journal of Marine Science and Application and was not involved in the editorial review, or the decision to publish this article. All authors declare that there are no other competing interests. -
Figure 1 Numerical simulation model
Figure 2 Shock wave overpressure peaks at different grid densities and distance ratios (Zamyshlyaev, 1973; Zhang et al., 2023b)
Figure 3 Bubble radius evolution (Geers and Hunter, 2002; Zhang et al., 2023b).
Figure 4 Comparison of the experimental data (Klaseboer et al., 2005) and the numerical simulation of bubble shape
Figure 5 Shock wave propagation process of a spherical charge
Figure 6 Specific shock wave energy of a spherical charge
Figure 7 Bubble shape and period of a spherical charge
Figure 8 Expansion velocity and displacement of the bubble boundary of a spherical charge
Figure 9 Shock wave propagation process of a cylindrical charge
Figure 10 Specific shock wave energy of a cylindrical charge
Figure 11 Bubble shape and period of a cylindrical charge
Figure 12 Expansion velocity and displacement of the bubble boundary of a cylindrical charge
Figure 13 Shock wave propagation cloud of a shaped charge
Figure 14 Peak overpressure of the shock wave of a shaped charge
Figure 15 Specific shock wave energy of a shaped charge
Figure 16 Bubble shape and period of a shaped charge
Figure 17 Expansion velocity and displacement of the bubble boundary of a shaped charge
Figure 18 Morphology and kinetic energy curve of a projectile
Figure 19 Relative error of cylindrical and spherical charges
Figure 20 Relative error of shaped and spherical charges
Figure 21 Comparison of the peak shock wave overpressure of spherical/cylindrical/shaped charges
Figure 22 Comparison of the specific shock wave energy of spherical/cylindrical/shaped charges
Figure 23 Comparison of the specific bubble energies of spherical/cylindrical/shaped charges
Table 1 Main parameters of the EoS for water
ρ0(g/cm3) A1(GPa) A2(GPa) A3(GPa) B0 B1 T1(GPa) T2(GPa) 1.00 2.20 9.54 14.57 0.28 0.28 2.20 0.00 Table 2 Main parameters of the JWL equation
Charge A4(GPa) B2(GPa) R2 R3 ω1 DCJ(m/s) E(GJ/m3) PCJ(GPa) HMX 778.28 7.07 4.20 1.00 0.30 9 110 10.50 42.00 TNT 371.20 3.23 4.15 0.95 0.30 6 930 7.00 21.00 Table 3 Main parameters of the J–C model for CU-OFHC
A5(GPa) B3(GPa) m2 C n Tm(K) 0 0.292 1.09 0.025 0.31 1 356 Table 4 Case setting
Cases Charge types Sphere Column Shaped 1 √ 2 √ 3 √ Table 5(a) Relative error of the overpressure peak (Zamyshlyaev, 1973)
DDR Numerical(MPa) ZM(MPa) Relative error (%) 8 163.4 161.59 1.12% 10 117.8 115.63 1.88% 12 90.3 88.15 2.44% 14 72.3 74.05 -2.36% 16 59.8 63.68 -6.09% 18 50.7 55.75 -9.06% 20 43.9 49.49 -11.30% 5(b) Relative error of the overpressure peak (Zhang et al., 2023b)
DDR Numerical(MPa) ZM(MPa) Relative error (%) 8 163.4 169.74 -3.74% 10 117.8 118.38 -0.49% 12 90.3 94.32 -4.26% 14 72.3 77.31 -6.48% 16 59.8 65.76 -9.06% 18 50.7 56.88 -10.86% 20 43.9 50.13 -12.43% Table 6 Shock wave overpressure peak and time constant for a spherical charge
Location angle (°) 10 times DDR 16 times DDR Pm (MPa) θ (ms) Pm (MPa) θ (ms) 0 114.67 0.099 63.52 0.146 30 112.61 0.097 61.86 0.151 60 114.72 0.090 62.33 0.151 90 117.72 0.099 64.07 0.151 120 113.98 0.091 61.87 0.151 150 112.61 0.097 61.26 0.153 180 112.88 0.100 62.68 0.153 Table 7 Shock wave overpressure peak and time constant of a cylindrical charge
Location angle (°) 10 times DDR 16 times DDR Pm (MPa) θ (ms) Pm (MPa) θ (ms) 0 142.801 0.085 71.758 0.136 30 140.959 0.083 70.116 0.138 60 142.146 0.077 71.289 0.146 90 130.092 0.086 69.608 0.154 120 105.096 0.110 60.158 0.166 150 85.261 0.118 52.068 0.174 180 80.153 0.124 49.916 0.180 Table 8 Shock wave overpressure peak and time constant of a shaped charge
Location angle (°) 10 times the DDR 16 times the DDR Pm (MPa) θ (ms) Pm (MPa) θ (ms) 0 422.618 0.052 76.673 0.130 30 122.729 0.070 70.275 0.123 60 123.602 0.066 63.608 0.130 90 123.699 0.073 65.710 0.127 120 108.175 0.083 60.281 0.138 150 86.185 0.091 52.785 0.147 180 79.016 0.098 49.697 0.152 -
Bjarnholt G (1980) Suggestions on standards for measurement and data evaluation in the underwater explosion test. Propellants, Explosives, Pyrotechnics, 5(2-3): 67-74. https://doi.org/10.1002/prep.19800050213 Cole RH, Weller R (1948) Underwater explosions. Physics Today, 1(6): 35. https://doi.org/10.5962/bhl.title.48411 Cui P, Zhang A, Wang S, Khoo BC (2018) Ice breaking by a collapsing bubble. Journal of Fluid Mechanics, 841, 287-309. https://doi.org/10.1017/jfm.2018.63 Daramizadeh A, Ansari MR (2015) Numerical simulation of underwater explosion near air-water free surface using a five-equation reduced model. Ocean Engineering. 110, 25-35. https://doi.org/10.1016/j.oceaneng.2015.10.003 Emamzadeh SS (2022) Nonlinear dynamic response of a fixed offshore platform subjected to underwater explosion at different distances. J. Marine. Sci. Appl. 21(4): 168-176. https://doi.org/10.1007/s11804-022-00306-6 Geers TL, Hunter KS (2002) An integrated wave-effects model for an underwater explosion bubble. J. Acoust. Soc. Am. 4(111): 1584-1601. https://doi.org/10.1121/1.1458590 Han R, Zhang A, Tan S, Li S (2022) Interaction of cavitation bubbles with the interface of two immiscible fluids on multiple time scales. Journal of Fluid Mechanics, 932, A8. https://doi.org/10.1017/jfm.2021.976 Huang C, Guo K, Qin K, Luo K, Li D, Dang J (2022) Hydrodynamic characteristics and supercavity shape of supercavitating projectiles launched with supersonic speed. J. Marine. Sci. Appl. 21(2): 24-33. https://doi.org/10.1007/s11804-022-00262-1 Hung CF, Hwangfu JJ (2010) Experimental study of the behaviour of mini-charge underwater explosion bubbles near different boundaries. Journal of Fluid Mechanics, 651, 55-80. https://doi.org/10.1017/S0022112009993776 Klaseboer E, Hung KC, Wang C (2005) Experimental and numerical investigation of the dynamics of an underwater explosion bubble near a resilient/rigid structure. Journal of Fluid Mechanics. 537: 387-413. https://doi.org/10.1017/S0022112005005306 Li S, Zhang A, Cui P, Li S, Liu Y (2023) Vertically neutral collapse of a pulsating bubble at the corner of a free surface and a rigid wall. Journal of Fluid Mechanics, 962: A28. https://doi.org/10.1017/jfm.2023.292 Liang HZ, Li Y, Zhang QM (2016) The explosive characteristics of TNT under deep water. Acta Armamentar II. 37(S2): 241-245 Liu W, Zhang A, Miao X, Ming F, Liu Y (2023) Investigation of hydrodynamics of water impact and tail slamming of high-speed water entry with a novel immersed boundary method. Journal of Fluid Mechanics, 958: A42. https://doi.org/10.1017/jfm.2023.120 Ma K, Wang CL, Li MR (2019) Underwater explosion load characteristic of shaped charge warhead (in Chinese). Ordnance Material Science and Engineering, 42(1): 1-5. https://doi.org/10.14024/j.cnki.1004-244x.20181122.002 Shi CY, Xu CD, Kong DR (2020) Effects of shell thickness of charge on pressure waveform in water shock tube (in Chinese). Chinese Journal of Explosives & Propellants, 43(3): 314-319. https://doi.org/10.14077/j.issn.1007-7812.201904029 Tatlısuluoğlu A, Beji S (2021) Blast pressure measurements of an underwater detonation in the sea. J. Marine. Sci. Appl. 20(4): 706-713. https://doi.org/10.1007/s11804-021-00230-1 USA CD (2003) Interactive Non-Linear Dynamic Analysis Software Autodyn User Manual. USA Century Dynamics Inc., Houston. Wang CL, Zhou G, Ma K (2017) Shockwave characteristics of shaped charge exploded underwater (in Chinese). Chinese Journal of High Pressure Physics, 31(4): 453-461. https://doi.org/10.11858/gywlxb.2017.04.014 Wang CL, Zhou G, Ma K (2018) Damage analysis of typical water partitioned structure under shaped charge underwater explosion (in Chinese). Journal of Ship Mechanics, 22(8): 1001-1010. https://doi.org/10.3969/j.issn.1007-7294.2018.08.010 Wang P, Zhang A, Ming F, Sun P, Cheng H (2019) A novel non-reflecting boundary condition for fluid dynamics solved by smoothed particle hydrodynamics. Journal of Fluid Mechanics, 860: 81-114. https://doi.org/10.1017/jfm.2018.852 Wang Y, Qin YZ, Wang ZK, Yao XL (2022) Damage characteristics of ice layer during underwater blasting of different types of explosives (in Chinese). Journal of Vibration and Shock. https://doi.org/10.13465/j.cnki.jvs.2022.09.025 Zamyshlyaev BV (1973) Dynamic Loads in Underwater Explosion. USA Naval Intelligence Support Center, Washington DC Zhang A, Li S, Cui P, Li S, Liu Y (2023a) Theoretical study on bubble dynamics under hybrid-boundary and multi-bubble conditions using the unified equation. Sci. China Phys. Mech. Astron. 66, 124711. https://doi.org/10.1007/s11433-023-2204-x Zhang A, Li S, Cui P, Li S, Liu Y (2023b) A unified theory for bubble dynamics. Physics of Fluids, 35(3): 033323. https://doi.org/10.1063/5.0145415 Zhang A, Ren S, Li Q, Li J (2012) 3D numerical simulation on fluid-structure interaction of structure subjected to underwater explosion with cavitation. Applied Mathematics and Mechanics-English Edition. 33(9): 1191-1206. https://doi.org/10.1007/s10483-012-1615-8 Zhang AM, Cui P, Cui J, Wang QX (2015) Experimental study on bubble dynamics subject to buoyancy. Journal of Fluid Mechanics, 776: 137-160. https://doi.org/10.1017/jfm.2015.323 Zhang Z, Wang C, Zhang A, Silberschmidt VV, Wang L (2019) SPH-BEM simulation of underwater explosion and bubble dynamics near rigid wall. Science China-Technological Sciences, 62(7): 1082-1093. https://doi.org/10.1007/s11431-018-9420-2 Zhang ZF, Li HL, Wang LK, Zhang GY, Zong Z (2022) Formation of shaped charge projectile in air and water. Materials, 15(21): 7848. https://doi.org/10.3390/ma15217848 Zhang ZF, Li HL, Zhang GY (2023c) Action time sequence of underwater explosion shock wave and shaped charge projectile (in Chinese). Explosion and Shock Waves. 43(10): 3-14. https://doi.org/10.11883/bzycj-2022-0397 Zhou FY, Jiang T, Wang WL, Zhang KY, Zhan FM (2012) Study on damage capabilities of multiple hulls structure under underwater explosion. Amr. 430-432, 1581-1586. https://doi.org/10.4028/www.scientific.net/AMR.430-432.1581 Zong Z, Zhao Y, Ye F, Li H, Chen G (2012) Parallel computing of the underwater explosion cavitation effects on full-scale ship structures. J. Marine. Sci. Appl. 11(4): 469-477. https://doi.org/10.1007/s11804-012-1157-7
