-
Abstract
Offshore triceratops is one of the successful manifestations of the form-dominant design approaches deployable in ultra-deepwater oil and gas exploration. The deck's geometric shape and partial isolation from the legs counteract lateral loads. Legs are position-restrained to the sea bed by taut-moored tendons, while ball joints partially isolate the deck from the buoyant legs. However, compliance in the horizontal plane imposes large displacements, intuiting the necessity to examine tendon failure. Numerical analysis of triceratops under wave and wind combined action is carried out under the postulated conditions of a tendon failure. 10-yr, 100-yr, and 1 000-yr post-Katrina hurricane conditions are assumed as loading to the platform. Results confirm a marginal increase in the natural periods of stiff degrees of freedom even under postulated failure conditions, ensuring good adaptability to ultra-deep water. Under postulated failure, the tension of adjacent tendons varies significantly, causing a shift to the mean position of the platform. Fatigue life is significantly reduced under the postulated failure of tendons, making the platform free-floating without affecting its stability. Results also show that the pitch response of the deck is a clear manifestation of the postulated failure, which is otherwise absent due to the presence of ball joints. The attempted study deliberates on the fatigue life of tendons, assessing the platform's suitability to ultra-deep waters and identifying the vulnerable legs for the chosen load combinations.-
Keywords:
- Ball joints ·
- Tendons ·
- Buoyant legs ·
- Fatigue life ·
- Irregular waves ·
- Postulated failure
Article Highlights● Offshore triceratops under the combined action of wund, wave and currents are studied for ultra-deep-waters with different heading angles.● Postulated failure conditions of tendons are examined.● Under intact and postulated failure conditions, the equilibrium positions of the platform are studed. Further the dynamic response of the deck and legs are examined.● Also included the fatigue life of the tendons under the each leg. -
1 Introduction
Due to the increase in the severity of the environmental loads acting on offshore platforms commissioned in greater water depths, their geometric form attracts special attention (Halkyard et al., 1991; Perryman et al., 1995; Shaver et al., 2001; Liu et al., 2022; Zou et al., 2023). Offshore triceratops has better motion characteristics to sustain loads from harsh environments (White et al., 2005; Chandrasekaran et al., 2013). Ball joints between the deck and legs make the platform novel, addressing the scarcity in the literature studies (Chandrasekaran and Seeram, 2015; Chandrasekaran and Nannaware, 2014). The Leg's translational displacements are transferred to the deck through ball joints. In contrast, their rotational displacements are isolated, indicating a rigid body motion in the vertical plane (Chandrasekaran and Nagavinothini, 2019). Triceratops resembles spar platform and TLP for their deep-draft and positively-buoyant characteristics (Chandrasekaran and Nagavinothini, 2018; 2020; Nagavinothini and Chandrasekaran, 2019; 2020). Excess buoyancy is counteracted by imposing pretension to tendons. Experimental investigations also confirmed a higher degree of compliance in the horizontal plane (Chandrasekaran and Madhuri, 2015). Motion stability and installation issues are addressed by providing additional stiffeners in the legs (Chandrasekaran et al., 2015). A postulated failure is defined as an intended failure caused on the platform. The postulated failure cases help examine the efficiency of the system without any physical damage to the model. The fundamental assumption is that the failure alone occurs in the platform; the other failures have no cumulative effect on the system. Under postulated failure of tendons, fatigue assessment becomes important to classify the service life of taut moored compliant platforms (Chandrasekaran and Rao, 2019; Chandrasekaran et al., 2021; Cheng et al., 2021; Kim and Zhang, 2009; Tabeshpour et al., 2018; Qi et al., 2019; Ren et al., 2022; Yu et al., 2019; Chen et al., 2022). The ANSYS AQWA commercial software is well established and widely used software package specifically designed for the analysis of offshore structures, including floating platforms (Zhu et al., 2021; Li et al., 2021; Chen et al., 2022; Liu et al., 2022; Zou et al., 2023) is used for the numerical simulations in the present study. The major objective of the current study is to examine its performance under the postulated failure condition of the tendons through time history responses and phase plots in the active degrees of freedom. Aditionally the fatigue life of the tendons is calculated using S-N curve approach in both intact and postulated failure conditions.
2 Numerical model of the offshore triceratops
The geometric details of the platform proposed by Chandrasekaran and Nagavinothini (2018) are considered for the present study. The legs are modelled as tubular elements (Morison elements, D/L<0.2) and their self-weight is computed by program control. The ballast load is applied as a point mass to lower the vertical CG of the legs by −112.74 m, and the forces acting on the legs are calculated by using the Morison equation:
$$\begin{align} q_n= & \frac{1}{2} \rho C_d \mathrm{~d} A\left(v_n-\dot{x}_n\right)\left|v_n-\dot{x}_n\right|+\rho \mathrm{d} V a_n \\ & +\left(C_m-1\right) \rho \mathrm{d} V\left(a_n-\ddot{x}_n\right)\end{align}$$ (1) where Cd, Cm represents the drag and inertia coefficients; vn an are water particle velocity and acceleration; $\ddot{x}_n, \dot{x}_n$ are structure's acceleration and velocity; ρ is the density of seawater; dA and dV are exposed area and displaced volume per unit length, respectively. The deck weight and payload are applied as a point mass at CG. Tubular tendons are connected to the legs for position-restraining. The convolution integration technique solves the following equation of motion in ANSYS AQWA to obtain the response history in all degrees of freedom.
$$\left[\boldsymbol{M}+\boldsymbol{M}_a\right] \ddot{\boldsymbol{x}}(t)+\boldsymbol{C} \dot{\boldsymbol{x}}(t)+\boldsymbol{K} \boldsymbol{x}(t)=\boldsymbol{F}(t)$$ (2) where $\ddot{\boldsymbol{x}}(t), \dot{\boldsymbol{x}}(t), \boldsymbol{x}(t)$ and F (t) are acceleration, velocity, displacement, and force vectors; M and Ma are the structural mass and added mass matrices; C is the damping matrix; and K is the stiffness matrix. The geometric details of the platform and tubular tendons are shown in Table 1 and Table 2, respectively. Figure 1 and Figure 2 show the plan view and numerical model of the platform. Steel tubes are used as tendons as the inner core is useful for a fluid flow conduit (American Petroleum Institute, 2010). The arrangement of tendons to the legs is shown in Figure 3, amongst which (T9, T11) of leg-3 are considered for postulated failure conditions.
Table 1 Geometric detailsGeometric details Value C/C distance of legs (m) 61.77 Diameter of leg (m) 15.0 Freeboard (m) 20.24 Draft (m) 154.0 Tendon length (m) 2 246.0 Water depth (m) 2 400.0 Self-weight+payload (MN) 562 Buoyancy force (MN) 821 Total pretension (MN) 259 Table 2 Tendon detailsDescription Quantity Total number of tendons 12 Leg-1, leg-2, and leg-3 Tendons 1-2-3-4, tendons 5-6-7-8 and tendons 9-10-11-12 Outer diameter of tendon (m) 1.29 Thickness of tendon (m) 0.043 Total elements 250 Stiffness of tendon (MN/m) 15.8 Length of each element (m) 8.89 Grade of steel X65 Yield strength (MPa) 450 Tensile strength (MPa) 535 Postulated failure tendons Tendon 9, 11 under leg-3  Figure 1 Plan view of the platform
 Figure 2 Numerical model
 Figure 3 Tendon connections to each leg
3 Environmental loads
A 10-year, 100-year, and 1 000-year return period of hurricanes in the region of the Gulf of Mexico is considered in the present study (Yang and Kim, 2010). The critical sea state conditions lead to the dynamic tension variation in the tendons and are defined as load cases-A, B and C, as shown in Table 3. The present study assumes the wind, wave, and current are colinear and concurrent.
Table 3 Characteristics of sea stateLoad case (LC) Return period HS (m) TP (s) γ Wind (m/s) Depth (m) Current (m/s) A 10-year 10 13 2.2 33 0 1.32 −34.99 0.99 −69.31 0 −2 400 0 B 100-year 15.1 15.1 2.2 48 0 1.8 −49.98 1.35 −100.79 0 −2 400 0 C 1 000-year 18.81 16.95 2.2 60 0 2.25 −63.00 1.69 −126.00 0 −2 400 0 The API wind spectrum is useful for defining offshore structures' wind loads (Chandrasekaran et al., 2022) due to higher energy availability under low frequencies. Figure 4 shows the spectral plot.
$$S(f)=\frac{\sigma(Z)^2}{f} S(\tilde{f})$$ (3) 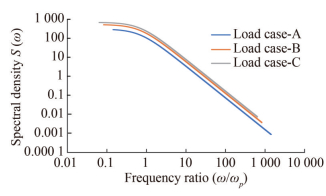 Figure 4 Wind spectral plots for different load cases
$$S(\tilde{f})=\frac{(\tilde{f})}{(1+1.5 \tilde{f})^{\frac{5}{3}}}$$ (4) $$(\tilde{f})=\frac{f}{\mathrm{fp}}$$ (5) $$\mathrm{fp}=0.025 \frac{\bar{V}_Z}{Z}$$ (6) where VZ is the mean speed duration 1 hour at the height Z (m); f and fp are in Hz. Wind force coefficients are assigned as follows:
$$F_w=\frac{1}{2} \rho_{\mathrm{air}} C_D v^2 A \cos (\theta)$$ (7) where ρair is density of air (=1.25 kg/m3), CD is drag coefficient = 1.2, A is projected area (=95×15 m2 for deck and 15× 20.24 m2 for legs). The total aerodynamic load on the deck and the legs is calculated with respect to mean sea level and summarized in Table 4.
Table 4 Wind force coefficientsDirection Structure Surge (N/(m/s)2) Sway (N/(m/s)2) Roll (N·m/(m/s)2) Pitch (N·m/(m/s)2) 0° Deck 1 029.42 0 0 1 822.07 Legs 219.32 0 0 388.19 30° Deck 891.5 514.7 −911 1 577.95 Legs 189.93 109.66 −194 336.17 60° Deck 514.71 891.5 −1 577.95 911.03 Legs 109.66 189.93 −336.17 194.09 90° Deck 0 1 029.42 −1 822.07 0 Legs 0 219.32 −388.19 0 120° Deck −514.71 891.5 −1 577.95 −911.03 Legs −109.66 189.93 −336.17 −194.09 150° Deck −891.5 514.71 −911.03 −1 577.95 Legs −189.93 109.66 −194.09 −336.17 JONSWAP spectrum (Figure 5) depending on the fetch and wind speed is used for wave load and given below:
$$S(\omega)=\frac{\alpha g^2 \gamma^a}{\omega^5} e^{-\left(\frac{5 \omega_p^4}{4 \omega^4}\right)}$$ (8)  Figure 5 Wave Spectral plots for different load cases
ωp is the peak frequency in rad/s, γ is the peak enhancement factor and α is a constant that relates to the wind speed and the peak frequency of the wave spectrum
$$a=\exp \left\{-\frac{\left(\omega-\omega_p\right)^2}{2 \sigma^2 \omega_p^2}\right\}$$ (9) $$\sigma=\left\{\begin{array}{l}0.07 \text { for } \omega \leqslant \omega_p \\ 0.09 \text { for } \omega>\omega_p\end{array}\right.$$ (10) Because α is a constant, the integration of this spectrum can be expressed as below:
$$M_0=\int_0^{\infty} S(\omega) \mathrm{d} \omega=\alpha \int_0^{\infty} \frac{\alpha g^2 \gamma^a}{\omega^5} e^{-\left(\frac{5 \omega_p^4}{4 \omega^4}\right)} \mathrm{d} \omega=\left\{\frac{H_s}{4}\right\}^2$$ (11) In the present study, current is considered a three-point profile, i.e., surface speed, the speed at the midpoint, and zero speed at a depth of 40% to 80% of the draft for all three load cases. Free oscillation tests are conducted to estimate damping using the logarithmic decrement method. The natural periods and damping ratios of the platform under intact tendon condition is compared with Chandrasekaran and Nagavinothini (2018) for validation and summarized in Table 5.
Table 5 Natural periodsActive-degrees-of-freedom Intact condition (Present study) Chandrasekaran and Nagavinothini (2018) Natural periods (s) Damping ratio (%) Natural periods (s) Damping ratio (%) Surge 221.4 5.38 215 5.14 Sway 222.3 5.16 215.4 5.03 Heave 3.45 0.58 4.3 0.51 Roll 4.1 6.4 6.2 6.23 Pitch 4.3 6.28 6.1 6.08 Yaw 219.7 5.9 215.9 5.68 4 Results and discussions of the deck and legs under intact and postulated failure conditions
Table 6 indicates the tendon tension variation for different heading angles under load case-C. For a heading angle of 0°, the maximum tendon tension variation is approximately 39.5 MN for tendons T9 and T11 under leg-3. Regarding heading angles 120° and 150°, the maximum tension variation occurs for tendons T1 and T3 under leg-1, measuring about 38.9 MN and 39.4 MN, respectively. Based on these findings, it can be concluded that the tendons under leg-3 are more critical for a heading angle of 0° than other heading angles.
Table 6 Tendons tension variation for different heading angles under LC-CHeading angle Statistics Tether tension under each leg (MN) Leg-1 Leg-2 Leg-3 T1 T2 T3 T4 T5 T6 T7 T8 T9 T10 T11 T12 0° Max 38.8 38.7 38.8 38.7 38.8 38.7 38.8 38.7 39.5 39.3 39.5 39.3 Min 12.6 12.5 12.6 12.5 12.6 12.5 12.6 12.5 14.8 13.7 14.6 13.8 30° Max 37.5 37.4 37.5 37.4 37.5 37.4 37.5 37.4 38.6 38.4 38.6 38.4 Min 12.1 11.9 12.1 11.9 12.1 11.9 12.1 11.9 12.2 11.8 12.2 11.8 60° Max 37.9 37.8 37.9 37.8 37.9 37.8 37.9 37.8 38.7 38.3 38.7 38.3 Min 13.5 12.9 13.6 12.9 13.5 12.9 13.6 12.9 10.6 11.9 10.4 11.4 90° Max 37.4 37.3 37.4 37.3 38.2 38.1 38.2 38.1 38.3 38.1 38.3 38.1 Min 10.2 9.9 10.2 9.9 9.4 8.7 9.4 8.7 8.3 8.9 8.3 8.9 120° Max 38.9 38.8 38.9 38.8 38.7 38.6 38.7 38.6 38.8 38.7 38.8 38.7 Min 13.4 12.7 13.4 12.7 12.9 12.8 12.9 12.8 13.4 13.1 13.4 13.1 150° Max 39.4 39.3 39.4 39.3 39.1 39.0 39.1 39.0 39.3 39.2 39.3 39.2 Min 13.1 12.8 13.1 12.8 12.2 12.4 12.2 12.4 13.7 12.9 13.4 12.9 The numerical analysis is carried out for intact and postulated failure of tendons under the combined wind, wave, and current. In the present study, the tendons (9, 11) in leg-3 are selected as postulated failure tendons due to subjecting of more tendon tension force by their geometric location. The AQWA-LIBRIUM is used to assess the equilibrium position of the platform under intact and postulated failure conditions. The static stability is assessed through an eigenvalue analysis of the global stiffness matrix at equilibrium. The global stiffness matrix is non-linear and comprises of terms arising from the hydrostatic pressure, tendon tension and stiffness due to the heading variation in wind, current and wave drifting forces and moments. In each step of the iterative solver, K, F are updated to determine the static equilibrium position:
$$\boldsymbol{X}_{j+1}=\boldsymbol{X}_j+\boldsymbol{K}^{-1}\left(\boldsymbol{X}_j\right) \boldsymbol{F}\left(\boldsymbol{X}_j\right)$$ (12) Xj is the position of the body in each degree of freedom (DOF), K is the stiffness matrix of the system, and F is the force matrix. The above equation is under program control to get precise equilibrium positions of the bodies and extracts the eigenvalues of the linearized stiffness matrix at equilibrium by the standard Jacobi successive rotation method.
$$\boldsymbol{K} \boldsymbol{X}-\lambda \boldsymbol{X}=0$$ (13) While the positive eigenvalues (λ) imply stable equilibrium, negative and zero eigenvalues imply unstable and neutral stability. Table 7 shows the equilibrium positions of the legs and deck for intact and postulated failure conditions. Due to the postulated failure of tendons (9, 11) in leg-3, the equilibrium position of deck and L-3 are shifted from 27.74 m to 28.45 m and −112.74 m to −111.17 m in heave degree, respectively. The differential heave motion in legs leads to the deck's pitch mean position from 0° to − 1.4°. The corresponding hydrostatic parameters computed from the diffraction analysis are summarized in Table 8.
Table 7 Equilibrium position under intact and postulated failure condition of tendonsDOF Deck Buoyant leg, L-1 Buoyant leg, L-2 Buoyant leg, L-3 (Tendons postulated failure leg) Intact Postulated failure Intact Postulated failure Intact Postulated failure Intact Postulated failure Surge (m) 0 −0.18 −17.83 −17.83 −17.831 −17.829 35.66 35.66 Sway (m) 0 0 30.88 30.88 −30.88 −30.88 0 0 Heave (m) 27.74 28.45 −112.74 −112.74 −112.74 −112.74 −112.74 −111.17 Roll (°) 0 0 0 0 0 0 0 0 Pitch (°) 0 −1.4 0 0 0 0 0 0 Yaw (°) 0 0 0 0 0 0 0 0 Table 8 Hydrostatic parameters of buoyant legsDescription Value Hydrostatic heave stiffness (MN/m) 1.8 Hydrostatic roll stiffness (MN·m/(°)) 171 Hydrostatic pitch stiffness (MN·m/(°)) 171 Cut water plane area (m2) 176.7 Ix, Iy(m4) 2 485.1, 2 485.0 Distance from CoG to CoB (m) −35.74 Metacentric height GMX, GMY (m) 35.83, 35.83 Distance from CoB to Metacentre BMX, BMY (m) 0.09, 0.09 Table 9 shows the natural periods of the deck under intact and postulated failure of tendons. It is observed that the natural surge periods in both conditions are marginally different. The heave and pitch periods increase under postulated failure due to a decrease in the tendon stiffness. The heave damping ratio is significantly low compared to other degrees of freedom by its geometric configuration. It is important to note that triceratops is stiff in heave degree by its geometry, and hence damping provided by geometry is lower. The time response analysis is carried out under all three load cases (wind+wave+current) with a heading angle of 0°, 30°, 60°, 90°, 120°, and 150° for a water depth of 2 400 m with a freeboard of 20.24 m. The simulation time taken for the analysis is 2000 s with a time step of 0.1 s.
Table 9 Natural periods in intact and postulated failure condition of tendonsDOF Intact condition Postulated failure condition Natural periods (s) Natural frequency (rad/s) Damping ratio (%) Natural Periods (s) Natural frequency (rad/s) Damping ratio (%) Surge 221.4 0.028 3 5.38 228.6 0.027 48 5.14 Sway 222.3 0.028 2 5.16 229.0 0.027 4 5.03 Heave 3.45 1.821 2 0.58 3.7 1.698 1 0.51 Roll 4.1 1.532 4 6.4 4.89 1.284 9 6.23 Pitch 4.3 1.402 4 6.28 5.51 1.140 3 6.08 Yaw 219.7 0.028 5 5.9 227.4 0.027 63 5.68 In the present study, the response plots of the deck are drawn for load case-C under 0° and 60° heading angles. The legs and deck responses for all load cases of 0°, 30°, 60°, 90°, 120°, and 150° are tabulated in Table 13 to Table 20, respectively. Time history and the phase plots of the platform deck are plotted for a heading angle of 0° and 60° under loading condition C. Figure 6 shows deck phase plots for the 60° under the intact and postulated failure of tendons. It is seen that the surge and sway mean shifted from 41.54 m to 44.8 m and 64.2 m to 68.9 m, respectively; the mean heave displacement is increased to 0.55 m. A significant shift in the pitch mean (−4.5°) is also noticed under the postulated failure of tendons. A mean shift in the yaw response from negative to positive under the intact and postulated failure conditions (−6.9° to 10.2°) is also observed.
 Figure 6 Phase plots for 60° heading under intact and postulated failure condition of tendons for LC-C
Figure 7 demonstrates the time response of the deck for 0° heading under the intact and postulate failure of chosen tendons. The maximum offset of the deck is 79.4 m and 84.5 m, which is about 3.3% and 3.5% of the water depth, and the set down is 3.04 m to 4.12 m, respectively. Due to the platform surge and coupled heave motion, tether tension variation is caused. Under the imbalanced tension in each leg, differential heave sets-in, resulting in pitch motion. The maximum pitch response is about 1.8° under the postulated failure condition of tendons. The power spectral density (PSD) plots for 0° heading under load case-C in intact and postulated failure conditions are shown in Figure 8. The maximum surge PSD in intact and postulated failure conditions are 4 800 m2·s and 5 400 m2·s. The maximum heave PSD peaks are noticed at the frequencies of 1.9 rad/s and 1.78 rad/s, respectively, under intact and postulated failure conditions of tendons due to the heave natural frequencies of 1.82 rad/s and 1.7 rad/s. The maximum heave amplitudes are about 5 m2·s and 5.9 m2·s for intact and postulated failure conditions. The first maximum heave peaks are observed within the frequency band of 0.02 to 0.03 rad/s, closely aligned with the surge natural frequency. This observation suggests a high coupling between surge and heave. Under the intact condition, the maximum pitch peak amplitude is about 0.9 (°)2·s, and the corresponding frequency is about 1.42 rad/s. Also noticed a significant increase in pitch peak amplitude of 6 (°)2·s at the frequency of 1.16 rad/s under postulated failure condition. In both conditions, the maximum pitch peaks are observed nearer to the pitch natural frequencies. Smaller peaks are noticed for surge, heave and pitch PSDs around the frequency of 0.4 rad/s, close to the forcing frequency of 0.37 rad/s. The smaller peaks are also noticed for postulated failure conditions in both heave and pitch PSDs due to the sudden change in the tendon tension.
 Figure 7 Deck responses for 0° heading under the intact and postulated failure condition of tendons for LC-C
 Figure 8 PSD plots for 0° heading under intact and postulated failure condition for LC-C
Figure 9 illustrates the shifting of the deck heave mean position under load case-C for different heading angles with respect to the heave equilibrium position under intact and postulated failure conditions. The maximum and minimum difference in heave mean shift for intact and postulated failure conditions is about 0.85 m and 0.3 m under a heading angle of 150° and 0°, respectively. Table 13 shows the deck responses for all the load cases for 0°, 30°, 60°, 90°, 120°, and 150° under intact and postulated failure. For 30°, the maximum surge response for load case-1, 2, 3 is 26 m, 46 m, 66 m, 28.8 m, 51.2 m, and 72.8 m, respectively. In terms of water depth, it is about 1.08%, 1.91%, 2.75%; 1.2%, 2.13%, 3.03%, respectively. For 120° heading, the minimum surge response is −16.04 m, −29.96 m, −44.0 m, and − 18.75 m, − 34.9 m, − 49.02 m. In terms of water depth, it is about 0.66%, 1.24%, 1.8% and 0.78%, 1.45%, 2.04% of water depth, respectively.
 Figure 9 Deck heave mean position under different heading angles for load case-C in intact and postulated failure conditions
The dynamic responses of the legs are measured from their static equilibrium positions in all six degrees of freedom. The surge response of the legs-1, 2, 3 is measured from −17.831 4 m, −17.831 4 m, and 35.663 m along the surge axis, as shown in Table 7. Tables 15 ‒ 20 show the legs' responses under all three load cases with a heading angle of 0°, 30°, 60°, 90°, 120°, and 150° for intact and postulated failure condition of tendons. It's noticed that the max surge response of L-3 under 0° heading for a load case-C is about 114.8 m and 124.8 m, respectively, in intact and failure conditions of tendons. It shows that the deck and legs are monolithic in the translational degree of freedom. The maximum pitch response of the legs under 0° heading for a load case-C in the intact and postulated failure condition of tendons is 4.18° and 5.96°, respectively; therefore, the deck and the legs undergo different rotations due to the presence of ball joints. The sway response is activated for other than 0° heading angles. The maximum sway responses are about 79.8 m and 81.4 m, respectively, from its static equilibrium position for a load case-C with 90° heading under intact and postulated failure condition of tendons. The maximum yaw response of L-3 is about 8.2° for a heading angle of 60° under load case-C in the postulated failure condition of tendons.
5 Dynamic tension variation in tendons
The tension variation of tendons under load case-C with 0° heading is shown in Figure 10. Under the intact condition, the mean tension of tendon-3 and tendon-7 of leg-2 and leg-3 are 22.7 MN. While the mean tension of tendon-3 remains the same, tension of tendon-10 under leg-3 is increased to 46 MN when tendons postulated failure resulting in a significant shift of mean tension variation. Table 10 shows the stress range variation under intact and postulated failure conditions of tendons for all load cases with 0°, 30°, 60°, 90°, 120°, and 150°. It is noticed that the maximum stress is observed under the 0° heading for all load cases in both intact and postulated failure conditions of tendons. Table 11 represents the percentage increase in stress for adjacent tendons under L-3 for postulated failure conditions in all heading angles. It is seen that for 0° and 120° heading angles, the maximum percentage increase in stress of about 95.7% and 73.3%, respectively.
 Figure 10 Tendon tension variation under the intact and postulated failed conditions of tendonsTable 10 Tendons stress variation under Leg-3
Heading angle Load case Stress (N/mm2) Intact Postulated failure Max Min Max Min 0° LC-A 170.43 84.48 385.5 75.61 LC-B 224.4 57.93 442.6 83.65 LC-C 234.6 87.88 459.2 95.0 30° LC-A 151.63 56.42 370.25 70.89 LC-B 118.28 48.29 411.7 77.2 LC-C 227.9 72.6 425.3 67.1 60° LC-A 155.77 41.12 362.8 45.14 LC-B 220.3 54.9 401.7 79.46 LC-C 229.7 63.01 407.8 45.8 90° LC-A 151.38 46.31 358.4 42.8 LC-B 119.7 62.9 379.4 50.8 LC-C 227.5 49.6 394.6 69.3 120° LC-A 151.32 51.55 362.4 49.8 LC-B 120.8 71.2 383.6 60.8 LC-C 230.4 79.5 399.3 78.42 150° LC-A 151.38 72.24 373.4 52.7 LC-B 122.9 59.4 401.7 70.34 LC-C 234.32 81.6 411.5 81.9 Table 11 The maximum increase in stress for adjacent tendons closer to the postulated failure tendons under L-3Heading angle Max increase in stress in adjacent tendons (%) 0° 95.7 30° 86.6 60° 77.53 90° 73.4 120° 73.3 150° 75.6 Table 12 Fatigue life of tendons under legsLoad case Tendons under legs Fatigue life under intact condition (Year) Fatigue life under postulated failure condition (Year) Reduction in fatigue life (%) LC-A L-1, 2 9.68 9.37 3.202 L-3 8.93 0.529 94.076 LC-B L-1, 2 6.71 6.28 6.408 L-3 6.01 0.039 99.351 LC-C L-1, 2 4.95 4.53 8.484 L-3 4.28 0.0061 99.857 Table 13 Deck response under the intact conditionsHeading angle Statistics Surge (Offset) Sway (Offset) Heave (Set down) Roll Pitch Yaw LC-A LC-B LC-C LC-A LC-B LC-C LC-A LC-B LC-C LC-A LC-B LC-C LC-A LC-B LC-C LC-A LC-B LC-C 0° Max 33.40 58.00 82.71 0.02 0.00 0.00 28.29 28.35 28.35 0.00 0.00 0.00 0.13 0.20 0.67 0.00 0.03 0.00 Min −0.16 0.00 0.00 −0.01 −0.23 0.00 25.60 25.40 23.80 0.00 −0.01 0.00 −0.11 0.31 −0.57 −0.04 −0.24 0.00 Mean 29.84 52.00 79.10 0.00 −0.03 0.00 26.71 26.20 24.80 0.00 0.00 0.00 0.01 −0.01 0.09 −0.01 −0.03 0.00 St. deviation 5.04 9.33 13.60 0.00 0.05 0.00 0.31 0.86 1.69 0.00 0.00 0.00 0.03 0.17 0.04 0.01 0.05 0.00 30° Max 26.00 46.00 66.00 16.48 28.69 40.02 28.30 28.34 28.34 0.23 0.32 0.27 0.14 0.31 0.50 0.74 0.17 0.15 Min −0.22 0.00 0.00 −0.13 0.00 0.00 26.34 25.94 25.14 −0.24 −0.34 −0.41 −0.13 −0.21 −0.30 −1.70 −4.30 −4.36 Mean 25.88 45.60 65.20 14.68 25.67 35.80 26.90 27.10 25.34 0.00 −0.02 −0.05 0.01 0.02 0.02 −0.46 −1.14 −1.87 St. deviation 4.40 8.21 12.08 2.49 4.54 6.33 0.30 0.87 1.69 0.06 0.08 0.11 0.04 0.11 0.11 0.42 0.77 0.66 60° Max 16.40 31.88 46.80 27.50 47.75 68.23 28.45 28.34 28.34 0.10 0.52 0.80 0.05 0.16 0.30 0.00 0.00 3.20 Min −0.19 0.00 0.00 −0.32 0.00 0.00 26.37 25.94 25.12 −0.08 −0.51 −0.56 −0.10 −0.34 −0.51 −2.24 −5.89 −8.26 Mean 14.64 28.48 41.54 24.57 42.48 64.20 27.18 26.87 25.33 0.00 −0.06 −0.13 −0.02 −0.08 0.12 −1.89 −4.88 −6.93 St. deviation 2.51 5.35 8.05 4.14 7.25 10.30 0.23 0.81 1.58 0.02 0.13 0.09 0.02 0.09 0.07 0.37 1.21 1.62 90° Max 0.00 0.00 0.00 31.58 57.51 81.35 28.34 28.34 28.34 0.07 0.12 0.24 0.13 0.35 0.50 3.06 7.06 7.95 Min −0.64 −4.44 −7.00 0.00 0.00 0.00 25.62 25.50 23.84 −0.10 −0.60 −0.41 −0.11 −0.19 −0.13 −0.16 −0.11 −0.04 Mean −0.46 −3.18 −5.76 28.61 51.34 72.75 26.75 26.31 24.83 −0.02 −0.06 −0.08 0.01 0.06 0.17 1.66 4.07 6.33 St. deviation 0.12 1.02 1.81 4.74 9.12 13.23 0.27 0.83 1.63 0.03 0.12 0.10 0.04 0.09 0.11 0.43 1.02 1.30 120° Max 16.04 29.96 44.00 23.69 46.70 66.80 28.35 28.34 28.43 0.06 0.50 0.84 0.04 0.29 0.19 0.05 0.97 2.40 Min 0.70 0.20 0.94 0.00 0.00 −0.58 26.33 25.89 25.20 −0.08 −0.60 −0.43 −0.04 −0.35 −0.12 −0.05 −0.34 −8.40 Mean 14.56 26.64 42.50 25.12 45.28 63.20 26.91 26.10 25.40 −0.01 −0.04 0.12 −0.01 −0.02 −0.02 0.00 0.18 0.08 St. deviation 2.41 4.78 7.10 4.16 8.11 12.47 0.28 0.87 1.85 0.02 0.13 0.31 0.01 0.07 0.05 0.02 0.29 0.05 150° Max 0.00 0.00 0.61 16.08 29.41 44.18 28.30 28.30 28.31 0.11 0.32 0.40 0.08 0.49 0.40 0.58 0.17 0.68 Min 0.00 0.00 0.00 0.00 0.00 0.00 0.00 0.00 0.00 0.00 0.00 0.00 0.00 0.00 0.00 0.00 0.00 0.00 Mean −27.48 −47.20 −70.00 0.00 0.00 −0.35 26.35 26.03 25.30 −0.12 −0.35 −0.42 −0.10 −0.55 −0.48 −1.88 −5.07 −4.20 St. deviation −24.80 −42.40 −61.20 14.56 26.34 38.80 27.01 26.75 25.45 0.00 −0.01 0.01 0.00 −0.04 −0.08 −0.37 −1.46 −2.13 Table 14 Deck response under postulated failure conditionsHeading angle Statistics Surge (Offset) Sway (Offset) Heave (Set down) Roll Pitch Yaw LC-A LC-B LC-C LC-A LC-B LC-C LC-A LC-B LC-C LC-A LC-B LC-C LC-A LC-B LC-C LC-A LC-B LC-C 0° Max 34.24 63.20 88.80 0.10 2.24 0.02 29.11 29.10 29.19 0.01 0.01 0.05 0.83 1.98 1.76 0.09 0.09 2.96 Min 0.00 0.00 −0.72 −0.12 0.00 −0.11 23.59 23.46 22.89 0.00 0.00 −0.04 −1.90 −2.40 −2.98 −0.03 −0.06 0.00 Mean 31.04 56.40 83.90 0.00 1.81 −0.01 26.80 26.40 24.65 0.00 0.12 0.00 −1.60 −1.69 −1.86 0.00 0.00 2.44 St. deviation 5.10 10.03 14.27 0.04 0.49 0.03 0.39 1.05 1.87 0.00 0.16 0.02 0.59 1.08 0.83 0.02 0.02 0.41 30° Max 28.88 51.20 72.80 20.20 39.17 55.19 29.12 29.08 29.04 0.54 1.96 1.73 0.89 2.58 2.78 9.46 11.60 11.21 Min −0.08 0.00 −0.64 0.00 0.00 −0.35 26.80 25.84 25.06 −0.12 −0.89 −0.42 −2.03 −3.13 −3.09 −0.19 −0.31 0.00 Mean 23.52 40.80 57.60 18.28 35.08 49.13 26.89 26.30 25.01 277.00 0.58 0.75 −1.67 −1.72 −1.92 7.94 9.17 9.00 St. deviation 3.56 6.57 9.80 3.26 6.78 9.34 0.36 0.95 1.71 0.10 0.35 0.35 0.59 1.13 0.84 1.62 1.66 1.37 60° Max 19.40 35.80 50.12 29.48 55.76 72.50 29.24 29.11 29.12 0.28 1.89 1.12 1.23 2.23 2.57 6.37 10.37 12.08 Min −0.03 0.00 −0.02 0.00 0.00 −0.64 25.43 25.12 24.12 −0.15 −0.98 −0.77 −2.40 −3.32 −6.03 −0.32 −0.29 −4.80 Mean 16.80 31.04 44.80 26.76 50.12 68.90 26.70 26.40 24.78 0.04 0.10 0.56 −1.61 −2.30 −3.20 2.97 7.80 10.20 St. deviation 3.33 4.19 6.32 4.43 4.94 5.61 0.35 0.90 1.67 0.06 0.33 0.28 0.54 0.95 0.75 0.96 2.81 4.14 90° Max 4.32 5.88 0.00 32.10 60.90 84.60 29.12 29.13 29.08 0.19 1.56 1.67 0.68 1.36 1.63 4.69 13.20 14.01 Min −0.38 −0.03 −3.67 0.00 0.00 0.00 23.61 23.50 22.92 −0.26 −1.17 −0.69 −3.42 −3.70 −3.28 −0.18 −0.39 −1.20 Mean 3.40 2.76 −3.08 22.24 50.90 64.20 26.94 26.30 24.37 −0.05 −0.04 0.27 −1.49 −1.65 −2.03 3.10 9.40 10.80 St. deviation 1.22 1.07 0.67 3.10 8.39 3.74 0.27 0.71 0.47 0.06 0.36 0.37 0.61 0.92 0.45 4.20 3.40 3.64 120° Max 18.75 34.90 49.02 27.76 50.78 72.40 29.11 29.06 29.06 0.39 1.20 1.32 1.23 1.33 2.70 3.15 8.70 11.80 Min 0.00 0.00 0.00 0.00 0.00 0.00 25.41 25.23 24.04 −0.24 −1.41 −0.70 −3.13 −4.35 −6.28 −1.23 −2.70 −4.17 Mean 14.89 27.90 40.80 21.28 34.48 60.87 26.80 26.32 24.65 0.14 0.18 0.62 −1.80 −2.13 −3.70 2.80 7.40 11.38 St. deviation 3.90 6.94 10.07 3.10 5.08 8.35 26.80 0.48 0.98 0.09 0.54 1.03 0.69 1.15 2.79 1.80 4.28 6.78 150° Max 0.00 0.00 0.00 14.33 25.25 32.51 29.12 29.09 29.07 0.35 1.57 1.65 1.61 2.06 2.67 2.02 2.08 2.26 Min −21.92 −36.44 −45.60 0.00 0.00 0.00 25.23 25.04 24.19 −0.26 −1.21 −0.82 −3.40 −3.30 −3.73 −6.20 −7.46 −8.39 Mean −19.32 −29.60 −40.40 12.91 21.15 28.08 26.79 26.20 24.60 0.13 0.58 1.18 −1.80 −2.06 −2.80 −5.78 −6.61 −6.89 St. deviation 2.63 4.24 5.25 1.93 3.22 4.14 0.29 0.46 0.62 0.09 0.40 0.39 0.82 0.73 0.67 1.92 3.16 3.15 Table 15 Leg-1 responses under intact conditionsHeading angle Statistics Surge (Offset) Sway (Offset) Heave (Set down) Roll Pitch Yaw LC-A LC-B LC-C LC-A LC-B LC-C LC-A LC-B LC-C LC-A LC-B LC-C LC-A LC-B LC-C LC-A LC-B LC-C 0° Max 21.7 43.8 114.8 30.8 30.9 30.8 112.1 112.1 112.1 0.0 0.0 0.0 2.2 3.6 4.5 0.1 0.0 0.0 Min −17.8 −17.8 35.7 −30.9 −31.3 −30.8 −114.2 −114.0 −116.0 0.0 0.0 0.0 −0.1 0.0 0.0 −0.1 −0.1 0.0 Mean 18.9 38.6 109.8 −30.8 −30.9 −30.8 −113.2 −113.8 −115.4 0.0 0.0 0.0 1.6 2.7 3.4 0.0 0.0 0.0 St. deviation 4.6 8.8 13.2 0.0 0.1 0.0 0.3 0.7 1.6 0.0 0.0 0.0 0.2 0.3 0.4 0.0 0.0 0.0 30° Max 17.8 37.8 79.0 −13.2 0.7 11.2 −112.1 −112.1 −112.1 0.1 0.0 0.0 2.0 3.2 3.9 0.4 0.2 1.4 Min −17.8 −17.8 35.7 −30.8 −30.8 −30.8 −113.0 −114.2 −115.0 −1.1 −1.8 −2.3 −0.2 0.0 0.0 −0.6 1.2 −1.4 Mean 15.4 33.1 72.4 −12.5 −2.4 8.9 −113.2 −113.5 −114.9 −0.8 −1.3 −1.6 1.4 2.3 3.0 0.0 −0.8 −0.3 St. deviation 4.0 7.8 11.7 5.7 10.7 15.4 0.3 0.8 1.6 0.1 0.2 0.2 0.2 0.3 0.4 0.2 −0.1 0.5 60° Max 2.30 14.075 52.080 −4.30 16.450 36.280 −112.0 −112.0 −112.0 0.27 0.00 0.00 1.18 1.75 2.20 0.64 0.12 0.00 Min −18.0 −17.80 35.660 −31.0 −30.90 −30.80 −113.0 −116.0 −117.74 −2.00 −3.16 −4.0 −0.16 0.00 0.00 −0.57 −2.28 −2.72 Mean −8.70 11.900 48.750 −3.40 12.800 32.890 −113.0 −113.5 −115.0 −1.40 −2.24 −2.83 0.82 1.24 1.54 0.04 −1.20 −1.76 St. deviation 5.51 8.900 17.640 9.50 9.890 20.450 0.248 0.72 1.460 0.24 0.31 0.38 0.13 0.17 0.20 0.14 0.48 0.51 90° Max −17.4 −17.30 35.66 2.60 26.70 51.00 −112.0 −112.0 −112.00 0.00 0.00 0.00 0.06 0.17 0.23 0.31 1.96 2.33 Min −18.0 −25.50 19.16 30.80 −30.80 −30.40 −113.7 −114.0 −115.52 −2.04 −3.52 −4.44 −0.08 −0.11 −0.10 −0.24 −0.36 −0.24 Mean −18.0 −23.00 22.10 1.20 24.80 47.30 −113.0 −113.8 −114.69 −1.48 −2.51 −3.18 0.00 0.04 0.06 0.02 1.14 1.54 St. deviation 0.22 2.08 4.33 10.80 21.40 24.50 0.22 0.715 1.490 0.21 0.34 0.42 0.02 0.04 0.06 0.08 0.47 0.56 120° Max −18.8 −17.80 35.80 −2.80 20.900 44.800 −112.0 −112.0 −112.00 0.00 0.00 0.26 0.00 0.00 0.15 0.54 1.28 1.59 Min −33.0 −47.9 −9.7 −30.8 −30.8 −31.2 −113 −114.6 −115.30 −1.76 −3.08 −4.40 −1.00 −1.68 −2.64 −0.52 −0.56 −0.84 Mean −29.8 −37.3 17.8 −18.6 15.96 37.5 −113.0 −114.0 −114.9 −1.32 −2.24 −2.96 −0.76 −1.28 −1.68 0.02 0.23 0.20 St. deviation 5.5 11.25 17.15 9.6 19.13 30.15 0.23 0.76 1.720 0.17 0.28 0.41 0.10 0.17 0.24 0.13 0.28 0.45 150° Max −17.8 −17.8 35.7 −14.3 0.7 16.8 −112.0 −112.0 −112.00 0.00 0.00 0.10 0.00 0.00 0.19 0.37 0.03 0.03 Min −45.3 −64.9 −34.8 −30.9 −30.8 −31.3 −113.3 −113.5 −115.20 −0.98 −1.56 −2.37 −1.72 −2.94 −4.32 −0.59 −2.09 −3.20 Mean −32.8 −56.7 3.8 20.4 −6.7 5.47 −113.0 −113.2 −114.2 −0.78 −1.22 −1.58 −1.35 −2.23 −2.96 −0.16 −1.02 −1.32 St. deviation 9.42 8.47 26.8 5.55 11.0 17.55 0.22 0.66 1.53 0.10 0.14 0.20 0.17 0.27 0.40 0.14 0.36 0.52 Table 16 Leg-1 responses under postulated failure conditionsHeading angle Statistics Surge (Offset) Sway (Offset) Heave (Set down) Roll Pitch Yaw LC-A LC-B LC-C LC-A LC-B LC-C LC-A LC-B LC-C LC-A LC-B LC-C LC-A LC-B LC-C LC-A LC-B LC-C 0° Max 24.80 49.70 71.30 30.98 30.89 30.89 −112.0 −112.0 −112.0 0.01 0.14 0.04 2.24 3.90 5.36 0.05 0.42 0.9 Min −17.80 −17.8 −17.80 30.86 30.61 30.89 −114.0 −113.0 −115.6 −0.02 −0.04 −0.08 0.00 0.00 −0.28 −0.08 −0.20 −0.12 Mean 19.40 45.20 62.80 30.88 30.82 30.88 −114.3 −114.7 −116.8 0.00 0.05 0.00 1.76 2.92 3.68 0.00 0.12 0.00 St. deviation 11.94 7.80 32.93 0.01 0.12 0.00 0.31 0.85 1.73 0.00 0.02 0.01 0.21 0.34 0.49 0.03 0.04 0.05 30° Max 8.90 28.40 47.80 50.90 69.80 86.75 −111.8 −112.0 −112.0 0.00 0.00 0.12 1.68 3.20 4.40 0.45 0.68 0.81 Min −18.20 −17.8 −17.80 30.70 30.89 30.89 −113.4 −116.0 −117.0 −0.96 −1.36 −1.91 0.00 0.00 −0.20 −0.41 −0.24 −0.17 Mean −4.80 10.80 34.80 43.70 57.30 77.10 −114.0 −114.6 −116.4 −0.76 −1.04 −1.36 1.28 2.32 3.00 0.42 0.62 0.71 St. deviation 10.56 19.97 19.84 5.78 11.70 15.67 0.28 0.72 1.50 0.08 0.11 0.16 0.16 0.30 0.43 0.32 0.87 1.10 60° Max −7.20 1.30 25.40 61.40 86.20 109.80 −111.7 −111.8 −111.9 0.00 0.00 0.08 0.96 2.24 3.60 1.02 1.24 1.54 Min −18.10 −17.8 −17.80 30.25 30.88 30.88 −113.8 −116.3 −117.0 −1.64 −2.54 −3.64 0.00 0.00 −0.04 −0.36 −0.92 −1.39 Mean −1.40 −9.70 12.40 56.20 73.50 94.10 −113.3 −114.3 −115.8 −1.36 −2.08 −2.76 0.72 1.56 1.92 0.73 0.84 1.06 St. deviation 6.02 13.96 20.86 9.95 17.35 25.90 0.30 0.75 1.64 0.15 0.21 0.31 0.08 0.27 0.35 0.41 0.90 0.47 90° Max −17.80 −17.8 −17.50 62.80 91.40 110.40 −111.8 −111.7 −111.8 0.00 0.00 4.16 0.36 0.40 0.24 0.30 0.97 1.70 Min −21.20 −30.3 −37.30 30.88 30.88 30.89 −113.7 −115.5 −114.4 −1.92 −3.02 −3.02 −0.16 −0.20 −3.80 −1.01 −1.50 −1.62 Mean −19.60 −27.0 −33.80 54.90 84.10 101.47 −114.2 −114.6 −115.8 −1.52 −2.26 3.03 0.08 −0.04 −0.06 −0.70 −1.10 −1.24 St. deviation 0.42 2.71 4.68 10.84 21.30 32.23 0.26 0.62 0.23 0.17 0.33 0.92 0.08 0.07 0.49 0.64 0.88 1.20 120° Max −17.80 −17.8 −15.60 53.70 71.08 90.80 −111.0 −111.0 −111.0 0.00 0.00 7.42 0.09 0.06 1.63 1.03 1.26 1.60 Min −29.40 −38.5 −54.80 30.88 30.88 31.27 −112.7 −115.0 −117.8 −3.71 −6.04 −9.62 −2.24 −7.83 −8.87 −0.74 −1.62 −1.98 Mean −18.70 −77.20 −35.40 46.20 62.40 80.70 −113.2 −113.9 −115.4 −2.97 −4.27 −4.06 −1.41 −5.06 −3.52 0.55 −1.20 −1.64 St. deviation 6.02 12.60 17.98 10.20 8.57 7.40 0.19 0.36 1.14 0.32 0.78 3.28 0.23 1.75 1.58 1.30 1.60 1.21 150° Max −17.80 −17.8 −16.6 46.80 58.30 64.2 −111.0 −111.0 −111.0 0.00 0.00 0.0 0.07 0.03 0.01 2.37 0.51 0.34 Min −42.80 −55.7 −69.4 30.88 30.88 30.62 −113.5 −115. −115.0 −2.08 −3.47 −4.67 −3.46 −6.17 −8.78 −12.30 −14.50 −17.2 Mean −71.59 −40.1 −58.41 41.70 49.74 57.9 −112.9 −113.7 −115.6 −1.64 −2.20 −2.51 −2.60 −4.04 −4.79 −8.23 −10.40 −14.2 St. deviation 9.47 18.24 27.5 5.56 12.94 18.93 0.23 0.34 0.4 0.18 0.34 0.43 0.31 0.61 0.89 4.60 3.22 3.4 Table 17 Leg-2 responses under intact conditionsHeading angle Statistics Surge (Offset) Sway (Offset) Heave (Set down) Roll Pitch Yaw LC-A LC-B LC-C LC-A LC-B LC-C LC-A LC-B LC-C LC-A LC-B LC-C LC-A LC-B LC-C LC-A LC-B LC-C 0° Max 21.7 43.8 114.8 −30.8 −30.9 −30.8 −112. −112.1 −112.1 0.0 0.0 0.0 2.2 3.6 4.5 0.1 0.0 0.0 Min −17.8 −17.8 35.7 −30.9 −31.3 −30.8 −114 −114.0 −116.0 0.0 0.0 0.0 −0.1 0.0 0.0 −0.1 −0.1 0.0 Mean 18.9 38.6 109.8 −30.8 −30.9 −30.8 −113. −113.8 −115.4 0.0 0.0 0.0 1.6 2.7 3.4 0.0 0.0 0.0 St. deviation 4.6 8.8 13.2 0.0 0.1 0.0 0.3 0.7 1.6 0.0 0.0 0.0 0.2 0.3 0.4 0.0 0.0 0.0 30° Max 17.8 37.8 79.0 −13.2 0.7 11.2 −112. −112.1 −112.1 0.1 0.0 0.0 2.0 3.2 3.9 0.4 0.2 1.4 Min −17.8 −17.8 35.7 −30.8 −30.8 −30.8 −113. −114.2 −115.0 −1.1 −1.8 −2.3 −0.2 0.0 0.0 −0.6 1.2 −1.4 Mean 15.4 33.1 72.4 −12.5 −2.4 8.9 −113. −113.5 −114.9 −0.8 −1.3 −1.6 1.4 2.3 3.0 0.0 −0.8 −0.3 St. deviation 4.0 7.8 11.7 5.7 10.7 15.4 0.3 0.8 1.6 0.1 0.2 0.2 0.2 0.3 0.4 0.2 −0.1 0.5 60° Max 2.30 14.075 52.080 −4.30 16.450 36.280 −112. −112.0 −112.0 0.27 0.00 0.00 1.18 1.75 2.20 0.64 0.12 0.00 Min −18.0 −17.80 35.660 −31.0 −30.90 −30.80 −113.0 −116.0 −117.74 −2.00 −3.16 −4.0 −0.16 0.00 0.00 −0.57 −2.28 −2.72 Mean −8.70 11.900 48.750 −3.40 12.800 32.890 −113.0 −113.5 −115.0 −1.40 −2.24 −2.83 0.82 1.24 1.54 0.04 −1.20 −1.76 St. deviation 5.51 8.900 17.640 9.50 9.890 20.450 0.248 0.72 1.460 0.24 0.31 0.38 0.13 0.17 0.20 0.14 0.48 0.51 90° Max −17.4 −17.30 35.66 2.60 26.70 51.00 −112.0 −112.0 −112.00 0.00 0.00 0.00 0.06 0.17 0.23 0.31 1.96 2.33 Min −18.0 −25.50 19.16 30.80 −30.80 −30.40 −113.7 −114.0 −115.52 −2.04 −3.52 −4.44 −0.08 −0.11 −0.10 −0.24 −0.36 −0.24 Mean −18.0 −23.00 22.10 1.20 24.80 47.30 −113.0 −113.8 −114.69 −1.48 −2.51 −3.18 0.00 0.04 0.06 0.02 1.14 1.54 St. deviation 0.22 2.08 4.33 10.80 21.40 24.50 0.22 0.715 1.490 0.21 0.34 0.42 0.02 0.04 0.06 0.08 0.47 0.56 120° Max −17.8 −17.80 35.80 −2.80 20.900 44.800 −112. −112.0 −112.00 0.00 0.00 0.26 0.00 0.00 0.15 0.54 1.28 1.59 Min −33.0 −47.9 −9.7 −30.8 −30.8 −31.2 −113 −114.6 −115.30 −1.76 −3.08 −4.40 −1.00 −1.68 −2.64 −0.52 −0.56 −0.84 Mean −29.8 −37.3 17.8 −18.6 15.96 37.5 −113. −114.0 −114.9 −1.32 −2.24 −2.96 −0.76 −1.28 −1.68 0.02 0.23 0.20 St. deviation 5.5 11.25 17.15 9.6 19.13 30.15 0.23 0.76 1.720 0.17 0.28 0.41 0.10 0.17 0.24 0.13 0.28 0.45 150° Max −17.8 −17.8 35.7 −14.3 0.7 16.8 −112.0 −112.0 −112.00 0.00 0.00 0.10 0.00 0.00 0.19 0.37 0.03 0.03 Min −45.3 −64.9 −34.8 −30.9 −30.8 −31.3 −113.3 −113.5 −115.20 −0.98 −1.56 −2.37 −1.72 −2.94 −4.32 −0.59 −2.09 −3.20 Mean −32.8 −56.7 3.8 20.4 −6.7 5.47 −113.0 −113.2 −114.2 −0.78 −1.22 −1.58 −1.35 −2.23 −2.96 −0.16 −1.02 −1.32 St. deviation 9.42 8.47 26.8 5.55 11.0 17.55 0.22 0.66 1.53 0.10 0.14 0.20 0.17 0.27 0.40 0.14 0.36 0.52 Table 18 Leg-2 responses under postulated failure conditionsHeading angle Statistics Surge (Offset) Sway (Offset) Heave (Set down) Roll Pitch Yaw LC-A LC-B LC-C LC-A LC-B LC-C LC-A LC-B LC-C LC-A LC-B LC-C LC-A LC-B LC-C LC-A LC-B LC-C 0° Max 24.80 49.70 71.30 30.98 30.89 30.89 −112.0 −112.0 −112.0 0.01 0.14 0.04 2.24 3.90 5.36 0.05 0.42 0.9 Min −17.80 −17.8 −17.80 30.86 30.61 30.89 −114.0 −113.0 −115.6 −0.02 −0.04 −0.08 0.00 0.00 −0.28 −0.08 −0.20 −0.12 Mean 19.40 45.20 62.80 30.88 30.82 30.88 −114.3 −114.7 −116.8 0.00 0.05 0.00 1.76 2.92 3.68 0.00 0.12 0.00 St. deviation 11.94 7.80 32.93 0.01 0.12 0.00 0.31 0.85 1.73 0.00 0.02 0.01 0.21 0.34 0.49 0.03 0.04 0.05 30° Max 8.90 28.40 47.80 50.90 69.80 86.75 −111.8 −112.0 −112.0 0.00 0.00 0.12 2.00 3.56 4.80 0.45 0.68 0.81 Min −18.20 −17.8 −17.80 30.70 30.89 30.89 −113.4 −116.0 −117.0 −0.96 −1.36 −1.91 0.00 0.00 −0.36 −0.41 −0.24 −0.17 Mean −4.80 10.80 34.80 43.70 57.30 77.10 −114.0 −114.6 −116.4 −0.76 −1.04 −1.36 1.48 2.56 3.20 0.42 0.62 0.71 St. deviation 10.56 19.97 19.84 5.78 11.70 15.67 0.28 0.72 1.50 0.08 0.11 0.16 0.18 0.33 0.50 0.32 0.87 1.10 60° Max −7.20 1.30 25.40 61.40 86.20 109.80 −111.7 −111.8 −111.9 0.00 0.00 0.08 0.96 2.24 3.60 1.02 1.24 1.54 Min −18.10 −17.8 −17.80 30.25 30.88 30.88 −113.8 −116.3 −117.0 −1.64 −2.54 −3.64 0.00 0.00 −0.04 −0.36 −0.92 −1.39 Mean −1.40 −9.70 12.40 56.20 73.50 94.10 −113.3 −114.3 −115.8 −1.36 −2.08 −2.76 0.72 1.56 1.92 0.73 0.84 1.06 St. deviation 6.02 13.96 20.86 9.95 17.35 25.90 0.30 0.75 1.64 0.15 0.21 0.31 0.08 0.27 0.35 0.41 0.90 0.47 90° Max −17.80 −17.8 −17.50 62.80 91.40 110.40 −111.8 −111.7 −111.8 0.00 0.00 4.16 0.36 0.40 0.24 0.30 0.97 1.70 Min −21.20 −30.3 −37.30 30.88 30.88 30.89 −113.7 −115.5 −114.4 −1.92 −3.02 −3.02 −0.16 −0.20 −3.80 −1.01 −1.50 −1.62 Mean −19.60 −27.0 −33.80 54.90 84.10 101.47 −114.2 −114.6 −115.8 −1.52 −2.26 3.03 0.08 −0.04 −0.06 −0.70 −1.10 −1.24 St. deviation 0.42 2.71 4.68 10.84 21.30 32.23 0.26 0.62 0.23 0.17 0.33 0.92 0.08 0.07 0.49 0.64 0.88 1.20 120° Max −17.80 −17.8 −15.60 53.70 71.08 90.80 −111.0 −111.0 −111.0 0.00 0.00 7.42 0.08 0.06 0.04 1.03 1.26 1.60 Min −29.40 −38.5 −54.80 30.88 30.88 31.27 −112.7 −115.0 −117.8 −3.71 −6.04 −9.62 −2.18 −3.94 −10.7 −0.74 −1.62 −1.98 Mean −18.70 −77.2 −35.40 46.20 62.40 80.70 −113.2 −113.9 −115.4 −2.97 −4.27 −4.06 −1.67 −2.62 −3.92 0.55 −1.20 −1.64 St. deviation 6.02 12.60 17.98 10.20 8.57 7.40 0.19 0.36 1.14 0.32 0.78 3.28 0.21 0.38 1.33 1.30 1.60 1.21 150° Max −17.80 −17.8 −16.6 46.80 58.30 64.2 −111.0 −111.0 −111.0 0.00 0.00 0.0 0.07 0.04 0.01 2.37 0.51 0.34 Min −42.80 −55.7 −69.4 30.88 30.88 30.62 −113.5 −115. −115.0 −2.08 −3.47 −4.67 −3.46 −5.84 −8.78 −12.30 −14.5 −17.2 Mean −71.59 −40.1 −58.41 41.70 49.74 57.9 −112.9 −113.7 −115.6 −1.64 −2.20 −2.51 −2.60 −4.36 −4.79 −8.23 −10.4 −14.2 St. deviation 9.47 18.24 27.5 5.56 12.94 18.93 0.23 0.34 0.4 0.18 0.34 0.43 0.31 0.55 0.89 4.60 3.22 3.4 Table 19 Leg-3 responses under intact conditionsHeading angle Statistics Surge (Offset) Sway (Offset) Heave (Set down) Roll Pitch Yaw LC-A LC-B LC-C LC-A LC-B LC-C LC-A LC-B LC-C LC-A LC-B LC-C LC-A LC-B LC-C LC-A LC-B LC-C 0° Max 70.9 97.8 114.8 −112.1 −112.1 −112 0 0 0 0 0.1 0 2.3 3.4 4.2 0.1 0.6 0.84 Min 34 35.7 35.7 0 −0.7 0 −113.9 −114 −116 0 −0.1 0 0 0 0 0 −0.8 0‒0.65 Mean 67.9 89.7 109.8 0 −0.1 0 −113.5 −113.8 −116 0 0 0 1.7 2.6 3.3 0 0.4 0.65 St. deviation 4.6 8.8 109.8 0 0.2 0 0.3 0.8 1.6 0 0 0 0.2 0.3 0.4 0 0.2 0.32 30° Max 39.1 59.2 79 16.5 28.9 41 −112.1 −112.1 −112 0 0 0 1.9 3 3.8 0.4 0.7 1.1 Min 34.9 35.7 35.7 −0.4 0 0 −113.9 −114.2 −115 −1.1 −1.7 −2.4 0 0 0 −0.7 −0.91 −1.2 Mean 36.7 54.4 72.4 15.9 20.5 36.8 −113.4 −113.5 −115 −0.8 −1.4 −1.7 1.5 2.4 3 −0.2 −0.3 −0.7 St. deviation 4.1 7.8 11.7 5.8 10.7 15.2 0.3 0.8 1.6 0.1 0.2 0.2 0.2 0.3 0.3 0.2 0.3 0.5 60° Max 51 67.9 52 28 47.7 66.9 −111.9 −112.1 −112 0 0 0 1.04 1.51 1.87 0 0 0 Min 35.2 35.6 35.6 −0.65 0 0 −113.7 −115.9 −118 −1.83 −2.9 −3.9 −0.1 0 0 −0.47 −0.86 −1.2 Mean 49.2 59.8 48.7 23.8 41.2 62.8 −113.3 −113.5 −115 −1.3 −2.2 −2.9 0.78 1.2 1.5 −0.47 −0.56 −0.8 St. deviation 5.7 19.7 17.6 9.3 16.4 22.8 0.25 0.67 1.38 0.18 0.27 0.32 0.1 0.12 0.14 0.19 0.73 0.78 90° Max 35.6 35.6 35.6 32 81.42 79.8 −112.1 −112 −112 0 0 0 0.02 0.22 0.4 0.5 0.8 1.05 Min 34.2 25.38 19.1 0 0 0 −113.7 −114 −116 −1.96 −3.4 −4 −0.02 -0.02 -0.03 0 0 −0.01 Mean 34.6 28.2 22.1 28.54 75.4 73.8 −113.3 −113.8 −115 −1.5 −2.6 −3.3 0 0.08 0.12 0.33 0.8 1.2 St. deviation 0.28 2.42 4.23 11 21.8 22.8 0.23 0.74 1.58 0.19 0.32 0.36 0.006 0.04 0.07 0.09 0.54 0.65 120° Max 35.6 35.6 35.8 27.9 50.9 75.8 −112 −112 −112 0 0 0.26 0 0 0.14 0.54 0.47 0.95 Min 19.4 5.7 −9.7 0 0 −0.3 −113.6 −114.6 −115 −1.76 −3.08 −4.4 −1 −1.6 −2.6 −0.42 −0.56 −0.84 Mean 26.78 14.9 17.8 24.8 43.5 64.9 −113 −114 −115 −1.32 −2.24 −2.8 −0.76 −1.2 −1.68 0.02 0.22 0.2 St. deviation 5.5 11.2 17.1 9.6 19.1 30.1 0.23 0.76 1.7 0.15 0.28 0.4 0.1 0.16 0.24 0.12 0.27 0.45 150° Max 35.6 35.6 35.7 16.1 29.4 44.3 −112 −112 −112 0 0 0.18 0 0 0.42 0.01 0.14 0.04 Min 8.53 −12.5 −34.8 0 0 −0.06 −113.2 −113.5 −115 −1 −1.7 −2.4 −1.79 −3.01 −4.4 −0.43 −1.08 −1.6 Mean 28.6 27.9 3.8 13.8 23.7 36.9 −113 −113.2 −114 −0.7 −1.2 −1.5 −1.3 −2.21 −2.8 −0.05 −0.74 −1 St. deviation 9.4 8.9 26.8 5.5 11 17.1 0.22 0.6 1.5 0.1 0.16 0.23 0.18 0.29 0.44 0.12 0.34 0.46 Table 20 Leg-3 responses under postulated failure conditionsHeading angle Statistics Surge (Offset) Sway (Offset) Heave (Set down) Roll Pitch Yaw LC-A LC-B LC-C LC-A LC-B LC-C LC-A LC-B LC-C LC-A LC-B LC-C LC-A LC-B LC-C LC-A LC-B LC-C 0° Max 72.8 99.7 124.8 0.019 0.001 0 −110 −110 −110 0.00 1.03 0.03 3.29 4.84 7.96 0.06 0.47 0.91 Min 34.8 35.66 35.64 −0.033 −0.67 −0.002 −113 −113.7 −115 0.00 −0.80 −0.02 0.00 0.00 −0.04 −0.08 −0.20 −0.12 Mean 64.8 66.7 115.4 −0.01 −0.09 0 −114 −114 −115 0.00 0.04 0.00 7..02 3.98 4.56 0.00 0.12 0.00 St. deviation 11.92 8.4 33.01 0.009 5 0.16 4E-04 0.52 1.2 1.75 0.00 0.38 0.00 0.37 0.49 0.52 0.02 0.05 0.03 30° Max 60.5 81.9 102.6 20.6 39.2 55.2 −110 −110 −110 0.09 1.52 1.59 3.34 5.00 6.24 0.61 0.85 0.94 Min 34.99 35.66 35.66 −0.41 0 0 −112 −112.9 −115 −0.61 −1.94 −2.28 0.00 0.00 −0.02 −0.48 −0.24 −0.19 Mean 52.4 72.4 95.7 14.89 32.07 48.1 −112 −113.9 −114 −0.26 −0.32 −0.52 2.85 4.20 4.88 0.42 0.62 0.71 St. deviation 10.23 19.54 20.4 5.89 11.64 15.98 0.5 1.17 1.63 0.11 0.54 0.67 0.40 0.50 0.54 0.32 0.87 1.10 60° Max 46.87 54.6 79.2 29.8 55.8 78.9 −109 −109.6 −110 0.00 1.68 1.96 3.27 4.96 6.16 1.10 1.37 1.64 Min 35.6 35.6 35.6 −0.65 0 0 −113 −116.2 −117 −1.00 −2.96 −4.00 0.00 0.00 −0.02 −0.36 −0.92 −1.39 Mean 38.9 49.2 70.4 24.6 46.9 69.4 −112 −113.6 −115 −0.56 −0.84 −1.32 2.79 4.04 4.40 0.73 0.84 1.06 St. deviation 5.89 12.36 19.9 9.44 16.46 24.2 0.47 1.02 1.43 0.16 0.76 1.08 0.40 0.52 0.65 0.41 0.90 0.47 90° Max 35.2 35.6 35.8 32.1 61.7 81.4 −110 −109.4 −110 0.00 0.00 0.82 0.03 3.56 0.03 0.30 0.97 1.70 Min 36.2 25 19.84 0 0 0 −113 −115 −114 −1.12 −2.80 −2.48 −2.83 0.00 −4.88 −1.23 −1.70 −1.92 Mean 34.6 28.2 22.1 24.6 52.7 68.4 −112 −113.4 −114 −0.48 −1.72 0.49 −1.90 2.27 −3.64 −0.80 −1.20 −1.34 St. deviation 0.28 2.425 4.69 11.03 21.85 33.01 0.49 0.91 0.37 0.15 0.40 0.31 0.44 0.48 0.58 0.64 0.88 1.20 120° Max 35.69 35.67 37.51 23.7 40.97 −56.49 −109 −109 −110 0.40 1.90 3.90 0.10 0.00 1.90 1.03 1.26 1.60 Min 23.7 14.2 −4.5 0 0 −1.34 −113 −114 −119 −2.00 −3.40 −5.60 −7.80 −11.5 −12.8 −0.74 −1.62 −1.98 Mean 14.8 4.68 19.5 18.4 32.8 48.07 −112 −112.9 −114 −0.40 −0.70 −1.30 −6.10 −7.10 −2.90 0.55 −1.20 −1.64 St. deviation 6.31 12.7 17.87 10.32 9.7 6.7 0.58 0.79 1.6 0.20 1.10 1.60 0.80 1.90 1.30 1.30 1.60 1.21 150° Max 35.7 35.6 35.4 15 27.4 30.9 −109 −109 −109 0.80 2.30 1.40 0.00 0.00 0.00 0.20 0.00 0.00 Min 11.9 −4.8 −15.7 0 0 −1.1 −113 −114 −115 −1.00 −1.50 −1.60 −8.20 −12.5 −15.9 −0.49 −0.96 −1.30 Mean −18.6 17.4 5.8 11.4 23.4 24.7 −112 −112.3 −114 −0.10 0.30 0.90 −6.70 −9.50 −11.8 −0.21 −0.69 −0.98 St. deviation 9.5 18.8 27.7 5.6 13 19.1 0.7 0.6 0.6 0.40 0.40 0.30 0.90 1.20 1.40 0.23 0.25 0.64 6 Fatigue life of tendons
Tendons, as they are under high initial pretension (tautmoored), they are more susceptible to fatigue failure due to 1) platform drift under the action of wind, waves, and current, 2) variable submergence effect, and 3) vibration induced by vortex shedding. Tendons' fatigue life under the intact and damaged condition (tendons 9, 11 of leg-3) are investigated. The dynamic variation of pretension in the tendons makes the stress response a non-zero mean process that could not be used directly in S-N curves. Therefore, after obtaining the cycle ranges and averages, each cycle is converted into an equivalent stress range of zero-mean using the Goodman Diagram. The rain flow counting method suggested is used to find the stress ranges corresponding to the simulation time. The parameters for the S-N curve are chosen according to DNV-GL (2005). The corresponding number of cycles required to cause fatigue failure is computed using the S-N curve approach. For the slope of the bilinear curve, m=3, lga=12.081, and the horizontal axis (logN axis) intercept is valid up to a stress range of 103 MPa, after which slope changes to m=5, lga=16.081. The endurance limit is taken as 41.45 N/mm2 at 108 cycles. Palmgren-Miner's rule is applied as a correction factor to account for environmental loading conditions, and fatigue damage is estimated:
$$\mathrm{FD}=\sum\limits_{i=1}^m \frac{n_i}{N_i}$$ (14) where ni is the number of cycles per year for a given tension range interval and Ni is the cycles to failure under tension range 'i' according to the S-N curve. In the present study, the fatigue life of tendons is calculated for 0° heading under all load cases in both intact and postulated failure tendons due to maximum stress variation compared to other heading angles is shown in Table 12. The fatigue life of tendons in leg-3 is lesser than legs-1, 2 under intact conditions by their geometry. The minimum fatigue life of 0.006 1 years and 4.28 years are observed under load case-C in the intact and postulated failure condition of tendons in leg-3; if the load case-C occurs for 0.006 1 years, the tendons in leg-3 fail catastrophically. A significant percentage reduction in fatigue life is noticed for tendons in leg-3 due to postulated failure of tendons (9, 11) in leg-3.
7 Conclusions
Based on the numerical analysis carried out on triceratops under intact and postulated failure of tendons under 10-yr, 100-yr, and 1 000-yr post-Katrina hurricane conditions, the following conclusions are drawn:
1) The natural periods of stiff degrees of freedom are marginally increased due to the decrease in stiffness in postulated failure tendons and the static equilibrium position of the deck in pitch degree is shifted from 0° to −1.4° under the postulated failure condition due to the differential heave motion of the legs.
2) The deck is subjected to maximum surge response under 0° heading angle compared to other headings. The response is about 8.5% and 9.1% of the water depth, respectively, under intact and postulated failure.
3) The maximum heave and pitch PSD peaks are observed nearer to the natural frequencies of respective DOF for intact and postulated failure conditions.
4) The neighboring tendon tension variation significantly increases in the postulated failure condition of tendons under leg-3 for load cases-3. The shift of mean tension is about 46 MN for 0° heading. Further the fatigue life is significantly reduced under the postulated failure of tendons which is about 0.006 1 years for tendons in leg-3.
Competing interest The authors have no competing interests to declare that are relevant to the content of this article. -
Figure 1 Plan view of the platform
Figure 2 Numerical model
Figure 3 Tendon connections to each leg
Figure 4 Wind spectral plots for different load cases
Figure 5 Wave Spectral plots for different load cases
Figure 6 Phase plots for 60° heading under intact and postulated failure condition of tendons for LC-C
Figure 7 Deck responses for 0° heading under the intact and postulated failure condition of tendons for LC-C
Figure 8 PSD plots for 0° heading under intact and postulated failure condition for LC-C
Figure 9 Deck heave mean position under different heading angles for load case-C in intact and postulated failure conditions
Figure 10 Tendon tension variation under the intact and postulated failed conditions of tendons
Table 1 Geometric details
Geometric details Value C/C distance of legs (m) 61.77 Diameter of leg (m) 15.0 Freeboard (m) 20.24 Draft (m) 154.0 Tendon length (m) 2 246.0 Water depth (m) 2 400.0 Self-weight+payload (MN) 562 Buoyancy force (MN) 821 Total pretension (MN) 259 Table 2 Tendon details
Description Quantity Total number of tendons 12 Leg-1, leg-2, and leg-3 Tendons 1-2-3-4, tendons 5-6-7-8 and tendons 9-10-11-12 Outer diameter of tendon (m) 1.29 Thickness of tendon (m) 0.043 Total elements 250 Stiffness of tendon (MN/m) 15.8 Length of each element (m) 8.89 Grade of steel X65 Yield strength (MPa) 450 Tensile strength (MPa) 535 Postulated failure tendons Tendon 9, 11 under leg-3 Table 3 Characteristics of sea state
Load case (LC) Return period HS (m) TP (s) γ Wind (m/s) Depth (m) Current (m/s) A 10-year 10 13 2.2 33 0 1.32 −34.99 0.99 −69.31 0 −2 400 0 B 100-year 15.1 15.1 2.2 48 0 1.8 −49.98 1.35 −100.79 0 −2 400 0 C 1 000-year 18.81 16.95 2.2 60 0 2.25 −63.00 1.69 −126.00 0 −2 400 0 Table 4 Wind force coefficients
Direction Structure Surge (N/(m/s)2) Sway (N/(m/s)2) Roll (N·m/(m/s)2) Pitch (N·m/(m/s)2) 0° Deck 1 029.42 0 0 1 822.07 Legs 219.32 0 0 388.19 30° Deck 891.5 514.7 −911 1 577.95 Legs 189.93 109.66 −194 336.17 60° Deck 514.71 891.5 −1 577.95 911.03 Legs 109.66 189.93 −336.17 194.09 90° Deck 0 1 029.42 −1 822.07 0 Legs 0 219.32 −388.19 0 120° Deck −514.71 891.5 −1 577.95 −911.03 Legs −109.66 189.93 −336.17 −194.09 150° Deck −891.5 514.71 −911.03 −1 577.95 Legs −189.93 109.66 −194.09 −336.17 Table 5 Natural periods
Active-degrees-of-freedom Intact condition (Present study) Chandrasekaran and Nagavinothini (2018) Natural periods (s) Damping ratio (%) Natural periods (s) Damping ratio (%) Surge 221.4 5.38 215 5.14 Sway 222.3 5.16 215.4 5.03 Heave 3.45 0.58 4.3 0.51 Roll 4.1 6.4 6.2 6.23 Pitch 4.3 6.28 6.1 6.08 Yaw 219.7 5.9 215.9 5.68 Table 6 Tendons tension variation for different heading angles under LC-C
Heading angle Statistics Tether tension under each leg (MN) Leg-1 Leg-2 Leg-3 T1 T2 T3 T4 T5 T6 T7 T8 T9 T10 T11 T12 0° Max 38.8 38.7 38.8 38.7 38.8 38.7 38.8 38.7 39.5 39.3 39.5 39.3 Min 12.6 12.5 12.6 12.5 12.6 12.5 12.6 12.5 14.8 13.7 14.6 13.8 30° Max 37.5 37.4 37.5 37.4 37.5 37.4 37.5 37.4 38.6 38.4 38.6 38.4 Min 12.1 11.9 12.1 11.9 12.1 11.9 12.1 11.9 12.2 11.8 12.2 11.8 60° Max 37.9 37.8 37.9 37.8 37.9 37.8 37.9 37.8 38.7 38.3 38.7 38.3 Min 13.5 12.9 13.6 12.9 13.5 12.9 13.6 12.9 10.6 11.9 10.4 11.4 90° Max 37.4 37.3 37.4 37.3 38.2 38.1 38.2 38.1 38.3 38.1 38.3 38.1 Min 10.2 9.9 10.2 9.9 9.4 8.7 9.4 8.7 8.3 8.9 8.3 8.9 120° Max 38.9 38.8 38.9 38.8 38.7 38.6 38.7 38.6 38.8 38.7 38.8 38.7 Min 13.4 12.7 13.4 12.7 12.9 12.8 12.9 12.8 13.4 13.1 13.4 13.1 150° Max 39.4 39.3 39.4 39.3 39.1 39.0 39.1 39.0 39.3 39.2 39.3 39.2 Min 13.1 12.8 13.1 12.8 12.2 12.4 12.2 12.4 13.7 12.9 13.4 12.9 Table 7 Equilibrium position under intact and postulated failure condition of tendons
DOF Deck Buoyant leg, L-1 Buoyant leg, L-2 Buoyant leg, L-3 (Tendons postulated failure leg) Intact Postulated failure Intact Postulated failure Intact Postulated failure Intact Postulated failure Surge (m) 0 −0.18 −17.83 −17.83 −17.831 −17.829 35.66 35.66 Sway (m) 0 0 30.88 30.88 −30.88 −30.88 0 0 Heave (m) 27.74 28.45 −112.74 −112.74 −112.74 −112.74 −112.74 −111.17 Roll (°) 0 0 0 0 0 0 0 0 Pitch (°) 0 −1.4 0 0 0 0 0 0 Yaw (°) 0 0 0 0 0 0 0 0 Table 8 Hydrostatic parameters of buoyant legs
Description Value Hydrostatic heave stiffness (MN/m) 1.8 Hydrostatic roll stiffness (MN·m/(°)) 171 Hydrostatic pitch stiffness (MN·m/(°)) 171 Cut water plane area (m2) 176.7 Ix, Iy(m4) 2 485.1, 2 485.0 Distance from CoG to CoB (m) −35.74 Metacentric height GMX, GMY (m) 35.83, 35.83 Distance from CoB to Metacentre BMX, BMY (m) 0.09, 0.09 Table 9 Natural periods in intact and postulated failure condition of tendons
DOF Intact condition Postulated failure condition Natural periods (s) Natural frequency (rad/s) Damping ratio (%) Natural Periods (s) Natural frequency (rad/s) Damping ratio (%) Surge 221.4 0.028 3 5.38 228.6 0.027 48 5.14 Sway 222.3 0.028 2 5.16 229.0 0.027 4 5.03 Heave 3.45 1.821 2 0.58 3.7 1.698 1 0.51 Roll 4.1 1.532 4 6.4 4.89 1.284 9 6.23 Pitch 4.3 1.402 4 6.28 5.51 1.140 3 6.08 Yaw 219.7 0.028 5 5.9 227.4 0.027 63 5.68 Table 10 Tendons stress variation under Leg-3
Heading angle Load case Stress (N/mm2) Intact Postulated failure Max Min Max Min 0° LC-A 170.43 84.48 385.5 75.61 LC-B 224.4 57.93 442.6 83.65 LC-C 234.6 87.88 459.2 95.0 30° LC-A 151.63 56.42 370.25 70.89 LC-B 118.28 48.29 411.7 77.2 LC-C 227.9 72.6 425.3 67.1 60° LC-A 155.77 41.12 362.8 45.14 LC-B 220.3 54.9 401.7 79.46 LC-C 229.7 63.01 407.8 45.8 90° LC-A 151.38 46.31 358.4 42.8 LC-B 119.7 62.9 379.4 50.8 LC-C 227.5 49.6 394.6 69.3 120° LC-A 151.32 51.55 362.4 49.8 LC-B 120.8 71.2 383.6 60.8 LC-C 230.4 79.5 399.3 78.42 150° LC-A 151.38 72.24 373.4 52.7 LC-B 122.9 59.4 401.7 70.34 LC-C 234.32 81.6 411.5 81.9 Table 11 The maximum increase in stress for adjacent tendons closer to the postulated failure tendons under L-3
Heading angle Max increase in stress in adjacent tendons (%) 0° 95.7 30° 86.6 60° 77.53 90° 73.4 120° 73.3 150° 75.6 Table 12 Fatigue life of tendons under legs
Load case Tendons under legs Fatigue life under intact condition (Year) Fatigue life under postulated failure condition (Year) Reduction in fatigue life (%) LC-A L-1, 2 9.68 9.37 3.202 L-3 8.93 0.529 94.076 LC-B L-1, 2 6.71 6.28 6.408 L-3 6.01 0.039 99.351 LC-C L-1, 2 4.95 4.53 8.484 L-3 4.28 0.0061 99.857 Table 13 Deck response under the intact conditions
Heading angle Statistics Surge (Offset) Sway (Offset) Heave (Set down) Roll Pitch Yaw LC-A LC-B LC-C LC-A LC-B LC-C LC-A LC-B LC-C LC-A LC-B LC-C LC-A LC-B LC-C LC-A LC-B LC-C 0° Max 33.40 58.00 82.71 0.02 0.00 0.00 28.29 28.35 28.35 0.00 0.00 0.00 0.13 0.20 0.67 0.00 0.03 0.00 Min −0.16 0.00 0.00 −0.01 −0.23 0.00 25.60 25.40 23.80 0.00 −0.01 0.00 −0.11 0.31 −0.57 −0.04 −0.24 0.00 Mean 29.84 52.00 79.10 0.00 −0.03 0.00 26.71 26.20 24.80 0.00 0.00 0.00 0.01 −0.01 0.09 −0.01 −0.03 0.00 St. deviation 5.04 9.33 13.60 0.00 0.05 0.00 0.31 0.86 1.69 0.00 0.00 0.00 0.03 0.17 0.04 0.01 0.05 0.00 30° Max 26.00 46.00 66.00 16.48 28.69 40.02 28.30 28.34 28.34 0.23 0.32 0.27 0.14 0.31 0.50 0.74 0.17 0.15 Min −0.22 0.00 0.00 −0.13 0.00 0.00 26.34 25.94 25.14 −0.24 −0.34 −0.41 −0.13 −0.21 −0.30 −1.70 −4.30 −4.36 Mean 25.88 45.60 65.20 14.68 25.67 35.80 26.90 27.10 25.34 0.00 −0.02 −0.05 0.01 0.02 0.02 −0.46 −1.14 −1.87 St. deviation 4.40 8.21 12.08 2.49 4.54 6.33 0.30 0.87 1.69 0.06 0.08 0.11 0.04 0.11 0.11 0.42 0.77 0.66 60° Max 16.40 31.88 46.80 27.50 47.75 68.23 28.45 28.34 28.34 0.10 0.52 0.80 0.05 0.16 0.30 0.00 0.00 3.20 Min −0.19 0.00 0.00 −0.32 0.00 0.00 26.37 25.94 25.12 −0.08 −0.51 −0.56 −0.10 −0.34 −0.51 −2.24 −5.89 −8.26 Mean 14.64 28.48 41.54 24.57 42.48 64.20 27.18 26.87 25.33 0.00 −0.06 −0.13 −0.02 −0.08 0.12 −1.89 −4.88 −6.93 St. deviation 2.51 5.35 8.05 4.14 7.25 10.30 0.23 0.81 1.58 0.02 0.13 0.09 0.02 0.09 0.07 0.37 1.21 1.62 90° Max 0.00 0.00 0.00 31.58 57.51 81.35 28.34 28.34 28.34 0.07 0.12 0.24 0.13 0.35 0.50 3.06 7.06 7.95 Min −0.64 −4.44 −7.00 0.00 0.00 0.00 25.62 25.50 23.84 −0.10 −0.60 −0.41 −0.11 −0.19 −0.13 −0.16 −0.11 −0.04 Mean −0.46 −3.18 −5.76 28.61 51.34 72.75 26.75 26.31 24.83 −0.02 −0.06 −0.08 0.01 0.06 0.17 1.66 4.07 6.33 St. deviation 0.12 1.02 1.81 4.74 9.12 13.23 0.27 0.83 1.63 0.03 0.12 0.10 0.04 0.09 0.11 0.43 1.02 1.30 120° Max 16.04 29.96 44.00 23.69 46.70 66.80 28.35 28.34 28.43 0.06 0.50 0.84 0.04 0.29 0.19 0.05 0.97 2.40 Min 0.70 0.20 0.94 0.00 0.00 −0.58 26.33 25.89 25.20 −0.08 −0.60 −0.43 −0.04 −0.35 −0.12 −0.05 −0.34 −8.40 Mean 14.56 26.64 42.50 25.12 45.28 63.20 26.91 26.10 25.40 −0.01 −0.04 0.12 −0.01 −0.02 −0.02 0.00 0.18 0.08 St. deviation 2.41 4.78 7.10 4.16 8.11 12.47 0.28 0.87 1.85 0.02 0.13 0.31 0.01 0.07 0.05 0.02 0.29 0.05 150° Max 0.00 0.00 0.61 16.08 29.41 44.18 28.30 28.30 28.31 0.11 0.32 0.40 0.08 0.49 0.40 0.58 0.17 0.68 Min 0.00 0.00 0.00 0.00 0.00 0.00 0.00 0.00 0.00 0.00 0.00 0.00 0.00 0.00 0.00 0.00 0.00 0.00 Mean −27.48 −47.20 −70.00 0.00 0.00 −0.35 26.35 26.03 25.30 −0.12 −0.35 −0.42 −0.10 −0.55 −0.48 −1.88 −5.07 −4.20 St. deviation −24.80 −42.40 −61.20 14.56 26.34 38.80 27.01 26.75 25.45 0.00 −0.01 0.01 0.00 −0.04 −0.08 −0.37 −1.46 −2.13 Table 14 Deck response under postulated failure conditions
Heading angle Statistics Surge (Offset) Sway (Offset) Heave (Set down) Roll Pitch Yaw LC-A LC-B LC-C LC-A LC-B LC-C LC-A LC-B LC-C LC-A LC-B LC-C LC-A LC-B LC-C LC-A LC-B LC-C 0° Max 34.24 63.20 88.80 0.10 2.24 0.02 29.11 29.10 29.19 0.01 0.01 0.05 0.83 1.98 1.76 0.09 0.09 2.96 Min 0.00 0.00 −0.72 −0.12 0.00 −0.11 23.59 23.46 22.89 0.00 0.00 −0.04 −1.90 −2.40 −2.98 −0.03 −0.06 0.00 Mean 31.04 56.40 83.90 0.00 1.81 −0.01 26.80 26.40 24.65 0.00 0.12 0.00 −1.60 −1.69 −1.86 0.00 0.00 2.44 St. deviation 5.10 10.03 14.27 0.04 0.49 0.03 0.39 1.05 1.87 0.00 0.16 0.02 0.59 1.08 0.83 0.02 0.02 0.41 30° Max 28.88 51.20 72.80 20.20 39.17 55.19 29.12 29.08 29.04 0.54 1.96 1.73 0.89 2.58 2.78 9.46 11.60 11.21 Min −0.08 0.00 −0.64 0.00 0.00 −0.35 26.80 25.84 25.06 −0.12 −0.89 −0.42 −2.03 −3.13 −3.09 −0.19 −0.31 0.00 Mean 23.52 40.80 57.60 18.28 35.08 49.13 26.89 26.30 25.01 277.00 0.58 0.75 −1.67 −1.72 −1.92 7.94 9.17 9.00 St. deviation 3.56 6.57 9.80 3.26 6.78 9.34 0.36 0.95 1.71 0.10 0.35 0.35 0.59 1.13 0.84 1.62 1.66 1.37 60° Max 19.40 35.80 50.12 29.48 55.76 72.50 29.24 29.11 29.12 0.28 1.89 1.12 1.23 2.23 2.57 6.37 10.37 12.08 Min −0.03 0.00 −0.02 0.00 0.00 −0.64 25.43 25.12 24.12 −0.15 −0.98 −0.77 −2.40 −3.32 −6.03 −0.32 −0.29 −4.80 Mean 16.80 31.04 44.80 26.76 50.12 68.90 26.70 26.40 24.78 0.04 0.10 0.56 −1.61 −2.30 −3.20 2.97 7.80 10.20 St. deviation 3.33 4.19 6.32 4.43 4.94 5.61 0.35 0.90 1.67 0.06 0.33 0.28 0.54 0.95 0.75 0.96 2.81 4.14 90° Max 4.32 5.88 0.00 32.10 60.90 84.60 29.12 29.13 29.08 0.19 1.56 1.67 0.68 1.36 1.63 4.69 13.20 14.01 Min −0.38 −0.03 −3.67 0.00 0.00 0.00 23.61 23.50 22.92 −0.26 −1.17 −0.69 −3.42 −3.70 −3.28 −0.18 −0.39 −1.20 Mean 3.40 2.76 −3.08 22.24 50.90 64.20 26.94 26.30 24.37 −0.05 −0.04 0.27 −1.49 −1.65 −2.03 3.10 9.40 10.80 St. deviation 1.22 1.07 0.67 3.10 8.39 3.74 0.27 0.71 0.47 0.06 0.36 0.37 0.61 0.92 0.45 4.20 3.40 3.64 120° Max 18.75 34.90 49.02 27.76 50.78 72.40 29.11 29.06 29.06 0.39 1.20 1.32 1.23 1.33 2.70 3.15 8.70 11.80 Min 0.00 0.00 0.00 0.00 0.00 0.00 25.41 25.23 24.04 −0.24 −1.41 −0.70 −3.13 −4.35 −6.28 −1.23 −2.70 −4.17 Mean 14.89 27.90 40.80 21.28 34.48 60.87 26.80 26.32 24.65 0.14 0.18 0.62 −1.80 −2.13 −3.70 2.80 7.40 11.38 St. deviation 3.90 6.94 10.07 3.10 5.08 8.35 26.80 0.48 0.98 0.09 0.54 1.03 0.69 1.15 2.79 1.80 4.28 6.78 150° Max 0.00 0.00 0.00 14.33 25.25 32.51 29.12 29.09 29.07 0.35 1.57 1.65 1.61 2.06 2.67 2.02 2.08 2.26 Min −21.92 −36.44 −45.60 0.00 0.00 0.00 25.23 25.04 24.19 −0.26 −1.21 −0.82 −3.40 −3.30 −3.73 −6.20 −7.46 −8.39 Mean −19.32 −29.60 −40.40 12.91 21.15 28.08 26.79 26.20 24.60 0.13 0.58 1.18 −1.80 −2.06 −2.80 −5.78 −6.61 −6.89 St. deviation 2.63 4.24 5.25 1.93 3.22 4.14 0.29 0.46 0.62 0.09 0.40 0.39 0.82 0.73 0.67 1.92 3.16 3.15 Table 15 Leg-1 responses under intact conditions
Heading angle Statistics Surge (Offset) Sway (Offset) Heave (Set down) Roll Pitch Yaw LC-A LC-B LC-C LC-A LC-B LC-C LC-A LC-B LC-C LC-A LC-B LC-C LC-A LC-B LC-C LC-A LC-B LC-C 0° Max 21.7 43.8 114.8 30.8 30.9 30.8 112.1 112.1 112.1 0.0 0.0 0.0 2.2 3.6 4.5 0.1 0.0 0.0 Min −17.8 −17.8 35.7 −30.9 −31.3 −30.8 −114.2 −114.0 −116.0 0.0 0.0 0.0 −0.1 0.0 0.0 −0.1 −0.1 0.0 Mean 18.9 38.6 109.8 −30.8 −30.9 −30.8 −113.2 −113.8 −115.4 0.0 0.0 0.0 1.6 2.7 3.4 0.0 0.0 0.0 St. deviation 4.6 8.8 13.2 0.0 0.1 0.0 0.3 0.7 1.6 0.0 0.0 0.0 0.2 0.3 0.4 0.0 0.0 0.0 30° Max 17.8 37.8 79.0 −13.2 0.7 11.2 −112.1 −112.1 −112.1 0.1 0.0 0.0 2.0 3.2 3.9 0.4 0.2 1.4 Min −17.8 −17.8 35.7 −30.8 −30.8 −30.8 −113.0 −114.2 −115.0 −1.1 −1.8 −2.3 −0.2 0.0 0.0 −0.6 1.2 −1.4 Mean 15.4 33.1 72.4 −12.5 −2.4 8.9 −113.2 −113.5 −114.9 −0.8 −1.3 −1.6 1.4 2.3 3.0 0.0 −0.8 −0.3 St. deviation 4.0 7.8 11.7 5.7 10.7 15.4 0.3 0.8 1.6 0.1 0.2 0.2 0.2 0.3 0.4 0.2 −0.1 0.5 60° Max 2.30 14.075 52.080 −4.30 16.450 36.280 −112.0 −112.0 −112.0 0.27 0.00 0.00 1.18 1.75 2.20 0.64 0.12 0.00 Min −18.0 −17.80 35.660 −31.0 −30.90 −30.80 −113.0 −116.0 −117.74 −2.00 −3.16 −4.0 −0.16 0.00 0.00 −0.57 −2.28 −2.72 Mean −8.70 11.900 48.750 −3.40 12.800 32.890 −113.0 −113.5 −115.0 −1.40 −2.24 −2.83 0.82 1.24 1.54 0.04 −1.20 −1.76 St. deviation 5.51 8.900 17.640 9.50 9.890 20.450 0.248 0.72 1.460 0.24 0.31 0.38 0.13 0.17 0.20 0.14 0.48 0.51 90° Max −17.4 −17.30 35.66 2.60 26.70 51.00 −112.0 −112.0 −112.00 0.00 0.00 0.00 0.06 0.17 0.23 0.31 1.96 2.33 Min −18.0 −25.50 19.16 30.80 −30.80 −30.40 −113.7 −114.0 −115.52 −2.04 −3.52 −4.44 −0.08 −0.11 −0.10 −0.24 −0.36 −0.24 Mean −18.0 −23.00 22.10 1.20 24.80 47.30 −113.0 −113.8 −114.69 −1.48 −2.51 −3.18 0.00 0.04 0.06 0.02 1.14 1.54 St. deviation 0.22 2.08 4.33 10.80 21.40 24.50 0.22 0.715 1.490 0.21 0.34 0.42 0.02 0.04 0.06 0.08 0.47 0.56 120° Max −18.8 −17.80 35.80 −2.80 20.900 44.800 −112.0 −112.0 −112.00 0.00 0.00 0.26 0.00 0.00 0.15 0.54 1.28 1.59 Min −33.0 −47.9 −9.7 −30.8 −30.8 −31.2 −113 −114.6 −115.30 −1.76 −3.08 −4.40 −1.00 −1.68 −2.64 −0.52 −0.56 −0.84 Mean −29.8 −37.3 17.8 −18.6 15.96 37.5 −113.0 −114.0 −114.9 −1.32 −2.24 −2.96 −0.76 −1.28 −1.68 0.02 0.23 0.20 St. deviation 5.5 11.25 17.15 9.6 19.13 30.15 0.23 0.76 1.720 0.17 0.28 0.41 0.10 0.17 0.24 0.13 0.28 0.45 150° Max −17.8 −17.8 35.7 −14.3 0.7 16.8 −112.0 −112.0 −112.00 0.00 0.00 0.10 0.00 0.00 0.19 0.37 0.03 0.03 Min −45.3 −64.9 −34.8 −30.9 −30.8 −31.3 −113.3 −113.5 −115.20 −0.98 −1.56 −2.37 −1.72 −2.94 −4.32 −0.59 −2.09 −3.20 Mean −32.8 −56.7 3.8 20.4 −6.7 5.47 −113.0 −113.2 −114.2 −0.78 −1.22 −1.58 −1.35 −2.23 −2.96 −0.16 −1.02 −1.32 St. deviation 9.42 8.47 26.8 5.55 11.0 17.55 0.22 0.66 1.53 0.10 0.14 0.20 0.17 0.27 0.40 0.14 0.36 0.52 Table 16 Leg-1 responses under postulated failure conditions
Heading angle Statistics Surge (Offset) Sway (Offset) Heave (Set down) Roll Pitch Yaw LC-A LC-B LC-C LC-A LC-B LC-C LC-A LC-B LC-C LC-A LC-B LC-C LC-A LC-B LC-C LC-A LC-B LC-C 0° Max 24.80 49.70 71.30 30.98 30.89 30.89 −112.0 −112.0 −112.0 0.01 0.14 0.04 2.24 3.90 5.36 0.05 0.42 0.9 Min −17.80 −17.8 −17.80 30.86 30.61 30.89 −114.0 −113.0 −115.6 −0.02 −0.04 −0.08 0.00 0.00 −0.28 −0.08 −0.20 −0.12 Mean 19.40 45.20 62.80 30.88 30.82 30.88 −114.3 −114.7 −116.8 0.00 0.05 0.00 1.76 2.92 3.68 0.00 0.12 0.00 St. deviation 11.94 7.80 32.93 0.01 0.12 0.00 0.31 0.85 1.73 0.00 0.02 0.01 0.21 0.34 0.49 0.03 0.04 0.05 30° Max 8.90 28.40 47.80 50.90 69.80 86.75 −111.8 −112.0 −112.0 0.00 0.00 0.12 1.68 3.20 4.40 0.45 0.68 0.81 Min −18.20 −17.8 −17.80 30.70 30.89 30.89 −113.4 −116.0 −117.0 −0.96 −1.36 −1.91 0.00 0.00 −0.20 −0.41 −0.24 −0.17 Mean −4.80 10.80 34.80 43.70 57.30 77.10 −114.0 −114.6 −116.4 −0.76 −1.04 −1.36 1.28 2.32 3.00 0.42 0.62 0.71 St. deviation 10.56 19.97 19.84 5.78 11.70 15.67 0.28 0.72 1.50 0.08 0.11 0.16 0.16 0.30 0.43 0.32 0.87 1.10 60° Max −7.20 1.30 25.40 61.40 86.20 109.80 −111.7 −111.8 −111.9 0.00 0.00 0.08 0.96 2.24 3.60 1.02 1.24 1.54 Min −18.10 −17.8 −17.80 30.25 30.88 30.88 −113.8 −116.3 −117.0 −1.64 −2.54 −3.64 0.00 0.00 −0.04 −0.36 −0.92 −1.39 Mean −1.40 −9.70 12.40 56.20 73.50 94.10 −113.3 −114.3 −115.8 −1.36 −2.08 −2.76 0.72 1.56 1.92 0.73 0.84 1.06 St. deviation 6.02 13.96 20.86 9.95 17.35 25.90 0.30 0.75 1.64 0.15 0.21 0.31 0.08 0.27 0.35 0.41 0.90 0.47 90° Max −17.80 −17.8 −17.50 62.80 91.40 110.40 −111.8 −111.7 −111.8 0.00 0.00 4.16 0.36 0.40 0.24 0.30 0.97 1.70 Min −21.20 −30.3 −37.30 30.88 30.88 30.89 −113.7 −115.5 −114.4 −1.92 −3.02 −3.02 −0.16 −0.20 −3.80 −1.01 −1.50 −1.62 Mean −19.60 −27.0 −33.80 54.90 84.10 101.47 −114.2 −114.6 −115.8 −1.52 −2.26 3.03 0.08 −0.04 −0.06 −0.70 −1.10 −1.24 St. deviation 0.42 2.71 4.68 10.84 21.30 32.23 0.26 0.62 0.23 0.17 0.33 0.92 0.08 0.07 0.49 0.64 0.88 1.20 120° Max −17.80 −17.8 −15.60 53.70 71.08 90.80 −111.0 −111.0 −111.0 0.00 0.00 7.42 0.09 0.06 1.63 1.03 1.26 1.60 Min −29.40 −38.5 −54.80 30.88 30.88 31.27 −112.7 −115.0 −117.8 −3.71 −6.04 −9.62 −2.24 −7.83 −8.87 −0.74 −1.62 −1.98 Mean −18.70 −77.20 −35.40 46.20 62.40 80.70 −113.2 −113.9 −115.4 −2.97 −4.27 −4.06 −1.41 −5.06 −3.52 0.55 −1.20 −1.64 St. deviation 6.02 12.60 17.98 10.20 8.57 7.40 0.19 0.36 1.14 0.32 0.78 3.28 0.23 1.75 1.58 1.30 1.60 1.21 150° Max −17.80 −17.8 −16.6 46.80 58.30 64.2 −111.0 −111.0 −111.0 0.00 0.00 0.0 0.07 0.03 0.01 2.37 0.51 0.34 Min −42.80 −55.7 −69.4 30.88 30.88 30.62 −113.5 −115. −115.0 −2.08 −3.47 −4.67 −3.46 −6.17 −8.78 −12.30 −14.50 −17.2 Mean −71.59 −40.1 −58.41 41.70 49.74 57.9 −112.9 −113.7 −115.6 −1.64 −2.20 −2.51 −2.60 −4.04 −4.79 −8.23 −10.40 −14.2 St. deviation 9.47 18.24 27.5 5.56 12.94 18.93 0.23 0.34 0.4 0.18 0.34 0.43 0.31 0.61 0.89 4.60 3.22 3.4 Table 17 Leg-2 responses under intact conditions
Heading angle Statistics Surge (Offset) Sway (Offset) Heave (Set down) Roll Pitch Yaw LC-A LC-B LC-C LC-A LC-B LC-C LC-A LC-B LC-C LC-A LC-B LC-C LC-A LC-B LC-C LC-A LC-B LC-C 0° Max 21.7 43.8 114.8 −30.8 −30.9 −30.8 −112. −112.1 −112.1 0.0 0.0 0.0 2.2 3.6 4.5 0.1 0.0 0.0 Min −17.8 −17.8 35.7 −30.9 −31.3 −30.8 −114 −114.0 −116.0 0.0 0.0 0.0 −0.1 0.0 0.0 −0.1 −0.1 0.0 Mean 18.9 38.6 109.8 −30.8 −30.9 −30.8 −113. −113.8 −115.4 0.0 0.0 0.0 1.6 2.7 3.4 0.0 0.0 0.0 St. deviation 4.6 8.8 13.2 0.0 0.1 0.0 0.3 0.7 1.6 0.0 0.0 0.0 0.2 0.3 0.4 0.0 0.0 0.0 30° Max 17.8 37.8 79.0 −13.2 0.7 11.2 −112. −112.1 −112.1 0.1 0.0 0.0 2.0 3.2 3.9 0.4 0.2 1.4 Min −17.8 −17.8 35.7 −30.8 −30.8 −30.8 −113. −114.2 −115.0 −1.1 −1.8 −2.3 −0.2 0.0 0.0 −0.6 1.2 −1.4 Mean 15.4 33.1 72.4 −12.5 −2.4 8.9 −113. −113.5 −114.9 −0.8 −1.3 −1.6 1.4 2.3 3.0 0.0 −0.8 −0.3 St. deviation 4.0 7.8 11.7 5.7 10.7 15.4 0.3 0.8 1.6 0.1 0.2 0.2 0.2 0.3 0.4 0.2 −0.1 0.5 60° Max 2.30 14.075 52.080 −4.30 16.450 36.280 −112. −112.0 −112.0 0.27 0.00 0.00 1.18 1.75 2.20 0.64 0.12 0.00 Min −18.0 −17.80 35.660 −31.0 −30.90 −30.80 −113.0 −116.0 −117.74 −2.00 −3.16 −4.0 −0.16 0.00 0.00 −0.57 −2.28 −2.72 Mean −8.70 11.900 48.750 −3.40 12.800 32.890 −113.0 −113.5 −115.0 −1.40 −2.24 −2.83 0.82 1.24 1.54 0.04 −1.20 −1.76 St. deviation 5.51 8.900 17.640 9.50 9.890 20.450 0.248 0.72 1.460 0.24 0.31 0.38 0.13 0.17 0.20 0.14 0.48 0.51 90° Max −17.4 −17.30 35.66 2.60 26.70 51.00 −112.0 −112.0 −112.00 0.00 0.00 0.00 0.06 0.17 0.23 0.31 1.96 2.33 Min −18.0 −25.50 19.16 30.80 −30.80 −30.40 −113.7 −114.0 −115.52 −2.04 −3.52 −4.44 −0.08 −0.11 −0.10 −0.24 −0.36 −0.24 Mean −18.0 −23.00 22.10 1.20 24.80 47.30 −113.0 −113.8 −114.69 −1.48 −2.51 −3.18 0.00 0.04 0.06 0.02 1.14 1.54 St. deviation 0.22 2.08 4.33 10.80 21.40 24.50 0.22 0.715 1.490 0.21 0.34 0.42 0.02 0.04 0.06 0.08 0.47 0.56 120° Max −17.8 −17.80 35.80 −2.80 20.900 44.800 −112. −112.0 −112.00 0.00 0.00 0.26 0.00 0.00 0.15 0.54 1.28 1.59 Min −33.0 −47.9 −9.7 −30.8 −30.8 −31.2 −113 −114.6 −115.30 −1.76 −3.08 −4.40 −1.00 −1.68 −2.64 −0.52 −0.56 −0.84 Mean −29.8 −37.3 17.8 −18.6 15.96 37.5 −113. −114.0 −114.9 −1.32 −2.24 −2.96 −0.76 −1.28 −1.68 0.02 0.23 0.20 St. deviation 5.5 11.25 17.15 9.6 19.13 30.15 0.23 0.76 1.720 0.17 0.28 0.41 0.10 0.17 0.24 0.13 0.28 0.45 150° Max −17.8 −17.8 35.7 −14.3 0.7 16.8 −112.0 −112.0 −112.00 0.00 0.00 0.10 0.00 0.00 0.19 0.37 0.03 0.03 Min −45.3 −64.9 −34.8 −30.9 −30.8 −31.3 −113.3 −113.5 −115.20 −0.98 −1.56 −2.37 −1.72 −2.94 −4.32 −0.59 −2.09 −3.20 Mean −32.8 −56.7 3.8 20.4 −6.7 5.47 −113.0 −113.2 −114.2 −0.78 −1.22 −1.58 −1.35 −2.23 −2.96 −0.16 −1.02 −1.32 St. deviation 9.42 8.47 26.8 5.55 11.0 17.55 0.22 0.66 1.53 0.10 0.14 0.20 0.17 0.27 0.40 0.14 0.36 0.52 Table 18 Leg-2 responses under postulated failure conditions
Heading angle Statistics Surge (Offset) Sway (Offset) Heave (Set down) Roll Pitch Yaw LC-A LC-B LC-C LC-A LC-B LC-C LC-A LC-B LC-C LC-A LC-B LC-C LC-A LC-B LC-C LC-A LC-B LC-C 0° Max 24.80 49.70 71.30 30.98 30.89 30.89 −112.0 −112.0 −112.0 0.01 0.14 0.04 2.24 3.90 5.36 0.05 0.42 0.9 Min −17.80 −17.8 −17.80 30.86 30.61 30.89 −114.0 −113.0 −115.6 −0.02 −0.04 −0.08 0.00 0.00 −0.28 −0.08 −0.20 −0.12 Mean 19.40 45.20 62.80 30.88 30.82 30.88 −114.3 −114.7 −116.8 0.00 0.05 0.00 1.76 2.92 3.68 0.00 0.12 0.00 St. deviation 11.94 7.80 32.93 0.01 0.12 0.00 0.31 0.85 1.73 0.00 0.02 0.01 0.21 0.34 0.49 0.03 0.04 0.05 30° Max 8.90 28.40 47.80 50.90 69.80 86.75 −111.8 −112.0 −112.0 0.00 0.00 0.12 2.00 3.56 4.80 0.45 0.68 0.81 Min −18.20 −17.8 −17.80 30.70 30.89 30.89 −113.4 −116.0 −117.0 −0.96 −1.36 −1.91 0.00 0.00 −0.36 −0.41 −0.24 −0.17 Mean −4.80 10.80 34.80 43.70 57.30 77.10 −114.0 −114.6 −116.4 −0.76 −1.04 −1.36 1.48 2.56 3.20 0.42 0.62 0.71 St. deviation 10.56 19.97 19.84 5.78 11.70 15.67 0.28 0.72 1.50 0.08 0.11 0.16 0.18 0.33 0.50 0.32 0.87 1.10 60° Max −7.20 1.30 25.40 61.40 86.20 109.80 −111.7 −111.8 −111.9 0.00 0.00 0.08 0.96 2.24 3.60 1.02 1.24 1.54 Min −18.10 −17.8 −17.80 30.25 30.88 30.88 −113.8 −116.3 −117.0 −1.64 −2.54 −3.64 0.00 0.00 −0.04 −0.36 −0.92 −1.39 Mean −1.40 −9.70 12.40 56.20 73.50 94.10 −113.3 −114.3 −115.8 −1.36 −2.08 −2.76 0.72 1.56 1.92 0.73 0.84 1.06 St. deviation 6.02 13.96 20.86 9.95 17.35 25.90 0.30 0.75 1.64 0.15 0.21 0.31 0.08 0.27 0.35 0.41 0.90 0.47 90° Max −17.80 −17.8 −17.50 62.80 91.40 110.40 −111.8 −111.7 −111.8 0.00 0.00 4.16 0.36 0.40 0.24 0.30 0.97 1.70 Min −21.20 −30.3 −37.30 30.88 30.88 30.89 −113.7 −115.5 −114.4 −1.92 −3.02 −3.02 −0.16 −0.20 −3.80 −1.01 −1.50 −1.62 Mean −19.60 −27.0 −33.80 54.90 84.10 101.47 −114.2 −114.6 −115.8 −1.52 −2.26 3.03 0.08 −0.04 −0.06 −0.70 −1.10 −1.24 St. deviation 0.42 2.71 4.68 10.84 21.30 32.23 0.26 0.62 0.23 0.17 0.33 0.92 0.08 0.07 0.49 0.64 0.88 1.20 120° Max −17.80 −17.8 −15.60 53.70 71.08 90.80 −111.0 −111.0 −111.0 0.00 0.00 7.42 0.08 0.06 0.04 1.03 1.26 1.60 Min −29.40 −38.5 −54.80 30.88 30.88 31.27 −112.7 −115.0 −117.8 −3.71 −6.04 −9.62 −2.18 −3.94 −10.7 −0.74 −1.62 −1.98 Mean −18.70 −77.2 −35.40 46.20 62.40 80.70 −113.2 −113.9 −115.4 −2.97 −4.27 −4.06 −1.67 −2.62 −3.92 0.55 −1.20 −1.64 St. deviation 6.02 12.60 17.98 10.20 8.57 7.40 0.19 0.36 1.14 0.32 0.78 3.28 0.21 0.38 1.33 1.30 1.60 1.21 150° Max −17.80 −17.8 −16.6 46.80 58.30 64.2 −111.0 −111.0 −111.0 0.00 0.00 0.0 0.07 0.04 0.01 2.37 0.51 0.34 Min −42.80 −55.7 −69.4 30.88 30.88 30.62 −113.5 −115. −115.0 −2.08 −3.47 −4.67 −3.46 −5.84 −8.78 −12.30 −14.5 −17.2 Mean −71.59 −40.1 −58.41 41.70 49.74 57.9 −112.9 −113.7 −115.6 −1.64 −2.20 −2.51 −2.60 −4.36 −4.79 −8.23 −10.4 −14.2 St. deviation 9.47 18.24 27.5 5.56 12.94 18.93 0.23 0.34 0.4 0.18 0.34 0.43 0.31 0.55 0.89 4.60 3.22 3.4 Table 19 Leg-3 responses under intact conditions
Heading angle Statistics Surge (Offset) Sway (Offset) Heave (Set down) Roll Pitch Yaw LC-A LC-B LC-C LC-A LC-B LC-C LC-A LC-B LC-C LC-A LC-B LC-C LC-A LC-B LC-C LC-A LC-B LC-C 0° Max 70.9 97.8 114.8 −112.1 −112.1 −112 0 0 0 0 0.1 0 2.3 3.4 4.2 0.1 0.6 0.84 Min 34 35.7 35.7 0 −0.7 0 −113.9 −114 −116 0 −0.1 0 0 0 0 0 −0.8 0‒0.65 Mean 67.9 89.7 109.8 0 −0.1 0 −113.5 −113.8 −116 0 0 0 1.7 2.6 3.3 0 0.4 0.65 St. deviation 4.6 8.8 109.8 0 0.2 0 0.3 0.8 1.6 0 0 0 0.2 0.3 0.4 0 0.2 0.32 30° Max 39.1 59.2 79 16.5 28.9 41 −112.1 −112.1 −112 0 0 0 1.9 3 3.8 0.4 0.7 1.1 Min 34.9 35.7 35.7 −0.4 0 0 −113.9 −114.2 −115 −1.1 −1.7 −2.4 0 0 0 −0.7 −0.91 −1.2 Mean 36.7 54.4 72.4 15.9 20.5 36.8 −113.4 −113.5 −115 −0.8 −1.4 −1.7 1.5 2.4 3 −0.2 −0.3 −0.7 St. deviation 4.1 7.8 11.7 5.8 10.7 15.2 0.3 0.8 1.6 0.1 0.2 0.2 0.2 0.3 0.3 0.2 0.3 0.5 60° Max 51 67.9 52 28 47.7 66.9 −111.9 −112.1 −112 0 0 0 1.04 1.51 1.87 0 0 0 Min 35.2 35.6 35.6 −0.65 0 0 −113.7 −115.9 −118 −1.83 −2.9 −3.9 −0.1 0 0 −0.47 −0.86 −1.2 Mean 49.2 59.8 48.7 23.8 41.2 62.8 −113.3 −113.5 −115 −1.3 −2.2 −2.9 0.78 1.2 1.5 −0.47 −0.56 −0.8 St. deviation 5.7 19.7 17.6 9.3 16.4 22.8 0.25 0.67 1.38 0.18 0.27 0.32 0.1 0.12 0.14 0.19 0.73 0.78 90° Max 35.6 35.6 35.6 32 81.42 79.8 −112.1 −112 −112 0 0 0 0.02 0.22 0.4 0.5 0.8 1.05 Min 34.2 25.38 19.1 0 0 0 −113.7 −114 −116 −1.96 −3.4 −4 −0.02 -0.02 -0.03 0 0 −0.01 Mean 34.6 28.2 22.1 28.54 75.4 73.8 −113.3 −113.8 −115 −1.5 −2.6 −3.3 0 0.08 0.12 0.33 0.8 1.2 St. deviation 0.28 2.42 4.23 11 21.8 22.8 0.23 0.74 1.58 0.19 0.32 0.36 0.006 0.04 0.07 0.09 0.54 0.65 120° Max 35.6 35.6 35.8 27.9 50.9 75.8 −112 −112 −112 0 0 0.26 0 0 0.14 0.54 0.47 0.95 Min 19.4 5.7 −9.7 0 0 −0.3 −113.6 −114.6 −115 −1.76 −3.08 −4.4 −1 −1.6 −2.6 −0.42 −0.56 −0.84 Mean 26.78 14.9 17.8 24.8 43.5 64.9 −113 −114 −115 −1.32 −2.24 −2.8 −0.76 −1.2 −1.68 0.02 0.22 0.2 St. deviation 5.5 11.2 17.1 9.6 19.1 30.1 0.23 0.76 1.7 0.15 0.28 0.4 0.1 0.16 0.24 0.12 0.27 0.45 150° Max 35.6 35.6 35.7 16.1 29.4 44.3 −112 −112 −112 0 0 0.18 0 0 0.42 0.01 0.14 0.04 Min 8.53 −12.5 −34.8 0 0 −0.06 −113.2 −113.5 −115 −1 −1.7 −2.4 −1.79 −3.01 −4.4 −0.43 −1.08 −1.6 Mean 28.6 27.9 3.8 13.8 23.7 36.9 −113 −113.2 −114 −0.7 −1.2 −1.5 −1.3 −2.21 −2.8 −0.05 −0.74 −1 St. deviation 9.4 8.9 26.8 5.5 11 17.1 0.22 0.6 1.5 0.1 0.16 0.23 0.18 0.29 0.44 0.12 0.34 0.46 Table 20 Leg-3 responses under postulated failure conditions
Heading angle Statistics Surge (Offset) Sway (Offset) Heave (Set down) Roll Pitch Yaw LC-A LC-B LC-C LC-A LC-B LC-C LC-A LC-B LC-C LC-A LC-B LC-C LC-A LC-B LC-C LC-A LC-B LC-C 0° Max 72.8 99.7 124.8 0.019 0.001 0 −110 −110 −110 0.00 1.03 0.03 3.29 4.84 7.96 0.06 0.47 0.91 Min 34.8 35.66 35.64 −0.033 −0.67 −0.002 −113 −113.7 −115 0.00 −0.80 −0.02 0.00 0.00 −0.04 −0.08 −0.20 −0.12 Mean 64.8 66.7 115.4 −0.01 −0.09 0 −114 −114 −115 0.00 0.04 0.00 7..02 3.98 4.56 0.00 0.12 0.00 St. deviation 11.92 8.4 33.01 0.009 5 0.16 4E-04 0.52 1.2 1.75 0.00 0.38 0.00 0.37 0.49 0.52 0.02 0.05 0.03 30° Max 60.5 81.9 102.6 20.6 39.2 55.2 −110 −110 −110 0.09 1.52 1.59 3.34 5.00 6.24 0.61 0.85 0.94 Min 34.99 35.66 35.66 −0.41 0 0 −112 −112.9 −115 −0.61 −1.94 −2.28 0.00 0.00 −0.02 −0.48 −0.24 −0.19 Mean 52.4 72.4 95.7 14.89 32.07 48.1 −112 −113.9 −114 −0.26 −0.32 −0.52 2.85 4.20 4.88 0.42 0.62 0.71 St. deviation 10.23 19.54 20.4 5.89 11.64 15.98 0.5 1.17 1.63 0.11 0.54 0.67 0.40 0.50 0.54 0.32 0.87 1.10 60° Max 46.87 54.6 79.2 29.8 55.8 78.9 −109 −109.6 −110 0.00 1.68 1.96 3.27 4.96 6.16 1.10 1.37 1.64 Min 35.6 35.6 35.6 −0.65 0 0 −113 −116.2 −117 −1.00 −2.96 −4.00 0.00 0.00 −0.02 −0.36 −0.92 −1.39 Mean 38.9 49.2 70.4 24.6 46.9 69.4 −112 −113.6 −115 −0.56 −0.84 −1.32 2.79 4.04 4.40 0.73 0.84 1.06 St. deviation 5.89 12.36 19.9 9.44 16.46 24.2 0.47 1.02 1.43 0.16 0.76 1.08 0.40 0.52 0.65 0.41 0.90 0.47 90° Max 35.2 35.6 35.8 32.1 61.7 81.4 −110 −109.4 −110 0.00 0.00 0.82 0.03 3.56 0.03 0.30 0.97 1.70 Min 36.2 25 19.84 0 0 0 −113 −115 −114 −1.12 −2.80 −2.48 −2.83 0.00 −4.88 −1.23 −1.70 −1.92 Mean 34.6 28.2 22.1 24.6 52.7 68.4 −112 −113.4 −114 −0.48 −1.72 0.49 −1.90 2.27 −3.64 −0.80 −1.20 −1.34 St. deviation 0.28 2.425 4.69 11.03 21.85 33.01 0.49 0.91 0.37 0.15 0.40 0.31 0.44 0.48 0.58 0.64 0.88 1.20 120° Max 35.69 35.67 37.51 23.7 40.97 −56.49 −109 −109 −110 0.40 1.90 3.90 0.10 0.00 1.90 1.03 1.26 1.60 Min 23.7 14.2 −4.5 0 0 −1.34 −113 −114 −119 −2.00 −3.40 −5.60 −7.80 −11.5 −12.8 −0.74 −1.62 −1.98 Mean 14.8 4.68 19.5 18.4 32.8 48.07 −112 −112.9 −114 −0.40 −0.70 −1.30 −6.10 −7.10 −2.90 0.55 −1.20 −1.64 St. deviation 6.31 12.7 17.87 10.32 9.7 6.7 0.58 0.79 1.6 0.20 1.10 1.60 0.80 1.90 1.30 1.30 1.60 1.21 150° Max 35.7 35.6 35.4 15 27.4 30.9 −109 −109 −109 0.80 2.30 1.40 0.00 0.00 0.00 0.20 0.00 0.00 Min 11.9 −4.8 −15.7 0 0 −1.1 −113 −114 −115 −1.00 −1.50 −1.60 −8.20 −12.5 −15.9 −0.49 −0.96 −1.30 Mean −18.6 17.4 5.8 11.4 23.4 24.7 −112 −112.3 −114 −0.10 0.30 0.90 −6.70 −9.50 −11.8 −0.21 −0.69 −0.98 St. deviation 9.5 18.8 27.7 5.6 13 19.1 0.7 0.6 0.6 0.40 0.40 0.30 0.90 1.20 1.40 0.23 0.25 0.64 -
American Petroleum Institute (2010) Planning, designing and constructing tension leg platforms. API Recommended Practice 2 Chandrasekaran S, Madhuri S (2015) Dynamic response of offshore triceratops: numerical and experimental investigations. Ocean Engineering 109: 401–409. https://doi.org/10.1016/j.oceaneng.2015.09.042 Chandrasekaran S, Mayank S, Jain A (2015) Dynamic response behaviour of stiffened triceratops under regular waves: experimental investigations. International Conference on Offshore Mechanics and Arctic Engineering, Vol. 56499, V003T02A083 Chandrasekaran S, Nagavinothini R (2018) Dynamic analyses and preliminary design of offshore triceratops in ultra-deep waters. Innovative Infrastructure Solutions 3(1): 16. https://doi.org/10.1007/s41062-017-0124-1 Chandrasekaran S, Nagavinothini R (2019) Ice-induced response of offshore triceratops. Ocean Engineering 180: 71–96. https://doi.org/10.1016/j.oceaneng.2019.03.063 Chandrasekaran S, Nannaware M (2014) Response analyses of offshore triceratops to seismic activities. Ships and Offshore Structures 9(6): 633–642. https://doi.org/10.1080/17445302.2013.843816 Chandrasekaran S, Rao MHVR (2019) Numerical analysis on triceratops restraining system: Failure conditions of tethers. Int. J. of Env. & Ecological Engg. 13(9): 588–592. https://doi.org/10.5281/zenodo.3461996 Chandrasekaran S, Seeram M (2015) Dynamic response of offshore triceratops: Numerical and experimental investigations. Ocean Engineering 109: 401–409. https://doi.org/10.1016/j.oceaneng.2015.09.042 Chandrasekaran S, Seeram M, Jain AK (2013) Aerodynamic response of offshore triceratops. Ships and Offshore Structures 8(2): 123–140. https://doi.org/10.1080/17445302.2012.691271 Chandrasekaran S, Shah B, Chauhan YJ (2022) Dynamic analyses of triceratops under Hurricane-driven Metocean conditions in Gulf of Mexico. Ocean Engineering 256: 111511. https://doi.org/10.1016/j.oceaneng.2022.111511 Chandrasekaran S, Uddin SA, Wahab M (2021) Dynamic analysis of semi-submersible under the postulated failure of restraining system with buoy. International Journal of Steel Structures 21(1): 118–131. https://doi.org/10.1007/s13296-020-00420-7 Chen M, Xiao P, Zhou H, Li CB, Zhang X (2022) Fully coupled analysis of an integrated floating wind-wave power generation platform in operational sea-states. Front. Energy Res. 10: 931057. DOI: 10.3389/fenrg.2022.931057 Cheng S, Yu Y, Yu J, Wu J, Li Z, Huang Z (2021) Mechanistic research on the complex motion response of a TLP under tendon breakage. Ocean Engineering 240: 109984. https://doi.org/10.1016/j.oceaneng.2021.109984 DNV-GL (2005) Recommended Practice DNVGL-RP-0005, 2014-06 (April): 126. ftp://128.84.241.91/tmp/MSE-4020/Fatigue-Design-Offshore.pdf Halkyard JE, Paulling JR, Davies RL, Glanvilie RS (1991) The tension buoyant tower: A design for deep water. Proceedings of the Annual Offshore Technology Conference, 41–55. https://doi.org/10.4043/6700-MS Kim MH, Zhang Zhi (2009) Transient effects of tendon disconnection on the survivability of a TLP in moderate-strength hurricane condtions. International Journal of Naval Architecture and Ocean Engineering 1(1): 13–19. https://doi.org/10.2478/IJNAOE-2013-0002 Li Chunbao, Chen Mingsheng, Choung J (2021) The quasi-static response of moored floating structures based on minimization of mechanical energy. J. Marine Sc. and Engg. 9(9): 960. https://doi.org/10.3390/jmse9090960 Liu Hanyu, Chen Mingsheng, Han Zhaolong, Zhou Hao, Li Lin (2022) Feasibility study of a novel open ocean aquaculture ship integrating with a wind turbine and an internal turret mooring system. J. Mar. Sci. Eng. 10(11): 1729. https://doi.org/10.3390/jmse10111729 Nagavinothini R, Chandrasekaran S (2019) Dynamic analyses of offshore triceratops in ultra-deep waters under wind, wave, and current. Structures 20: 279–289. https://doi.org/10.1016/j.istruc.2019.04.009 Nagavinothini R, Chandrasekaran S (2020) Dynamic response of offshore triceratops with elliptical buoyant legs. Innovative Infrastructure Solutions 5(2): 1–14. https://doi.org/10.1007/s41062-020-00298-8 Perryman SR, Horton EE, Halkyard JE, Beynet PA (1995) Tension buoyant tower for small fields in deepwaters. Proceedings of the Annual Offshore Technology Conference, 13–22. https://doi.org/10.4043/7805-MS Qi Y, Tian X, Guo X, Lu H, Liu L (2019) The hydrodynamic performance of a tension leg platform with one-tendon failure. Ships and Offshore Structures 14(5): 523–533. https://doi.org/10.1080/17445302.2018.1518188 Ren Yajun, Venugopal V, Shi Wei (2022) Dynamic analysis of a multi-column TLP floating offshore wind turbine with tendon failure scenarios. Ocean Engineering 245: 110472. https://doi.org/10.1016/j.oceaneng.2021.110472 Shaver CB, Capanoglu CC, Serrahn CS (2001) Buoyant leg structure preliminary design, constructed cost and model test results. Proceedings of the International Offshore and Polar Engineering Conference, 1: 432–439 Tabeshpour MR, Ahmadi A, Malayjerdi E (2018) Investigation of TLP behavior under tendon damage. Ocean Engineering 156: 580–595. https://doi.org/10.1016/j.oceaneng.2018.03.019 White CN, Copple RW, Capanoglu C (2005) Triceratops: An effective platform for developing oil and gas fields in deep and ultra deep water. Proceedings of the International Offshore and Polar Engineering Conference 2005, 133–339 Yang CK, Kim MH (2010) Transient effects of tendon disconnection of a TLP by hull-tendon-riser coupled dynamic analysis. Ocean Engineering 37(8–9): 667–677. https://doi.org/10.1016/j.oceaneng.2010.01.005 Yu J, Hao S, Yu Y, Chen B, Cheng S, Wu J (2019) Mooring analysis for a whole TLP with TTRs under tendon one-time failure and progressive failure. Ocean Engineering 182: 360–385. https://doi.org/10.1016/j.oceaneng.2019.04.049 Zhu Ling, Zou Meiyan, Chen Mingsheng, Li Lin (2021) Nonlinear dynamic analysis of float-over deck installation for a GBS platform based on a constant parameter time domain model. Ocean Engineering 235: 109443. https://doi.org/10.1016/j.oceaneng.2021.109443 Zou M, Chen M, Zhu L, Li L, Zhao W (2023) A constant parameter time domain model for dynamic modelling of multi-body system with strong hydrodynamic interactions. Ocean Engineering 268: 113376. https://doi.org/10.1016/j.oceaneng.2022.113376
| Citation: |
Srinivasan Chandrasekaran, Ganta Shanmukha Rao (2024). Postulated Tendon Failure of Offshore Triceratops. Journal of Marine Science and Application, 23(1): 182-200. https://doi.org/10.1007/s11804-024-00397-3

|
