
Dynamic Analysis of a Symmetrically Moored Semisubmersible Under Various Possible Mooring Combinations
https://doi.org/10.1007/s11804-024-00390-w
-
Abstract
In this technologically advancing world, the demand for more energy, oil and gas production is rapidly escalating. To accomplish this, people have inclined more towards completely floating offshore structures, deployed in deep waters. A semi-submersible is selected in the present study, due to its better response characteristics and stability under harsh environmental conditions. The semi-submersible is position restrain with spread mooring lines incorporated with submerged buoy at different locations has been studied. A detailed numerical analysis is carried out using Ansys Aqwa for dynamic response analysis of semi-submersible under the combination of wind, wave, and current forces for 0°, 45°, and 90° directions. It was observed that damping ratios and natural periods had been affected based on the position and number of submerged buoys in the mooring system. Also, reduction in mooring force after incorporating buoy in the mooring lines was observed. Subsequently, a Matlab code based on the S-N curve approach was generated and employed to investigate the fatigue damage of mooring lines under dynamic variation of mooring forces. When pegged with submerged buoys, fatigue life of mooring lines is increased under intact and postulated damaged mooring conditions. Moreover, coupling of motion responses of semi-submersible is observed, and unbounded response is not seen in any degrees-of-freedom, even during damaged condition of mooring lines.-
Keywords:
- Dynamic analysis ·
- Fatigue damage ·
- Offshore Structures ·
- Postulated failure ·
- Submerged buoy ·
- Mooring lines
Article Highlights● Dynamic response analysis of a semi-submersible under wind, wave and current loads for various directions under intact and damaged mooring conditions has been carried out.● A chain-wire-chain mooring system is pegged with buoys at all the possible locations for restraining the motions of the semi-submersible.● Investigation of fatigue life of mooring lines under intact and postulated damaged conditions has been done. -
1 Introduction
The importance of oil and gas can be traced since nineteenth century and rapid industrialization have caused fluctuating market demand. Further, the oil and gas reserves in shallow waters are becoming obsolete because of replinishment of resources. Hence, exploration and production of oil and gas is shifting from shallow waters to deep and ultra-deep waters employing compliant and floating structures. Floating offshore platforms are unique in construction as they withstand extreme dynamic environmental loads and possess stability due to their unique geometric form, unlike land-based structures that attain stability based on their strength derived from the properties of materials. A semi-submersible is widely preferred over fixed and compliant structures due to advantages like better stability, large deck area, ease of construction, transportation, and decommissioning, etc. Like other floating structures, semi-submersibles are active in all six degrees-of-freedom, making them flexible in all directions of motion and rotation. Studies showed that spacing of draft, between the hull and length of the platform inversely affects the natural frequency of semi-submersible and effects of weight change is less dominant than the change in dimensions (Sunil and Mukhopadhyay, 1995; Stansberg, 2008).
Researchers showed contribution of viscous forces in splash zone is dominant and affects the mean horizontal drift of semi-submersible (Berthelsen et al., 2009). Numerical studies performed by Mavrakos et al. (1996) confirmed reduction in mooring line tension and contributed to maximum buoyancy. Mavrakos and Chatjigeorgiou (1997) concluded for a decrease in tension of mooring lines due to buoys. Therefore, coupled dynamic analysis is essential to capture the effects of damping in mooring lines arising due to low-frequency motion (Ormberg and Larsen, 1998; Clauss et al., 2002). Jefferys and Patel (1982) assessed three models of tethers, and the exact and finite element model offers better advantages. But, dynamics of tether, under the motions of platform is maximum near the wave frequency, which should be investigated. Webster (1995) damping offered by mooring lines under high pretension, reduced with the increase in drag.
Yilmaz et al. (1996) conducted numerical investigations for mooring lines position restraining a semi-submersible. They observed the motion responses occur based on their mean values. Srinivasan et al. (2006) analyzed a Truss-Pontoon semi-submersible (TPS) for resonance due to extreme waves and validated with scaled model study, proved that additional non-linear damping due to heave plates restricts the response amplitude close to resonance. Mansour and Huang (2007) modified the design of a semi-submersible in terms of pontoon width-to-depth ratio that increased the added mass and stability of semi-submersible. Ren and Liu (2008) conducted a hydrodynamic analysis and confirmed that vertical motion of the semi-submersible can be improved by the presence of damping in vertical direction. Feng et al. (2009) conducted experimental and numerical investigations for motion responses of a semi-submersible. Time-domain calculations provide dynamic responses of the floater coupled with the mooring lines. Hussain et al. (2009) carried out experimental and numerical studies to compare motion characteristics of a deep-draft and an extended semi-submersible, and observed reduction in heave motion of extended semi-submersible. Hassan et al. (2009) experimentally investigated contributions of mooring system at low-frequency motions for steady drift forces and low-frequency motions. Damping due to catenary mooring was enhanced for the combination of wave and current forces, instead of wave alone. Kurian et al. (2010) succeeded in validating model RAO's numerically and experimentally and found that both the tests in surge and pitch are reasonably matching.
Li et al. (2011) investigated for global motions and hydrodynamics behaviour of deep-water floaters-TLPs, Semi-submersibles, and truss Spar. Surge response for semi-submersible and Spar are nearly similar when both structures are positioned restrained by a lateral mooring system. The Pitch motion response of Spar platform is observed to be higher than Semi-submersible and TLPs. The surge response is observed to be dominating under low-frequencies on comparison with wave-frequency motions while peak period of wave spectrum decreases. Zhai et al. (2011) carried out numerical investigations for the dynamic behavior of deep-water semi-submersible and observed heave period as 22 s. In contrast, the wave period was 8–16 s, and avoiding maximum response in heave degrees-of-freedom, peak coefficient significantly affects the motion response. Zhu and Ou (2011) numerically and experimentally studied the semi-submersible motion performance with mooring under combined wind and wave forces. The maximum surge motion of the Semi-submersible is about 2% of the water depth, one of the essential criteria for operating the platform smoothly. Guo et al. (2012) performed mooring analysis for a semi-submersible drilling unit and concluded that, semi-submersible rig can be used to perform a drilling operation. A good mooring system help reducing the operation and maintenance costs of a semi-submersible rig.
Banks and Abdussamie (2017) conducted model studies on the Semi-submersible, based on the newly developed focussed wave technique. An increase in wave energy has caused large pitch and heave responses. Further, this technique can help investigating air-gap effect on dynamics of floating structures. Wu et al. (2015) performed numerical and analytical studies for investigating fatigue damage of mooring lines. They concluded that fatigue damage for taut mooring occurs at the topside of the lower chain but, for catenary mooring it occurs at fairlead connection. Yang et al. (2016) conducted time-domain based numerical investigations at low frequencies with parameters like current speed, pre-tension in the mooring lines, added mass and drag coefficients. It was concluded that amplification factor for mooring line damping is due to response amplitude operator and pre-tension in mooring lines is influenced by the speed of current. Li et al. (2017) investigated for dynamic motion response of a semi-submersible in rough waves and validated the results experimentally. Surge responses at lower-frequency have enlarged under wave forces. Odijie et al. (2017) studied stress distribution on the hull of a paired-column semi-submersible. The stress distribution is independent for orientation of flow but strongly depends on the wave's amplitude. Found that maximum stress distribution around inner columns and recommended for additional reinforcement of steel. Ganesan and Sen (2018) conducted a three-dimensional numerical wave tank approach for simulating wave structure interaction and also investigated for the effects of air-gap. They verified their numerical results with other numerical solvers and further they observed that the numerical results are in acceptable range of the experiments conducted by them; however the developed method provides a conservative prediction for air-gap. Xue et al. (2018) carried out fatigue analysis for mooring lines and concluded stress concentration factors are critical during the estimation of fatigue life of the welded sections in the mooring lines. In addition they found that T-N curve provide conservative estimates for the prediction of fatigue life.
Xu et al. (2018) carried out an experimental and numerical investigation with two hybrid mooring systems for Semi-submersible deployed in deep waters and obtained platform motion responses and tension in the mooring lines. Based on results obtained, incorporating buoy in the mooring lines, there is mooring stress reduction, whereas platform motion responses are not significant. Ma et al. (2019) performed hydrodynamic analysis of a semi-submersible and confirmed that even with the worst loading conditions; offset of semi-submersible has been observed to be within the permissible range. The inclusion of submerged buoys in a mooring system has reduced tension in mooring lines and found as much effective in deep-waters (Chandrasekaran et al., 2020a). Including submerged buoys, at various positions along mooring line, has reduced the fatigue damage of mooring lines (Yan et al., 2018; Chandrasekaran et al., 2020b). Based on a critical review of the literature, mooring layout is considered as the paramount feature upon which motion characteristics of a semi-submersible is highly dependent. Xu and Guedes Soares (2021) studied hybrid mooring concepts consisting of clump weights and submerged buoys to investigate fatigue damage of mooring lines. They concluded that Dirlik model provides high ranking for nylon rope to determine fatigue damage. Further they emphasized for examining and improving the accuracy for computing fatigue damage of mooring lines using spectral methods. Hence, in the present study all possible combinations for submerged buoy which can be incorporated in chain-wire-chain mooring configuration have been studied. Further, intact and deliberately (or postulated) damaged mooring conditions, the motion characteristics of the semi-submersible have been also considered in the present study. Investigations for fatigue damage of mooring lines under intact and postulated damaged mooring condition for all possible combinations of submerged buoys in the mooring lines is also carried out.
2 Description of the semi-submersible
Semi-submersible floats due to the buoyancy provided by fully submerged pontoon and partially submerged column members. In the present study, semi-submersible consists of two large cuboidal configuration pontoon members. Four-column members are placed so that two column members rest on a single pontoon member. The column members then connect pontoons and deck of semi-submersible. These columns are interconnected with horizontal braces to maintain the structural integrity of the platform under lateral action of wind, wave, and current forces. A numerical model and description of the semi-submersible are shown in Figure 1 and Table 1, respectively. Case-A indicates the mooring lines without a buoy, Case-B represents buoy is attached after the upper chain, Case-C means buoy is incorporated after the middle wire. Case-D illustrates buoys have attached at the top of the middle wire and lower chain. Aforementioned Cases indicate the possible locations for including the submerged buoy within the mooring lines, and hence, the novelty for present work is to assess motion characteristics of the semi-submersible under these combinations during intact and postulated damage mooring conditions for 10-year and 100-year return periods.
 Figure 1 Numerical model of the semi-submersible under various mooring configurationsTable 1 Characteristics of the semi-submersible
Water depth (m) 1 500 Draft (m) 19 Pontoon members (m3) 114.07×20.12×8.54 Column members (m3) 17.385×17.385×21.46 Deck size (m3) 74.42×74.42×8.6 Displacement (kg) 48 206 800 Center of gravity (m) −8.9 The radius of gyration rx (m) 32.4 The radius of gyration ry (m) 32.1 The radius of gyration rz (m) 34.4 2.1 Mooring system and submerged buoy
Semi-submersible is position restrained by a passive mooring system, i.e., through spread mooring lines in the form of chain-wire-chain configuration. Four Cases for the mooring system is analyzed in the present work, during intact and postulated damaged mooring conditions. Usually, buoys are used for weather waving of ships, floating vessels carrying liquid cargo, etc. The scarcity of research on buoys incorporated in the mooring lines has motivated the present configuration of the mooring system with a buoy. The buoy characteristics for all the Cases are the same. Furthermore, buoys used in all mooring lines (except in Case-A) at different locations and investigated for global response analysis of semi-submersible under intact and postulated damage mooring conditions. The layout and properties of the mooring system are shown in Figure 2 and Table 2, whereas, description of the buoy is shown in Table 3.
 Figure 2 Schematic layout of the mooring systemTable 2 Properties of the mooring system
Description Configuration of mooring lines Upper chain Middle wire Lower chain Mass/unit length (kg/m) 163.7 36.3 163.7 Equivalent cross-sectional area (m2) 0.014 0.014 0.014 Axial rigidity AE (N) 676 810 000 833 910 000 676 810 000 Equivalent diameter (m) 0.095 0.095 0.095 Table 3 Description of the submerged buoyStructural mass (kg) 5861.6 Displaced mass of water (kg) 67 086.1 Added mass (kg) 33 543 CD × Area (m2) 23.56 2.2 Mooring line model
The quasi-static composite catenary mooring model allows multitudinous segments of elastic catenary lines connecting its one end (as a connection point) to the semi-submersible and other end (as a fixed/anchor point) on the seabed. Every segment of catenary mooring is specified by its length, mass (per unit length), axial stiffness, and cross-sectional area. Further, mooring buoys are attached at all possible locations in the mooring configuration. Every segment of catenary mooring is considered to have a uniform shape in Ansys Aqwa. The catenary mooring line having a zero slope at the seabed, following are the equations for mooring line.
$$H_2=\mathrm{AE} \sqrt{\left(\frac{T_2}{\mathrm{AE}}+1\right)^2-\frac{2 w z_2}{\mathrm{AE}}}-\mathrm{AE}=H$$ (1) $$x_2=\frac{H_2}{w} \sinh ^{-1}\left(\frac{w L}{H_2}\right)+\frac{H_2 L}{\mathrm{AE}}$$ (2) $$V_2=w L$$ (3) $$T_2=\sqrt{H_2{ }^2+V_2{ }^2}$$ (4) where w is the submerged weight of mooring per unit length, L is the unstretched suspended length of mooring line from origin to the connection point (x2, z2) at semi-submersible, AE is stiffness per unit length, T1 and T2 are tension components at the nodes (x1, z1) and (x2, z2).
3 Numerical methodology
3.1 Solver details
During diffraction analysis, response amplitude operators, Froude-Krylov forces, diffraction forces, mean drift forces, hydrodynamic coefficients, added mass, and damping are obtained. Subsequently investigation for global response analysis of the semi-submersible with symmetrically spread mooring cables under the action of wind loads, lateral wave loads including inertia and drag force, and current forces on the hull of semi-submersible as well as on the mooring lines is carried out. In the present work, the numerical solver Ansys Aqwa in time-domain has been employed for evaluating responses of semi-submersible and tension in the mooring lines. The analysis was performed using a step-wise algorithm under the intact and postulated damage mooring conditions for about three hours, i.e., 10 000 s with a time step of 0.1 s.
3.2 Environmental conditions
The semi-submersible considered in the present study is based on the configuration of existing Hai Yang Shi You– 981 deep-water semi-submersible constructed by the China National Offshore Oil Corporation (CNOOC). The platform was deployed in the disputed waters of Paracels islands located between the China and Vietnam. Environmental conditions for 0°, 45° and 90° heading directions are considered in the present study (Qiao and Ou, 2013) are shown in Table 4. For representing the characteristics of wind, API spectrum has been employed. For delineating the effects of wave forces, a JONSWAP wave spectrum has been used with Peakedness parameters for 10-years and 100-years return period.
Table 4 Environmental conditionsDescription The return period of the event 10-year return period 100-years return period Significant wave height Hs (m) 11.1 13.3 Peak wave period Tp (s) 13.6 15.5 Parameter of peakedness γ 5 7 Speed of wind Vwind (m/s) 48.3 55 Speed of current Vcurrent (m/s) 1.7 1.97 3.2.1 Wind load
An American Petroleum Institute (API) wind spectrum, used to characterize the dynamic effects of wind loads is given by:
$$S(f)=\frac{\sigma(z)^2}{f} S(\check{f})$$ (5) $$S(\tilde f) = \frac{{\tilde f}}{{{{(1 + 1.5\tilde f)}^{{\raise0.5ex\hbox{$\scriptstyle 5$} \kern-0.1em/\kern-0.15em \lower0.25ex\hbox{$\scriptstyle 3$}}}}}}$$ (6) $$\tilde{f}=\frac{f}{f_p}\; {\rm and} \;f_p=0.025\left(\frac{V_Z}{Z}\right)$$ (7) $$\bar{V}_z=\bar{V}_{10}\left(\frac{Z}{10}\right)^{0.125}$$ (8) where $\tilde{f}$ is non-dimensional frequency, f and fp are frequencies (Hz), and Vz is the mean 1-hour wind speed (m/s).
The wind force coefficient is a dimensionless variable that can be used to calculate the wind force operating on a semi-submersible. The value of wind force coefficients as available in the literature is mentioned in Table 5.
Table 5 Value of the wind force coefficientDegrees of freedom Directions 0° 30° 60° 90° Surge 0.5 0.7 0.4 0.3 Sway 0.2 0.1 0.1 0.2 Heave 0.5 0.4 0.3 0.4 Roll 0.5 0.2 0.2 0.3 Pitch 0.5 0.3 0.2 0.3 Yaw 0.5 0.1 0.1 0.2 3.2.2 Wave load
The effect of hydrodynamic loads on the semi-submersible is evaluated using the diffraction theory with the boundary element method. The JONSWAP spectrum is utilized to include the impact of an irregular wave with slow drift on the platform. The spectral ordinate is given by:
$$S(\omega)=\frac{\alpha g^2 \gamma^a}{\omega^5} \times \mathrm{e}^{\left(-\frac{5}{4} \times\left(\frac{\omega_p}{\omega}\right)^4\right)}$$ (9) $$a=\mathrm{e}^{\left(-\frac{\left(\omega-\omega_p\right)^2}{2 \sigma^2 \omega_p^2}\right)}$$ (10) $$\sigma=\left\{\begin{array}{l}0.09 \text { for } \omega>\omega_p \\ 0.07 \text { for } \omega \leqslant \omega_p\end{array}\right.$$ (11) $$\alpha=\frac{H_s{ }^2}{16 \int_0^{\infty} \frac{g^2 Y^a}{\omega^5} \times \exp \left(\frac{-5}{4} \times\left(\frac{\omega_p}{\omega}\right)^4\right) \mathrm{d} \omega}$$ (12) where, ω is wave frequency (rad/s), ωp is peak frequency (rad/s), g is acceleration due to gravity (m2/s), ϒ is Peakedness parameter or peak enhancement factor, a is spectral parameter (Eq. (10)), σ is spectral parameter (Eq. (11)), α is spectral energy constant (Eq. (12)).
The hydrodynamic loads (including drag and inertia force) acting on the semi-submersible can be calculated by:
$$F_d=\frac{1}{2} \rho C_D D|u| u+\rho C_M A \dot{u}$$ (13) $$\begin{gathered}F_d=\frac{1}{2} \rho C_D D|u| u-\frac{1}{2} \rho C D|\dot{x}| \dot{x}-\rho A C_M \\ \;\;\; +\rho C_M A \dot{u}+\rho A \ddot{x}\left(1+C_M\right)\end{gathered}$$ (14) Time-history of motions of semi-submersible connected with mooring lines under combined action of wind, wave, and current loads is generated using a numerical solver Ansys Aqwa.
3.2.3 Current load
Current forces on the hull of semi-submersible are assumed to be linearly decreasing with an increase in water depths starting from 1.7 m/s at surface, i.e., x=0 m, 50 m, 100 m, 150 m, 500 m, and zero at the seabed, i.e., x=1 500 m, as shown in Table 4. A hydrodynamic forces module in Ansys Aqwa is used to calculate current forces on a deep water semi-submersible. The Morison equation is used to compute the hydrodynamic forces acting on the semi-submersible due to current. The drag force, inertia force, and pressure force are considered by the Morison equation. To compute the hydrodynamic forces, the user needs enter the current velocity, water density, and geometry of semi-submersible is already taken as the input. By default value of coefficient of current for planar pontoon members of semi-submersible 1.5 is considered in this study.
3.3 Solution method
The first step of the analysis is to obtain hydrodynamic coefficients, including damping and added mass, diffraction forces, Froude-Krylov forces, mean drift-forces, response amplitude operators by diffraction analysis. The second step is to determine the motion response of the semi-submersible coupled with mooring lines under the action of wind loads, current loads, first and second-order wave loads along with drag and inertia loads on the mooring lines. The hull of semi-submersible is considered to be rigid, having six-degrees-of-freedom (DOF), while three DOF being translational, i.e., Surge, Sway and Heave and other three being rotational, i.e., Roll, Pitch and Yaw. Submerged section (wetted surface) of the semi-submersible is discretized into a number of elements and hydrodynamic coefficients are obtained by Greens function over the wetted surface.
 Figure 3 Mooring line model
3.4 Boundary conditions
In the present study, boundary conditions are applied to the mooring lines at the connection point (on the hull of semi-submersible) as well as fixed/anchor points on the sea bed. The seabed acts as a boundary condition to the diffraction analysis. Therefore, a time-domain analysis procedure is used and where step-wise time integration is performed for both the semi-submersible and mooring lines so that coupling between them is accounted for.
$$\begin{gathered}{\left[\boldsymbol{M}+\boldsymbol{M}_a\right] \ddot{x}(t)+\boldsymbol{C} \dot{x}+\boldsymbol{K} x=\boldsymbol{F}_{\text {Environmental }}(t)} \\ +\boldsymbol{F}_{\mathrm{WF}}(t)+\boldsymbol{F}_{\mathrm{WDF}}(t)+\boldsymbol{F}_{\text {Mooring }}(t)\end{gathered}$$ (15) where M6×6 is a mass matrix including added mass matrix Ma6×6, C6×6 indicates damping matrix, K6×6 is the stiffness matrix including hydrostatic stiffness, {FEnviromental}6 × 1 is the external load vector including effects of wind, wave, and current, {FMooring}6 × 1 is the load vector due to spread catenary mooring, {$x, \dot{x}$ and $\ddot{x}$} is the displacement, velocity, and acceleration vectors of semi-submersible, FWF is the wave frequency forces, FWDF is the wave drift forces.
In a random sea, the second-order wave drift forces consist of slow-varying low frequency (LF) effects and mean drift forces. The low-frequency forces are estimated by Newman's approximation, and wave-frequency (WF) forces consisting of Froude-Krylov forces, diffraction wave forces, radiation wave forces. The position and velocity of the platform is determined at each time-step, by integrating the accelerations due to the forces in time-domain, using the predictor-corrector integration scheme.
3.5 Potential flow theory
Ansys Aqwa uses a linear potential flow theory for solving diffraction and radiation problems. Waves around the semi-submersible are considered as incompressible, irrotational and inviscid fluid which is a Newtonian fluid. The velocity potential ϕ satisfies boundary conditions and Laplace equation, therefore, total velocity potential is expressed by the following equation.
$$\begin{align}\phi(x, & y, z, t)=\phi_i(x, y, z, t)+\phi_d(x, y, z, t) \\ &+\sum\limits_{n=1}^6 \xi_n \phi_{r_n}(x, y, z, t)\end{align}$$ (16) where ϕ (x, y, z, t) represent the total velocity potential; ϕi (x, y, z, t) indicates incident wave potential; ϕd (x, y, z, t) represent diffraction wave potential; ξn is the motion displacement of semi-submersible; n = 1, 2, …, 6 indicates surge, sway, heave, roll, pitch, and yaw respectively.
3.6 Meshing and grid independent study
In the numerical solver Ansys Aqwa, the option for meshing type controls the algorithm for mesh generation. In present study, program controlled option is selected for combined meshing algorithm that include surfaces along with lines. A grid independent study is carried out with minimum cell size of 0.5 m, 1 m and 2 m. When the minimum cell size is increased from 0.5 m to 1 m, the difference in the variable output is negligible. Therefore, a mesh size of one meter is selected for a large-sized semi-submersible and 12 000 diffracting element. Aqwa solver is limited to 18 000 elements and fully modeled semi-submersible is meshed employing a program-controlled option as shown in Figure 4.
 Figure 4 Schematic layout of the mooring system
3.7 Free decay test
The free oscillations studies performed for various configuration of mooring lines to estimating damping ratios and natural periods of semi-submersible under intact mooring conditions. The decay responses, for Case-C, i.e., buoy after the middle wire, have been shown in Figure 5, and the damping ratios and natural periods for all four Cases are shown in Table 6. Presence of buoy in mooring lines, decreased the natural periods for surge, heave, roll and pitch responses for the Cases-A, B, and C, whereas the damping ratios has also reduced for surge, sway, heave and roll. Roll, and pitch are strongly coupled with their natural periods nearby; buoy in mooring lines has altered the dynamics of mooring lines, which has significant positive influence on the fatigue life of mooring lines.
 Figure 5 Free decay responsesTable 6 Free decay test results
DOF Case-A Case-B Case-C Case-D Natural periods (s) Damping ratios (%) Natural periods (s) Damping ratios (%) Natural periods (s) Damping ratios (%) Natural periods (s) Damping ratios (%) Surge 208.5 6.1 195.1 6.5 192.8 2.9 173.5 3.1 Sway 164.5 6.9 183.2 6.7 183.5 3.1 171 3.2 Heave 21.4 2.4 20.8 1.2 20.9 0.4 20.7 1.5 Roll 24.1 2.9 22.7 1.4 23 0.9 23.1 1.4 Pitch 24.7 0.9 23.7 1.3 23.8 0.7 24 1.2 Yaw 49.5 6.5 53.6 10.3 54.3 2 56.6 2.1 Large natural periods in horizontal plane-of-motion induce compliance to overall geometric form of semi-submersible, which is the basic concept of any completely floating offshore structures (DNV GL, 2010). The semi-submersibles is widely used floating offshore platforms for exploration, production, drilling, well completion, work-over operations, etc.
3.8 Response amplitude operators
Before proceeding with detailed analysis, numerical model of HYSY-981 semi-submersible considered in the present study is validated with existing research carried out by Zhai et al. (2011) in the form of response amplitude operators (RAOs).
From the Figure 6, results of numerical model developed in present study closely match existing literature, and the overall profile of the curve is almost similar. The numerical model was tried to get closer results and was achieved. Still, a slight shift in the frequencies has been observed, which may be due to marginal errors during the numerical modeling of the semi-submersible.
 Figure 6 Response amplitude operators
4 Results and discussion
4.1 Global responses of the semi-submersible under intact mooring condition
The dynamic response analysis of semi-submersible for various mooring configurations due to buoy presence under intact condition whichever is significant are only discussed. In contrast, other responses like (roll, yaw) have been omitted for brevity. For example, surge, sway, heave, and pitch significantly in magnitude for respective wave heading, i.e., the surge in the 0°, sway in the 90°, heave in the 45°, and pitch in the 0° wave approach directions are only discussed, being significant and conciseness in data. The mean surge response for mooring lines without a buoy for Case-A is 26.89 m (see Table 8).
Table 7 Postulated damaged mooring linesMooring configuration 10-year return period 100-years return period 0° 45° 90° 0° 45° 90° Case-A #1, #14 #4, #16 #4, #5 #12, #14 #11, #12 #2, #13 Case-B #10, #12 #9, #10 #2, #14 #9, #11 #8, #9 #5, #6 Case-C #7, #9 #6, #7 #4, #5 #7, #9 #7, #8 #4, #5 Case-D #6, #8 #6, #7 #4, #5 #6, #8 #5, #6 #3, #4 Table 8 Statistics of motion responses of the semi-submersible under intact mooringDOF Statistics Case-A Case-B Case-C Case-D 0° 45° 90° 0° 45° 90° 0° 45° 90° 0° 45° 90° Surge Min 4.22 3.44 −0.01 9.14 6.07 −0.02 3.25 0.4 −5.58 10.03 6.55 −0.02 Max 55.82 26.17 −0.002 67.23 32.55 −0.001 61.1 26.81 −4.88 71.65 34.41 −0.000 8 Mean 26.89 13.54 −0.01 34.87 17.82 −0.01 29.03 12.11 −5.31 37.03 18.95 −0.011 S.D 7.68 3.12 0.002 8.88 3.59 0.003 8.87 3.58 0.09 9.43 3.81 0.003 Heave Min −14.65 −13.35 −12.64 −14.28 −12.9 −12.03 −14.05 −12.89 −12.01 −14.28 −12.92 −12.02 Max −0.73 −2.29 −3.76 0.77 −0.56 −2.5 0.61 −0.69 −2.53 1.11 −0.14 −2.2 Mean −8.9 −8.89 −8.92 −7.96 −7.95 −7.98 −8.01 −8.01 −8.04 −7.82 −7.8 −7.83 S.D 1.15 1.16 1.05 1.28 1.32 1.09 1.27 1.3 1.08 1.35 1.4 1.12 Pitch Min −11.1 −6.55 −0.004 −10.15 −5.89 −0.005 −10.38 −6.0 −0.14 −9.88 −5.68 −0.005 Max 6.84 4.19 0.004 6.09 4.14 0.004 6.39 4.06 −0.01 6.11 4.16 0.004 Mean −0.3 −0.11 −7.10E-05 −0.33 −0.13 −6.10E-05 −0.41 −0.21 −8.00E-02 −0.32 −0.13 −5.70E-05 S.D 1.52 1.05 0.000 8 1.63 1.12 0.001 1.62 1.11 0.01 1.67 1.15 0.001 Note: S.D indicates standard deviation After incorporating buoy in mooring lines (Case-B), the response has marginally increased to 34.87 m, for intact mooring conditions, as shown in Figure 7(a). Nevertheless, this increase is within the permissible range (i.e., response in horizontal plane shall not exceed 2.5% of the water depth) prescribed by the international standard code (DNV GL, 2008). The pitch response is unaffected by the presence of buoy, which is around ±4° i.e., the response is almost identical in all the Cases for a 10-year return period under intact mooring condition, as shown in Figure 7(b). Lateral motion of the semi-submersible i.e., sway response under 90° wave approach for the Case-A has a mean response of 9.34 m (see Table 8). After incorporating buoys, the maximum sway response is 12.82 m, but this insignificant increase in response is within the permissible limits as per (DNV GL, 2008).
 Figure 7 Motion responses of the semi-submersible during 10-year return period, under intact condition
If the motion response of semi-submersible is not in the permissible limit as per the standards, it eventually may lead to the damage of risers, mooring cables, and umbilical directly and indirectly connected to the semi-submersible (API, 2008). The semi-submersible motion statistics for a 10-year return period under intact and postulated damage conditions are shown in Tables 8–9. Whereas, response statistics for a 100-years return period are omitted for conciseness in data as well as, other responses, like surge in 45°, 90° directions, sway in 0°, 45° directions, heave in 0°, 90° directions, roll in 0°, 45° direction, pitch in 45°, 90° directions, yaw in 0°, 90°, etc., has been omitted in the discussion.
Table 9 Motion response statistics of semi-submersible under postulated failure conditionsDOF Statistics Case-A Case-B Case-C Case-D 0° 45° 90° 0° 45° 90° 0° 45° 90° 0° 45° 90° Surge Min 49.39 3.1 −39.18 18.73 5.37 −0.02 16.51 8.92 −0.01 12.2 −28.7 −39.92 Max 102.7 27.42 −0.01 103.22 32.12 −0.006 78.66 40.66 39.79 76.97 12.34 −0.01 Mean 72.41 14.07 −36.35 69.53 17.16 −0.01 43.77 24.68 34.17 40.5 −15.42 −32.54 S.D 8.11 3.36 1.98 9.43 3.68 0.003 9.6 3.93 1.87 9.97 4.21 1.87 Heave Min −15.42 −12.83 −12.13 −14.96 −13.6 −11.82 −14.25 −13.74 −11.8 −14.08 −12.78 −11.76 Max −0.3 −2.1 −3 0.98 0.13 −2.02 1.45 0.19 −1.98 1.76 0.46 −1.64 Mean −8.4 −8.37 −8.4 −7.58 −7.55 −7.57 −7.56 −7.55 −7.58 −7.44 −7.42 −7.45 S.D 1.21 1.18 1.05 1.38 1.39 1.11 1.36 1.44 1.12 1.43 1.46 1.16 Pitch Min −8.64 −6.81 −2.32 −8.15 −5.25 −0.005 −9.67 −5.29 −0.12 −9.63 −6.37 −1.91 Max 6.9 5.06 0.08 7.41 4.58 0.004 6.11 4.67 2.0 6.2 3.48 0.13 Mean 0.61 −0.1 −0.84 0.36 −0.12 −7.30E-05 −0.26 −0.07 0.69 −0.29 −0.78 −6.70E-01 S.D 1.55 1.07 0.08 1.67 1.14 0.001 1.66 1.16 0.07 1.7 1.21 0.09 The energy content in the heave response is increased due to a submerged buoy in the mooring lines. This is due to additional buoyancy provided to the semi-submersible by all lines pegged with a buoy. From Table 6, in the Case-A, natural periods of roll and pitch are in close proximity, hence there is a coupling between these responses. Furthermore, all these responses are far away from wave frequency, shown in Figure 8, preventing unbounded response (i. e., resonance) in heave degrees-of-freedom. And maximum peak is observed at the natural heave frequency, and other small peaks are due to second-order wave frequencies.
 Figure 8 Heave response for 45° wave heading under 10-year return period
4.2 Mooring tension variations under intact condition
Due to semi-submersible motion, there is dynamic variation in tension for the mooring lines, and causing fatigue damage. In the present study, submerged buoys are attached to all the mooring lines and designated as Case-B, Case-C, and Case-D as shown in Figure 1. The layout of mooring system for various directions of environmental loads under intact mooring conditions is shown in Figure 9. The mooring line #1, is randomly selected for 0° wave heading, as shown in Figure 10(a), for all four Cases to show the influence of number of buoys and their location on the tension of mooring lines (Chandrasekaran et al., 2020a). Under 0° wave heading, the tension in the mooring line #1 for all the Cases, under intact mooring condition, is shown in Figure 10(a). Tension in the mooring lines without a buoy (i.e., Case-A) is high compared to mooring lines pegged with buoy but, tension in Cases-C and D, are almost similar and least when compared to Case-B. For 45° wave heading, the mooring line #16 has been selected, as shown in Figure 10(b), tension in line #16 without a buoy (Case-A), is the highest, whereas, for the Cases-B & C, tension is almost identical. For the Case-D tension is least but, has a marginal shift, than Case-B & C. It can be inferred that direction of environmental loads is another parameter besides the position and number of submerged buoys.
 Figure 9 The layout of the mooring system under intact mooring condition
 Figure 10 Tension in the mooring lines during the 10-year return period, under intact mooring condition
Similarly, beam-sea condition (90° wave heading) mooring line #5, has been selected as shown in Figure 10(c). Tension in Case-A, is maximum, but for the Cases-B & D, tension is almost identical, whereas, for Case-C, there is a marginal increase in tension under intact mooring condition. Statistics of tension in mooring lines for all four Cases, under intact mooring conditions, is shown in Table 10. Mooring lines having highest tension is deliberately disconnected to represent "postulated failure". Again, analysis is carried out when mooring line is disconnected, which is known as postulated mooring damage or failure analysis (Chandrasekaran and Uddin, 2020).
Table 10 Statistics of the mooring force under intact conditionsMooring line Statistics Case-A Case-B Case-C Case-D 0° 45° 90° 0° 45° 90° 0° 45° 90° 0° 45° 90° #1 (MN) Min 3.61 3.43 3.05 2.83 2.58 2.18 2.21 2.11 2.17 2.1 2.05 2.08 Max 6.2 5.13 4.65 4.88 3.69 3.44 3.3 3.49 3.42 3.11 3.29 3.21 Mean 4.37 4.13 4 3.31 3.08 2.95 2.88 2.88 2.94 2.72 2.72 2.78 S.D 0.21 0.16 0.18 0.14 0.09 0.13 0.1 0.11 0.13 0.09 0.1 0.12 #2 (MN) Min 3.61 3.42 3.03 2.2 2.13 2.17 2.19 2.1 2.18 2.08 2.03 2.08 Max 6.09 5.05 4.63 3.32 3.51 3.42 3.3 3.5 3.43 3.1 3.3 3.22 Mean 4.34 4.12 3.98 2.89 2.89 2.95 2.86 2.88 2.95 2.7 2.71 2.78 S.D 0.2 0.16 0.19 0.1 0.11 0.13 0.11 0.11 0.13 0.1 0.1 0.12 #3 (MN) Min 3.56 3.4 3.02 2.17 2.11 2.18 2.14 2.08 2.2 2.05 2.01 2.09 Max 6 4.97 4.62 3.31 3.51 3.44 3.29 3.51 3.44 3.09 3.3 3.23 Mean 4.31 4.1 3.98 2.87 2.88 2.95 2.84 2.88 2.96 2.68 2.71 2.78 S.D 0.19 0.16 0.19 0.11 0.11 0.13 0.11 0.11 0.13 0.1 0.1 0.12 #4 (MN) Min 2.9 2.86 3 2.14 2.09 2.18 2.08 2.07 2.21 2.02 2 2.09 Max 4.52 4.68 4.61 3.3 3.51 3.45 3.29 3.52 3.47 3.09 3.31 3.25 Mean 3.91 3.91 3.97 2.85 2.88 2.96 2.83 2.88 2.97 2.66 2.7 2.79 S.D 0.17 0.19 0.19 0.11 0.11 0.13 0.12 0.12 0.13 0.1 0.1 0.12 #5 (MN) Min 2.82 2.84 3.02 2.09 2.07 2.19 2.12 2.52 2.72 2.02 2.31 2.53 Max 4.46 4.68 4.65 3.3 3.52 3.47 3.35 3.62 3.89 3.08 3.32 3.52 Mean 3.88 3.9 3.98 2.83 2.87 2.97 2.89 3.07 3.24 2.66 2.82 2.97 S.D 0.18 0.19 0.19 0.12 0.12 0.13 0.12 0.08 0.11 0.1 0.07 0.11 #6 (MN) Min 2.73 2.82 3.03 2.08 2.44 2.65 2.18 2.56 2.73 2.05 2.34 2.53 Max 4.42 4.68 4.63 3.29 3.54 3.79 3.35 3.66 3.9 3.09 3.36 3.53 Mean 3.86 3.9 3.98 2.83 3 3.15 2.91 3.09 3.25 2.68 2.83 2.98 S.D 0.18 0.19 0.19 0.12 0.08 0.11 0.12 0.08 0.12 0.1 0.07 0.11 #7 (MN) Min 2.65 2.82 3.05 2.13 2.47 2.65 2.24 2.6 2.73 2.07 2.38 2.54 Max 4.41 4.68 4.65 3.3 3.58 3.8 3.36 3.71 3.91 3.1 3.41 3.56 Mean 3.84 3.9 4 2.84 3.01 3.16 2.93 3.11 3.26 2.7 2.85 3 S.D 0.19 0.19 0.18 0.11 0.08 0.12 0.11 0.08 0.12 0.1 0.07 0.11 #8 (MN) Min 2.64 3.33 3.51 2.16 2.51 2.66 2.26 2.64 2.74 2.1 2.42 2.55 Max 4.41 4.71 4.95 3.31 3.63 3.82 3.37 3.75 3.93 3.11 3.45 3.58 Mean 3.84 4.02 4.16 2.87 3.03 3.17 2.95 3.13 3.26 2.72 2.87 3 S.D 0.19 0.15 0.15 0.11 0.08 0.12 0.11 0.08 0.12 0.09 0.07 0.11 #9 (MN) Min 2.72 3.36 3.51 2.19 2.55 2.67 2.82 2.75 2.67 2.66 2.57 2.55 Max 4.42 4.74 4.95 3.32 3.68 3.84 4.73 4.59 3.86 4.47 4.33 3.58 Mean 3.86 4.03 4.17 2.89 3.05 3.17 3.29 3.28 3.19 3.09 3.09 3 S.D 0.18 0.14 0.15 0.1 0.08 0.12 0.13 0.13 0.12 0.12 0.12 0.11 #10 (MN) Min 2.8 3.38 3.52 2.82 2.73 2.67 2.84 2.75 2.66 2.67 2.58 2.54 Max 4.45 4.77 4.96 4.7 4.57 3.84 4.86 4.61 3.83 4.63 4.37 3.56 Mean 3.88 4.05 4.18 3.27 3.26 3.17 3.32 3.28 3.18 3.13 3.1 3 S.D 0.18 0.14 0.16 0.13 0.13 0.12 0.14 0.13 0.12 0.14 0.12 0.11 #11 (MN) Min 2.88 3.41 3.52 2.82 2.74 2.66 2.84 2.74 2.64 2.67 2.58 2.53 Max 4.51 4.81 4.97 4.85 4.6 3.82 5 4.63 3.81 4.78 4.4 3.53 Mean 3.9 4.07 4.18 3.31 3.27 3.17 3.34 3.28 3.16 3.17 3.11 2.98 S.D 0.17 0.14 0.16 0.14 0.13 0.12 0.16 0.13 0.12 0.15 0.13 0.11 #12 (MN) Min 3.49 3.56 3.52 2.82 2.74 2.65 2.83 2.74 2.63 2.67 2.59 2.53 Max 5.88 5.76 4.97 5 4.63 3.8 5.13 4.65 3.79 4.94 4.43 3.52 Mean 4.27 4.26 4.18 3.34 3.28 3.16 3.37 3.29 3.15 3.21 3.12 2.97 S.D 0.18 0.18 0.16 0.16 0.13 0.12 0.18 0.13 0.11 0.17 0.13 0.11 #13 (MN) Min 3.55 3.57 3.52 2.83 2.74 2.64 2.69 2.5 2.13 2.66 2.43 2.08 Max 5.98 5.79 4.96 5.15 4.66 3.79 4.58 3.53 3.37 4.5 3.39 3.21 Mean 4.31 4.28 4.18 3.38 3.29 3.15 3.18 3 2.89 3.1 2.88 2.78 S.D 0.19 0.18 0.16 0.18 0.13 0.11 0.12 0.09 0.13 0.12 0.08 0.12 #14 (MN) Min 3.6 3.57 3.51 2.82 2.55 2.17 2.76 2.54 2.14 2.68 2.48 2.09 Max 6.07 5.81 4.95 4.73 3.62 3.42 4.98 3.72 3.4 4.98 3.59 3.25 Mean 4.34 4.28 4.17 3.27 3.06 2.95 3.27 3.04 2.9 3.21 2.94 2.79 S.D 0.2 0.18 0.15 0.13 0.09 0.13 0.16 0.09 0.13 0.18 0.08 0.12 #15 (MN) Min 3.61 3.57 3.51 2.83 2.61 2.19 2.76 2.53 2.13 2.67 2.46 2.09 Max 6.18 5.84 4.95 5.18 3.83 3.47 4.84 3.66 3.38 4.82 3.52 3.23 Mean 4.37 4.29 4.16 3.38 3.12 2.97 3.24 3.02 2.9 3.17 2.92 2.79 S.D 0.21 0.18 0.15 0.18 0.09 0.13 0.15 0.09 0.13 0.16 0.08 0.12 #16 (MN) Min 3.51 3.38 3 2.83 2.6 2.18 3.55 3.26 2.93 2.67 2.45 2.08 Max 5.9 4.9 4.61 5.03 3.76 3.45 6.1 4.96 4.55 4.66 3.45 3.22 Mean 4.28 4.08 3.97 3.35 3.1 2.96 4.27 4.02 3.87 3.13 2.9 2.78 S.D 0.18 0.16 0.19 0.16 0.09 0.13 0.21 0.16 0.19 0.14 0.08 0.12 When the environmental conditions are unprecedented, and platform excursion exceeds the permissible limits, then there will be snap or shock loads, causing failure/disconnection of the mooring line. Also, during installation and decommissioning, there are possible chances of failure of mooring lines due to several factors like failure of a windlass, improper connection of mooring at the deck, etc., have proven to be fatal. Hence, the uniqueness of the present study highlights the effects of these postulated failures on the dynamic responses of semi-submersible in deep waters. The postulated damaged mooring lines for Case-A are alone shown and highlighted in red color as disconnected or failed or damaged lines, as shown in Figure 11. For other Cases-B, C & D, the presupposed damaged mooring lines had been enlisted in Table 7.
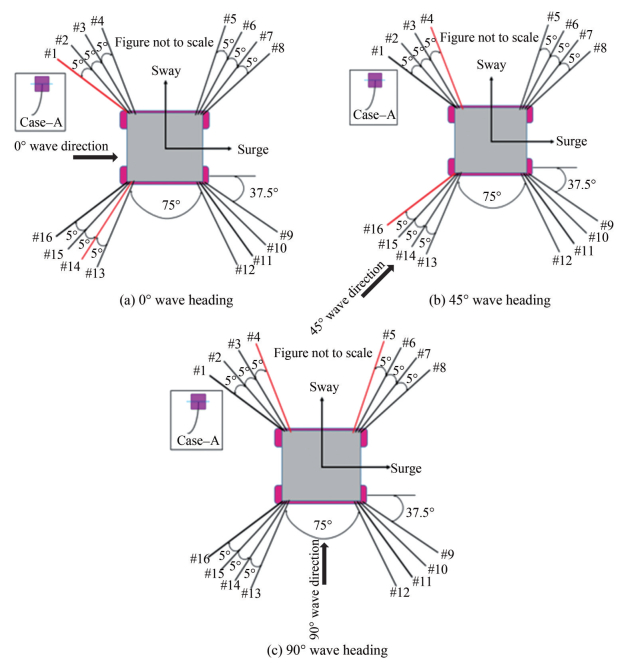 Figure 11 Layout of mooring system under postulated damaged mooring condition
4.3 Global responses of the semi-submersible under postulated damaged mooring condition
Motion response analysis of the semi-submersible is carried out under postulated damaged mooring lines and the damaged mooring lines are shown in Table 7. The surge response for Case-A, is maximum, with a mean of 72.41 m (see Table 9 and for Case-B, there is a marginal reduction in the surge response. Cases-C & D, there is a further reduction in the surge response due to reduction in natural periods of responses by the presence of buoys in the mooring lines. Hence, incorporating buoys in the mooring lines has minimized the surge response for Case-C and Case-D, under postulated damaged mooring condition, as shown in Figure 12(a).
 Figure 12 Motion responses of the semi-submersible during 10-year return period, under postulated damaged mooring condition
While the pitch response is not much affected by the postulated failure of mooring lines, for the Cases-A & B, pitch response is marginally higher than Cases-C & D, shown in Figure 12(b). This is due to coupling of heave and pitch response and reduction in natural periods by the presence of submerged buoys. All the responses are at large proximity to wave frequency and hence, preventing resonance response, as shown in Figure 13. The smaller peaks seen close to the frequency of a wave are due to wave-drift responses, and the magnitude of the highest peak at the natural frequency of heave is also marginally increased compared to Figure 8.
 Figure 13 Heave response for 45° wave heading during the 10-year return period, under postulated damaged mooring condition
4.4 Mooring tension variations under damaged mooring condition
For the Case-A, mooring lines #2 and #13, closer to disconnected mooring cables #1 and #14, are shown in Figure 14(a). Initially, under intact mooring conditions, the mean tension in mooring line #2 (Case-A) was 4.34 MN, but due to the failure of mooring line #1, there is transfer of mooring load to the adjacent line #2, and mean tension has increased to 5 MN.
 Figure 14 Tension in the mooring lines during 10-year return period, under postulated damaged mooring condition for the Case-A
Similarly, for line #13, under intact condition, the mean tension was 4.31 MN, and after the failure of line #14, the tension in line #13 has increased to 4.88 MN (Chandrasekaran et al., 2020b). For 45° wave heading, the mean tension in the mooring lines #3 and #15 under intact conditions were 4.1 MN and 4.29 MN (see Table 10). Due to postulated failure of mooring lines, there is an increase in tension for mooring line #3 to 4.58 MN. For line #15 tension has decreased to 3.97 MN, as shown in Figure 14(b), is due to the coupling of motion responses and asymmetric transfer of mooring forces.
For the beam sea conditions (i. e., 90° wave heading) under postulated failure of mooring lines #4 and #5, tension in the mooring lines #2 and #3 (see Table 11), closer to the damaged cables has marginally increased as shown in Figure 14(c). This is because of transfer of mooring load from the damaged mooring lines, resulted in the increase in tension for the lines present closer to the disconnected lines.
Table 11 Statistics of the mooring force under postulated failure conditionsMooring line Statistics Case-A Case-B Case-C Case-D 0° 45° 90° 0° 45° 90° 0° 45° 90° 0° 45° 90° #1 (MN) Min 0 3.85 2.98 2.7 2.27 2.32 2.05 2.05 2.03 2.01 1.98 2.19 Max 4.24 5.51 4.68 4.7 3.43 3.77 3.11 3.24 3.3 2.94 3.22 3.39 Mean 0.000 1 4.56 4 3.23 2.84 3.23 2.69 2.69 2.82 2.55 2.65 2.9 S.D 0.02 0.17 0.19 0.14 0.08 0.14 0.09 0.11 0.13 0.08 0.1 0.13 #2 (MN) Min 4.07 3.83 3.02 1.93 2.06 0 2.03 2.04 2.02 2 1.98 2.22 Max 6.98 5.46 4.72 2.97 3.24 3.01 3.11 3.25 3.29 2.94 3.26 3.42 Mean 5 4.57 4.05 2.58 2.69 0.001 2.68 2.69 2.8 2.55 2.67 2.94 S.D 0.26 0.17 0.19 0.09 0.11 0.06 0.1 0.11 0.13 0.09 0.1 0.13 #3 (MN) Min 4 3.8 3.05 1.89 2.05 2.32 2 2.02 2.01 1.96 1.98 2.25 Max 6.7 5.4 4.78 2.96 3.25 3.77 3.11 3.26 3.28 2.94 3.3 3.46 Mean 4.85 4.58 4.1 2.57 2.7 3.23 2.67 2.69 2.79 2.54 2.69 2.97 S.D 0.24 0.17 0.19 0.09 0.11 0.14 0.1 0.11 0.13 0.09 0.1 0.12 #4 (MN) Min 2.57 0 0 1.86 2.04 2.32 1.97 2.01 2 1.93 2 0 Max 4.38 3.97 4.01 2.95 3.27 3.75 3.11 3.28 3.28 2.94 3.34 2.82 Mean 3.68 0.000 1 0.000 1 2.55 2.7 3.21 2.66 2.7 2.78 2.53 2.72 0.000 3 S.D 0.17 0.02 0.02 0.1 0.11 0.14 0.11 0.11 0.12 0.1 0.11 0.03 #5 (MN) Min 2.48 3.08 0 1.83 2.03 2.32 2.03 2.49 2.42 1.98 2.75 2.74 Max 4.3 5.11 4.02 2.95 3.29 3.74 3.44 3.81 3.49 3.27 4.11 4.05 Mean 3.63 4.28 0.000 1 2.54 2.71 3.2 2.94 3.16 2.9 2.8 3.46 3.34 S.D 0.18 0.2 0.02 0.1 0.11 0.13 0.14 0.1 0.11 0.13 0.12 0.12 #6 (MN) Min 2.41 3.03 3.95 1.94 2.61 2.45 2.07 2.57 2.44 2.01 2.8 2.72 Max 4.23 5.07 5.62 3.26 3.93 3.49 3.46 3.89 3.52 3.3 4.17 4.04 Mean 3.59 4.24 4.92 2.82 3.26 2.93 2.97 3.2 2.92 2.83 3.49 3.31 S.D 0.18 0.2 0.19 0.12 0.1 0.11 0.13 0.1 0.11 0.13 0.12 0.12 #7 (MN) Min 2.34 3 4 2 2.69 2.44 2.11 2.65 2.46 2.05 0 2.74 Max 4.18 5.04 5.63 3.3 4.01 3.48 3.5 3.98 3.56 3.24 2.87 4.04 Mean 3.55 4.21 4.94 2.87 3.31 2.92 3.02 3.25 2.95 2.88 0.000 3 3.29 S.D 0.19 0.2 0.19 0.12 0.1 0.11 0.13 0.1 0.12 0.12 0.03 0.13 #8 (MN) Min 2.34 3.11 3.55 2.07 2.77 2.43 0 0 2.49 0 0 0 Max 4.19 4.38 4.85 3.35 4.1 3.49 2.95 3.06 3.61 2.78 2.88 2.94 Mean 3.56 3.75 4.17 2.93 3.36 2.92 0.000 1 0.000 1 2.98 0.000 3 0.000 3 0.000 3 S.D 0.19 0.14 0.15 0.12 0.1 0.11 0.01 0.01 0.12 0.03 0.03 0.03 #9 (MN) Min 2.4 3.15 3.49 2.15 0 2.42 3.1 3.07 2.84 2.9 2.68 2.41 Max 4.2 4.38 4.79 3.41 3.06 3.48 5.49 5.29 4.15 5.22 4.64 3.4 Mean 3.6 3.74 4.11 3 0.000 1 2.91 3.75 3.74 3.4 3.54 3.25 2.86 S.D 0.18 0.14 0.15 0.12 0.019 0.12 0.19 0.18 0.13 0.18 0.14 0.11 #10 (MN) Min 2.47 3.16 3.43 0 0 2.42 3.11 3.06 2.86 0 2.64 2.39 Max 4.29 4.38 4.73 3.17 3.18 3.48 5.7 5.33 4.18 3.01 4.6 3.36 Mean 3.64 3.74 4.06 0.000 1 0.000 1 2.91 3.8 3.75 3.43 0.000 3 3.2 2.83 S.D 0.18 0.14 0.15 0.02 0.02 0.12 0.21 0.18 0.13 0.03 0.14 0.11 #11 (MN) Min 2.56 3.16 3.37 3.17 3.05 2.43 3.11 3.05 2.87 2.9 2.6 2.37 Max 4.37 4.38 4.68 6.53 5.26 3.49 5.9 5.34 4.2 5.6 4.54 3.33 Mean 3.69 3.74 4.01 4.42 3.73 2.92 3.84 3.74 3.46 3.6 3.15 2.8 S.D 0.17 0.14 0.16 0.3 0.18 0.11 0.24 0.18 0.13 0.23 0.14 0.11 #12 (MN) Min 3.92 3.21 2.97 0 3.02 2.44 0 0 0 2.9 2.56 2.35 Max 6.44 5.21 4.36 3.21 5.25 3.48 3.22 3.19 3.11 5.78 4.49 3.3 Mean 4.75 3.88 3.63 0.000 1 3.7 2.92 0.000 1 0.000 1 0.001 3.64 3.11 2.78 S.D 0.21 0.17 0.16 0.02 0.18 0.11 0.02 0.02 0.01 0.26 0.13 0.1 #13 (MN) Min 4.01 3.23 2.96 3.21 3 2.45 2.61 2.27 0 2.45 2.13 1.97 Max 6.69 5.27 4.36 7.25 5.23 3.49 4.45 3.45 3 4.12 3 3.08 Mean 4.88 3.91 3.62 4.66 3.68 2.93 3.06 2.87 0.000 1 2.85 2.55 2.64 S.D 0.23 0.17 0.16 0.4 0.18 0.11 0.12 0.08 0.01 0.11 0.07 0.12 #14 (MN) Min 0 3.24 2.94 2.66 2.23 0 2.67 2.42 2.46 2.49 2.15 1.94 Max 4.22 5.32 4.36 4.49 3.37 3.01 4.94 3.68 3.8 4.6 3.1 3.06 Mean 0.000 1 3.93 3.61 3.14 2.81 0.001 3.21 2.97 3.26 3 2.57 2.61 S.D 0.02 0.17 0.16 0.12 0.08 0.03 0.17 0.09 0.13 0.15 0.07 0.12 #15 (MN) Min 4.1 3.26 2.94 2.78 2.36 2.31 2.65 2.37 2.42 2.47 2.14 1.95 Max 7.27 5.37 4.37 5.19 3.57 3.74 4.77 3.59 3.76 4.43 3.06 3.06 Mean 5.15 3.97 3.6 3.42 2.9 3.2 3.16 2.94 3.22 2.94 2.56 2.62 S.D 0.29 0.17 0.16 0.19 0.09 0.13 0.15 0.09 0.13 0.13 0.07 0.12 #16 (MN) Min 3.91 0 3.1 2.74 2.32 2.32 2.63 2.32 2.38 2.46 2.14 1.96 Max 6.45 4.07 4.85 4.94 3.49 3.76 4.61 3.52 3.71 4.27 3.03 3.07 Mean 4.72 0.000 1 4.15 3.32 2.87 3.21 3.11 2.9 3.18 2.89 2.56 2.63 S.D 0.21 0.025 0.19 0.16 0.08 0.14 0.13 0.08 0.14 0.12 0.07 0.12 Still, sometimes there will be a marginal increase due to coupling between the responses, and under damage conditions, if the tension in a line has increased, then other line tension will decrease. It is impossible to estimate exactly the increase or decrease in tension for mooring lines since response varies with wave frequencies, the coupling between degrees-of-freedom, complex mooring dynamics, and can be measured experimentally using sensors exactly to a closer extent. For the following sea condition (i.e., 0° wave heading) for Case-B, under damage mooring scenario, tension in the mooring line #11, has increased from 3.31 MN (see Table 10) to 4.42 MN (see Table 11). Similarly, for mooring line #13, there is increase in tension, from 3.27 MN (see Table 10) to 4.66 MN (see Table 11), due to transfer of mooring load from the damaged mooring lines. However, due to conciseness in data, tension in mooring lines closer to the postulated disconnected mooring lines is shown in Figure 15(a).
 Figure 15 Tension in the mooring lines during the 10-year return period, under postulated damaged mooring condition for the Case-B
For quartering sea conditions (i. e., 45° wave heading), tension in the mooring lines #11 and #12, under intact conditions, were 3.27 MN and 3.05 MN, respectively (see Table 10). After the postulated failure of the mooring cables #9 and #10, tension increased to 3.73 MN and 3.7 MN, respectively (see Table 11). Here, an almost identical or symmetric transfer of mooring load has occurred, as shown in Figure 15(b), but this is not usual. There will be coupling between the degrees of freedom and change in mooring line dynamics. Hence, transferring the mooring load between mooring lines will be primarily unsymmetrical. For the beam sea conditions (i.e., 90° wave heading), under intact mooring conditions, the tension in the mooring cables, #1 and #13 was 2.95 MN and 3.15 MN respectively (see Table 10). Due to the failure of lines #2 and #14, the mooring tension for line #1, which is closer to the disconnected mooring lines has increased. For mooring line #1, increase in tension is higher than line #13, due to the direction of environmental loads and position of the mooring line. Even during failure scenario of mooring lines, after including submerged buoy tension in line #13, it is worth noting that it has decreased to 2.93 MN, as shown in Figure 15(c).
For the Case-C, under intact mooring conditions, tension in the mooring lines #8 and #10 were 2.89 MN and 3.31 MN (see Table 10). Damage to their adjacent mooring lines #7 and #9, increased the tension to 3.74 MN and 3.8 MN, as shown in Figure 16(a). It is seen that for the mooring line #8 increase in tension was enormous, than the mooring cable #10. Because mooring line #8, was in between the damaged mooring lines #7 and #9, hence, more load is transferred. For quartering sea loads (i.e., 45° wave heading), initially under intact mooring conditions, tension in the mooring lines #5 and #8 were 3 MN and 3.05 MN (see Table 10), respectively. After deliberately disconnecting mooring lines #6 and #7, the tension in the adjacent cables #5 and #8 increase to 3.72 MN and 3.43 MN (see Table 11). Since mooring line #5 is closer to the damaged mooring lines #6 and #7, tension in mooring line #5 is marginally higher than mooring line #8, as shown in Figure 16(b). During 45° wave heading, there is a strong coupling between pitch and roll. Hence, this may be the reason for the unsymmetrical transfer of mooring load to adjacent mooring lines. A similar phenomenon is observed in beam sea conditions for the mooring lines #3 and #6. It worth noting that mooring tension for the lines near disconnected lines has increased. Still, for the other mooring lines, even under postulated damage mooring conditions, tension has reduced after including buoys in mooring lines, as shown in Figure 16(c).
 Figure 16 Tension in the mooring lines during the 10-year return period, under postulated damaged mooring condition for the Case-C
For the Case-D, during a 0° wave heading, the tension in the mooring lines #7, #5 before and after the failure of mooring lines is almost similar as shown in Figure 17(a). This is due to the configuration of mooring system, coupling between various responses, direction of wave loads. Reduction in natural periods due to submerged buoys has marginally increased the buoyancy of semi-submersible. Even under the mooring lines postulated failure, tension in other mooring lines has decreased (see Tables 10‒11). Here, mooring lines adjacent to the damaged mooring lines are discussed to show the transfer of mooring forces and emphasize the tension reduction under buoy in the mooring lines.
 Figure 17 Tension in the mooring lines during the 10-year return period, under postulated damaged mooring condition for the Case-D
A similar phenomenon of increase in mooring tension for the lines located in closer proximity to the damaged mooring cables has been observed for quartering-sea conditions. Under intact conditions the tension in the mooring lines #5 and #8 is almost identical as depicted from Figure 17(b). This is due to geometric form of the semi-submersible and symmetric layout of the mooring system. After the postulated failure, the increase in tension is not similar; this is due to variable submergence effect, leading to the coupling between responses. For 90° wave heading, mooring tension for lines #3 and #6 has increased, as seen from Figure 17(c). The mooring tension statistics under the intact and postulated damage mooring conditions for a 100-years return period are omitted due to brevity.
Tension spectra for mooring line #1, under 0° wave heading for 100-years return period, is shown in Figure 18(a).
 Figure 18 Tension spectra for mooring lines during 100-years return period, under postulated damaged mooring condition
For Case-A, the energy present in line #1 is more, after incorporating buoys reduction in the tension of mooring line is observed. The first highest-peak is due to semi-submersibles low-frequency motion, which is strongly dependent on the dynamics of passive restraining system. The second highest-peak is due to natural frequency of heave at 0.3 rad/s, and third highest-peak is due to the wave frequency at 0.46 rad/s. Further, similar peaks are seen for the Cases-B, C, and D, but the magnitude is significantly less due to the presence of buoys in the mooring lines. For quartering wave, only two-peaks are observed, first group of peaks near the heave's natural frequency and second group peak near wave frequency. The smaller peak for Cases-B, C, and D, at 0.01 rad/s as shown in Figure 18(b) is due to the presence of submerged buoys, which altered the mooring dynamics at lower frequencies. For beam sea conditions, tension spectra for the Cases-B and C are zero, as shown in Figure 18(c), this is because line #5, is damaged for a 100-years return period during a 90° wave heading. From Figure 18(c), all the peaks appear at lower frequencies; because of the direction of environmental loads, position of the mooring line, and strong coupling between various responses.
4.5 Fatigue analysis
Due to the dynamic motion of semi-submersible tension in the mooring lines vary dynamically and pose threat of fatigue damage for the mooring lines. Under intact and postulated damage mooring conditions, estimation of fatigue life is carried out by the Palmgren-Miners rule. After evaluating averages of cycles and relative stress ranges; using Goodman's diagram, conversion of each cycle of stress into equivalent stress range of non-zero mean process. According to the Palmgren-Miners rule, fatigue damage will occur once strain-induced energy of fluctuating amplitude (n) is equivalent to the cycle of constant amplitude (N) and is known as fatigue damage. And parameters of the S-N curve are selected following the standards of (DNV, 2005), and damage due to fatigue is calculated, followed by an estimation of fatigue life of the mooring cables for almost three hours duration i.e., 10 000 s. An external toolbox is used in the Matlab to calculate the cycle ranges, number of counts, minimum and maximum mooring stress amplitudes using rain flow counting algorithm.
Finally, for estimating the fatigue life of the mooring lines an in-house developed Matlab code has been used. Rain flow histograms for minimum and maximum fatigue life of the mooring line for Case-D, under a 10-year return period for damaged mooring condition is shown in Figure 19.
 Figure 19 Rain flow histograms for the Case-d during the 10-year return period, under postulated damaged mooring condition
The mooring line #13, has a maximum stress range closer to its yield strength and predicts maximum fatigue damage and least fatigue life. On the contrary, fatigue damage is least for mooring line #2, because of the significant difference in mean stress and the cycle average.
Tension in mooring lines without buoy is higher, after the inclusion of submerged buoy in the mooring lines, tension has decreased (Mavrakos et al., 1992; Chandrasekaran et al., 2020b) because of the change in stiffness of mooring lines, additional buoyancy is provided by the submerged buoys, and varying mooring dynamics. Fatigue life of the mooring lines for all the Cases, under intact and postulated damage mooring conditions for a 10-year return period, is shown in Figure 20.
 Figure 20 Fatigue life of the mooring lines during 10-year return period
Under intact mooring conditions, fatigue life of mooring lines without buoy (i.e., Case-A) is the least, after incorporating buoy in the mooring lines (i.e., for Cases-B, C, and D) has significantly reduce fatigue damage of the mooring cables. Even under the postulated failure of the mooring lines, the fatigue life of almost all mooring cables pegged with buoys is significantly higher than the mooring lines without the buoy (Chandrasekaran et al., 2020a). This enhancement is unsymmetrical despite having a symmetric configuration for unidirectional environmental loading. This is because of strong coupling between responses, slow-drift response of semi-submersible, change in the dynamics of mooring lines.
5 Conclusions
The present study consist of all possible combinations of submerged buoys in mooring lines for position restraining of semi-submersible. The numerical model of present study is closely compared with the existing literature; confirming the degree of accuracy of the developed numerical model. Detailed numerical analysis is carried out under combined action of wind, wave, and current forces for various environmental directions towards the semi-submersible. The mean responses in the horizontal plane of motion marginally increased due to a decrease in horizontal component of restoring force but, this slight increase falls within the permissible limit of the international standard code.
In the absence of submerged buoy, under intact and postulated failure condition, tension in the mooring lines in closer proximity to the damaged mooring lines is significantly increased. Hence, increasing fatigue damage due to transfer of mooring load from the damaged mooring line to the adjacent lines. On the other hand, this increased fatigue damage is reduced by the inclusion of submerged buoys in the mooring lines. Due to reduced mooring tension as well as, due to maximum difference of mean stress-induced and yield stress of mooring lines also, coupling of motion responses.
Finally, comparison with Case-B and Case-D, show better fatigue life of the mooring lines despite of the postulated damaged mooring conditions. But, Case-D consists of more number of submerged buoys, which will definitely increase the overall cost on comparison with Case-B. Hence, the Case-B can be recommended for the industrial take away, subjected to the condition, this work serves as a proof of concept and recommends thorough experimental investigations. Various submerged buoy sizes and locations, different mooring configurations, as well as, considering the effect of corrosion of the mooring lines for predicting fatigue damage can be studied to further extend this research work. Following are the major conclusions that can be drawn based on the present work carried out in the present study.
1) Numerical model of the semi-submersible considered in the present work is compared with the existing research work and the results are in closely matching in terms of RAOs, thus ensuring accuracy of the developed numerical model.
2) Semi-submersible is observed to be slightly flexible in horizontal plane of motion and rigid in the vertical plane of motion. Moreover, semi-submersible is stable against high waves due to is unique geometric form, symmetric pattern and configuration of mooring lines.
3) The motion responses of semi-submersible under intact and damaged mooring conditions are found to be within the permissible limits as prescribed by the international standards.
4) Addition of submerged buoys has enhanced the fatigue life of the mooring lines even under postulated damaged mooring conditions. However, judicious selection for the location and number of mooring buoys is the choice of the client, since it involves additional capital and other complexities for installation and commissioning.
Acknowledgement: The authors thank PG Senapathy Centre, Indian Institute of Technology Madras for providing computational facility required for the present work.Competing interest The authors have no competing interests to declare that are relevant to the content of this article. -
Figure 1 Numerical model of the semi-submersible under various mooring configurations
Figure 2 Schematic layout of the mooring system
Figure 3 Mooring line model
Figure 4 Schematic layout of the mooring system
Figure 5 Free decay responses
Figure 6 Response amplitude operators
Figure 7 Motion responses of the semi-submersible during 10-year return period, under intact condition
Figure 8 Heave response for 45° wave heading under 10-year return period
Figure 9 The layout of the mooring system under intact mooring condition
Figure 10 Tension in the mooring lines during the 10-year return period, under intact mooring condition
Figure 11 Layout of mooring system under postulated damaged mooring condition
Figure 12 Motion responses of the semi-submersible during 10-year return period, under postulated damaged mooring condition
Figure 13 Heave response for 45° wave heading during the 10-year return period, under postulated damaged mooring condition
Figure 14 Tension in the mooring lines during 10-year return period, under postulated damaged mooring condition for the Case-A
Figure 15 Tension in the mooring lines during the 10-year return period, under postulated damaged mooring condition for the Case-B
Figure 16 Tension in the mooring lines during the 10-year return period, under postulated damaged mooring condition for the Case-C
Figure 17 Tension in the mooring lines during the 10-year return period, under postulated damaged mooring condition for the Case-D
Figure 18 Tension spectra for mooring lines during 100-years return period, under postulated damaged mooring condition
Figure 19 Rain flow histograms for the Case-d during the 10-year return period, under postulated damaged mooring condition
Figure 20 Fatigue life of the mooring lines during 10-year return period
Table 1 Characteristics of the semi-submersible
Water depth (m) 1 500 Draft (m) 19 Pontoon members (m3) 114.07×20.12×8.54 Column members (m3) 17.385×17.385×21.46 Deck size (m3) 74.42×74.42×8.6 Displacement (kg) 48 206 800 Center of gravity (m) −8.9 The radius of gyration rx (m) 32.4 The radius of gyration ry (m) 32.1 The radius of gyration rz (m) 34.4 Table 2 Properties of the mooring system
Description Configuration of mooring lines Upper chain Middle wire Lower chain Mass/unit length (kg/m) 163.7 36.3 163.7 Equivalent cross-sectional area (m2) 0.014 0.014 0.014 Axial rigidity AE (N) 676 810 000 833 910 000 676 810 000 Equivalent diameter (m) 0.095 0.095 0.095 Table 3 Description of the submerged buoy
Structural mass (kg) 5861.6 Displaced mass of water (kg) 67 086.1 Added mass (kg) 33 543 CD × Area (m2) 23.56 Table 4 Environmental conditions
Description The return period of the event 10-year return period 100-years return period Significant wave height Hs (m) 11.1 13.3 Peak wave period Tp (s) 13.6 15.5 Parameter of peakedness γ 5 7 Speed of wind Vwind (m/s) 48.3 55 Speed of current Vcurrent (m/s) 1.7 1.97 Table 5 Value of the wind force coefficient
Degrees of freedom Directions 0° 30° 60° 90° Surge 0.5 0.7 0.4 0.3 Sway 0.2 0.1 0.1 0.2 Heave 0.5 0.4 0.3 0.4 Roll 0.5 0.2 0.2 0.3 Pitch 0.5 0.3 0.2 0.3 Yaw 0.5 0.1 0.1 0.2 Table 6 Free decay test results
DOF Case-A Case-B Case-C Case-D Natural periods (s) Damping ratios (%) Natural periods (s) Damping ratios (%) Natural periods (s) Damping ratios (%) Natural periods (s) Damping ratios (%) Surge 208.5 6.1 195.1 6.5 192.8 2.9 173.5 3.1 Sway 164.5 6.9 183.2 6.7 183.5 3.1 171 3.2 Heave 21.4 2.4 20.8 1.2 20.9 0.4 20.7 1.5 Roll 24.1 2.9 22.7 1.4 23 0.9 23.1 1.4 Pitch 24.7 0.9 23.7 1.3 23.8 0.7 24 1.2 Yaw 49.5 6.5 53.6 10.3 54.3 2 56.6 2.1 Table 7 Postulated damaged mooring lines
Mooring configuration 10-year return period 100-years return period 0° 45° 90° 0° 45° 90° Case-A #1, #14 #4, #16 #4, #5 #12, #14 #11, #12 #2, #13 Case-B #10, #12 #9, #10 #2, #14 #9, #11 #8, #9 #5, #6 Case-C #7, #9 #6, #7 #4, #5 #7, #9 #7, #8 #4, #5 Case-D #6, #8 #6, #7 #4, #5 #6, #8 #5, #6 #3, #4 Table 8 Statistics of motion responses of the semi-submersible under intact mooring
DOF Statistics Case-A Case-B Case-C Case-D 0° 45° 90° 0° 45° 90° 0° 45° 90° 0° 45° 90° Surge Min 4.22 3.44 −0.01 9.14 6.07 −0.02 3.25 0.4 −5.58 10.03 6.55 −0.02 Max 55.82 26.17 −0.002 67.23 32.55 −0.001 61.1 26.81 −4.88 71.65 34.41 −0.000 8 Mean 26.89 13.54 −0.01 34.87 17.82 −0.01 29.03 12.11 −5.31 37.03 18.95 −0.011 S.D 7.68 3.12 0.002 8.88 3.59 0.003 8.87 3.58 0.09 9.43 3.81 0.003 Heave Min −14.65 −13.35 −12.64 −14.28 −12.9 −12.03 −14.05 −12.89 −12.01 −14.28 −12.92 −12.02 Max −0.73 −2.29 −3.76 0.77 −0.56 −2.5 0.61 −0.69 −2.53 1.11 −0.14 −2.2 Mean −8.9 −8.89 −8.92 −7.96 −7.95 −7.98 −8.01 −8.01 −8.04 −7.82 −7.8 −7.83 S.D 1.15 1.16 1.05 1.28 1.32 1.09 1.27 1.3 1.08 1.35 1.4 1.12 Pitch Min −11.1 −6.55 −0.004 −10.15 −5.89 −0.005 −10.38 −6.0 −0.14 −9.88 −5.68 −0.005 Max 6.84 4.19 0.004 6.09 4.14 0.004 6.39 4.06 −0.01 6.11 4.16 0.004 Mean −0.3 −0.11 −7.10E-05 −0.33 −0.13 −6.10E-05 −0.41 −0.21 −8.00E-02 −0.32 −0.13 −5.70E-05 S.D 1.52 1.05 0.000 8 1.63 1.12 0.001 1.62 1.11 0.01 1.67 1.15 0.001 Note: S.D indicates standard deviation Table 9 Motion response statistics of semi-submersible under postulated failure conditions
DOF Statistics Case-A Case-B Case-C Case-D 0° 45° 90° 0° 45° 90° 0° 45° 90° 0° 45° 90° Surge Min 49.39 3.1 −39.18 18.73 5.37 −0.02 16.51 8.92 −0.01 12.2 −28.7 −39.92 Max 102.7 27.42 −0.01 103.22 32.12 −0.006 78.66 40.66 39.79 76.97 12.34 −0.01 Mean 72.41 14.07 −36.35 69.53 17.16 −0.01 43.77 24.68 34.17 40.5 −15.42 −32.54 S.D 8.11 3.36 1.98 9.43 3.68 0.003 9.6 3.93 1.87 9.97 4.21 1.87 Heave Min −15.42 −12.83 −12.13 −14.96 −13.6 −11.82 −14.25 −13.74 −11.8 −14.08 −12.78 −11.76 Max −0.3 −2.1 −3 0.98 0.13 −2.02 1.45 0.19 −1.98 1.76 0.46 −1.64 Mean −8.4 −8.37 −8.4 −7.58 −7.55 −7.57 −7.56 −7.55 −7.58 −7.44 −7.42 −7.45 S.D 1.21 1.18 1.05 1.38 1.39 1.11 1.36 1.44 1.12 1.43 1.46 1.16 Pitch Min −8.64 −6.81 −2.32 −8.15 −5.25 −0.005 −9.67 −5.29 −0.12 −9.63 −6.37 −1.91 Max 6.9 5.06 0.08 7.41 4.58 0.004 6.11 4.67 2.0 6.2 3.48 0.13 Mean 0.61 −0.1 −0.84 0.36 −0.12 −7.30E-05 −0.26 −0.07 0.69 −0.29 −0.78 −6.70E-01 S.D 1.55 1.07 0.08 1.67 1.14 0.001 1.66 1.16 0.07 1.7 1.21 0.09 Table 10 Statistics of the mooring force under intact conditions
Mooring line Statistics Case-A Case-B Case-C Case-D 0° 45° 90° 0° 45° 90° 0° 45° 90° 0° 45° 90° #1 (MN) Min 3.61 3.43 3.05 2.83 2.58 2.18 2.21 2.11 2.17 2.1 2.05 2.08 Max 6.2 5.13 4.65 4.88 3.69 3.44 3.3 3.49 3.42 3.11 3.29 3.21 Mean 4.37 4.13 4 3.31 3.08 2.95 2.88 2.88 2.94 2.72 2.72 2.78 S.D 0.21 0.16 0.18 0.14 0.09 0.13 0.1 0.11 0.13 0.09 0.1 0.12 #2 (MN) Min 3.61 3.42 3.03 2.2 2.13 2.17 2.19 2.1 2.18 2.08 2.03 2.08 Max 6.09 5.05 4.63 3.32 3.51 3.42 3.3 3.5 3.43 3.1 3.3 3.22 Mean 4.34 4.12 3.98 2.89 2.89 2.95 2.86 2.88 2.95 2.7 2.71 2.78 S.D 0.2 0.16 0.19 0.1 0.11 0.13 0.11 0.11 0.13 0.1 0.1 0.12 #3 (MN) Min 3.56 3.4 3.02 2.17 2.11 2.18 2.14 2.08 2.2 2.05 2.01 2.09 Max 6 4.97 4.62 3.31 3.51 3.44 3.29 3.51 3.44 3.09 3.3 3.23 Mean 4.31 4.1 3.98 2.87 2.88 2.95 2.84 2.88 2.96 2.68 2.71 2.78 S.D 0.19 0.16 0.19 0.11 0.11 0.13 0.11 0.11 0.13 0.1 0.1 0.12 #4 (MN) Min 2.9 2.86 3 2.14 2.09 2.18 2.08 2.07 2.21 2.02 2 2.09 Max 4.52 4.68 4.61 3.3 3.51 3.45 3.29 3.52 3.47 3.09 3.31 3.25 Mean 3.91 3.91 3.97 2.85 2.88 2.96 2.83 2.88 2.97 2.66 2.7 2.79 S.D 0.17 0.19 0.19 0.11 0.11 0.13 0.12 0.12 0.13 0.1 0.1 0.12 #5 (MN) Min 2.82 2.84 3.02 2.09 2.07 2.19 2.12 2.52 2.72 2.02 2.31 2.53 Max 4.46 4.68 4.65 3.3 3.52 3.47 3.35 3.62 3.89 3.08 3.32 3.52 Mean 3.88 3.9 3.98 2.83 2.87 2.97 2.89 3.07 3.24 2.66 2.82 2.97 S.D 0.18 0.19 0.19 0.12 0.12 0.13 0.12 0.08 0.11 0.1 0.07 0.11 #6 (MN) Min 2.73 2.82 3.03 2.08 2.44 2.65 2.18 2.56 2.73 2.05 2.34 2.53 Max 4.42 4.68 4.63 3.29 3.54 3.79 3.35 3.66 3.9 3.09 3.36 3.53 Mean 3.86 3.9 3.98 2.83 3 3.15 2.91 3.09 3.25 2.68 2.83 2.98 S.D 0.18 0.19 0.19 0.12 0.08 0.11 0.12 0.08 0.12 0.1 0.07 0.11 #7 (MN) Min 2.65 2.82 3.05 2.13 2.47 2.65 2.24 2.6 2.73 2.07 2.38 2.54 Max 4.41 4.68 4.65 3.3 3.58 3.8 3.36 3.71 3.91 3.1 3.41 3.56 Mean 3.84 3.9 4 2.84 3.01 3.16 2.93 3.11 3.26 2.7 2.85 3 S.D 0.19 0.19 0.18 0.11 0.08 0.12 0.11 0.08 0.12 0.1 0.07 0.11 #8 (MN) Min 2.64 3.33 3.51 2.16 2.51 2.66 2.26 2.64 2.74 2.1 2.42 2.55 Max 4.41 4.71 4.95 3.31 3.63 3.82 3.37 3.75 3.93 3.11 3.45 3.58 Mean 3.84 4.02 4.16 2.87 3.03 3.17 2.95 3.13 3.26 2.72 2.87 3 S.D 0.19 0.15 0.15 0.11 0.08 0.12 0.11 0.08 0.12 0.09 0.07 0.11 #9 (MN) Min 2.72 3.36 3.51 2.19 2.55 2.67 2.82 2.75 2.67 2.66 2.57 2.55 Max 4.42 4.74 4.95 3.32 3.68 3.84 4.73 4.59 3.86 4.47 4.33 3.58 Mean 3.86 4.03 4.17 2.89 3.05 3.17 3.29 3.28 3.19 3.09 3.09 3 S.D 0.18 0.14 0.15 0.1 0.08 0.12 0.13 0.13 0.12 0.12 0.12 0.11 #10 (MN) Min 2.8 3.38 3.52 2.82 2.73 2.67 2.84 2.75 2.66 2.67 2.58 2.54 Max 4.45 4.77 4.96 4.7 4.57 3.84 4.86 4.61 3.83 4.63 4.37 3.56 Mean 3.88 4.05 4.18 3.27 3.26 3.17 3.32 3.28 3.18 3.13 3.1 3 S.D 0.18 0.14 0.16 0.13 0.13 0.12 0.14 0.13 0.12 0.14 0.12 0.11 #11 (MN) Min 2.88 3.41 3.52 2.82 2.74 2.66 2.84 2.74 2.64 2.67 2.58 2.53 Max 4.51 4.81 4.97 4.85 4.6 3.82 5 4.63 3.81 4.78 4.4 3.53 Mean 3.9 4.07 4.18 3.31 3.27 3.17 3.34 3.28 3.16 3.17 3.11 2.98 S.D 0.17 0.14 0.16 0.14 0.13 0.12 0.16 0.13 0.12 0.15 0.13 0.11 #12 (MN) Min 3.49 3.56 3.52 2.82 2.74 2.65 2.83 2.74 2.63 2.67 2.59 2.53 Max 5.88 5.76 4.97 5 4.63 3.8 5.13 4.65 3.79 4.94 4.43 3.52 Mean 4.27 4.26 4.18 3.34 3.28 3.16 3.37 3.29 3.15 3.21 3.12 2.97 S.D 0.18 0.18 0.16 0.16 0.13 0.12 0.18 0.13 0.11 0.17 0.13 0.11 #13 (MN) Min 3.55 3.57 3.52 2.83 2.74 2.64 2.69 2.5 2.13 2.66 2.43 2.08 Max 5.98 5.79 4.96 5.15 4.66 3.79 4.58 3.53 3.37 4.5 3.39 3.21 Mean 4.31 4.28 4.18 3.38 3.29 3.15 3.18 3 2.89 3.1 2.88 2.78 S.D 0.19 0.18 0.16 0.18 0.13 0.11 0.12 0.09 0.13 0.12 0.08 0.12 #14 (MN) Min 3.6 3.57 3.51 2.82 2.55 2.17 2.76 2.54 2.14 2.68 2.48 2.09 Max 6.07 5.81 4.95 4.73 3.62 3.42 4.98 3.72 3.4 4.98 3.59 3.25 Mean 4.34 4.28 4.17 3.27 3.06 2.95 3.27 3.04 2.9 3.21 2.94 2.79 S.D 0.2 0.18 0.15 0.13 0.09 0.13 0.16 0.09 0.13 0.18 0.08 0.12 #15 (MN) Min 3.61 3.57 3.51 2.83 2.61 2.19 2.76 2.53 2.13 2.67 2.46 2.09 Max 6.18 5.84 4.95 5.18 3.83 3.47 4.84 3.66 3.38 4.82 3.52 3.23 Mean 4.37 4.29 4.16 3.38 3.12 2.97 3.24 3.02 2.9 3.17 2.92 2.79 S.D 0.21 0.18 0.15 0.18 0.09 0.13 0.15 0.09 0.13 0.16 0.08 0.12 #16 (MN) Min 3.51 3.38 3 2.83 2.6 2.18 3.55 3.26 2.93 2.67 2.45 2.08 Max 5.9 4.9 4.61 5.03 3.76 3.45 6.1 4.96 4.55 4.66 3.45 3.22 Mean 4.28 4.08 3.97 3.35 3.1 2.96 4.27 4.02 3.87 3.13 2.9 2.78 S.D 0.18 0.16 0.19 0.16 0.09 0.13 0.21 0.16 0.19 0.14 0.08 0.12 Table 11 Statistics of the mooring force under postulated failure conditions
Mooring line Statistics Case-A Case-B Case-C Case-D 0° 45° 90° 0° 45° 90° 0° 45° 90° 0° 45° 90° #1 (MN) Min 0 3.85 2.98 2.7 2.27 2.32 2.05 2.05 2.03 2.01 1.98 2.19 Max 4.24 5.51 4.68 4.7 3.43 3.77 3.11 3.24 3.3 2.94 3.22 3.39 Mean 0.000 1 4.56 4 3.23 2.84 3.23 2.69 2.69 2.82 2.55 2.65 2.9 S.D 0.02 0.17 0.19 0.14 0.08 0.14 0.09 0.11 0.13 0.08 0.1 0.13 #2 (MN) Min 4.07 3.83 3.02 1.93 2.06 0 2.03 2.04 2.02 2 1.98 2.22 Max 6.98 5.46 4.72 2.97 3.24 3.01 3.11 3.25 3.29 2.94 3.26 3.42 Mean 5 4.57 4.05 2.58 2.69 0.001 2.68 2.69 2.8 2.55 2.67 2.94 S.D 0.26 0.17 0.19 0.09 0.11 0.06 0.1 0.11 0.13 0.09 0.1 0.13 #3 (MN) Min 4 3.8 3.05 1.89 2.05 2.32 2 2.02 2.01 1.96 1.98 2.25 Max 6.7 5.4 4.78 2.96 3.25 3.77 3.11 3.26 3.28 2.94 3.3 3.46 Mean 4.85 4.58 4.1 2.57 2.7 3.23 2.67 2.69 2.79 2.54 2.69 2.97 S.D 0.24 0.17 0.19 0.09 0.11 0.14 0.1 0.11 0.13 0.09 0.1 0.12 #4 (MN) Min 2.57 0 0 1.86 2.04 2.32 1.97 2.01 2 1.93 2 0 Max 4.38 3.97 4.01 2.95 3.27 3.75 3.11 3.28 3.28 2.94 3.34 2.82 Mean 3.68 0.000 1 0.000 1 2.55 2.7 3.21 2.66 2.7 2.78 2.53 2.72 0.000 3 S.D 0.17 0.02 0.02 0.1 0.11 0.14 0.11 0.11 0.12 0.1 0.11 0.03 #5 (MN) Min 2.48 3.08 0 1.83 2.03 2.32 2.03 2.49 2.42 1.98 2.75 2.74 Max 4.3 5.11 4.02 2.95 3.29 3.74 3.44 3.81 3.49 3.27 4.11 4.05 Mean 3.63 4.28 0.000 1 2.54 2.71 3.2 2.94 3.16 2.9 2.8 3.46 3.34 S.D 0.18 0.2 0.02 0.1 0.11 0.13 0.14 0.1 0.11 0.13 0.12 0.12 #6 (MN) Min 2.41 3.03 3.95 1.94 2.61 2.45 2.07 2.57 2.44 2.01 2.8 2.72 Max 4.23 5.07 5.62 3.26 3.93 3.49 3.46 3.89 3.52 3.3 4.17 4.04 Mean 3.59 4.24 4.92 2.82 3.26 2.93 2.97 3.2 2.92 2.83 3.49 3.31 S.D 0.18 0.2 0.19 0.12 0.1 0.11 0.13 0.1 0.11 0.13 0.12 0.12 #7 (MN) Min 2.34 3 4 2 2.69 2.44 2.11 2.65 2.46 2.05 0 2.74 Max 4.18 5.04 5.63 3.3 4.01 3.48 3.5 3.98 3.56 3.24 2.87 4.04 Mean 3.55 4.21 4.94 2.87 3.31 2.92 3.02 3.25 2.95 2.88 0.000 3 3.29 S.D 0.19 0.2 0.19 0.12 0.1 0.11 0.13 0.1 0.12 0.12 0.03 0.13 #8 (MN) Min 2.34 3.11 3.55 2.07 2.77 2.43 0 0 2.49 0 0 0 Max 4.19 4.38 4.85 3.35 4.1 3.49 2.95 3.06 3.61 2.78 2.88 2.94 Mean 3.56 3.75 4.17 2.93 3.36 2.92 0.000 1 0.000 1 2.98 0.000 3 0.000 3 0.000 3 S.D 0.19 0.14 0.15 0.12 0.1 0.11 0.01 0.01 0.12 0.03 0.03 0.03 #9 (MN) Min 2.4 3.15 3.49 2.15 0 2.42 3.1 3.07 2.84 2.9 2.68 2.41 Max 4.2 4.38 4.79 3.41 3.06 3.48 5.49 5.29 4.15 5.22 4.64 3.4 Mean 3.6 3.74 4.11 3 0.000 1 2.91 3.75 3.74 3.4 3.54 3.25 2.86 S.D 0.18 0.14 0.15 0.12 0.019 0.12 0.19 0.18 0.13 0.18 0.14 0.11 #10 (MN) Min 2.47 3.16 3.43 0 0 2.42 3.11 3.06 2.86 0 2.64 2.39 Max 4.29 4.38 4.73 3.17 3.18 3.48 5.7 5.33 4.18 3.01 4.6 3.36 Mean 3.64 3.74 4.06 0.000 1 0.000 1 2.91 3.8 3.75 3.43 0.000 3 3.2 2.83 S.D 0.18 0.14 0.15 0.02 0.02 0.12 0.21 0.18 0.13 0.03 0.14 0.11 #11 (MN) Min 2.56 3.16 3.37 3.17 3.05 2.43 3.11 3.05 2.87 2.9 2.6 2.37 Max 4.37 4.38 4.68 6.53 5.26 3.49 5.9 5.34 4.2 5.6 4.54 3.33 Mean 3.69 3.74 4.01 4.42 3.73 2.92 3.84 3.74 3.46 3.6 3.15 2.8 S.D 0.17 0.14 0.16 0.3 0.18 0.11 0.24 0.18 0.13 0.23 0.14 0.11 #12 (MN) Min 3.92 3.21 2.97 0 3.02 2.44 0 0 0 2.9 2.56 2.35 Max 6.44 5.21 4.36 3.21 5.25 3.48 3.22 3.19 3.11 5.78 4.49 3.3 Mean 4.75 3.88 3.63 0.000 1 3.7 2.92 0.000 1 0.000 1 0.001 3.64 3.11 2.78 S.D 0.21 0.17 0.16 0.02 0.18 0.11 0.02 0.02 0.01 0.26 0.13 0.1 #13 (MN) Min 4.01 3.23 2.96 3.21 3 2.45 2.61 2.27 0 2.45 2.13 1.97 Max 6.69 5.27 4.36 7.25 5.23 3.49 4.45 3.45 3 4.12 3 3.08 Mean 4.88 3.91 3.62 4.66 3.68 2.93 3.06 2.87 0.000 1 2.85 2.55 2.64 S.D 0.23 0.17 0.16 0.4 0.18 0.11 0.12 0.08 0.01 0.11 0.07 0.12 #14 (MN) Min 0 3.24 2.94 2.66 2.23 0 2.67 2.42 2.46 2.49 2.15 1.94 Max 4.22 5.32 4.36 4.49 3.37 3.01 4.94 3.68 3.8 4.6 3.1 3.06 Mean 0.000 1 3.93 3.61 3.14 2.81 0.001 3.21 2.97 3.26 3 2.57 2.61 S.D 0.02 0.17 0.16 0.12 0.08 0.03 0.17 0.09 0.13 0.15 0.07 0.12 #15 (MN) Min 4.1 3.26 2.94 2.78 2.36 2.31 2.65 2.37 2.42 2.47 2.14 1.95 Max 7.27 5.37 4.37 5.19 3.57 3.74 4.77 3.59 3.76 4.43 3.06 3.06 Mean 5.15 3.97 3.6 3.42 2.9 3.2 3.16 2.94 3.22 2.94 2.56 2.62 S.D 0.29 0.17 0.16 0.19 0.09 0.13 0.15 0.09 0.13 0.13 0.07 0.12 #16 (MN) Min 3.91 0 3.1 2.74 2.32 2.32 2.63 2.32 2.38 2.46 2.14 1.96 Max 6.45 4.07 4.85 4.94 3.49 3.76 4.61 3.52 3.71 4.27 3.03 3.07 Mean 4.72 0.000 1 4.15 3.32 2.87 3.21 3.11 2.9 3.18 2.89 2.56 2.63 S.D 0.21 0.025 0.19 0.16 0.08 0.14 0.13 0.08 0.14 0.12 0.07 0.12 -
API (2008) Design and analysis of station-keeping systems for floating structures. 3rd edition, API-RP-2SK, American Petroleum Institute. https://doi.org/10.4043/29024-MS Banks M, Abdussamie N (2017) The response of a semi-submersible model under focused wave groups: Experimental investigation. Journal of Ocean Engineering and Science 2(3): 161–171. https://doi.org/10.1016/j.joes.2017.07.003 Berthelsen PA, Baarholm R, Stansberg CT, Hassan A, Downie M, Incecik A (2009) Viscous drift forces and responses on a semi-submersible platform in high waves. 28th International Conference on Ocean, Offshore and Arctic Engineering, 469–478. https://doi.org/10.1115/OMAE2009-79483 Chandrasekaran S, Uddin SA (2020) Postulated failure analyses of a spread-moored semi-submersible. Innovative Infrastructure Solutions 5: 36. https://doi.org/10.1007/s41062-020-0284-2 Chandrasekaran S, Uddin SA, Wahab M (2020a) Dynamic analysis of semi-submersible under the postulated failure of restraining system with a buoy. International Journal of Steel Structures 21: 118–131. https://doi.org/10.1007/s13296-020-00420-7 Chandrasekaran S, Jain AK, Uddin SA (2020b). Coupled dynamic analyses of deep-water semi-submersible with new spread mooring system. 39th International Conference on Ocean, Offshore and Arctic Engineering, Fort Lauderdale, OMAE2020-18123. https://doi.org/10.1115/OMAE2020-18123 Clauss GNF, Schmittner C, Stutz K (2002) Time-domain investigation of a semi-submersible in rogue waves. International Conference on Offshore Mechanics and Arctic Engineering, Vol. 36126, 509–516. https://doi.org/10.1115/OMAE2002-28450 DNV (2005) Fatigue design of offshore steel structures. DNVGL-RP-C203, 14–16 DNV GL (2008) Position mooring. DNV-OS-E301, 33–34 DNV GL (2010) Global performance analysis of deep-water floating structures. DNVGL-RP-F205 Feng H, Sun CM, Chen ZW, Hong XF (2009) The motion performance and mooring system of deepwater semi-submersible drilling unit. Journal of Marine Science and Application 8(3): 233–236. https://doi.org/10.1007/s11804-009-8112-2 Ganesan TS, Sen D (2018) Air gap prediction for floating bodies using a 3D numerical wave tank approach. Journal of Marine Science and Application 17(4): 531–549. https://doi.org/10.1007/s11804-018-00059-1 Guo Y, Ji S, Tang C, Li J, Zhong H, Ian OCY (2012) Analysis and design of trial well mooring in deepwater of the South China Sea. Journal of Marine Science and Application 11(2): 222–227. https://doi.org/10.1007/s11804-012-1126-1 Hassan A, Downie MJ, Incecik A, Baarholm R, Berthelsen PA, Pakozdi C, Stansberg CT (2009) Contribution of the mooring system to the low-frequency motions of a semi-submersible in combined wave and current. 28th International Conference on Ocean, Offshore and Arctic Engineering, 55–62. https://doi.org/10.1115/OMAE2009-79074 Hussain A, Nah E, Fu R, Gupta A (2009) Motion comparison between a conventional deep draft semi-submersible and a dry tree semi-submersible. 28th International Conference on Ocean, Offshore and Arctic Engineering, 785–792. https://doi.org/10.1115/OMAE2009-80006 Jefferys ER, Patel MH (1982) On the dynamics of taut mooring systems. Engineering Structures 4(1): 37–43. https://doi.org/10.1016/0141-0296(82)90022-0 Kurian VJ, Yassis MA, Harahap IS (2010) Non-linear coupled dynamic response of a semi-submersible platform. 20th International Offshore and Polar Engineering Conference, Beijing, ISOPE-I-10-375 Li B, Liu K, Yan G, Ou J (2011) Hydrodynamic comparison of a semi-submersible, TLP, and Spar: Numerical study in the South China Sea environment. Journal of Marine Science and Application 10(3): 306–314. https://doi.org/10.1007/s11804-011-1073-2 Li X, Deng YF, Li L, Tian XL, Li J (2017) Motion and dynamic responses of a semi-submersible in freak waves. China Ocean Engineering 31(6): 754–763. https://doi.org/10.1007/s13344-017-0086-2 Ma Y, Hu C, Zhou B, Li L, Kang Y (2019) Hydrodynamic analysis of a semi-submersible wind-tidal combined power generation device. Journal of Marine Science and Application 18(1): 72–81. https://doi.org/10.1007/s11804-019-00073-x Mansour AM, Huang EW (2007) H-Shaped pontoon deep-water floating production semi-submersible. 26th International Conference on Offshore Mechanics and Arctic Engineering, 461–469. https://doi.org/10.1115/OMAE2007-29385 Mavrakos SA, Papazoglou VJ, Triantafyllou MS, Hatjigeorgiou J (1996) Deep-water mooring dynamics. Marine structures 9(2): 181–209. https://doi.org/10.1016/0951-8339(94)00019-O Mavrakos SA, Chatjigeorgiou J (1997) Dynamic behavior of deep-water mooring lines with submerged buoys. Computers & Structures 64(1–4): 819–835. https://doi.org/10.1016/S0045-7949(96)00169-1 Odijie AC, Quayle S, Ye J (2017) Wave induced stress profile on a paired column semi-submersible hull formation for column reinforcement. Engineering Structures 143: 77–90. https://doi.org/10.1016/j.engstruct.2017.04.013 Ormberg H, Larsen K (1998) Coupled analysis of floater motion and mooring dynamics for a turret-moored ship. Applied Ocean Research 20(1–2): 55–67. https://doi.org/10.1016/S0141-1187(98)00012-1 Qiao D, Ou J (2013) Global responses analysis of a semi-submersible platform with different mooring models in South China Sea. Ships and Offshore Structures 8(5): 441–456. https://doi.org/10.1080/17445302.2012.718971 Ren HL, Liu WX (2008) Calculation of hydrodynamics for semi-submersibles based on NURBS. Journal of Marine Science and Application 7(2): 91–97. https://doi.org/10.1007/s11804-008-7083-z Srinivasan N, Chakrabarti S, Radha R (2006) Response analysis of a truss-pontoon Semi-submersible with heave-plates. Journal of Offshore Mechanics and Arctic Engineering 128(2): 100–107. https://doi.org/10.1115/1.2185679 Stansberg CT (2008) Current effects on a moored floating platform in a sea state. 27th International Conference on Offshore Mechanics and Arctic Engineering, 433–444. https://doi.org/10.1115/OMAE2008-57621 Sunil DK, Mukhopadhyay M (1995) Free vibration of semi-submersibles: A parametric study. Ocean Engineering 22(5): 489–502. https://doi.org/10.1016/0029-8018(94)00012-V Webster WC (1995) Mooring-induced damping. Ocean Engineering 22(6): 571–591. https://doi.org/10.1016/0029-8018(94)00027-5 Wu Y, Wang T, Eide Ø, Haverty K (2015) Governing factors and locations of fatigue damage on mooring lines of floating structures. Journal of Ocean Engineering 96: 109–124. https://doi.org/10.1016/j.oceaneng.2014.12.036 Xu S, Ji CY, Guedes Soares C (2018) Experimental and numerical investigation of semi-submersible moored by hybrid mooring systems. Ocean Engineering 163: 641–678. https://doi.org/10.1016/j.oceaneng.2018.05.006 Xu S, Guedes Soares C (2021) Evaluation of spectral methods for long term fatigue damage analysis of synthetic fibre mooring ropes based on experimental data. Ocean Engineering 226: 108842. https://doi.org/10.1016/j.oceaneng.2021.108842 Xue X, Chen NZ, Wu Y, Xiong Y, Guo Y (2018) Mooring system fatigue analysis for a semi-submersible. Ocean Engineering 156: 550–563. https://doi.org/10.1016/j.oceaneng.2018.03.022 Yan J, Qiao D, Ou J (2018) Optimal design and hydrodynamic response analysis of deep-water mooring system with submerged buoys. Ships and Offshore Structures 13(5): 476–487. https://doi.org/10.1080/17445302.2018.1426282 Yang Y, Chen JX, Huang S (2016) Mooring line damping due to low frequency superimposed with wave frequency random line top-end motion. Journal of Ocean Engineering 112: 243–252. https://doi.org/10.1016/j.oceaneng.2015.12.026 Yilmaz O, Incecik A (1996) Extreme motion response analysis of moored semi-submersibles. Ocean Engineering 23(6): 497–517. https://doi.org/10.1016/0029-8018(95)00057-7 Zhai GJ, Tang DY, Xiong HF (2011) Numerical simulation of the dynamic behavior of the deep-water semi-submersible platform under wind and waves. Advanced Materials Research 243–249: 4733–4740. http://www.scientific.net/AMR.243-249.4733 http://www.scientific.net/AMR.243-249.4733 Zhu H, Ou J (2011) The dynamic performance of a semi-submersible platform subject to wind and waves. Journal of Ocean University of China 10(2): 127–134. https://doi.org/10.1007/s11802-011-1755-z
