Lateral Loading Capacity of Jacket Foundation with Three Helical Piles for Offshore Wind Turbines
https://doi.org/10.1007/s11804-023-00366-2
-
Abstract
The rapid development of offshore wind power and the need to move to deeper sea areas while reducing costs per kilowatt necessitate the employment of a new jacket and helical pile combination. This new combination combines the advantages of both jacket structures and helical piles and provides a superior bearing capacity and installation efficiency compared to conventional pile foundations. Foundations account for 25%–34% of the overall cost of construction, but the use of this new foundation would be highly significant for the further development of offshore wind power. This study presents numerical results for the horizontal bearing capacity when horizontal displacement is applied, focusing on the bearing capacity and characteristics of the helical pile jacket foundation as well as the differences between the bearing mechanisms and failure modes of normal pile and helical pile types. ABAQUS model parameters are obtained through trial calculations based on actual engineering data, and the finite element model (FEM) is validated using data from a model experiment. Subsequently, different FEMs are established, and numerical results are compared and presented. Through a comparison between a normal pile jacket foundation and a helical pile jacket foundation with different helical blade numbers, the differences in the bearing mechanisms and failure modes are revealed. The failure of the normal pile jacket foundation is instantaneous and sudden, whereas that of the helical pile foundation is incremental and accumulative. These data highlight the most significant contributions and vulnerabilities of the one-pile side of the foundation and suggest that the addition of blades on the one-pile side is the most effective way of improving the foundation's bearing performance. In addition, the interaction between the compression side and tension side is analyzed in relation to differing the relative magnitudes of their bearing capacities.Article Highlights● A new combination of helical piles and guide frames is proposed that combines the advantages of both and greatly improves the bearing capacity and failure mode of the foundation.● A conceptual model is presented to reveal the interaction between the compression and tension sides of the three-pile jacket foundation, which is significant for improving the bearing capacity and failure mode of the foundation.● An uneven design philosophy is suggested for different piles in different locations; this bearing capacity improvement method further utilizes the bearing capacity of each pile and improves the short board of the foundation. -
1 Introduction
Achieving carbon neutrality is becoming increasingly necessary as the world battles the effects of global warming and sea level rise. The need to reduce carbon emissions has been agreed globally, and concerted action is necessary (Azarpour et al., 2022). Wind turbines have traditionally been used to obtain energy from nature, and with the continuous development of theories and technologies related to wind turbines and their construction, wind turbines are undoubted of great significance to the future of mankind in the context of achieving carbon neutrality. The energy potential of offshore wind power is greater than that of land wind power, and obtaining it is more environmentally friendly (Zhang et al., 2022; Zeng et al., 2023). However, it is necessary to reduce the cost per kilowatt of offshore wind power, and constructing the foundations accounts for $25 \%-34 \%$ of the total construction costs. Therefore, innovative foundation designs are required to improve associated costs.
Foundation schemes such as gravity type, single pile foundations, multipile cap foundations, and suction bucket foundations are generally used in the construction of wind turbines. However, the size of turbines is gradually increasing as obtaining wind power advances to the deep sea, and the load on the foundations is thus also increasing. There- fore, these foundation schemes have certain limitations with respect to their bearing capacity and the ability to construct them, which increases associated costs (Chen, 2020; Wang, 2019). Helical piles are considered to be a competitive and potential alternative for use in the construction of offshore wind power in deep seas. Helical piles have advantages over traditional pile foundations with respect to their bearing capacity and construction efficiency.
The mainstream helical pile form has single or multiple helical blades welded onto circular steel pipes at certain spacings. The blades are used both for bearing and installation. The bearing capacity of the helical pile, especially the axial bearing capacity, has been greatly improved due to the existence of the blades. When combined with a jacket with large rigidity, the structure has a natural ability to bear the bending moment load of the wind turbine, and this is particularly true with respect to large megawatt wind turbines. In addition to the bearing capacity, installing the helical pile is environmentally friendly and simple to construct compared with traditional pile foundations. Traditional pile foundations need to be constructed by piling, whereas the helical blade has a three-dimensional spiral surface (like a submarine propellor), and the interaction between the helical blade and the soil in the process of rotation provides the power for pile penetration. Due to the construction characteristics of the helical pile, problems such as pile sliding, construction failure, and noise that affects the environment can be avoided.
Helical pile research has predominantly focused on the use of small-scale model experiments and finite element studies, and studies have mainly focused on the axial bearing capacity (Bak et al., 2021; Ding et al., 2018; Ghaly and Hanna, 2011; Livneh and Naggar, 2008; Wang et al., 2020) and horizontal bearing capacity (Abdrabbo and Wakil, 2016; Mittal et al., 2010; Ding et al., 2019) of a single pile. Axial bearing capacity research focuses on the influence of the geometric parameters of helical piles on the bearing capacity and bearing mode, and formulas for the bearing capacity under different bearing modes and different soil properties have been obtained. Some studies have researched the bearing capacity of helical pile groups (Emirler et al., 2020; Alwalan and Alnuaim, 2022), but the main focus of each study has been on the vertical bearing performance of the helical pile group (in terms of compression and pullout resistance), with a focus on group efficien$c y$, the settlement ratio, and the load transfer mechanism. The foundation type focused on in these studies is a grouppile foundation with a pile cap and many piles. However, with respect to the load characteristics of a large megawatt unit with a large bending moment and large shear force, which are associated with offshore wind power plants, only a few relevant studies (Chen, 2020; Wang, 2019; Vignesh and Muthukumar, 2023) have investigated the horizontal bearing capacity of a multi-helical pile foundation with a jacket. In addition, in these papers, the authors have focused on pullout resistance, and their results are mainly based on the group efficiency associated with the lateral bearing capacity.
As there is a lack of research focusing on the lateral loading capacity, it is necessary to compare it with a conventional pile foundation to analyze how they differ from the helical pile jacket foundation and determine the advantages of the latter. As such, this paper primarily focuses on comparing the horizontal bearing capacity of the helical pile jacket foundation (in terms of the bearing characteristics, bearing mechanism, and failure mode) and the conventional pile foundation. Jacket legs are typically constructed as three or four piles. This study selected a threeleg design to determine the advantages derived from manufacturing a three-pile foundation, the materials used, and (most significantly) the ability of the helical pile to directly increase the foundation bearing capacity by adding blades. Therefore, this study focuses on investigating the horizontal bearing capacity of the three-leg helical pile jacket foundation.
2 Methodology
2.1 Model experiment overview
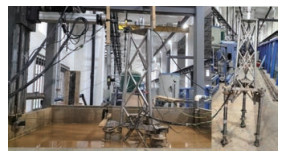
A physical model of the foundation structure is shown in Figure 1. It measures 1/60 the size of the finite element model (FEM) and has the following dimensions: prop diameter and thickness of $18 \mathrm{~mm}$ and $2 \mathrm{~mm}$, respectively; main rod diameter and thickness of $32 \mathrm{~mm}$ and $2 \mathrm{~mm}$, respectively; pile body thickness of $3 \mathrm{~mm}$; and helical blade thickness of $1 \mathrm{~mm}$. The soil used in the soil experiments was reshaped for each experiment because soil damage occurred after loading. The soil body measurements were length, width, and depth of $1.9 \mathrm{~m}, 1.9 \mathrm{~m}$, and $1.2 \mathrm{~m}$, respectively. The studies were conducted in homogeneous medium-dense sand soil.
The foundation's plane was a square triangle with a side length of $0.5 \mathrm{~m}$. The foundation was buried at a maximum depth of $0.82 \mathrm{~m}$, the pile diameter was $0.05 \mathrm{~m}$, and the helical blade had a diameter of $0.1 \mathrm{~m}$; therefore, the recon- figured soil body fitted the geometric requirements of the FEM, which was used to eliminate the boundary effect. The foundation was preburied due to the vulnerability of the sensors placed on the foundation during the rotating installation proccess of the helical pile. The principal parameters of the foundation are shown in Table 1.
Table 1 Principal parameters of foundation.$ D r $ $ k(\mathrm{ cm} / \mathrm{s}) $ $ \varphi\left({ }^{\circ}\right) $ $ G s $ $ c(\mathrm{kPa}) $ $ W(\%) $ $ e $ 0.45 0.0039 31.8 2.67 2.5 22.41 0.57 The main steps of the experiment involved the following: (1) soil reshaping; (2) digging holes at predetermined locations to predetermined burial depths; (3) lifting and placing the foundation using a yellow crane above the model, followed by the even replacement of soil; (4) slowly releasing water into the soil box through the water pipe connected to the outlet network at the bottom of the box until it reached $5 \mathrm{~cm}$ above the soil surface; (5) resting the soil for $24 \mathrm{~h}$; (6) applying horizontal displacement, and (7) releasing the water through the outlet pipe at the bottom of the soil box.
2.2 Numerical model
In this study, the commercial calculation software ABAQUS was used to model the three helical piles jacket foundation. ABAQUS provides powerful nonlinear calculation functions and can be used with models that have complex contacts. It was, therefore, suitable for modeling the helical piles and for simulating the pile-soil contact in this study.
2.2.1 Model and mesh details
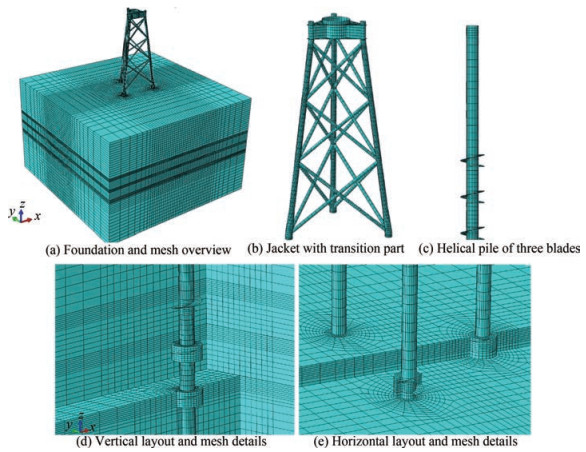
The pile, helical blade, soil, and jacket in the numerical model were all established by ABAQUS, in which the jacket, pile, and helical blade adopted $S 4 R$ shell elements, and the C3D8R eight-node reduced integration unit was used to simulate the sand. The FEM is shown in Figure 2, where modeling and meshing details are evident. Due to the complex contact between the helical blade and the soil, the mesh was locally encrypted for the blade and shaft and the soil within a certain range around the pile body. Overall, the grid size was gradually increased from the region close to the pile body to the model's boundary, with the aim of minimizing the number of grids used in the model. With respect to the connection of the model parts, a tie was used to connect the helical blade and the pile body, the top of the jacket, and the transition section. In the actual project, the top of the pile and the bottom of the jacket were connected by grouting, which achieved the effect of fixation and enabled various forces to be effectively transferred between them. In the FEM, the jacket and the top of the pile were connected by coupling.
As the helical pile foundation has not been used in an actual offshore wind power project, to ensure the rationality of the structural parameters in the process of selecting structural parameters, the size of the FEM was based on the working conditions and loads of a $10 \mathrm{MW}$ generator in a certain sea area in Fujian Province, China. The steel consumption of the foundation of the $10 \mathrm{MW}$ wind turbine and the buried depth and diameter of ordinary pile foundations were obtained, and the buried depth, diameter, wall thickness, blade outer diameter, jacket size, and other parameters were then determined by trial calculations and iteration. On the basis of these parameters, the bearing characteristics of the helical pile jacket foundation were further studied by changing the FEM and load parameters. The overall structural parameters are shown in Table 2, and the specific component parameters are shown in Table 3.
Table 2 Principal parameters of the foundationPart (m) Pile Jacket Buried depth 50 - Height - 60 Spacing 30 30 Top spacing of legs - 15 Story height of brace rod - 20 Table 3 Parameters of basic componentsComponent Diameter (m) Height (m) Thickness (mm) Pile 3 53 70 Helical blades 6 3 60 Jacket legs (down) 2.1 10 75 Jacket legs (up) 1.6 50 75 Brace rod 1 - 40 Transition section - 5 60 The loading characteristics of offshore wind turbines differ from those of offshore oil platforms because they are primarily subjected to horizontal forces and bending moments caused by wind, waves, and currents. In this study, horizontal displacement was applied to the foundation, so the choice of the loading point height was crucial because different loading heights produce different overturning moments. Therefore, to reflect the actual loading conditions, we used the loading condition of an actual wind turbine site in the sea area of Fujian, China, and the following parameters were collected: horizontal force $\left(V_{1}\right)$ with its equivalent loading point height $(h 1)$, bending moment $(M)$ from the upper wind turbine and tower, and horizontal force $\left(V_{2}\right)$ with its equivalent loading point height $\left(h_{2}\right)$ from the waves and currents under load-bearing limit working conditions. The total bending moment and total horizontal force to the mud surface were then calculated to obtain the foundation loading point height $h: h=\left(M+V_{1}{ }^{*} h_{1}+V_{2} * h_{2}\right) /\left(V_{1}+V_{2}\right)$, where the value of $h$ obtained after calculation was approximately $63 \mathrm{~m}$, as shown in Figure 3. During the loading process of the structure, we found that when the applied horizontal load to the helical pile foundation model was approximately $1.5-2 \mathrm{~m}$, the finite element calculation did not converge due to the complexity of the pile-soil contact. As this was detrimental to conducting an analysis of the structural bearing capacity and damage mode, a model idealization of a circular flat plate was used instead of one for the helical blade (Vignesh and Muthukumar, 2023). Apart from this, all model settings remained the same.
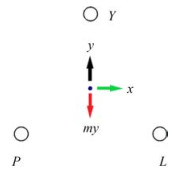
To study the bearing performance of the foundation structure, the loading directions are described using three directions of $x, y$, and $m y$, as shown in Figure 4. In direction $x$, pile $L$ was under compression while pile $P$ was under tension. In direction $y$, pile $Y$ was under compression while piles $P$ and $L$ were in tension, while for direction $m y$, pile $Y$ was in tension while $P$ and $L$ were under compression.
A model of the helical pile jacket foundation with various blade numbers was studied, and a common pile jacket foundation model with identical pile and jacket parameters was established to conduct comparative research. To represent different models, the helical pile jacket foundation models with different blade numbers are identified using the format $Y x L x$. For example, Y1L3 means that pile $Y$ has one blade while pile $L$ and pile $P$ have three blades each. Ordinary pile foundations are represented by $p$. Different loading directions are designated using the specified terms, using $d-x$ to indicate the direction $x$, and $d-y$ to indicate the direction $y$. For convenience, we refer to the three helical pile jacket foundation as THJ and the ordinary three-pile jacket foundation as TPJ.
2.2.2 Boundary effect and sensitive analysis
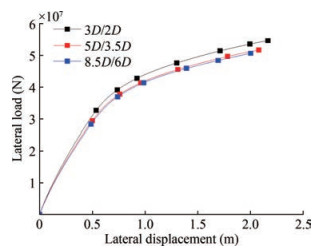
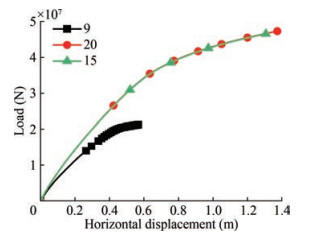
By establishing FEMs with different boundary conditions in this study, the influence of boundary conditions on the numerical results was eliminated. Figure 5 shows the load-displacement curves under different boundary conditions. $3 D / 2 D$ indicates that when the outer edge of the helical blade to the model boundary is $3 D$, the blade bottom to the model bottom is $2 D$, where $D$ is the diameter of the helical blade; there is a big difference between $3 D / 2 D$ and the other two boundary conditions. However, the difference is small when it is greater than $5 D / 3.5 D$. Therefore, the following models adopt a boundary distance of $8.5 D / 6 D$.
Under the selected boundary size, the influence of the mesh size on the numerical results was studied using FEMs with different mesh numbers. In Figure 6, the result using 90000 grids is compared with that using 150000 and 200000 grids, respectively. The result with the 90000 grid differed from the results of the other two, while the results of the 150000 and 200000 grids were similar. Therefore, to consider the calculation speed, models with 150000 grids were chosen for subsequent numerical model establishment and calculations.
2.2.3 Model material properties
An ideal elastoplastic material was adopted for the jacket and helical pile, with a material yield stress of $355 \mathrm{MPa}$, Young's modulus of 210 GPa and Poisson's ratio of 0.3. The material density of the pile body (underwater) was $6850 \mathrm{~kg} / \mathrm{m}^{3}$, and the material density of the jacket was set as $7500 \mathrm{~kg} / \mathrm{m}^{3}$ (based on the volume above and below water surface).
To simulate the soil properties, this study adopted the ideal elastoplastic M-C model to represent the soil strength characteristics. This model is widely used in geotechnical engineering and helical pile-related research. It has few parameters, each has a clear physical meaning, and the model accurately reflects the mechanical properties of sandy soil. The M-C model can also simulate the nonlinear strength characteristics of granular materials. For this study, the soil layer was set as follows: $C=31^{\circ}, \varphi=1500 \mathrm{~N} / \mathrm{m}^{2}$, density= $850 \mathrm{~kg} / \mathrm{m}^{3}$, Young's modulus=21 MPa, which makes the soil homogenous.
However, it should be noted that the geological conditions in actual engineering are often complex, different soil layers contain varying proportions of sand and clay, and the parameters of the same kind of soil vary across layers. Furthermore, the zones of influence of different foundations on the surrounding soil layers vary; if the soil is not homogenous, the impact of the controlled variables on the studied problems and ultimate conclusions can be weakened or amplified.
2.2.4 Contact modeling
"Surface-to-surface contact" was used when setting pilesoil contact, and the surface of the pile was chosen as the master surface and the soil surface as the slave surface. "Hard contact" pile-soil contact was used in the normal direction; this allowed the contact surface to separate when it was subjected to an external force. However, "Penalty function" contact was used in the tangential direction, as it is known to better simulate tangential friction behavior. The friction coefficient of the contact was empirically taken as 0.35 (Wang et al., 2020; Wen et al., 2020). For the boundary of the model conditions, six degrees of freedom were restricted at the bottom of the soil. For the lateral displacement boundary condition, vertical displacement of the soil was allowed, and lateral displacement was restricted, with the aim of ensuring normal vertical compression settlement when balancing the ground stress.
2.3 Comparison between FEM and experimental results
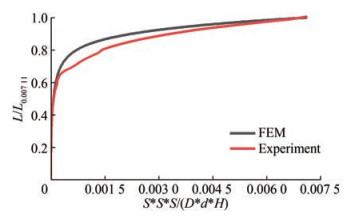
Figure 7 compares the FEM results and the experimental results of model Y1L1 using the dimensionless method. In this respect, $S$ represents the displacement of the loading point, $D$ represents the diameter of the helix, $d$ represents the diameter of the shaft, and $H$ represents the burial depth of the foundation in the horizontal axis. The vertical axis represents the ratio of the reaction force at the moment to the maximum load value.
Overall, the curve of the FEM captures the curve characteristics of the experiment, and the two curves are largely consistent, especially in the initial elastic stage. However, the finite element curve is smoother and more representative than the experimental curve. The experimental curve position is lower than the finite element curve after the longitudinal axis value reaches 0.6, indicating that the FEM achieves base bearing capacity and enters the plastic development stage earlier than the experimental model.
This discrepancy may result from several factors, which include the following: a) in contrast to the experimental loading process, there is no change in the elastic modulus of the M-C model in the finite element loading process; b) the dilation angle was set to 0 in finite element modeling, and this disregards soil dilatancy. In contrast, dilatancy is often unavoidable in experiments, particularly when using deep foundations in relatively dense soil. Dilatancy can disrupt the continuity of the soil strain field and lead to local plastic deformation (Perić et al., 1992; Rice, 1976). However, the M-C model assumed that the soil's plastic range was continuous and smooth.
3 Comparison between bearing mechanisms and failure modes of normal and helical pile foundations
Large moment loads and horizontal force loads are applied to offshore wind turbine foundations, which causes vertical and horizontal movement of the piles in multipile foundations. To properly understand the differences between the helical pile jacket foundation and common pile jacket foundation in terms of displacement and the bearing mode, it is necessary to investigate the horizontal and axial bearing performance of the pile in the foundation. In the sections that follow, the numerical outcomes of $p, Y 1 L 1$, Y2L2, and Y3L3 are compared and explained.
3.1 Comparison between axial load and settlement in models
Figure 8 presents the load-displacement curves of models $p, Y 1 L 1, Y 2 L 2$, and Y3L3 in the $y, m y$, and $x$ directions. It should be noted that due to the limited material of the structure, the structure is not close to being rigid, but this is unlikely to occur in reality. In addition, the displacement-load curve of the foundation does not exhibit a horizontal or declining stage due to the local limit state of both the foundation soil and structure. Despite this, the load-displacement curve grows very slowly in the later stages. The advantage of THJ is not noticeable in the early pahse due to the deep burial of the blade, which means that the pile body has to exert its bearing capacity prior to the helical blades. However, an increase in the helix number highlights a visible difference between the models, which becomes more apparent as the loading process advances and the ultimate capacity is significantly increased; this show how the helices contribute significantly to the ultimate bearing capacity. However, the increase is not proportional to the helix number in all three directions. There is also a significant difference between Y1L1 and p, as opposed to the relatively minor difference between Y2L2 and Y3L3, which indicates that the blades do not work independently; this may be due to the helix spacing, which is set as 1.5 in this article. Furthermore, the slope of the displacementload curve for THJ is greater than that of TPJ, even when the load-displacement curve of TPJ is almost horizontal in the late loading stage. This difference implies that the soil does not fully enter a plastic state due to the presence of the helical blade.
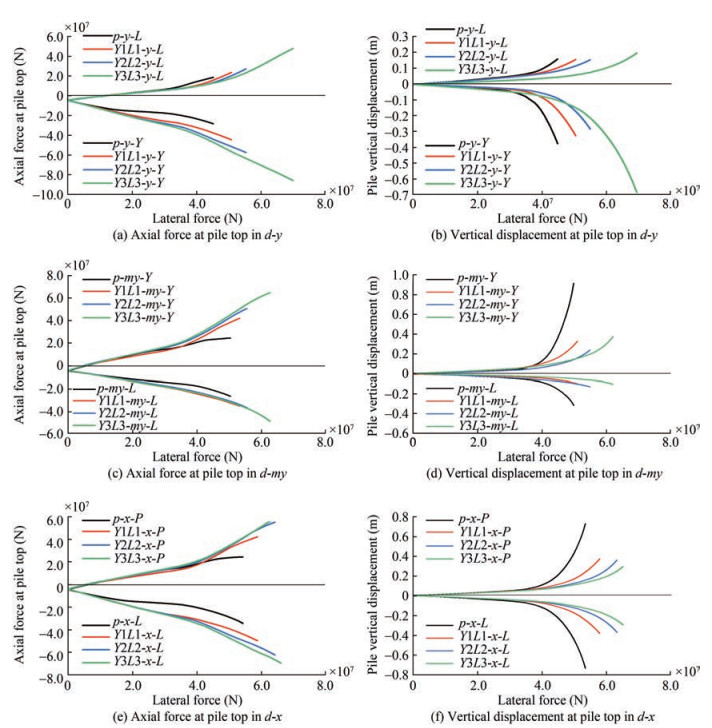
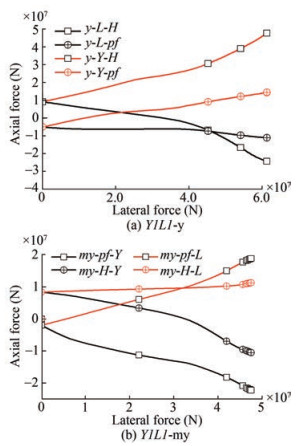
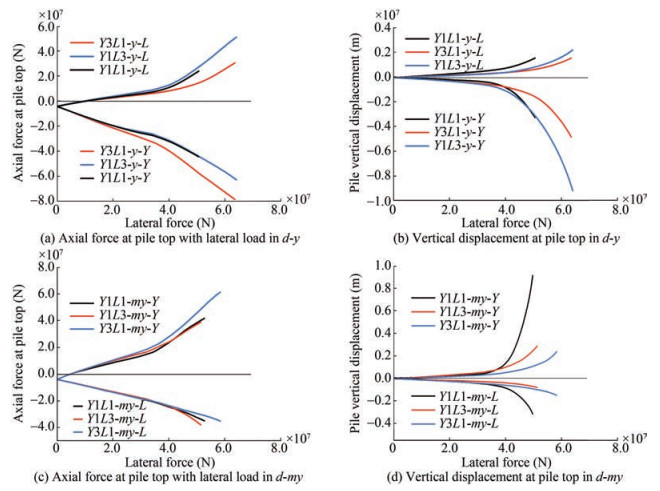
The axial performance of piles throughout the loading procedure is shown in Figure 9. In particular, Figures 9(a) and 9(b) show the axial force and vertical displacement in $d-y$ plotted against the lateral force of the loading point. Here, $y$ means direction $y$, and $Y$ represents pile $Y$, and this is presented consistently throughout the text. The $Y$-pile and $L$-pile curves of Figure 9(a) can be broken down into two stages of development: a linear growth stage in the early stage and a rapid growth stage in the later stage. With an increase in the number of blades, both the $Y$-pile and the $L$-pile's linear growth stages lengthen, while the later stage's rapid growth rate declines as the blade number rises.
These results indicate that, in comparison to the helical pile, the ordinary pile has a lower soil contact range, and it thus enters the plastic strain stage of soil earlier. Notably, there is a clear difference between the axial force of a compressed pile and a tensioned pile in terms of their relative magnitudes and growth rates. The tensioned pile experiences a lengthy, slow-growing, linear period after the first loading, during which the axial force of the tensioned piles in all models is essentially the same. In addition to having a higher axial force gap between the compressed piles of TPJ and those of THJ, the compressed piles expand at a clearly faster rate than tensioned piles. It is evident that the increased bearing capacity of the compression pile, which widens with the number of blades, is the source of the bearing capacity gap between the two types of foundations. Therefore, the compressed pile is more important for the bearing capacity in $d-y$.
The performance of the pullout capacity is detrimental to the foundation due to the overturning. Compared to the compressed pile, the tensioned pile has a smaller load under the same horizontal force, as shown in Figure 9(a). The most significant difference between the pile types is that during the tensioned pile's uplift phase, the axial force growth of the common pile foundation is slower, and it nearly disappears at the end, whereas the corresponding helical pile foundation has a faster growth rate and a greater capacity potential; this becomes more obvious with an increase in the number of blades.
A comparison of the growth curve of axial displacement in Figure 9(b) shows that the failure modes of TPJ and THJ are similar; both exhibit a quick increase in the axial displacement of the compressed pile followed by a rapid uplift with the tensioned pile. As shown in Figures 9(a) and 9(b), the helical blades cause two relative changes: the first is to delay the rapid increase in the axial displacement phase and to reduce its rate and magnitude, especially for the tensioned pile, which is crucial for the pullout of the foundation; and the second is that the simultaneously larger bearing capacity and smaller axial displacement result in greater lateral stiffness and greater structural stress.
In Figures 9(c) and 9(d), the axial force and vertical displacement of the $d$-my piles are compared to those of the $d-y$ piles. Significant similarities and differences are observed, and these are listed as follows: in terms of axial force development, the similarities include: a) the smallest growth rate of the pile $L$ side during the initial linear growth stage; b) a long linear increase phase with a roughly equal axial force for tensioned piles, where the difference in the axial force of the tensioned piles is only reflected in the final fast pullout stage, while the bearing capacity differences between compressed piles are observed in the initial stage. c) the bearing capacity gap among the different models commonly stems from the Y-pile, and there is insufficient bearing capacity development on the $L$-pile side caused by the difference in the number of piles on two sides of the three-pile foundation, which is unavoidable. The differences include: a) $d-y$ has a greater $L$-pile bearing capacity which increases the foundation's bearing capacity; b) the different $d-y$ models show a bearing capacity gap in the earlier stage.
In terms of axial displacement and damage, as shown in Figure 9(d), there are critical differences between TPJ and THJ. TPJ was destroyed by the rapid displacement of the tensioned pile, where the force reached a limit value and the foundation relied on the rapidly increasing axial force of the compression pile, leading to foundation failure. THJ differed from TPJ during the pullout process: a) the vertical displacement of the tensioned helical pile grew more slowly than that of TPJ, the displacement accumulated gradually, and this trend became more prominent with an increase in the blade number; b) the fast growth of displacement of the tensioned helical piles corresponded to the rapid development of axial force; however, there was no room for the axial force of ordinary piles to increase with rapid pullout; c) within the loading range, the displacement of the compressed helical piles did not increase as quickly as that of the ordinary piles, partially due to their higher bearing capacity and the lack of rapid pullout damage exhibited by the tensioned helical pile.
Figures 9(e) and 9(f) show only piles $L$ and $P$. This is because for $d-x$, the $Y$-pile essentially had no effect on axial displacement and axial force, and there was an enormous gap between its performance and that of the other two piles. The overall axial performance of $d-x$ was similar to $d-y$ and $d-m y$, but $d-x$ contained the following distinctive features: a) the Y-pile showed no bearing in the axial direction; b) unlike $d-y$ and $d-m y$, both the compressed pile and tensioned pile are where the bearing capacity advantage over the TPJ or THJ with less blade numbers originates; c) the fact that the axial displacements of the tension pile and compression pile were relatively similar and that no one side of the pile experienced a particularly big displacement proves that they have approximately identical axial stiffness; d) for the foundation damage mode in $d-x$, the tension pile and compression pile both reached the limit state at the same time, and the axial force and displacement of both sides of the pile developed similarly.
In conclusion, the deterioration of THJ occurred consid- erably more gradually than that of TPJ, and it underwent a cumulative process with a more moderate displacement growth rate, especially with an increase in the number of blades and a slow growth in the rate of pile displacement. It is also obvious that the damage relating to the ordinary pile foundations occurred suddenly and rapidly. This is because, in the absence of helical blades, the pile circumference provides a soil-bearing capacity that is close to its limit, and it thus readily reaches the limit state. In this paper, the blade spacing was set as 1.5; if the value was greater, the linear variation characteristics of the displacement of the foundation loading process would be more apparent because of the individual bearing mode of the helical pile.
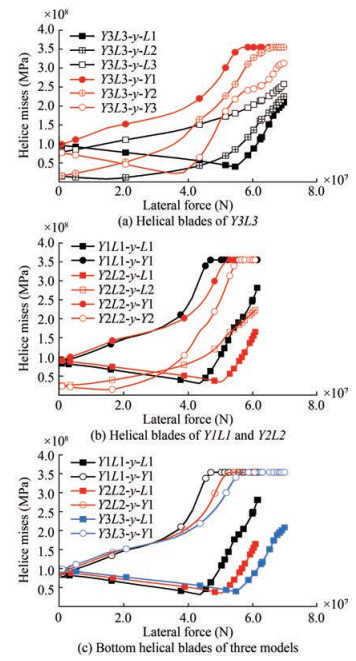
The effectiveness of the blades directly infers that the helical piles are effective; therefore, to fully reveal the bearing characteristics of the foundations, the average Mises of every blade was calculated after the Mises stress of each element of the blade was extracted. In the figures, for the designation of different helical blades, there are 3 blades on pile $L$ of $Y 3 L 3$, and $L 1, L 2$, and $L 3$ represent the blades in order of bottom to top, which is the same for other piles.
As shown in Figure 10(a), for the tensile pile, the average stress of L1 decreases first and then increases, and the stress of $L 2$ and $L 3$ undergoes continuous growth, which indicates that the lower blades primarily bear the vertical load when it is small. For the compression pile, the sequence of the different blades is not the same: $Y 1$ and $Y 2$ first unleash the bearing capacity, but the stress of $Y 3$ begins to reduce when the foundation is laterally loaded. This demonstrates that the upper blade is subject to downward soil pressure. A blade yielding order of succession for $Y 1>Y 2>Y 3$ can be observed, but it is notable that the stress of $Y 3$ is not totally yielded.
Figure 10(b) shows how the blades at various locations carry the external load sequentially. By comparing $Y 1$ of Y1L1 with Y1 and Y2 of Y2L2, Figure 10(b) shows that by increasing the number of blades, the external load is shared and that the yielding of the lower blades is postponed. Figure 10(c) shows the blade stress evolution of the piles on the same side of several models with the loading point reaction force. As the number of blades increases, the area of overall contact with the soil also increases. The external load increases with the number of blades when they reach the yielding point. It is possible to further explain the bearing characteristics of THJ shown in Figure 9. Initially, when the bearing capacity of a certain blade and the surrounding soil reaches a specific displacement and stress state, another helical blade will step in to play a crucial function. The helical blades exert their capacity in a specific order. Therefore, the movement of the foundation is progressive rather than abrupt as a result of the superposition of the different limit stages of each blade.
It is important to analyze the stress and displacement states of the soil to assess the bearing performance of the foundation. Figures 11(a) and 12(a) show the stresses of the soil in TPJ and THJ, respectively. The stress and strain of the ordinary pile are concentrated near the end of the pile, while the stress level of the helical pile as a whole is lower, and it shows a larger effective soil-bearing range. The failure mode of the helical pile differs significantly from the ordinary pile due to the presence of the blade. The bearing mode can be divided into individual bearing and cylindrical shear bearing modes according to the different blade spacing (Mohajerani et al., 2016). The spacing ratio was 1.5 in this study; theoretically, this belongs to the individual bearing mode for the monopile. The comparison between Figures 11(c) and 12(c) show that the helical pile exhibits an integral damage mode for both the tensile pile and compressive pile. This mode indicates that the range of soil driven by the common pile is restricted to the diameter of the pile, whereas the range of the helical pile is much larger.
3.2 Lateral bearing characteristics of pile
The blade is believed to have a positive effect on the horizontal bearing capacity (Sakr, 2009; Tappenden et al., 2009; Mittal et al., 2010), and the results of this study show that the horizontal bearing capacity of the helical pile is greatly improved when the buried depth is eight times the size of the blade's outer diameter. Foundations can achieve lateral displacement at the loading point through horizontal pile displacement, axial pile displacement, and bending. THJ had a smaller axial dispalcement compared to TPJ, which implies that the upper strucuture is subjected to greater stress and lateral displacement. Although the axial force weakens and strengthens the lateral stiffness of the tension and compression piles in TPJ, the current design of the API-recommended p-y curve does not consider this effect. The blades of the helical piles affect the axial force distribution, which alters the interaction between the pile shaft and soil around the pile. Therefore, more research is required to analyze the horizontal performance of both foundation types.
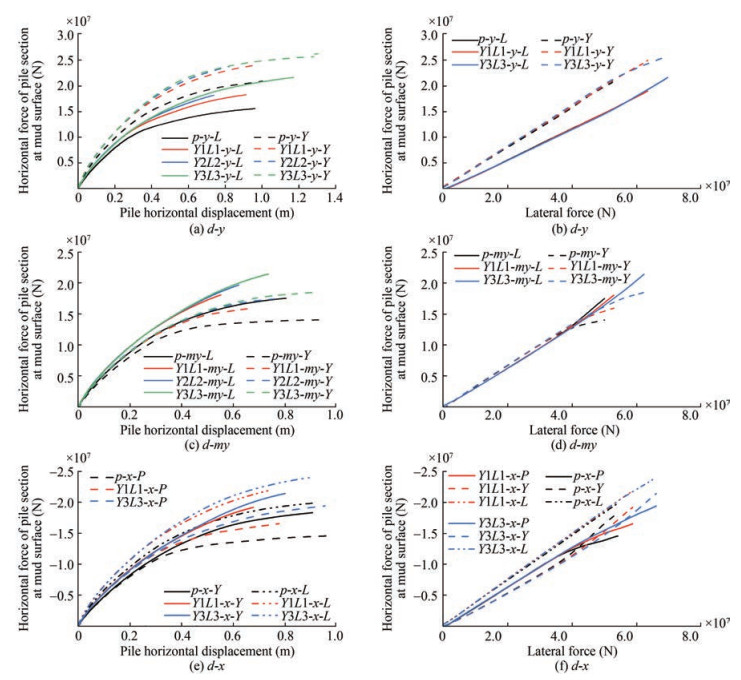
According to Figures 13(a), 13(c), and 13(e), the horizontal bearing capacity of the helical pile is greater than that of the ordinary pile. The horizontal force of the tensioned pile is more sensitive to an increase in the blade number, but for the compressed helical piles, the gap between the horizontal bearing capacity of the compressed helical piles of different blade numbers is smaller, the horizontal bearing capacity of the compression piles is much higher than that of the tension piles, and its lateral stiffness is larger due to the disturbance of tensile force to the soil around the tension pile.
According to Figures 13(b), 13(d), and 13(f), the horizontal force distribution between TPJ and the various THJ models is nearly identical under the same horizontal force. However, for $d-m y$ and $d-x$, as the piles approach their ultimate bearing capacity, the horizontal force is redistributed between different pile bases, resulting in a reduction in the distributed horizontal force of the tensioned pile. This is because the pullout of the tensile pile has a stronger impact on the horizontal rigidity when it approaches the limit state than the press-in of the compressed pile, and also to the effectiveness of the blades, where an increase in the number of blades results in the redistribution occurring later. In $d-x$ and $d-y$, the horizontal force distribution of the compressed pile is the largest, while in $d-m y$, pile $Y$ 's horizontal force distribution is initially greater than that of the compressed pile.
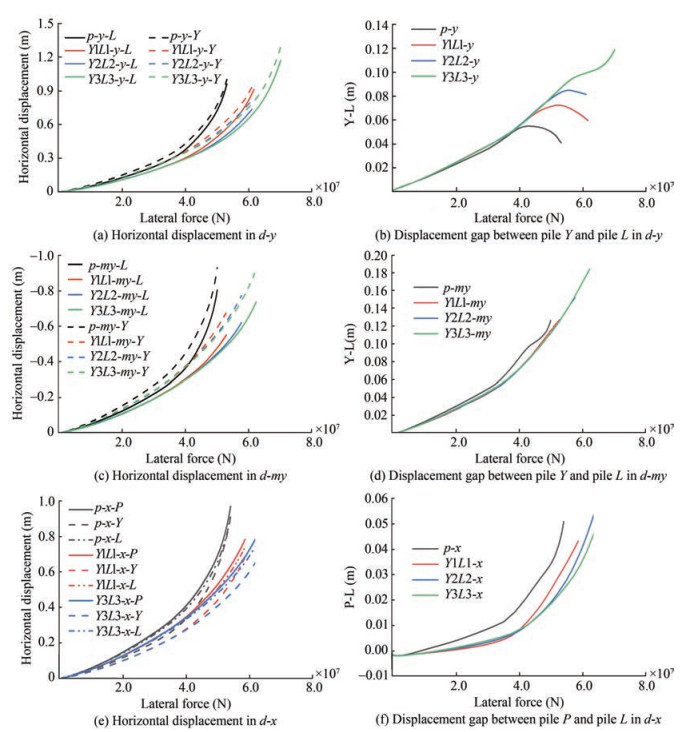
Figure 14 illustrates the horizontal displacement and displacement gap of piles in various models under lateral force. The horizontal displacement of piles in $d-y$ compressed piles is greater than that of tensioned piles, and the horizontal displacement of $d-x$ and $d$-my compressed piles is smaller. The horizontal displacement of the piles is reduced with an increase in the blade number under the same horizontal force, as observed in Figures 14(a), 14(c), and 14(e).
The difference between the horizontal displacement of the piles in each loading direction is related to the distribution of the number of piles. $d-y$ has only one compressed pile, and displacement is, therefore, larger than that of the tensioned piles, despite its higher lateral stiffness. $d$-my has only one tensioned pile, which results in a larger difference in horizontal displacement between the compressed and tesioned piles than $d-y$ as there is less lateral stiffness for the tensined pile in $d-m y$. By contrast, the number of tensioned and compressed piles is the same in $d-x$, which results in a smaller disparity in horizontal displacement than the other two loading directions. The horizontal displacement gap between the piles on both sides of the foundation increases gradually with loading. The horizontal displacement gap of all models except Y3L3 in $d-y$ decrease as they reach the maximum bearing capacity. The horizontal displacement gap between the piles on the tensile and compressive sides of THJ in $d$-x and $d$-my is smaller than that of TPJ, which shows that the helical blade improves the load-bearing performance of tensioned piles compared to compressed piles.
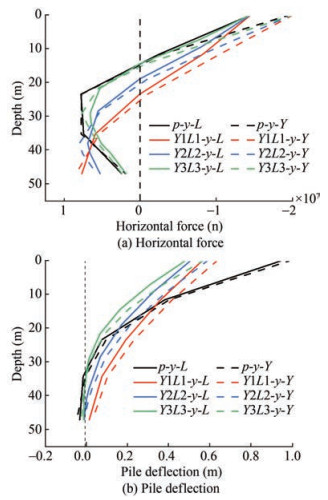
Figures 15(a) and 15(b) show the distribution of horizontal force and horizontal displacement of the pile body at a horizontal force of 50e6 $\mathrm{N}$, respectively. There is a stronger interaction between the common pile and the soil because its horizontal displacement is larger. As a result, the horizontal force distribution of TPJ is similar to that of Y3L3, as evidenced by the previous paper and Figure 15(b). However, the horizontal displacement of the helical pile gradually reduces as the number of helical blades increases. The specific law of each helical pile is that the point where the horizontal force of the pile body is 0 is closer to the soil surface, and the overall lateral stiffness of the common pile foundation is comparatively smaller due to the absence of helical blades. The lateral force is more dependent on the upper soil layer, while the helical pile is more dependent on the deep soil layer. In addition, the greater the number of blades, the smaller the horizontal displacement, soil heave and disturbance.
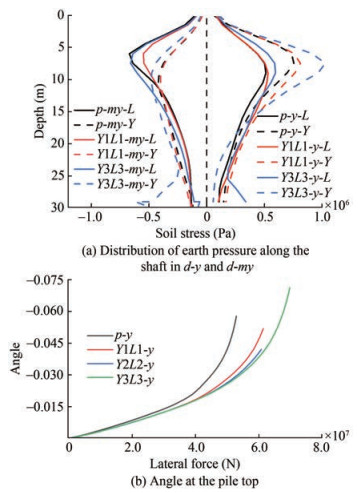
The soil pressure in front of the pile provides the horizontal bearing capacity, and different pile models exhibit distinct performance characteristics that warrant analysis. The depth of the top blade in Y3L3 is $30 \mathrm{~m}$ below the soil surface; therefore, we analyze the soil stress in front of the pile within a depth of 0-30 $\mathrm{m}$ for each model, as shown in Figure 16(a). Soil stresses in front of the pile increase to their maximum value with depth and then gradually decrease, with the compression pile exhibiting greater soil stresses than the tension pile. The change rate of soil stress before and after the maximum value of the compressed pile is greater than that of the tensioned pile. Additionally, an increase in the number of helical pile blades leads to a higher curve rate along the depth. At a depth greater than $17 \mathrm{~m}$, the soil stress in front of the compressed pile of Y3L3 is at its minimum, while the rate of decrease of the soil stress curve after reaching the extreme value of the tensioned pile is lower than that of the compressed pile.
The stress situation in front of the pile is crucially influenced by the displacement and deformation of the pile, and it is directly related to the variation of displacement and deformation of the pile body. Therefore, the pile body and soil deformation require further investigation. Figure 16(b) presents variations in the pile top plane angle with horizontal force at the loading point. Based on this and the pile body horizontal displacement shown in Figure 15(b), it can be inferred that: a) the common pile exhibits greater horizontal displacement and deflection of the pile body, with the bending of the pile body mainly concentrated at a burial depth of around $15 \mathrm{~m}$. The horizontal displacement of the common pile is greater at both the upper and lower parts of the moment concentrated point. Comparatively, the deformation of the helical pile differs due to the helical blade in the lower part of the pile, which results in the pile body being more firmly anchored in the soil. As a result, the horizontal displacement at the bottom and top of the helical pile is much smaller than that of the common pile, with the deformation of the pile body mainly relating to deflection, while lateral displacement remains negligible. Furthermore, an increase in the number of blades leads to smaller horizontal displacement, higher verticality of the lower pile body, and greater pile body bending. Therefore, at the bearing capacity limit state, the different pile models display different deflection and horizontal displacement compositions in relation to the soil stress change rate in front of the pile. The difference in the stress region of the soil in front of the pile from Figures 11(a) and 12(a) shows that bending deformation primarily dominates the upper part of the helical pile, and lateral deformation of the soil in front of the upper part of the pile has a lower effect.
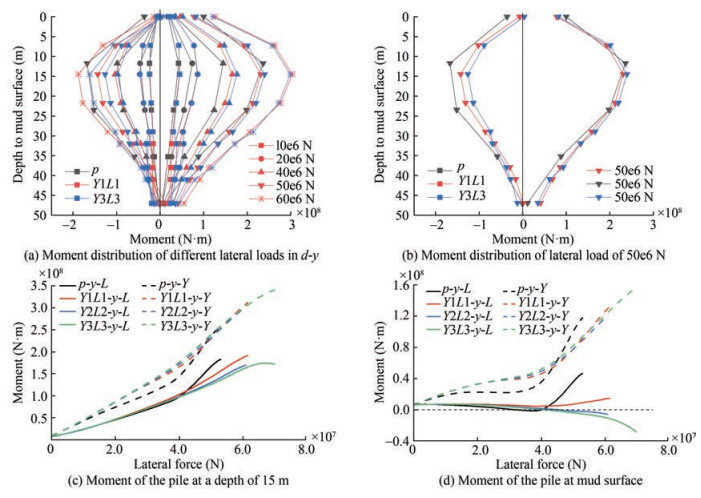
Figure 17 presents the moment distribution along the pile, which shows that the flexing behavior of the compression pile demands careful consideration. The left curves in Figures 17(a) and 17(b) correspond to tension piles, while the right curves pertain to compression piles. The square symbol represents the moment distribution under a lateral load of $10 \mathrm{e} 6 \mathrm{~N}$ at the loading point. The moment distribution of the pile gradually increases along the burial depth, with a gradual decrease in the bending moment after reaching the extreme value. The maximum bending moment appears between $15 \mathrm{~m}$ and $20 \mathrm{~m}$ below the soil surface, which is approximately three times the measurement of the pile diameter from the soil surface.
There are two main differences between the moment distribution of tensioned and compressed piles. First, the moment value of tensioned piles is smaller than that of compressed piles because the presence of tension reduces the bending of the structure. Second, the moment of compressed piles is larger than that of tension piles at the soil surface because maximum tension is located at the soil surface. Ordinary piles and helical piles exhibit notable differences in their bending moments. At small loads, the bending moments of compression and tension piles are similar for both ordinary and helical piles. However, as the load increases, the bending moment difference between them appears first with respect to compression piles (20e6 N). The moment of the helical pile is greater than that of the ordinary pile, and this difference increases with further loading. The bending moment between helical piles also varies, with Y3L3 exhibiting a greater moment than Y1L1 (30e6 N). As the load continues to increase, the difference between the ordinary pile and the helical pile diminishes (50e6 N). A noteworthy finding is that the bending moment of the compression helical pile in the deep soil layer is always greater than that of the ordinary pile. Additionally, for tension piles, the bending moment gradually increases and becomes greater than that of the helical pile when approaching the limit state of ordinary pile foundations (50e6 N), as shown in Figure 17(b).
The differences determined here demand a rational explanation. With respect to tension piles, it has been established that when the foundation's limit state is approached, the axial and horizontal displacements of the tension pile rapidly increase. However, at the limit value of axial force, the variation of tensile force is minimal, whereas the growth rate and capacity for growth of the tensile force for helical piles greatly exceed that of ordinary piles. For compression piles, the presence of blades enhances the anchorage between the lower section and the soil, which results in greater stiffness. The lateral force becomes increasingly reliant on deep soil, whereas the upper soil remains less disturbed and more robust, leading to larger bending moments and smaller horizontal displacements of the helical pile body. The gradual minimization of the gap between the helical pile and the ordinary pile's bending moment in the later loading stage is attributable to the pile body's bending, which is provoked by the significant lateral displacement of the ordinary pile. The horizontal bearing capacity potential of helical piles surpasses that of ordinary piles.
Figures 17(c) and 17(d) show the variations in the bending moment of the pile body section at a burial depth of $15 \mathrm{~m}$ and at the soil surface, respectively. The difference at the moment is noteworthy. First, the negative value of the bending moment signals the presence of the bending moment reversal point; and second, the reversal point of the compression helical pile exists above the soil surface, while that of the ordinary pile is lower than that of the helical pile.
It is of note that wind turbine pile foundations are typically more slender than barrel foundations. Under loads, pile deformation manifests in superposed horizontal displacement and pile bending. Pressurized piles are subjected to axial pressure due to self-weight and foundation bending moment. In addition, the substantial horizontal displacement of piles leads to the P- $\Delta$ effect, and the bending moment on the pile section is, therefore, larger due to the axial force and horizontal displacement and deflection. However, this effect is not considered in the finite element calculation. Figure 14 shows the horizontal displacement of the different piles, where the displacement of ordinary piles is almost double that of helical piles. Although there are smaller differences between the axial forces of the twopile types, the larger horizontal displacement of common piles results in a greater bending moment. Moreover, the larger inclination of the normal pile foundation causes extra bending moment due to the $\mathrm{P}-\Delta$ effect induced by the upper fan and tower, which leads to increased axial force and additional bending moment superposition that is significantly greater than that of helical piles. As a result, the failure of normal pile foundations accelerates abruptly and suddenly, in contrast to the stable performance of helical piles.
The displacement damage patterns of different foundations in the limit state are evident in the displacement vector diagram of Figure 18. For $d-y$, the interaction between the compressed pile and the tensioned pile is enhanced with an increase in the number of blades. The deformation range of the deep soil of the compressed pile is larger, whereas the deformation range of the upper soil is smaller. For $d-m y$, the increase in the number of blades improves the interaction between the tensioned pile and the pile-soil, while such an improvement is small for the compressed pile. Therefore, the differences in the interaction between the pile and soil around the tensioned pile are the main source of the bearing capacity difference, and this is also demonstrated through the axial force development characteristics presented in the previous section.
3.3 Internal force distribution
It is necessary to discuss the interrelationships between the shaft and the blade to clarify the bearing characteristics of both. In Figure 19, $H$ and $p f$ represent the helix and the shaft above the helix, respectively, and the gravity of the pile body is eliminated from the drawing. During the loading process, the growth rate of the shaft axial force of the compressed pile in the $y$ and $m y$ directions is greater than that of the blade in the initial stage, but it then gradually shifts when the load is big enough for $d-y$. However, the axial force of the helical blade is not fully unleashed with $d-m y$ because the axial force of the compression pile is not big enough, while for the tension pile, the growth rates of the shaft and the blade in the $y$ and $m y$ directions are close; therefore, the helix is of greater significance for the tensile pile than for the compressive pile with respect to the growth rate and load increments.
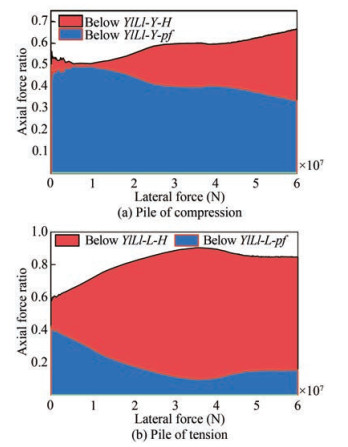
Figure 20 depicts the ratio between the axial force exerted by the helix and the shaft above the helix to the total axial force at the pile top of Y1L1. The contributions from the helix and shaft to the compression and tension piles are evident throughout the loading process. For compression piles, when the load is small, the helix and shaft exert an equally important force. However, as the load increases, the helix's contribution to the total axial force rises and reaches roughly $70 \%$ at ultimate capacity. The situation is similar for tension piles, but the helix accounts for a larger proportion of the axial force, although the ratio of shaft contribution slightly increases in the final stage. Thus, the significance of blades is greater for tension piles than for compression piles.
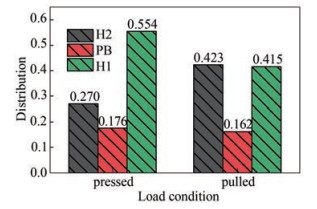
Figure 21 shows the contribution from each component of the pile segment below the top helix to the axial force of the pile segment in $Y 2 L 2$, with respect to axial force. $P B$ represents the pile section between the two blades, $H 1$ for the lower blade and $H 2$ for the upper blade. The bottom helix is more significant for the compression pile than for the tension pile, but the top and bottom helix are equivalent in the bearing of axial force with the tension pile, as indicated in the picture. The blade contribution differs for tension and compression piles.
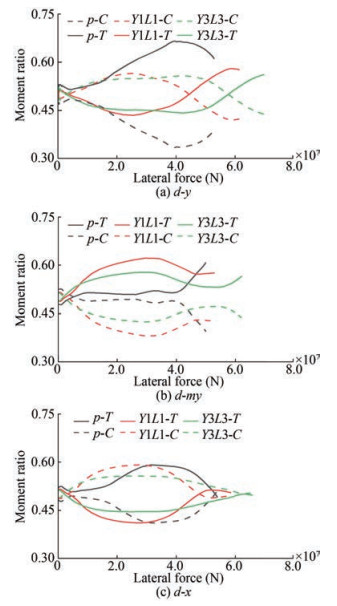
In Figure 22, Y1L1-C represents the moment provided by the compression side of the foundation, and Y1L1-T represents the moment provided by the tension side of the foundation. The moment is the multiplication of the variation in the total axial force at the top of the pile and the effective distance between the centroids of the pile and the foundation. The sum of all the compressed piles results in the moment provided by the compression side, and it is the same for tension piles.
With respect to $d-y$ and $d-m y$, pile $Y$ provides the most significant contribution from a single pile, which indicates that the opposing two piles do not contribute as much. The inclusion of additional helices improves the foundation capacity of the one-pile side, although the proportion of the capacity from the two-pile side increases at the limit stage. However, Figure 22(a) reveals a different scenario for TPJ. The incorporated helices alter the moment distribution, which implies that the two-pile-tension side of TPJ is highly susceptible to pulling out. This situation is similar in $d-x$ and in $d-y$, but the difference between the compression side and tension side is much smaller.
4 Research to improve bearing capacity by adding helices
In actual projects, foundations are subjected to loads from all directions, making the direction of the combined force uncertain. Consequently, it is crucial to ensure that there is a small foundation bearing capacity gap between each bearing direction. However, the bearing capacity of different loading directions is not equal. Nevertheless, increasing the number of helical blades may improve the short board limitation. A three-leg foundation is commonly employed in sea areas where the main wind and wave directions are established, which makes it necessary to increase the bearing capacity of a certain direction. However, achieving this involves not only increasing the bearing capacity of a certain loading direction by boosting the tension pile or compression pile capacity, but also affecting the overall bearing capacity by any of these. Therefore, it is essential to examine the effect of the distribution of the number of blades on the foundation bearing capacity, where blade spacing is maintained at 1.5 times the measurement of the outer diameter of the helical blade.
4.1 Effect of blade number on load-displacement curves in different loading directions
Figures 23(a) and 23(b) indicate the following: (a) that Y3L1 is very close to Y3L3 in $d-y$ and $d-m y$, and the twoblade increase in pile $Y$ significantly enhances the foundation's bearing capacity. However, for $d-x$, pile $Y$ plays a small role in the axial force, resulting in minimal improvements for $d-x$. (b) For Y1L3, the bearing capacity in $d-y$ and $d$-my is close to that of Y1L1, suggesting slight improvements in these two directions, and from Figure 23(c), the bearing capacity for $d-x$ is seen to be similar to Y3L3. (c) Consequently, the bearing capacity of the two-pile side (whether under compression or tension) is inadequate, and foundation damage is mainly controlled by a single pile. Increasing the blade on the single pile side is, therefore, the most effective solution, while increasing the blade on the two-pile side increases the bearing capacity gap between $d-x$ and the other two loading directions. (d) Enhancing the pilebearing capacity in normal pile foundations requires increasing the pile diameter and wall thickness; however, this approach significantly increases material consumption.
Figure 24 demonstrates the variations in the strong and weak axes depending on the distribution plan of blade number abd positions. All directions benefit when blades are added to a certain side of the foundation, and it is not simply beneficial for one particular axis. However, for Y1L3, the gap between $d-x$ and the other two directions increases, whereas for Y3L1, the advantages are as follows (Figure 24(b)): a) the added blades on the $Y$-pile increase the load carrying capacity on $d-y$ and $d-m y$; b) the added blades reduce the gap between $d-m y$ and $d-y$; c) the added blades mean that $d-y$ is the strong loading direction of the foundation.
4.2 Pile-soil interaction and deformation characteristics of unequal blades with helical pile foundation
4.2.1 Axial load-bearing characteristics
Due to variations in the blade numbers, the axial and horizontal bearing capacity and deformation of each pile also differ. It is thus necessary to further evaluate the impact of including different blade numbers. Figure 25 shows that the axial bearing performance of Y3L1 and Y1L3 differs from that of Y1L1. By increasing the blade number of the tension pile, as in Y1L3, the tension pile plays a more significant role than that in Y1L1. This results in the bearing capacity being exerted earlier than that of $Y 1 L 1$, which makes the foundation more reliant on the tension pile. In addition, the added blade on pile $L$ decreases axial displacement while improving the pile bearing capacity. However, when the load is small, the compression pile's displacement in Y1L3 is slightly larger than that of Y1L1, indicating that the tensioned pile's bearing capacity must depend on the compressed pile. The addition of blades to a pile produces a global effect, and it does not only affect that pile. Figures 25(c) and 25(d) suggest the following: (a) that the impact of adding a blade on the foundation's bearing capacity is less for $d$-my than for $d-y$, (b) Y1L3's pile bearing capacity contributes almost nothing to the foundation, as the foundation's limitations lie on the one-pile side, which gives Y3L1 the largest bearing capacity.
4.2.2 Horizontal bearing characteristics
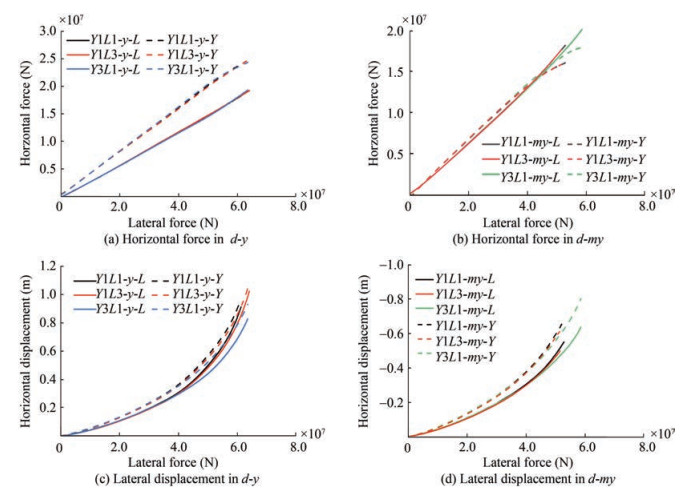
Figures 26(a) and 26(b) depict the development of the lateral load and horizontal force for different foundation models in $d-y$ and $d-m y$. Although differing helical blade numbers result in varying stiffnesses for different piles in the horizontal direction, this does not drastically alter the horizontal force distribution between the foundation's piles, which remains comparable to TPJ's distribution. This result is attributed to the fact that the difference in lateral stiffness between the two-pile side and the one-pile side is substantial, and the horizontal displacement disparity resulting from the pile body stiffness difference caused by different blade numbers is negligible with the coordination of a jacket with high rigidity.
Figures 26(c) and 26(d) suggest that the horizontal displacement of $d-y$ decreases after adding the blade, and this reduces not only for the pile with the added blade but also for the unchanged pile. This reduction occurs because adding a blade leads to a decrease in axial displacement, thereby reducing soil disturbance around the pile, and a decrease in horizontal displacement reduces the shadow effect between piles. In addition, the jacket's stiffness has a coordinating effect on the displacement of both sides of the foundation. The horizontal displacement of Y3L1 is shown to be the smallest in Figure 26(c) due to the significant decrease in axial force under tension after increasing the blade in pile $Y$. It is of note that Y1L3 has no notable effect on horizontal displacement.
5 Conclusions
A comparative analysis of conventional pile foundations and helical pile foundations with various blade distribution schemes was conducted. The study analyzed the data of the structure and soil and investigated the bearing capacity, bearing mechanism, and failure mode of helical pile foundations and conventional pile foundations under different loading directions while exploring the contribution of blade number increases to the bearing characteristics. The use of an uneven blade distribution on the foundation as a means of enhancing the bearing capacity and perfecting the helical pile jacket foundation was then discussed. The study further explored the interaction characteristics between the compressed and tensioned piles and analyzed the principle associated with the increased bearing capacity.
Competing interestThe authors have no competing interests to declare that are relevant to the content of this article. -
Table 1 Principal parameters of foundation.
$ D r $ $ k(\mathrm{ cm} / \mathrm{s}) $ $ \varphi\left({ }^{\circ}\right) $ $ G s $ $ c(\mathrm{kPa}) $ $ W(\%) $ $ e $ 0.45 0.0039 31.8 2.67 2.5 22.41 0.57 Table 2 Principal parameters of the foundation
Part (m) Pile Jacket Buried depth 50 - Height - 60 Spacing 30 30 Top spacing of legs - 15 Story height of brace rod - 20 Table 3 Parameters of basic components
Component Diameter (m) Height (m) Thickness (mm) Pile 3 53 70 Helical blades 6 3 60 Jacket legs (down) 2.1 10 75 Jacket legs (up) 1.6 50 75 Brace rod 1 - 40 Transition section - 5 60 -
Abdrabbo FM, Wakil AZ (2016) Laterally loaded helical piles in sand. Alexandria Engineering Journal 55: 3239–3245 https://doi.org/10.1016/j.aej.2016.08.020 Alwalan M, Alnuaim A (2022) Axial loading effect on the behavior of large helical pile groups in sandy soil. Arabian Journal for Science and Engineering 47: 5017–5031 https://doi.org/10.1007/s13369-021-06422-9 Azarpour A, Mohammadzadeh O, Rezaei N, Zendehboudi S (2022) Current status and future prospects of renewable and sustainable energy in North America: Progress and challenges. Energy Conversion and Management: 115945 https://doi.org/10.1016/j.enconman.2022.115945 Bak HM, Halabian AM, Hashemolhosseini H, Rowshanzamir M (2021) Axial response and material efficiency of tapered helical piles. Journal of Rock Mechanics and Geotechnical Engineering 13: 176–187 https://doi.org/10.1016/j.jrmge.2020.04.007 Chen Q (2020) Research on vertical bearing characteristics of screw pile foundation for offshore wind turbine in sand. Tian jin: Tian jin University, 2020. (In Chinese) Ding HY, Wang L, Zhang PY, Le CH (2018) Study on the lateral bearing capacity of single-helix pile for offshore wind power. Proceedings of the ASME 2018 37th International Conference on Ocean, Offshore and Arctic Engineering OMAE2018. https://doi.org/10.1115/OMAE2018-77391 Ding HY, Wang L, Zhang PY, Le CH, Liang YG, Tian Y L, Qi X (2019) The recycling torque of a single-plate helical pile for offshore wind turbines in dense sand. Applied Sciences 9(19): 4105. https://doi.org/10.3390/app9194105 Emirler B, Tolun M, Yildiz A (2020) Investigation on determining uplift capacity and failure mechanism of the pile groups in sand. Ocean Engineering 218: 108145 https://doi.org/10.1016/j.oceaneng.2020.108145 Ghaly A, Hanna A (2011) Experimental and theoretical studies on installation torque of screw anchors. Canadian Geotechnical Journal 28: 353–364 https://doi.org/10.1139/t91-046 Livneh B, Naggar MHE (2008) Axial testing and numerical modeling of square shaft helical piles under compressive and tensile loading. Canadian Geotechnical Journal 45: 1142–1155 https://doi.org/10.1139/T08-044 Mittal S, Ganjoo B, Shekhar S (2010) Static equilibrium of screw anchor pile under lateral load in sands. Geotechnical & Geological Engineering 28: 717–725 https://doi.org/10.1007/s10706-010-9342-4 Mohajerani A, Bosnjak D, Bromwich D (2016) Analysis and design methods of screw piles: A review. Soils & Foundations 56: 115–128 https://doi.org/10.1016/j.sandf.2016.01.009 Peri–D, Runesson K, Sture S (1992) Evaluation of plastic bifurcation for plane strain versus axisymmetry. Journal of Engineering Mechanics 118: 512–524 https://ascelibrary.org/doi/10.1061/(ASCE)0733-9399(1992)118:3(512) Rice JR (1976) The localization of plastic deformation. Theoretical and Applied Mechanics: 207–220 Sakr M (2009) Lateral Resistance of Helical Piles in Oil Sands. In: Magued I, Debra FL, Mohamad HH (Eds. ). Contemporary Topics in Deep Foundations. ASCE, New York, 464–471 https://doi.org/10.1061/9780784410219 Tappenden K, Sego D, Robertson P (2009) Load Transfer Behavior of Full-Scale Instrumented Screw Anchors. In: Magued I, Debra FL, Mohamad HH (Eds. ). Contemporary Topics in Deep Foundations. ASCE, New York, 472–479 Vignesh V, Muthukumar M (2023) Experimental and numerical study of group effect on the behavior of helical piles in soft clays under uplift and lateral loading. Ocean Engineering 268: 113500 https://doi.org/10.1016/j.oceaneng.2022.113500 Wang L (2019) Study on the Construction Process and Uplift Capacity of Helical Piles in Fine Silica Sand[D]. Tian jin: Tian jin University, 2019 Wang L, Zhang PY, Ding HY, Tian YH, Qi X (2020) The uplift capacity of single-plate helical pile in shallow dense sand including the influence of installation. Marine Structures 71: 102697. https://doi.org/10.1016/j.marstruc.2019.102697 Wen K, Wu X, Zhu B (2020) Numerical investigation on the lateral loading behaviour of tetrapod piled jacket foundations in medium dense sand. Applied Ocean Research 100: 102193 https://doi.org/10.1016/j.apor.2020.102193 Zeng XM, Shi W, Feng XY, Shao LY, Li X (2023) Investigation of higher-harmonic wave loads and low-frequency resonance response of floating offshore wind turbine under extreme wave groups, Marine Structures 89: 103401. https://doi.org/10.1016/j.marstruc.2023.103401 Zhang Y, Shi W, Li DS, Li X, Duan YF, Verma AS (2022) A novel framework for modeling floating offshore wind turbines based on the vector form intrinsic finite element (VFIFE) method, Ocean Engineering 262: 112221. https://doi.org/10.1016/j.oceaneng.2022.11222

