Optimisation of a Multi-Body Three Floats Wave Energy Converter in Irregular Waves
https://doi.org/10.1007/s11804-023-00353-7
-
Abstract
A multi-body wave energy converter, consisting of three floats and modeled as a two body problem, is optimised to enhance its mean absorbed power using the Response Surface Optimisation Method. The optimisation focuses on two input parameters namely; the floats' diameters and the spacing, in various sea states and at different PTO dampings. A frequency domain analysis is performed for the WEC model scaled at 1:50 in regular and irregular waves. Obtained results are validated against numerical and experimental data available in the literature. Validations show good agreement against the unmoored model's added mass, radiation damping, response amplitude operator, mean absorbed power and, capture width ratio. The sea states selected for optimisation are represented by a JONSWAP wave spectrum with, a range of significant wave heights (0.04 to 0.06 m) and a range of peak periods (0.8 to 1.3 s). This corresponds to (2 to 3 m) significant wave heights and (5.6 to 9.2 s) peak periods in full scale. Results show that the optimised WEC model demonstrates good and consistent enhancement of its mean absorbed power and capture width ratio. -
1 Introduction
Over the past few decades, there has been a need to replace fossil fuels with sustainable alternatives to reduce the world's harmful emissions. Wave energy is one of the sources of renewable energy that is relatively under exploited unlike solar and wind energy. Wave energy may be extracted using various types of wave energy converters. Despite the enormous potential in ocean waves, wave power extraction on a commercial scale is still very low (Aderinto and Li, 2018) due to challenges faced such as; construction, operation, maintenance, capital cost, lifecycle cost, return on investments and, environmental issues.
Several different concepts of wave energy converters (WECs) exist and are usually divided into six distinct classes namely; attenuators, point absorbers, oscillating-wave surge converters, oscillating water columns (OWC), overtopping devices and, submerged pressure-differential devices (Pecher and Kofoed, 2016; Chandarsekaran et al., 2022; Guedes Soares et al., 2012). The work presented here within focuses on a multi-body WEC consisting of three floats and belonging to the attenuators class.
The McCabe Wave Pump (McCormick et al., 1998) is a classic example of attenuators consisting of an articulated-barge system made up of three barges hinged together with a large horizontal plate that is attached below the central barge. Water pumps are driven by the relative pitch motion of the barges that are excited by ocean waves.
McCormick et al. (1998) modeled a two-barge system using an energy based method considering heave and pitch motions and assuming small angles of pitch. Kraemer (2001) used an alternative force-based method to formulate the non-linear equations of motion of a hingedbarge system with an arbitrary number of barges and inertial plates. Surge, as well as heave and pitch motions were considered while the assumption of small angles of pitch was ignored.
Another device derived from the concept of attenuators is the Pelamis. Its idea is based on making use of the relative pitch motion between segments of long cylinders with their axes aligned to the direction of wave propagation. The segments are linked together by hinged joints designed to induce a tunable resonant response to increase the power production across various sea states. These joints resist motions of the cylinders by using hydraulic rams which pump high pressure oil through hydraulic motors via smoothing accumulators. In turn, the hydraulic motors drive electrical generators which produce electric energy (Henderson, 2006). The Pelamis concept has been extensively modelled using various numerical techniques. Whenever possible, the employed numerical techniques were validated by tank test experiments. The most commonly used prediction tool is based on the linear, frequency-domain, Strip theory approach to solve the hydrodynamic problem. The frequency dependent diffraction/radiation problem may also be solved using 3D wave diffraction tools, as the one described by Pizer (1993; 1995), for instance. The output given by this tool included motions, loads and, power capture. An extension to the code used normalized response amplitude operators and joint power operators to predict performance in site-specific wave spectra. This allowed for optimisation of the system in terms of: overall size and geometry, joints number and configuration, bending moment and, joint angle limits. The numerical results were validated using a 1/35th scale tank model. Agreement was found to be good across the range of wavelengths and amplitudes of interest (Yemm et al., 2000). Full-scale models of these devices were tested in Scotland in 2004 and in Portugal in 2008, however, over a relatively short period of time.
Chandrasekaran and Sricharan (2021) investigated a multi-body floating wave energy converter named the bean-Float (BFWEC) using the Wave Energy Converter SIMulator (WEC-Sim) time-domain modeling tool for a collection of bean-shaped floats connected circumferentially around a central cylinder or buoy. The investigated device was a directionally-insensitive, floating-point absorber that extracts wave energy under heave degrees owing to the relative motion of the floats with central buoy. Three distinct layouts with multiple floats were used to investigate the impact of the number of floats on the overall performance of the device. Each layout had a linear damping power take-off (PTO) system for power absorption.
The work presented here within is based on the configuration and attributes of the M4 WEC device first investigated experimentally by Stansby et al. (2015a, b) and analysed by Sun et al. (2017). The M4 WEC device is a two body problem where, the first body consists of a fore and mid float rigidly connected to one another by a beam. The second body consists of an aft float connected by a beam to a hinge above the mid float. The linear diffraction/radiation problem of the M4 WEC is solved for the axisymmetric floats with drag forces incorporated by equivalent linearization as described by Eatock Taylor et al. (2016). Sun et al. (2016) investigated the effect of a small array configuration of the M4 WEC device in regular waves. Performance of the device, in a row, was affected by the multibody interactions and the wave direction.
The performance of the M4 WEC device was investigated by Sun et al. (2017) in regular and irregular sea waves in addition to optimising its power generation and CWR. This was achieved by altering the vertical hinge position and varying the linear hinge damping of the PTO. Stansby et al. (2017) optimised the M4 WEC capture width ratio by increasing the number of floats and PTO devices by adding side floats to the original mid-float to achieve a rigid triangular configuration between the fore and two-or-three mid floats. Gaspar et al. (2021) demonstrated the significance of having low maximum to mean mechanical power ratios prior to designing the oil-hydraulic power take-off. The study investigated the properties of the M4 WEC that would allow for these lower power ratios and demonstrated their influence on the initial sizing of the power take-off device.
For the work carried out and presented in this paper, a frequency domain analysis is performed for the Three Floats WEC with the hydrodynamic analysis and interaction of the two bodies based on the three-dimensional potential flow theory available in (). The hydrodynamic interaction is concerned with the influence of one body's flow field on the other where; the interaction depends on both, the floats separation distance and the relative size of the floats.
Surge and heave added mass and radiation damping are obtained and validated against results available in Eatock Taylor et al. (2016). The Response amplitude operator RAO of the relative pitch rotation at the hinge for regular waves, and various hinge dampings, is obtained and validated against results in Sun et al. (2017). The non-optimised model is also validated in long crested irregular waves where, the root mean square of the relative pitch rotation, the mean absorbed power and, the capture width ratio (CWR) are all compared against results in Sun et al. (2017). All the above mentioned validations of the non-optimised WEC's results form a robust preamble for subsequent optimisations.
The WEC under consideration is optimised using the Response Surface Method to enhance its mean absorbed power. The conducted optimisation focuses on two input parameters namely; the floats diameters and the spacing between the floats in sea states that have moderate occurrence in various sites. The optimisation input parameters are all picked with logical limits, to their values, taken into consideration. In addition, the original ratios between the floats' diameters are maintained as with the non-optimised model. The spacings between the mid-float and the fore and aft floats are always kept equal.
2 Device geometry and analysis
The Three Floats WEC consists of two bodies. The first consists of the fore and mid floats, rigidly connected to one another by a beam. The second body consists of the aft float connected by a beam to a hinge above the mid float where, the relative pitch rotations are damped to absorb power using a linear damping PTO device. The PTO is placed above the water line which facilitates access and maintenance, see Figure 1.
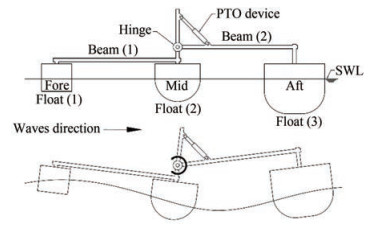 Figure 1 WEC general configuration and working principal
The floats are spaced equally approximately at a distance half that of the wavelength so that the two bodies pitch motion is in anti-phase generating relative rotation. The floats size increases from fore-to-aft facilitating alignment with the local wave direction. The mid and aft floats are of hemispherical and rounded bases giving negligible drag losses.
A Frequency domain analysis via ANSYS AQWA is performed in regular and irregular head waves for the WEC model based on the three-dimensional potential flow theory (ANSYS Inc., 2018). Irregular waves are defined using the JONSWAP wave spectrum and applied in head waves relative to the WEC.
The mean absorbed power of the three floats WEC is enhanced by optimisation using the, well known, response surface method (RSM) defined in ANSYS AQWA. This method is a simple and efficient tool where, a response surface is generated based on a sequence of designed experiments to obtain an optimal response of a variable based on variations in other independent variables (input variables). For the WEC model under consideration, this was deemed to be a suitable method since; only two decision variables and one response variable were involved in the study.
3 Numerical model
The numerical modelling and optimisation of the Three Floats WEC are both carried out using ANSYS AQWA software (ANSYS Inc., 2018). The WEC validation is carried out in regular and irregular waves for different wave heights, wave periods and hinge linear dampings. Optimisation is performed in a real sea state represented by the JONSWAP spectrum and applied in head waves with respect to the WEC as in Sun et al. (2017).
In a linear dynamic system consisting of N structures, the equation of motion in the frequency domain is as follows:
$$ \left[-\omega^2 \boldsymbol{M}-\mathrm{i} \omega \boldsymbol{C}+\boldsymbol{K}\right] \boldsymbol{U}=\boldsymbol{F} $$ (1) where M, C and K are the 6N×6N mass, damping and stiffness matrices respectively, U is the 6N×1 motion response and F is the 6N×1 external force at frequency ω (ANSYS Inc., 2018).
The equation of motion of the WEC unlinked bodies is defined as given in Eq. (2).
$$ \begin{array}{*{20}{l}} {\left[ { - \omega _e^2\left( {{{\boldsymbol{M}}_s} + {\boldsymbol{M}}_a^\prime } \right) - {\text{i}}{\omega _e}\left( {{{\boldsymbol{C}}^\prime } + \Delta {\boldsymbol{C}}} \right) + {\boldsymbol{K}}_{{\text{hys}}}^\prime + \Delta {{\boldsymbol{K}}_{{\text{hys}}}} + {{\boldsymbol{K}}_a}} \right]} \\ {\left[ {{{\boldsymbol{x}}_{jm}}} \right] = \left[ {{\boldsymbol{F}}_{jm}^\prime } \right]} \end{array} $$ (2) where Ms is the structural mass matrix, Ma' is the total added mass matrix due to diffracting panels and Morison elements, C' is the hydrodynamic damping matrix by the diffracting panel elements, ∆C is the additional linear damping, Khys' is the hydrostatic stiffness matrix, ∆Khys is the user defined additional hydrostatics stiffness matrix, Ka is the additional structure stiffness matrix and Fjm' is the total Froude-Krylov and diffracting forces and moments (ANSYS Inc., 2018).
The ANSYS AQWA software allows for the connection between floating bodies using articulated joints that give degrees-of-freedom only in rotation. This applies to the Three Floats WEC under consideration where, the two bodies of the WEC are linked together using one hinged joint located above the mid float. The hinged joint allows for one rotational degree-of-freedom about the global y-axis.
The mean power absorbed in regular waves PcREG at every frequency ω may be written as shown in Eq. (3) (Mei et al., 2005). θr is the relative pitch rotation between the two bodies and Bd is the linear hinge damping coefficient.
$$ P_c^{\mathrm{REG}}=\frac{1}{2} \omega^2 B_d\left|\theta_r\right|^2 $$ (3) The relative pitch rotation θr becomes the response amplitude operator of the relative pitch rotation θrRAO for a unit wave amplitude. The mean absorbed power at each wave frequency is proportional to the relative pitch rotation |θr|2 and so it is also proportional to the square of the amplitude of the incident wave as in Sun et al. (2017).
In the present frequency domain analysis, the root mean square of the relative pitch rotation can be obtained through Eq. (4) (Bhattacharyya, 1978). Sη(ω) is the energy spectrum of the incident waves.
$$ \theta_r^{\mathrm{RMS}}=\sqrt{\int_0^{\infty} S_\eta(\omega)\left|\theta_r^{\mathrm{RAO}}(\omega)\right|^2 \mathrm{~d} \omega} $$ (4) The mean absorbed power in irregular waves is defined by the energy spectrum and the mean absorbed power in regular waves as per (Newman, 1979; Babarit, 2010).
$$ P_c^{\mathrm{IRR}}=\int_0^{\infty} 2 S_\eta(\omega) P_c^{\mathrm{REG}}(\omega) \mathrm{d} \omega $$ (5) The mean incident power per unit width PiIRR is given in Eq. (6), where Hs is the significant wave height, Cge is the group velocity corresponding to the energy period Te as described by Stansby et al. (2015a) with $C_{\mathrm{ge}}=g T_e / 4 \pi$ where, $T_e=0.78 T_p$ for γ = 1 and $T_e=0.84 T_p$ for γ = 3.3, where γ is the JONSWAP spectrum peak factor.
$$ P_i^{\mathrm{IRR}}=\frac{1}{16} \rho g H_s^2 C_{\mathrm{ge}} $$ (6) The capture width indicates the power absorption capability of any wave energy converter as shown in Eq. (7) (Falnes, 2002).
$$ \mathrm{CW}=\frac{P_c^{\mathrm{IRR}}}{P_i^{\mathrm{IRR}}} $$ (7) The capture width ratio CWR is given in Eq. (8) where, Le is the wavelength corresponding to the energy Te and $L_e=\mathrm{g} T_e^2 / 2 \pi$ in deep waters.
$$ \mathrm{CWR}=\frac{\mathrm{CW}}{L_e} $$ (8) Sequential analyses and calculations are performed in the frequency domain using the ANSYS AQWA software in addition to applying the WEC assessment equations; Eq. (5), Eq. (6) and Eq. (8) to evaluate the mean absorbed power, the mean incident power and the CWR, respectively, as illustrated in Figure 2. The first step was to model the WEC configuration and to define the main inputs of the analysis (masses, CoG, moments of inertia and, hinge damping coefficient Bd, etc.). In the second step, the hydrostatic stiffness matrix is calculated and the mesh of the WEC is defined to calculate the hydrodynamic coefficients and the wave excitation forces using the 3D diffraction theory. In step three and using a regular wave of 0.02 m height, equivalent to 1.0 m in full scale, θrRAO and PcREG are calculated. Consequently, θrRMS and PcIRR are calculated in irregular waves. In the fourth and final step, a JONSWAP spectrum is defined by Hs, TP and γ to calculate θrRMS and PcIRR. The mean incident power per unit width PiIRR is calculated to obtain the CWR of the WEC.
 Figure 2 Calculations flow chart
The non-optimised model's mass properties and dimensions are defined in Table 1 and Figure 3, respectively. The vertical position of the hinge "O" is Zh = 0.21 m from the still water line (SWL). The wave energy converter is modelled as a two body problem (Sun et al., 2017). Mass and inertia properties of the physical model are about the CoG and the position of the centre of gravity is measured with respect to the point where; the vertical axis of the mid float crosses the SWL.
Table 1 Mass and inertia of the non-optimised model about CoGItems Float (1) Float (2) Float (3) Beam (1) Beam (2) Mass (kg) 2.0 7.866 23.39 0.207 0.559 XCoG (m) 0.8 0 -0.8 0.5 -0.5 YCoG (m) 0 0 0 0 0 ZCoG (m) 0.015 -0.098 -0.128 0.116 0.21 Ixx (kg·m2) 0.044 0.199 0.561 0.001 0.021 Iyy (kg·m2) 0.044 0.19 0.552 0.017 0.047 Izz (kg·m2) 0.02 0.124 0.641 0.018 0.068  Figure 3 WEC non-optimised dimensons
4 Validation of results
The non-optimised model is validated against numerical and experimental results presented in Eatock Taylor et al. (2016) and Sun et al. (2017). Validations are performed for; the WEC added mass, radiation damping, response amplitude operator (RAO), mean absorbed power and, capture width ratio (CWR) without mooring constraints.
4.1 Hydrodynamic coefficients
At first, validation is performed for float (3)'s (aft float) surge and heave added mass and radiation damping in regular waves where; the input data is obtained from Sun et al. (2017) and the validation is performed against results in Eatock Taylor et al. (2016). a11 and a33 refer to the surge and heave added mass, respectively, b11 and b33 refer to the surge and heave radiation damping, respectively, see Figure 4 and Figure 5.
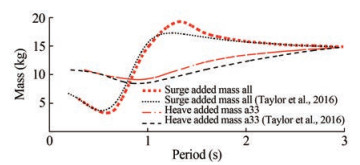 Figure 4 Float (3) surge and heave added mass
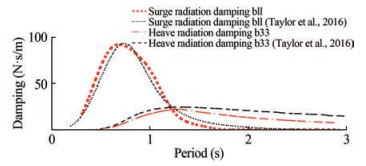 Figure 5 Float (3) surge and heave radiation damping
Comparison of results shows good matching. Very slight discrepancies may be noticed and are attributed to slight differences in values of the total weight (around 1.0 kg) and the centre of gravity (around 0.003 m) of float (3) between Sun et al. (2017) and Eatock Taylor et al. (2016).
4.2 Response amplitude operator (RAO)
The RAO of the relative pitch rotation in regular waves is obtained and validated against results in Sun et al. (2017). The RAO is calculated at a regular wave height of 0.02 m, which is equivalent to 1.0 meter in full scale, and at different hinge damping values of 4, 6, and 8 Nms, see Figures 6‒8, respectively.
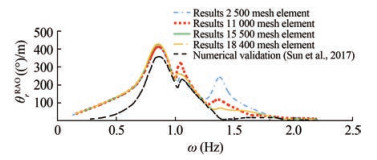 Figure 6 RAO of relative pitch rotation at 4 Nms hinge damping
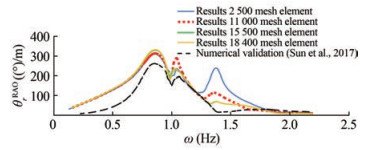 Figure 7 RAO of relative pitch rotation at 6 Nms hinge damping
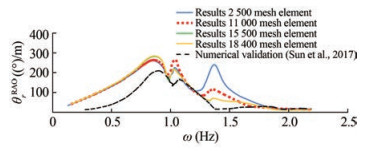 Figure 8 RAO of relative pitch rotation at 8 Nms hinge damping
Validations confirm that the system has two peak frequencies with a slight shift of 0.05 Hz in terms of where natural frequencies occur. What appears to be a third peak occurs at a frequency between 1.4 Hz and 1.6 Hz. This pseudo third peak is attributed to the mesh quality. This peak was successfully suppressed by refining the mesh and increasing the number of elements from 2 500 to 11 000. A mesh convergence study was carried out to establish mesh independence before subsequent calculations. The number of mesh elements was increased systematically up to a maximum of 18 400. Results indicate that a total of 15 500 mesh elements is adequate, see Figures 6‒8.
The effect of hinge damping on responses, away from peak frequencies, is trivial. Discrepancies between obtained results and the validation data (Sun et al., 2017) tend to increase as hinge damping values increase see Figures 6‒8.
4.3 Validation in irregular waves
Validation of results in irregular waves is carried out where, the root mean square of the relative pitch rotation, the absorbed mean power and, the capture width ratio are all compared against results in Sun et al. (2017). Values of the significant wave height Hs and the hinge damping Bd, at different wave peak periods Tp, are all illustrated in Table 2 as in Sun et al. (2017). A JONSWAP wave spectrum is applied in long crested waves with a spectrum peak factor γ equalling 3.3.
Table 2 Hs and Bd in irregular wavesTp (s) Hs ≈ 0.04 m, γ = 3.3 Hs (m) Bd (Nms) 0.6 – – 0.7 0.031 8.76 0.8 0.034 7.71 0.9 0.033 6.65 1.0 0.033 5.9 1.1 0.031 5.73 1.2 0.033 5.2 1.3 0.033 5.42 1.4 0.033 6.22 1.5 0.034 6.69 1.6 0.034 7.15 Some discrepancies are noted in the RMS of the relative pitch rotation, see Figure 11. These discrepancies tend to increase away from the peak. This is attributed to the corresponding discrepancies noted in the results of the RAO shown in Figure 6.
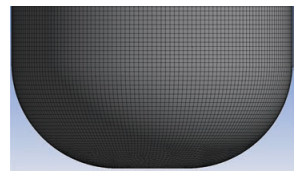 Figure 9 Float (3) refined mesh (approximately 15 500 elements for all three floats) up to the still water line
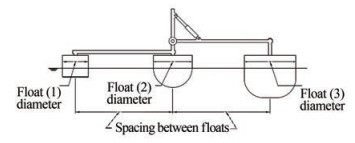 Figure 10 Optimisation input parameters
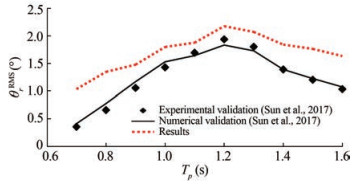 Figure 11 RMS of relative pitch rotation for Hs ≈0.04 m
The mean absorbed power and CWR show very good matching with the results available in Sun et al. (2017) as well as similar trends to what is reported in the relevant literature (Chandrasekaran and Sricharan, 2020), see Figure 12 and Figure 13.
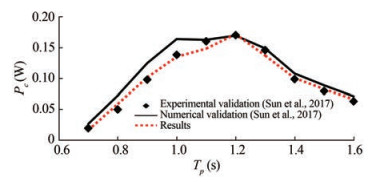 Figure 12 Mean absorbed power for Hs ≈0.04 m
 Figure 13 CWR for Hs ≈0.04 m
Following this sequence of validations, the non-optimised model is now deemed ready for optimisation.
5 Optimisation of the WEC
In this section, the, now validated, Three Floats WEC model is optimised to enhance its mean absorbed power. This is performed using the Response Surface Optimisation Method.
The optimisation carried out addresses the mean absorbed power as an output parameter and is performed based on variations in two input parameters namely; the floats diameters and the spacings between the floats see, Figure 10. Subsequently, a similar optimisation is carried out for the CWR.
Three values of each input parameter are considered leading to 9 design/response points that create the response surface. Logical limits to the input parameters were respected in all optimisations. For instance, ratios between the floats' diameters were kept as per the non-optimised model with the optimised spacings between the floats always considered equal. The floats drafts were kept unchanged.
Optimisation of the WEC is performed in various sea states that have a moderate occurrence in various sites and are all modeled as a JONSWAP wave spectrum applied in head waves with a spectrum peak factor γ equalling 3.3. Variation in the sea states is achieved via variation in the significant wave height (Hs) and in the wave peak period (Tp). In addition, the hinge damping (Bd) is varied as well, see Table 3. Varying these 3 parameters was deemed essential to obtain a comprehensive set of results that may form a robust basis for drawing subsequent conclusions.
Table 3 Optimisation sea states and hinge dampingsOptimisation sea states Hs (m) Tp (s) Bd (Nms) 1.0 0.04 0.8 4.0 2.0 0.04 1.0 4.0 3.0 0.04 1.1 4.0 4.0 0.04 1.2 4.0 5.0 0.04 1.3 4.0 6.0 0.04 1.0 6.0 7.0 0.06 1.0 4.0 Other parameters that are dependent on the two main optimisation input parameters will change accordingly. Since the floats diameters are changed, their displacements will change too to keep the floats at the same drafts. Accordingly, the mass and the inertia properties (about CoG) of the optimised model will change as well, see Table 6 and Table 7.
Table 4 Optimisation design pointsDP Float (1) radius (m) Floats spacing (m) 1 0.1 0.7 2 0.1 0.95 3 0.1 1.2 4 0.135 0.7 5 0.135 0.95 6 0.135 1.2 7 0.17 0.7 8 0.17 0.95 9 0.17 1.2 Table 5 Beams dependant parametersDP XCoG (m) B1 B2 1 0.437 5 -0.437 5 2 0.593 75 -0.593 75 3 0.75 -0.75 4 0.437 5 -0.437 5 5 0.593 75 -0.593 75 6 0.75 -0.75 7 0.437 5 -0.437 5 8 0.593 75 -0.593 75 9 0.75 -0.75 Table 6 Floats dependant parameters (mass & CoG)DP Mass (kg) XCoG (m) F1 F2 F3 F1 F2 F3 1 2.25 8.69 24.45 0.7 0 -0.7 2 2.25 8.69 24.45 0.95 0 -0.95 3 2.25 8.69 24.45 1.2 0 -1.2 4 4.11 20.47 46.63 0.7 0 -0.7 5 4.11 20.47 46.63 0.95 0 -0.95 6 4.11 20.47 46.63 1.2 0 -1.2 7 6.51 39.78 76.08 0.7 0 -0.7 8 6.51 39.78 76.08 0.95 0 -0.95 9 6.51 39.78 76.08 1.2 0 -1.2 Table 7 Floats second moments of inertiaDP F1 F2 F3 Ixx Iyy Izz Ixx Iyy Izz Ixx Iyy Izz 1 0.049 0.049 0.022 0.219 0.210 0.137 0.586 0.576 0.669 2 0.049 0.049 0.022 0.219 0.210 0.137 0.586 0.576 0.669 3 0.049 0.049 0.022 0.219 0.210 0.137 0.586 0.576 0.669 4 0.090 0.090 0.041 0.517 0.494 0.322 1.118 1.100 1.277 5 0.090 0.090 0.041 0.517 0.494 0.322 1.118 1.100 1.277 6 0.090 0.090 0.041 0.517 0.494 0.322 1.118 1.100 1.277 7 0.14 0.14 0.065 1.00 0.96 0.62 1.82 1.79 2.08 8 0.14 0.14 0.065 1.00 0.96 0.62 1.82 1.79 2.08 9 0.14 0.14 0.065 1.00 0.96 0.62 1.82 1.79 2.08 When spacings between the floats change, the lengths of the connecting beams will change as well. Accordingly, the beams' centres of gravity will shift. This shift is set to be proportional to the ratio between the original beam length and its centre of gravity, see Table 5.
The generated response surfaces show that optimising the floats' diameters and spacings does indeed enhance the WEC's mean absorbed power and CWR for all the selected sea states, except for sea states 1.0 and 5.0 where, no inflection point is detected on the generated response surface, see Figure 14(a) and Figure 14(e). In all other sea states, enhancements in the mean absorbed power and the CWR range from 23.3% up to 79.5% based on the selected sea state and the hinge damping as shown in Table 8.
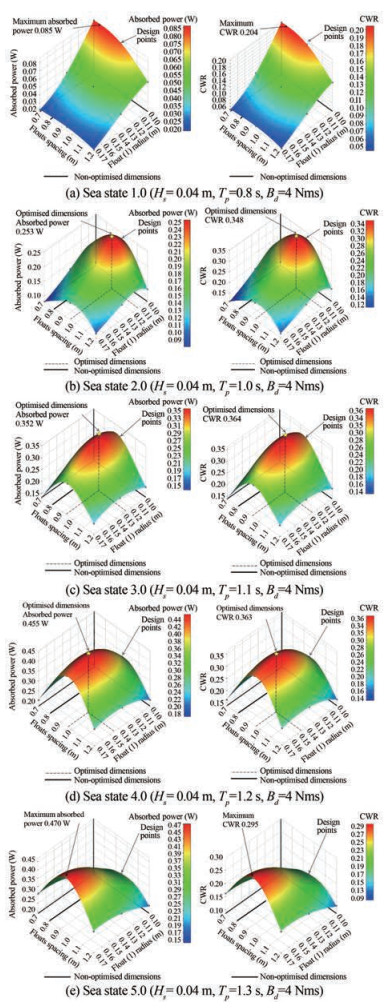 Figure 14 Mean absorbed power and CWR response surfacesTable 8 Optimisation sea states summary results
Optimisation sea states Hs (m) Tp (s) Bd (Nms) Enhancement in mean absorbed power and CWR (%) Increase in floats' spacing (%) Increase in floats' radii (%) 1.0 0.04 0.8 4 N/A N/A N/A 2.0 0.04 1 4 27 18.5 12.7 3.0 0.04 1.1 4 29.3 16.13 26.91 4.0 0.04 1.2 4 79.5 21.1 45.3 5.0 0.04 1.3 4 N/A N/A N/A 6.0 0.04 1 6 34.3 15.49 16.12 7.0 0.06 1 4 23.3 17.2 12.6 Optimisation sea states from 2.0 to 4.0 focus on altering the wave peak periods from 1.0 to 1.2 seconds at the same significant wave height and hinge damping of 0.04 m and 4 Nms, respectively. Enhancements in the mean absorbed power and CWR range from 27.0% up to 79.5%, see Figure 14(b), Figure 14(c) and Figure 14(d). Variations in the floats' spacings and diameters, corresponding to these enhancements, are illustrated in Table 8 and Table 9.
Table 9 Optimised mean absorbed power, CWR, and WEC dimensionsOptimisation sea states Original mean absorbed power (W) Original CWR Maximum mean absorbed power (W) Maximum CWR Optimised floats' spacing (m) Original 0.8 m Optimised float (1) radius (m) Original 0.1 m Optimised float (2) radius (m) Original 0.15 m Optimised float (3) radius (m) Original 0.2 m 1.0 0.085 0.204 0.085 0.204 N/A N/A N/A N/A 2.0 0.199 0.274 0.253 0.348 0.948 7 0.112 7 0.169 0.225 4 3.0 0.272 0.281 0.352 0.364 0.929 0.127 0.190 0.254 4.0 0.253 0.202 0.455 0.363 0.969 0.145 0.217 5 0.290 5.0 0.217 0.136 0.470 0.294 N/A N/A N/A N/A 6.0 0.197 0.272 0.265 0.366 0.924 0.116 1 0.174 1 0.232 2 7.0 0.453 0.277 0.559 0.342 0.938 0.112 6 0.168 9 0.225 2 Optimisation sea state 6.0 focuses on altering the hinge damping to a value of 6.0 Nms in a sea state of 0.04 m significant wave height and 1.0 second peak period. Enhancement of 34.3% in the mean absorbed power and the CWR is achieved in Figure 15, Table 8 and Table 9. Optimisation sea state 7.0 focuses on altering the significant wave height to a value of 0.06 m at a wave peak period of 1.0 second and a hinge damping value of 4.0 Nms. Enhancement of 23.3% in the mean absorbed power and CWR is achieved in Figure 16, Table 8 and Table 9.
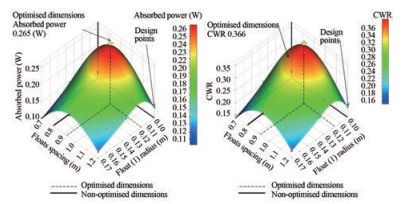 Figure 15 Mean absorbed power and CWR response surfaces, sea state 6.0 (Hs = 0.04 m, Tp = 1.0 s, Bd = 6 Nms)
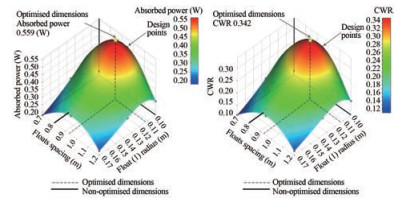 Figure 16 Mean absorbed power and CWR response surfaces, sea state 7.0 (Hs = 0.06 m, Tp = 1.0 s, Bd = 4 Nms)
Investigating the performance, in various sea-states, of one of the optimised devices is presented in Table 10. The selected device is the one corresponding to optimisation sea state 4 (79.5% enhancement in mean absorbed power and CWR) in which, float (1) radius is 0.145 m (F2 and F3 radii are 0.217 5 m and 0.29 m, respectively) and the float spacing is 0.969 m. Good enhancement (ranging from 25.2% up to 99.8%) in the mean absorbed power and CWR of the selected device is achieved for significant wave heights of 0.04 m and 0.06 m and over a range of wave peak periods from 1.1 s to 1.6 s which well covers the whole range of resonance. Over the range of wave peak periods from 0.8 s to 1.0 s, no enhancement was observed. in Table 10.
Table 10 Mean absorbed power and CWR of the device corresponding to sea state 4Sea states Hs (m) Tp(s) Bd (Nms) Optimised dimensions Original dimensions Enhancement in mean absorbed power and CWR (%) Mean absorbed power (W) CWR Mean absorbed power (W) CWR 1.0 0.04 0.8 4.0 0.026 0.071 0.068 0.182 -39.1 2.0 0.04 1.0 4.0 0.191 0.263 0.207 0.285 -92.2 3.0 0.04 1.1 4.0 0.333 0.345 0.266 0.276 25.3 4.0 0.04 1.2 4.0 0.459 0.366 0.262 0.209 75.2 5.0 0.04 1.3 4.0 0.417 0.261 0.209 0.131 99.7 6.0 0.04 1.4 4.0 0.295 0.148 0.154 0.077 91.5 7.0 0.04 1.6 4.0 0.184 0.062 0.095 0.032 93.6 8.0 0.06 0.8 4.0 0.059 0.071 0.152 0.182 -39.1 9.0 0.06 1.0 4.0 0.430 0.263 0.466 0.285 -92.2 10.0 0.06 1.1 4.0 0.750 0.345 0.599 0.276 25.2 11.0 0.06 1.2 4.0 1.034 0.366 0.590 0.209 75.2 12.0 0.06 1.3 4.0 0.937 0.261 0.469 0.131 99.8 13.0 0.06 1.4 4.0 0.665 0.148 0.348 0.077 91.5 14.0 0.06 1.6 4.0 0.413 0.062 0.214 0.032 93.6 6 Discussion
Validation of results of the three floats WEC non-optimised model shows good agreement against numerical and experimental data available in the literature. A set of sequential validations commenced by comparing the device's hydrodynamic coefficients against numerical results available in Eatock Taylor et al. (2016) for the aft float's surge and heave added mass and radiation damping with input data taken from Sun et al. (2017), as shown in Figure 4 and Figure 5.
Results show good matching over the specified range of wave periods from 0.2 s to 3.0 s. Very slight discrepancies between results are noted due to small discrepancies of about 4.7% and 2.4% in the input total mass and vertical centre of gravity, respectively (Sun et al., 2017) and Eatock Taylor et al. (2016).
Validation of the hydrodynamic coefficients is followed by validating the obtained relative pitch rotation against numerical results in Sun et al. (2017) at a regular wave height of 0.02 m and at different hinge damping values of 4, 6 and 8 Nms (see Figure 6, Figure 7 and Figure 8, respectively). Validations confirm that the system has two peak frequencies, approximately at 0.85 Hz and 1.05 Hz, depending on the PTO damping value with a slight shift of about 0.05 Hz in terms of where natural frequencies occur. Discrepancies between results are at their highest over the range from 0.3 Hz to 0.7 Hz. What might appear like a third peak, occurring between 1.3 and 1.4 Hz, is actually attributed to the mesh quality. This peak greatly diminished when the mesh was refined by increasing the number of elements from 2 500 to 11 000. To follow, a mesh convergence study was conducted by increasing the number of elements to approximately 15 500 and 18 400, respectively. This resulted in totally suppressing the pseudothird peak as may be seen in Figure 6, Figure 7 and Figure 8 with the mesh convergence clearly occurring at approximately 15 500 elements. All subsequent validations and optimisations are conducted using this mesh of 15 500 elements. As expected, the effect of hinge damping on responses, away from the peak, frequencies is trivial. In general, discrepancies between obtained results and validation data (Sun et al., 2017) tend to increase as hinge damping increases.
Validations in regular waves are followed by carrying out validations in irregular waves where, the RMS of the relative pitch rotation, the mean absorbed power and, the capture width ratio are all compared against numerical and experiential results in Sun et al. (2017). This is done at a significant wave height Hs of approximately 0.04 m and for various hinge damping values Bd and different wave peak periods Tp ranging from 0.7 s to 1.6 s. (see Figure 11, Figure 12 and Figure 13). A JONSWAP wave spectrum is applied with a spectrum peak factor γ equalling 3.3. Sun et al. (2017) determined various damping coefficients by post processing the damping moment in various regular and irregular wave conditions.
The RMS of the relative pitch rotation shows a difference of about 0.3° around the peak when compared to experimental data, see Figure 11. This discrepancy tends to slightly increase away from the peak response. This may be interpreted in way of the corresponding differences in the RAO of relative pitch rotations in Figure 6. The mean absorbed power shows good matching where, the maximum differences between the obtained numerical results and the numerical and experiential validation data are no more than 0.025 W and 0.01 W, respectively (see Figure 12). The CWR shows good matching too where, the corresponding maximum differences are no more than 0.06 and 0.02, respectively (see Figure 12). These two latter comparisons show a more favourable agreement between obtained results and experimental data as compared to the numerical results of Sun et al. (2017).
Optimisation of the WEC model is performed in various sea-states that have moderate occurrence in various sites and are all modeled as a JONSWAP wave spectrum with a spectrum peak factor γ equalling 3.3. The sea-states are varied by varying two parameters namely; the wave peak period and, the significant wave height. To add to that, a mechanical parameter is varied namely; the WEC's hinge damping. 7 different sea-states are presented in total. For sea-states 1.0 to 5.0, a significant wave height of 0.04 m and a set of wave peak periods ranging from 0.8 to 1.3 seconds are selected, see Table 3. For sea-state 7.0, a significant wave height of 0.06 m and a wave peak period of 1.0 s are selected. Except for sea-state 6.0, all presented sea states adopt a constant hinge damping of 4.0 Nms (see Table 3).
Two design parameters are selected as input parameters for optimisation namely; the floats' diameters and the spacing between floats, as shown in Figure 10. On the other hand, the mean absorbed power and the CWR are selected to be optimised i.e. to be the optimisation output parameters. Three values for each input parameter are selected leading to 9 design points that create the response surface, see Table 4.
The floats' diameters and spacings have logical dimensional limits that do not allow for a wider range of input values since, the combination of the design points may lead to dimensional interference. Despite these constraints, the specified range of inputs demonstrates good response surfaces illustrating low, medium and high mean absorbed power and CWR except for sea-states 1.0 and 5.0, where the respective response surfaces demonstrate no inflection points. These considerations in limits were taken into account during optimisation. Original ratios between the floats' diameters are respected and the optimised spacing between each two floats is always kept equal. The original floats' drafts are all kept unchanged.
For sea-state 2.0, the obtained response surface demonstrates that; the original mean absorbed power of the nonoptimised model was at 0.199 W (equivalent to 176 kW in full scale) where, float (1) radius equals 0.1 m and the spacing equals 0.8 m. By increasing float (1) radius to 0.112 7 m (F2 and F3 radii of 0.169 m and 0.225 4 m, respectively) and increasing the spacing to 0.948 7 m, the mean absorbed power is enhanced to 0.252 8 W (a 27% enhancement equivalent to 223 kW in full scale). The same conclusion applies to the CWR which was originally at 0.274 and increased up to 0.348 by optimisation (a 27% enhancement). See Figure 14(b), Table 8 and Table 9.
For sea-state 3.0, the obtained response surface demonstrates that; the original mean absorbed power of the nonoptimised model was at 0.272 W (equivalent to 240 kW in full scale) where, float (1) radius equals 0.1 m and the spacing equals 0.8 m. By increasing float (1) radius to 0.127 m (F2 and F3 radii of 0.19 m and 0.254 m, respectively) and increasing the spacing to 0.929 m, the mean absorbed power is enhanced to 0.352 W (a 29.3% enhancement equivalent to 311 kW in full scale). The same conclusion applies to the CWR which was originally at 0.281 and increased up to 0.364 by optimisation (a 29.3% enhancement). See Figure 14(c), Table 8 and Table 9.
For sea-state 4.0, the obtained response surface demonstrates that; the original mean absorbed power of the nonoptimised model was at 0.253 W (equivalent to 223 kW in full scale) where, float (1) radius equals 0.1 m and the spacing equals 0.8 m. By increasing float (1) radius to 0.145 m (F2 and F3 radii of 0.217 5 m and 0.29 m, respectively) and increasing the spacing to 0.969 m, the mean absorbed power is enhanced to 0.455 W (a 79.5% enhancement equivalent to 402 kW in full scale). The same conclusion applies to the CWR which was originally at 0.202 and increased up to 0.363 by optimisation (a 79.5% enhancement). See Figure 14(d), Table 8 and Table 9. Of all the investigated sea-states, this sea-state showed the best enhancement ratio of the mean absorbed power and CWR. In return, it required the highest increase in the floats' spacing and diameters (see Table 8).
For sea-state 6.0, the obtained response surface demonstrates that; the original mean absorbed power of the nonoptimised model was at 0.197 W (equivalent to 174 kW in full scale) where, float (1) radius equals 0.1 m and the spacing equals 0.8 m. By increasing float (1) radius to 0.116 1 m (F2 and F3 radii of 0.174 1 m and 0.232 2 m, respectively) and increasing the spacing to 0.924 m, the mean absorbed power is enhanced to 0.265 W (a 34.3% enhancement equivalent to 234 kW in full scale). The same conclusion applies to the CWR which was originally at 0.272 and increased up to 0.366 by optimisation (a 34.3% enhancement), see Figure 15, Table 8 and Table 9. This sea states showed the best enhanced CWR among all investigated sea-states by an absolute value of 0.366 (see Table 9).
For sea-state 7.0, the obtained response surface demonstrates that; the original mean absorbed power of the nonoptimised model was at 0.453 W (equivalent to 400 kW in full scale) where, float (1) radius equals 0.1 m and the spacing equals 0.8 m. By increasing float (1) radius to 0.112 6 m (F2 and F3 radii of 0.168 9 m and 0.225 2 m, respectively) and increasing the spacing to 0.938 m, the mean absorbed power is enhanced to 0.559 W (a 23.3% enhancement equivalent to 494 kW in full scale). The same conclusion applies to the CWR which was originally at 0.277 and increased up to 0.342 by optimisation (a 23.3% enhancement). See Figure 16, Table 8 and Table 9. This sea state showed the maximum enhanced mean absorbed power among all investigated sea-states by an absolute value of 0.559 W, despite that, the enhancement ratio in the mean absorbed power and CWR was the least by only 23.3% (see Table 8).
For sea-states 1.0 and 5.0, the obtained response surfaces demonstrate that no optimum mean absorbed power is determined since no definite inflection of the response surfaces is detected. This goes in line with the logical limits applied to the range of variation of the optimisation input parameters i. e. no optimum mean absorbed power is detected for the input range under consideration.
For the optimised device corresponding to optimisation sea state 4, investigating its performance, in various seastates, revealed that; good enhancements (ranging from 25.2% up to 99.8%) in the mean absorbed power and CWR is achieved for significant wave heights of 0.04 m and 0.06 m and over a range of wave peak periods from 1.1 to 1.6 s. These enhancements well cover the whole range of resonance. Over the range of wave peak periods from 0.8 to 1.0 s, no enhancement is observed.
7 Conclusions
In this paper, the response surface method for optimisation is applied for a three floats multi-body WEC to enhance its mean absorbed power and CWR in various irregular sea-ways. Two input design parameters are selected for optimisation namely; the floats' diameters and the spacing in between the floats with, the specified range of inputs carefully selected to avoid any possible dimensional interference between the floats.
Prior to optimisation, a series of sequential validations of the hydrodynamic performance of the WEC is carried out in regular and irregular sea-ways. These validations form a preamble for all subsequent calculations.
The hydrodynamic coefficients of the aft float surge and heave added mass and radiation damping, in regular waves, are compared against available numerical data in Eatock Taylor et al. (2016). Results show very good matching over the range of defined wave periods.
Relative pitch rotations at the WEC's hinge are compared against results in Sun et al. (2017) with responses calculated in regular waves and for different hinge damping values. Very good matching between results is noticed with validations confirming that the system has two peak frequencies. A pseudo-third peak was suppressed by refining the WEC's mesh. A mesh convergence study followed with convergence occurring at approximately 15 500 mesh elements.
The RMS of the relative pitch rotation, the mean absorbed power and, the capture width ratio of the WEC are all compared against numerical and experiential data in Sun et al. (2017) conducted in irregular waves that is represented by a JONSWAP wave spectrum and for various PTO damping. All comparisons show good matching especially in the vicinity of resonance.
Optimisation results of the WEC under consideration in various irregular sea-states confirm that; a slight variation in the WEC's floats' diameters and spacing may lead to a considerable enhancement in its mean absorbed power and CWR depending on the sea-state under investigation. An enhancement of up to 79.5% was reached. Optimisation results also demonstrate that; enhancement of the WEC's mean absorbed power and CWR is neither biased to variations in the floats' spacing nor to variations in the floats' diameters. This conclusion was possible to be drawn after a careful study and consideration of all the sea-states accounted for in the study.
A thorough investigation into the performance of one of the optimised devices, in various sea-states, revealed enhancements of up to 99.8% in the mean absorbed power and CWR of the selected device. The observed enhancements well cover the whole range of resonance of the device. At low periods, no enhancement was observed.
For future work, an important aspect that might shed more light on the overall performance of the WEC under consideration is the mooring effect. A study of the mooring connection location on the WEC, the mooring arrangement and, the mooring lines pre-tension would enrich the current study. Mooring has a certain degree of effect on pitch motions and pitch natural periods depending on the stated parameters (Cerveira et al., 2013; Depalo et al., 2021; Thomsen et al., 2017). Nevertheless, numerical simulations performed in Sun et al. (2017) and used as a basis for the current optimisation study were all conducted in unmoored conditions.
It is worth mentioning that all optimisations conducted in this study are independent of the cost per kWh as a measure-of-evaluation for the performance of the WEC under consideration. Taking this aspect into consideration might help shed even more light on the overall performance of the WEC and will be taken onboard any future investigation.
-
Figure 1 WEC general configuration and working principal
Figure 2 Calculations flow chart
Figure 3 WEC non-optimised dimensons
Figure 4 Float (3) surge and heave added mass
Figure 5 Float (3) surge and heave radiation damping
Figure 6 RAO of relative pitch rotation at 4 Nms hinge damping
Figure 7 RAO of relative pitch rotation at 6 Nms hinge damping
Figure 8 RAO of relative pitch rotation at 8 Nms hinge damping
Figure 9 Float (3) refined mesh (approximately 15 500 elements for all three floats) up to the still water line
Figure 10 Optimisation input parameters
Figure 11 RMS of relative pitch rotation for Hs ≈0.04 m
Figure 12 Mean absorbed power for Hs ≈0.04 m
Figure 13 CWR for Hs ≈0.04 m
Figure 14 Mean absorbed power and CWR response surfaces
Figure 15 Mean absorbed power and CWR response surfaces, sea state 6.0 (Hs = 0.04 m, Tp = 1.0 s, Bd = 6 Nms)
Figure 16 Mean absorbed power and CWR response surfaces, sea state 7.0 (Hs = 0.06 m, Tp = 1.0 s, Bd = 4 Nms)
Table 1 Mass and inertia of the non-optimised model about CoG
Items Float (1) Float (2) Float (3) Beam (1) Beam (2) Mass (kg) 2.0 7.866 23.39 0.207 0.559 XCoG (m) 0.8 0 -0.8 0.5 -0.5 YCoG (m) 0 0 0 0 0 ZCoG (m) 0.015 -0.098 -0.128 0.116 0.21 Ixx (kg·m2) 0.044 0.199 0.561 0.001 0.021 Iyy (kg·m2) 0.044 0.19 0.552 0.017 0.047 Izz (kg·m2) 0.02 0.124 0.641 0.018 0.068 Table 2 Hs and Bd in irregular waves
Tp (s) Hs ≈ 0.04 m, γ = 3.3 Hs (m) Bd (Nms) 0.6 – – 0.7 0.031 8.76 0.8 0.034 7.71 0.9 0.033 6.65 1.0 0.033 5.9 1.1 0.031 5.73 1.2 0.033 5.2 1.3 0.033 5.42 1.4 0.033 6.22 1.5 0.034 6.69 1.6 0.034 7.15 Table 3 Optimisation sea states and hinge dampings
Optimisation sea states Hs (m) Tp (s) Bd (Nms) 1.0 0.04 0.8 4.0 2.0 0.04 1.0 4.0 3.0 0.04 1.1 4.0 4.0 0.04 1.2 4.0 5.0 0.04 1.3 4.0 6.0 0.04 1.0 6.0 7.0 0.06 1.0 4.0 Table 4 Optimisation design points
DP Float (1) radius (m) Floats spacing (m) 1 0.1 0.7 2 0.1 0.95 3 0.1 1.2 4 0.135 0.7 5 0.135 0.95 6 0.135 1.2 7 0.17 0.7 8 0.17 0.95 9 0.17 1.2 Table 5 Beams dependant parameters
DP XCoG (m) B1 B2 1 0.437 5 -0.437 5 2 0.593 75 -0.593 75 3 0.75 -0.75 4 0.437 5 -0.437 5 5 0.593 75 -0.593 75 6 0.75 -0.75 7 0.437 5 -0.437 5 8 0.593 75 -0.593 75 9 0.75 -0.75 Table 6 Floats dependant parameters (mass & CoG)
DP Mass (kg) XCoG (m) F1 F2 F3 F1 F2 F3 1 2.25 8.69 24.45 0.7 0 -0.7 2 2.25 8.69 24.45 0.95 0 -0.95 3 2.25 8.69 24.45 1.2 0 -1.2 4 4.11 20.47 46.63 0.7 0 -0.7 5 4.11 20.47 46.63 0.95 0 -0.95 6 4.11 20.47 46.63 1.2 0 -1.2 7 6.51 39.78 76.08 0.7 0 -0.7 8 6.51 39.78 76.08 0.95 0 -0.95 9 6.51 39.78 76.08 1.2 0 -1.2 Table 7 Floats second moments of inertia
DP F1 F2 F3 Ixx Iyy Izz Ixx Iyy Izz Ixx Iyy Izz 1 0.049 0.049 0.022 0.219 0.210 0.137 0.586 0.576 0.669 2 0.049 0.049 0.022 0.219 0.210 0.137 0.586 0.576 0.669 3 0.049 0.049 0.022 0.219 0.210 0.137 0.586 0.576 0.669 4 0.090 0.090 0.041 0.517 0.494 0.322 1.118 1.100 1.277 5 0.090 0.090 0.041 0.517 0.494 0.322 1.118 1.100 1.277 6 0.090 0.090 0.041 0.517 0.494 0.322 1.118 1.100 1.277 7 0.14 0.14 0.065 1.00 0.96 0.62 1.82 1.79 2.08 8 0.14 0.14 0.065 1.00 0.96 0.62 1.82 1.79 2.08 9 0.14 0.14 0.065 1.00 0.96 0.62 1.82 1.79 2.08 Table 8 Optimisation sea states summary results
Optimisation sea states Hs (m) Tp (s) Bd (Nms) Enhancement in mean absorbed power and CWR (%) Increase in floats' spacing (%) Increase in floats' radii (%) 1.0 0.04 0.8 4 N/A N/A N/A 2.0 0.04 1 4 27 18.5 12.7 3.0 0.04 1.1 4 29.3 16.13 26.91 4.0 0.04 1.2 4 79.5 21.1 45.3 5.0 0.04 1.3 4 N/A N/A N/A 6.0 0.04 1 6 34.3 15.49 16.12 7.0 0.06 1 4 23.3 17.2 12.6 Table 9 Optimised mean absorbed power, CWR, and WEC dimensions
Optimisation sea states Original mean absorbed power (W) Original CWR Maximum mean absorbed power (W) Maximum CWR Optimised floats' spacing (m) Original 0.8 m Optimised float (1) radius (m) Original 0.1 m Optimised float (2) radius (m) Original 0.15 m Optimised float (3) radius (m) Original 0.2 m 1.0 0.085 0.204 0.085 0.204 N/A N/A N/A N/A 2.0 0.199 0.274 0.253 0.348 0.948 7 0.112 7 0.169 0.225 4 3.0 0.272 0.281 0.352 0.364 0.929 0.127 0.190 0.254 4.0 0.253 0.202 0.455 0.363 0.969 0.145 0.217 5 0.290 5.0 0.217 0.136 0.470 0.294 N/A N/A N/A N/A 6.0 0.197 0.272 0.265 0.366 0.924 0.116 1 0.174 1 0.232 2 7.0 0.453 0.277 0.559 0.342 0.938 0.112 6 0.168 9 0.225 2 Table 10 Mean absorbed power and CWR of the device corresponding to sea state 4
Sea states Hs (m) Tp(s) Bd (Nms) Optimised dimensions Original dimensions Enhancement in mean absorbed power and CWR (%) Mean absorbed power (W) CWR Mean absorbed power (W) CWR 1.0 0.04 0.8 4.0 0.026 0.071 0.068 0.182 -39.1 2.0 0.04 1.0 4.0 0.191 0.263 0.207 0.285 -92.2 3.0 0.04 1.1 4.0 0.333 0.345 0.266 0.276 25.3 4.0 0.04 1.2 4.0 0.459 0.366 0.262 0.209 75.2 5.0 0.04 1.3 4.0 0.417 0.261 0.209 0.131 99.7 6.0 0.04 1.4 4.0 0.295 0.148 0.154 0.077 91.5 7.0 0.04 1.6 4.0 0.184 0.062 0.095 0.032 93.6 8.0 0.06 0.8 4.0 0.059 0.071 0.152 0.182 -39.1 9.0 0.06 1.0 4.0 0.430 0.263 0.466 0.285 -92.2 10.0 0.06 1.1 4.0 0.750 0.345 0.599 0.276 25.2 11.0 0.06 1.2 4.0 1.034 0.366 0.590 0.209 75.2 12.0 0.06 1.3 4.0 0.937 0.261 0.469 0.131 99.8 13.0 0.06 1.4 4.0 0.665 0.148 0.348 0.077 91.5 14.0 0.06 1.6 4.0 0.413 0.062 0.214 0.032 93.6 -
Aderinto T, Li H (2018) Ocean wave energy converters: Status and challenges. Energies 11: 1250. https://doi.org/10.3390/en11051250 ANSYS Inc. (2018) AQWA theory manual Release 19.0. ANSYS Inc. Babarit A (2010) Impact of long separating distances on the energy production of two interacting wave energy converters. Ocean Engineering 37(8–9): 718–729. https://doi.org/10.1016/j.oceaneng.2010.02.002 Bhattacharyya R (1978) Dynamics of marine vehicles. Wiley, New York: 132–133 Cerveira F, Fonseca N, Pascoal R (2013) Mooring system influence on the efficiency of wave energy converters. International Journal of Marine Energy 3–4: 65–81. https://doi.org/10.1016/j.ijome.2013.11.006 Chandrasekaran S, Sricharan V (2020) Numerical analysis of a new multi-body floating wave energy converter with a linear power take-off system. Renewable Energy 159: 250–271. https://doi.org/10.1016/j.renene.2020.06.007 Chandrasekaran S, Sricharan V (2021) Numerical study of bean-float wave energy converter with float number parametrization using WEC-Sim in regular waves with the Levelized Cost of Electricity assessment for Indian Sea states. Ocean Engineering 237: 109591. https://doi.org/10.1016/j.oceaneng.2021.109591 Chandrasekaran S, Khan F, Abbassi R (2022) Wave energy devices: Design, development, and experimental studies. 1st ed., CRC Press, Boca Raton. https://doi.org/10.1201/9781003281429 Depalo F, Wang S, Xu S, Guedes Soares C (2021) Design and analysis of a mooring system for a wave energy converter. J. Mar. Sci. Eng. 9: 782. https://doi.org/10.3390/jmse9070782 Eatock Taylor R, Taylor PH, Stansby PK (2016) A coupled hydrodynamic-structural model of the M4 wave energy converter. Journal of Fluids and Structures 63: 77–96. https://doi.org/10.1016/j.jfluidstructs.2016.02.009 Falnes J (2002) Ocean waves and oscillating systems. Cambridge University Press, Cambridge. https://doi.org/10.1017/CBO9780511754630 Gaspar JF, Stansby PK, Calvario M, Guedes Soares C (2021) Hydraulic power take-off concept for the M4 wave energy converter. Applied Ocean Research 106: 102462. https://doi.org/10.1016/j.apor.2020.102462 Guedes Soares C, Bhattacharjee J, Tello M, Pietra L (2012) Review and classification of wave energy converters. In Maritime Engineering and Technology, Taylor & Francis, London, 10 Henderson R (2006) Design, simulation, and testing of a novel hydraulic power take-off system for the Pelamis wave energy converter. Renewable Energy 31: 271–283. https://doi.org/10.1016/j.renene.2005.08.021 Kraemer D (2001) The motions of hinged-barge systems in regular seas. PhD thesis, Johns Hopkins University, Baltimore McCormick M, Murthagh J, McCabe P (1998) Large-scale experimental study of a hinged-barge wave energy conversion system. Patras, 215–222 Mei CC, Stiassnie MA, Yue DK (2005) Theory and applications of ocean surface waves. World Scientific, Singapore. https://doi.org/10.1142/5566 Newman JN (1979) Absorption of wave energy by elongated bodies. Applied Ocean Research 1(4): 189–196. https://doi.org/10.1016/0141-1187(79)90026-9 Pecher A, Kofoed JP (2016) Handbook of ocean wave energy. Springer Nature Pizer D (1993) Numerical prediction of the performance of a solo duck. EWEC1, Edinburgh Pizer D (1995) Numerical modelling of wave energy absorbers. ETSU V/03/00172/REP Stansby P, Moreno EC, Stallard T, Maggi A (2015a) A three float broad-band resonant line absorber with surge for wave energy conversion. Renewable Energy 78: 132–140. https://doi.org/10.1016/j.renene.2014.12.057 Stansby P, Moreno EC, Stallard T (2015b) Capture width of the three-float multi-mode multi-resonance broadband wave energy line absorber M4 from laboratory studies with irregular waves of different spectral shape and directional spread. J. Ocean Eng. Mar. Energy 1: 287–298. https://doi.org/10.1007/s40722-015-0022-6 Stansby P, Moreno EC, Stallard T (2017) Large capacity multi-float configurations for the wave energyconverter M4 using a time-domain linear diffraction model. Applied Ocean Research 68: 53–64. https://doi.org/10.1016/j.apor.2017.07.018 Sun L, Stansby P, Zang J, Moreno E, Taylor P (2016) Linear diffraction analysis for optimisation of the three-float multi-mode wave energy converter M4 in regular waves including small arrays. J. Ocean Eng. Mar. Energy 2: 429–438. https://doi.org/10.1007/s40722-016-0071-5 Sun L, Zang J, Stansby P, Moreno EC, Taylor PH, Taylor RE (2017) Linear diffraction analysis of the three-float multi-mode wave energy converter M4 for power capture and structural analysis in irregular waves with experimental validation. J. Ocean Eng. Mar. Energy 3: 51–68. https://doi.org/10.1007/s40722-016-0059-1 Thomsen JB, Ferri F, Kofoed JP (2017) Screening of available tools for dynamic mooring analysis of wave energy converters. Energies 10: 853. https://doi.org/10.3390/en10070853 Yemm RW, Henderson R, Taylor C (2000) The OPD Pelamis WEC: Current status and onward programme. Proc. 4th European Wave Energy Conference, Aalborg, Denmark