A Concept for Safe and Less Expensive Acceleration of a Marine Steam Turbine Start-up
https://doi.org/10.1007/s11804-023-00337-7
-
Abstract
This paper analyses the issue of accelerated start-up of a marine steam turbine, which is an important problem because the start-up of a steam machine involves the combustion of fuel that is not transformed into useful energy. To find novel technologies that offer improvements in this aspect is essential due to restrictions on reducing ship emissions. Thus, the shorter the start-up time, the better for the environment and economy. High-pressure (HP) part of the turbine originally located on the Queen Elizabeth Ⅱ unit was analysed. Advanced numerical calculations by thermal fluid-solid-interaction (Thermal FSI) were carried out. A series of simulations were performed for the accelerated start-up with controlled steam injection. A description of the chosen calculation methodology and the results obtained by simulation are included in this paper. The stress occurring during the accelerated start-up are approximately 40 MPa higher than those during the reference start-up. The relative elongations between the rotor and the hull during accelerated start-up reach a maximum value of 0.89 mm (0.83 mm for ultra-fast start-up). Reducing the steam turbine start-up time by 75% results in a 36.7 tons reduction in fuel consumption for start-up, resulting in an annual savings of 5 372 USD. In conclusion, the concept proposed by the authors is safe, less expensive and does not affect the life of the turbine. In addition, results and applications from Siemens prove that additional injection of cooling steam is possible.Article HighlightsThe ultra-fast start-up with cooling steam injection guarantees opera‐ tional safety;The ultra-fast start-up can reduce the fuel consumption up to 5 372 USD per one start-up;The maximum stress during the ultra-fast start-up with cooling steam injection takes the value of 350 MPa;The highest relative elongation value reaches 0.89 mm for the ultra-fast start-up with cooling steam injection (1.75 mm without cooling). -
1 Introduction
Tightening environmental regulations limit the fuel sulphur content and pollutant emissions. It will lead to much harder restrictions on the fuel sulphur content raising the price of HFO even more (Haglind, 2008a).
In order to lower the environmental and human health impacts of shipping, and conform to current and future regulations regarding fuel quality and pollutant emissions, finding novel technologies that offer improvements in these aspects is essential (Haglind, 2008b). One of option is slow-steaming, which reduces fuel consumption and CO2 emissions by 20% – 30%, and up to 60% at the extreme (Balcombe et al., 2019). Armellini et al., (2019) states that for a large cruise ship, the choice to employ Gas Turbines as prime movers in hybrid engine configurations, as well as to improve the ship waste heat recovery capability through trigeneration can be of interest. Another of the possibility is a combined cycle, i.e., combined gas turbine and steam turbine (COGAS), and combined gas turbine electric and steam (COGES). Regarding the use of combined cycle power plants on ships, turbines can be in either COGAS or COGES configuration (Haglind, 2008c). Dotto et al., (2021) confirmed the potential of COGES for marine propulsion system for a cruise ship and Fredrik Haglind (2008) recalls the following information:
- Mainly for its simplicity and quicker response to load changes, the once-through Heat Recovery Steam Generator (HRSG) is preferable.
- HRSG of drum-type with natural circulation, can meet all transient and quick start requirements.
- For moderate live steam pressures, a vertical HRSG of drum-type mounted directly over the gas turbine, is suggested to be a viable configuration that minimizes ground floor and space requirements.
- The HRSGs of drum-type with forced circulation are universally used for COGAS plants. Since the pump head pressure and drum pressure are relatively low, no problems are expected from the forced-circulation feature.
- The use of a combined cycle power plant would provide large savings in fuel, ship size and construction, maintenance, and operating costs compared with gas turbine propulsion.
- It is possible to reduce the fuel consumption of naval gas turbine-power ships by about 33% by introducing a COGAS plant, at the price of additional space and weight requirement of the system.
- It is possible to reach a thermal efficiency of 41% of a COGAS marine system, which offers low fuel rate, flexibility and simplicity, and minimum environmental impact.
- At full load the COGAS configuration offers higher efficiency as the transmission efficiency is higher.
- With a COGES configuration it is easier to achieve reasonable part-load performance, because one or several power units can be shut off as the power is reduced while the remaining power units are operated at power conditions where they are efficient.
- By using a more efficient propulsion system, the ship cruising range can be extended, or the required fuel capacity (for the same range) can be reduced.
According to papers (Haglind, 2008a, b and c) combined cycles have rarely been used in the past for marine applications, but following the expected legislative actions, increasing environmental awareness and the increasing price of heavy fuel oil, it might be a viable option for the future.
According to Domachowski and Dzida (Domachowski et al., 2004), gas turbine systems have many technical advantages over the diesel system; however, slow-speed diesel engines are superior in terms of specific fuel oil consumption cost.
Although the sea is dominated by ships with diesel or heavy fuel oil engines, we cannot ignore the large number of vessls whose engines are steam generators and steam turbines. For the future, Domachowski and Dzida believe that the situation may change. They concluded that the provided regulations prohibit the use of fuels with high sulphur content, and gas turbine-based systems will become comparable in terms of specific oil consumption cost.
Therefore, it is reasonable to assume that steam turbines, in combination with gas turbines, will play a bigger role in the future. Currently, the steam turbines are the traditional propulsion system of LNG carriers. Usually, two boilers generate sufficient steam for the main propulsion turbines and auxiliary engines (World LNG report 2021). The global LNG fleet consisted of 572 active LNG vessels at the end of 2020, including 37 floating storage and regasification units (FSRUs) and four floating storage units (FSUs). Additionally, there are 130 LNG vessels under construction at end 2020. The global fleet grew by 7% with the delivery of 35 vessels, two of which are FSRUs. Table 1 shows some of marine steam turbine applications.
Table 1 Some of Marine Steam Turbine application (Sinan and Ust, 2011)Name Type Power (kW) US Enterprise War Ship 210 000 Knock Nevis Tanker 38 000 Simaisma Tanker 28 000 InigoTapias Tanker 28 000 Energy Frontier Gas Carrier 26 900 Disha Gas Carrier 26 500 Excalibur Gas Carrier 26 500 Excel Gas Carrier 26 500 Radiance of the Seas Cruise Ship 59 000 Brilliance of the Seas Cruise Ship 59 000 Queen Elisabeth Ⅱ Cruise Ship 80 900 Millenium Ship Cruise Ship 590 000 Seri Camellia LNG Tanker 23 910 Seri Cenderawasih LNG Tanker 23 910 In 2015 an improvement on the steam turbine was introduced, involving reheating of the steam in-cycle in order to improve efficiency by more than 30%. Aptly named the Steam Reheat system (or Ultra Steam Turbine), there are 12 active vessels with the propulsion in place but zero newbuilds due (World LNG report, 2021). The idea of UST is described by Ito M (Ito, 2007)
Going further, emissions can be further reduced by accelerating the start-up of the steam turbine. It is known that during start-up energy is not converted into another type of useful energy (electrical, mechanical, etc.). The start-up time is treated as energy loss to the environment in the form of heat energy (Badur and Bryk, 2019).
The following methods are described in the literature as possibilities of steam – turbine accelerated start-up:
- elastic-plastic material adaptation (Badur et al., 2016),
- cooling of turbine components by means of cooling steam injection (Badur et al., 2019; Kosman and Rusin, 2001; Kosman et al., 2010; Inomata et al., 2014), and
- optimization of start-up curves (Ji et al., 2018; Ji et al., 2017).
In this paper, the authors focused on the second mentioned method. Previous work has shown the possibility of accelerating the start-up of a land-based steam turbine from a warm state from 3 h to 2 h (Badur and Bryk, 2019).
The previous work dealt with a 380 MW land-based steam turbine. Compared to a marine steam turbine, there are design differences here, the effects of which on temperature gradients and stresses will be negligible. Due to the adaptability of the solution on the land turbine, an attempt has been made to adapt the solution on the marine turbine. The design of a 41 MW marine steam turbine differs from that of a 380 MW land-based turbine. For this reason, an attempt was made to determine the feasibility of adapting a marine steam turbine for accelerated start-up with cooling steam injection. What is novel is that an analysis has been carried out for a new geometry with extremely different start-up curves, displacement analysis and fuel savings resulting from accelerated start-up.
The proposed solution is not found in the literature. Francesco Casella's team described fast start-up of a Combined-Cycle Power Plant by means of start-up process optimization (Casella and Pretolani, 2006). Siping Zhu's team presented steam injected turbocompounding system applied on the marine two-stroke diesel engine (Zhu et al., 2020).
The work was divided into the following sections:
• The problems of marine steam turbine start-up, where the issues related to marine steam turbine start-up are introduced. Geometry of the analyzed ship turbine, where the geometry under consideration is described.
• Finite element method (FEM) discretization, treating of the applied method of discretization and performance of grid independence mathematical model, where computational fluid dynamics (CFD) and computational solid dynamics (CSD) models used in the analyses are described.
• Thermal FSI tools, treating about this calculation tool.
• Boundary and initial conditions, in which the parameters and constants used in the analyses are described.
• CFD results, the results of flow analyses are presented.
• CSD results, the results of strength analyses are presented.
• Differential expansion between rotor and casing, in which displacement analyses of axial clearances were performed.
• Fuel savings, fuel savings from reduced start-up time are described.
• Conclusion, discussion on the results obtained and conclusions.
2 The problems of marine steam turbine start-up
Turning to the very issue of turbine start-up, it can be stated that the start of a ship turbine is not fundamentally different from the start of a land-based unit. The start-up time is very much dependent on whether engine parts are cold or warm before start-up, especially for the combined cycles. In practice, diesel engines used for ship propulsion are not allowed to become cold (i.e., equal to the ambient temperature).
Different types of turbines (impulse, reaction, etc.) may require slightly different treatment during start-up, but the basic starting principles are the same for each type of steam turbine, i.e.:
-lubrication must be provided;
-the turbine must be warmed up properly;
-turbine drainages should be open during the heating process;
-the steam boiler must be in good condition and free from water pollution;
-the ship bolt must be ready for operation;
-the cooling water circulation in the condenser must be switched on (Marine Engineering Practice Vol1).
The first issue of the heating procedure is to achieve a balanced rotor temperature. This depends on the small temperature gradient along the rotor shaft, i.e., the rotor temperature cannot be higher in the top layers than in the deeper layers. If hot steam is applied to a turbine whose shaft does not rotate, the shaft can bend upwards (the so-called cat's back). This will be a natural situation due to the convection that occurs in the rotor. For this reason the rotor must be rotated during the heating in order to ensure equal temperature in the entire volume of the rotor (Banaszkiewicz 2015).
Another issue is to avoid distortion of the hulls as much as possible. Again, in this case, the rotor rotation causes the steam to mix properly, which leads to an even temperature distribution from top to bottom (Badur et al., 2019; Banaszkiewicz 2015).
The third condition is to minimize the stress caused by the temperature gradient along the thick-walled sectors of the turbine construction. In the case of a thick-walled cylinder, if the temperature inside is higher than the temperature outside, compressive stress occurs inside the geometry and tensile stress occurs outside. The higher the temperature gradient, the higher the values of the abovementioned stress. The same phenomenon applies to thick and wide flanges in the horizontal position of the bolted connection (Banaszkiewicz 2015). The heat flow from the steam to the hull to the screw hole of the flange connection is the highest when the steam condenses on the surface. The temperature at which the condensation occurs is determined by the local pressure. The local pressure is determined by the mass flow of steam (Badur et al., 2019; Banaszkiewicz 2015). During the first release of steam for heating, the pressure inside the hull assumes the value of atmospheric pressure and the temperature cannot rise above 100 ℃ until the pressure rises above atmospheric pressure. In other words, to the time when the steam flow rate is increased.
It should be noted that during the start-up of the turbine, the power is not transferred to the drive, therefore, this process should be strictly associated with losses. The chemical energy contained in the fuel is not converted into useful work (Badur and Bryk, 2019; Banaszkiewicz 2015). In addition, when the unit is in port, the rotor should be rotated every day by means of a turning machine at a speed of about half the rotation of the main shaft. The oil shall flow through the bearings at the same time.
Noteworthy items concerning the study of the above-mentioned phenomena are works by Głuch et al., (2021) and Dominiczak et al., (2020), in which the diagnostics of steam turbines is described in detail. It can be seen that turbine start-up is a complicated process, during which one should be careful of a number of phenomena that translate into the operation of turbine elements.
Current trends are characterised by a decrease in the sensitivity of generation/propulsion units to rapid changes in load. Examples are presented in the literature (Badur et al., 2019; Kowalczyk et al., 2019; Ziółkowski et al., 2019). The general trend leads to a reduction in emissions of environmentally harmful substances and an increase in the flexibility of unit operation. It is known that in case of ship engine room, there is no point in using energy systems too complicated because of the place available in the engine room. Therefore, the method of rapid power change of a marine steam turbine was presented by the authors.
In view of the above, in order to shorten the start-up of a ship's turbine, shorten the time of turbine start by controlling the injection of cooling steam into the main steam stream was proposed. Additional benefits associated with the shortening of start-up time are economic and ecological benefits resulting from the reduction of fuel consumption during start-up, because the process will be shorter.
In total, starting up a combined cycle in the range of 50– 400 MW after 8 h standstill (i.e., components are still hot) takes about 40 – 50 min (Kehlhofer et al., 1999). A warm start (60 h standstill) is expected to take 75–110 min, while a cold start (120 h standstill) is expected to take 75–150 min. Since a combined cycle to be applied as the marine main engine is in the lower power range, the start-up times are also expected to be in the lower range. Thus, provided parts within the steam cycle are warm, the start-up times of diesel engines and combined cycles are similar.
3 Geometry of the analysed ship turbine
As mentioned above, the HP part of the turbine from the Queen Elizabeth 2 ship was taken as the geometry to be analysed. The longitudinal section is shown in Figure 1. The turbine power is 41 000 kW.
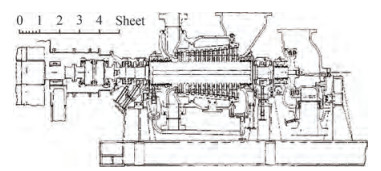 Figure 1 Longitudinal cross-section of the HP turbine part of the ship Queen Elizabeth Ⅱ (Marine Engineering Practice Vol1)
A two-dimensional model of the geometry analyzed by Thermal-FSI (Badur et al., 2019; Bryk et al., 2019; Ziółkowski et al., 2021) was prepared on the basis of the graphics. As simulations were performed with and without cooling steam injection, two geometries had to be created. The first one, hereinafter referred to as the reference, is shown in Figure 2. The second one is the geometry with the modified part of the inner hull, where an additional cooling steam is supplied. The second geometry was showed in Figure 3.
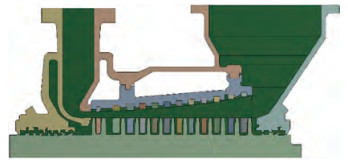 Figure 2 Reference geometry
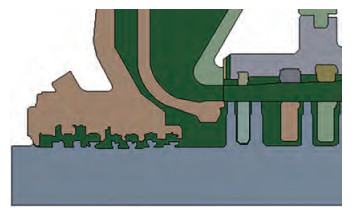 Figure 3 Modified geometry
The domain of liquid (steam) was marked in green. Due to the fact that there is in the turbine the drop in temperature, and what is connected with it the drop in enthalpy, a code (User Defined Function) (Ziółkowski et al., 2021) has been written. The drop in temperature in the turbine was correctly simulated thanks to the code. Comparing the geometry from Figure 1 to the created 2D model, it is noted that a number of simplifications were applied to speed up numerical calculations of both the fluid and the solid domain. The profiles of stages were omitted due to the difficulties that would occur in the following cases in a two-dimensional flow. No welded or bolted connections between hull parts were created. However, for the purposes of the analysis to be carried out, geometry is reproduced to a sufficiently good level of reality.
3.1 FEM discretization
The mesh independence was verified by comparing the temperature at path P1, which is shown in Figure 4. The reason that the average temperature at the path is selected for mesh independence check is that its value affects the allowable stress when evaluating the stress of the shaft. Meanwhile, the path is selected due to its thin wall thickness and large temperature gradient along the path. Four different meshes with numbers [250 000 (coarse), 400 000 (medium), 600 000 (upper medium) and 850 000 (fine)] were generated. The mean temperature at selected locations calculated with different grids was shown. Table 2 consists the values in Path P1 for the meshes under consideration.
 Figure 4 P1 PathTable 2 Temperature in Path P1 for different mesh densities
l (m) Grid 1 (oC) Grid 2 (oC) Grid 3 (oC) Grid 4 (oC) 1.37 360.1 359.2 357.9 358.2 1.35 334.2 328.1 330.9 331.1 1.34 309.0 303.2 306.9 307.3 1.33 288.3 282.5 285.9 286.4 1.32 270.1 268.2 268.9 269.6 1.30 255.4 253.1 253.9 255.1 1.29 240.1 241.2 241.9 242.5 1.28 231.2 232.3 232.9 234.2 1.27 223.5 224.9 225.9 226.1 1.25 220.2 221.0 221.9 222.0 1.24 219.7 219.2 219.9 219.9 Taking into consideration the calculation time and rela‐ tively small differences between the temperature values, Grid3 was regarded as a mesh independent solution (Figure 4). The fluid domain contained 420 000 elements. The solid domain contained 600 000 elements. The grid of both liquid and solid is shown in Figure 4. More information about FEM can be found in the literature (Madejski et al., 2016).
In both cases, the fluid domain was discredited using the method of square elements together with the wall layer. Moving to the domain of the solid body it was discredited by the finite element method.
The discredited reference geometry is shown in Figure 6. Due to the almost identical grid generated by the modified geometry, it was decided not to duplicate the drawings.
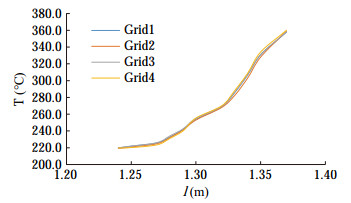 Figure 5 Mean temperature at selected locations in Path P1
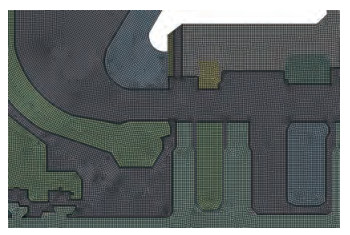 Figure 6 Discretized geometry of the turbine additional inlet
3.2 Mathematical model
For the fluid flow simulation, three basic formulas of conservation must have been fulfilled. These three main formulations that describe CFD were presented below (Badur et al., 2019; Bryk et al., 2019):
Conservation of mass equation:
$$ {\partial _{\rm{t}}}(\rho ) + {\mathop{\rm div}\nolimits} (\rho \mathit{\boldsymbol{v}}) = 0 $$ (1) Conservation of momentum equation:
$$ \partial_{\mathrm{t}}(\rho \boldsymbol{v})+\operatorname{div}(\rho \boldsymbol{v} \otimes \boldsymbol{v}+p \boldsymbol{I})=\operatorname{div}\left(\boldsymbol{\tau}^{\mathrm{c}}\right)+\rho \boldsymbol{b} $$ (2) Conservation of energy equation:
$$ \begin{gathered} \partial_t(\rho e)+\operatorname{div}\left[\left(e+\frac{P}{\rho}\right) \rho \boldsymbol{v}\right]= \\ \operatorname{div}\left(\boldsymbol{q}+\boldsymbol{q}^{\mathrm{t}}+\boldsymbol{\tau}^{\mathrm{c}} \boldsymbol{v}++\boldsymbol{q}^{\mathrm{D}}\right)+\rho \boldsymbol{b} \cdot \boldsymbol{v} \end{gathered} $$ (3) These are balanced equations in the conservative form, where: ρ is the gas density, [kg/m3]; τc = τ + R + D is the total tensor of irreversible stress, [Pa] that consist molecular, turbulent and diffusive parts; v = viei is the mean velocity, m/s; q is the molecular heat flux, W/m2, qt is the turbulent heat flux, W/m2; qD is the diffusive heat flux, W/m2; p is the pressure, Pa; e=u+$\frac{1}{2} $v∙v− is the specific total energy, J/kg; b = -9, 81ez m/s2.
Additionally, the above set of three governing equations, i.e., (1–3), were complemented by two evolution equations for parameters, which allow defining of turbulent tensor R components (Badur 2005). The first is the evolution equation concerning turbulent energy k:
$$ \partial_t(\rho k)+\operatorname{div}(\rho k \boldsymbol{v})=\operatorname{div}\left(\boldsymbol{J}_k\right)+S_k $$ (4) and the second one is the evolution equation concerning energy dissipation ε:
$$ \partial_t(\rho \varepsilon)+\operatorname{div}(\rho \varepsilon \boldsymbol{v})=\operatorname{div}\left(\boldsymbol{J}_{\varepsilon}\right)+S_{\varepsilon} $$ (5) A more detailed description of the used models in CFD codes can also be found in (Badur, 2005). The pressure of the liquid walls was omitted as a pressure that causes negligible stress in walls. Because of that, the equation of momentum conservation was not important due to mechanical reasons but only due to thermal reasons, as the equation describes heat convection and movement of the hot fluid, which flows through the flow channel. For that reason, the viscous and turbulent stress influence is negligible. The assumption of gravity in the element of mass force: ρ (x, t)b was more important or a precise equation of water state (in simulations with water vapour) which gives actual water density in each point and in each moment: ρ (x, t).
To a solve solid stated problem, basic equations used in CSD simulations and equations governing species transport were used (Badur 2005). Note that a common form of CFD and CSD is required since, during a numerical simulation, there are a need for simultaneous calculations and numer‐ ous exchanging of fluid and resulting solid data. Therefore, speaking on CSD, one must start from the following "con‐ servation form" of CSD (Badur and Bryk, 2019):
$$ \frac{\partial}{\partial \mathrm{t}}\left\{\begin{array}{c} \rho \\ \rho \boldsymbol{v} \\ \rho e \\ \rho \boldsymbol{e}^{\mathrm{pl}} \\ \rho \boldsymbol{\alpha} \\ \rho r \end{array}\right\}+\operatorname{div}\left\{\begin{array}{c} \rho \boldsymbol{v} \\ \rho \boldsymbol{v} \otimes \boldsymbol{v} \\ \rho e \boldsymbol{v} \\ \rho \boldsymbol{e}^{\mathrm{pl}} \otimes \boldsymbol{v} \\ \rho \boldsymbol{\alpha} \otimes \boldsymbol{v} \\ \rho r \boldsymbol{v} \end{array}\right\}=\operatorname{div}\left\{\begin{array}{c} 0 \\ \boldsymbol{\sigma} \\ \boldsymbol{\sigma} \boldsymbol{v}+\boldsymbol{q}^{\mathrm{c}} \\ 0 \\ 0 \\ \boldsymbol{J}_{\mathrm{r}} \end{array}\right\}+\left\{\begin{array}{c} 0 \\ \rho \boldsymbol{b} \\ \rho S_{\mathrm{e}} \\ \rho \boldsymbol{S}_{\mathrm{pl}} \\ \rho \boldsymbol{S}_\alpha \\ \rho S_{\mathrm{r}} \end{array}\right\} $$ (6) where: ρ = ρ (x, t) is the density depends, in general, on-time t and location x, v = viei- velocity, ei is the unit direction vector, $\boldsymbol{\sigma}=\sigma_{\mathrm{ij}} \boldsymbol{e}_{\mathrm{i}} \otimes \boldsymbol{e}_{\mathrm{j}} $ is the thermodynamic stress tensor, $ \boldsymbol{I}=\delta_{\mathrm{ij}} \boldsymbol{e}_{\mathrm{i}} \otimes \boldsymbol{e}_{\mathrm{j}}$ is the unit tensor, δij is Kronecker's delta, b is the mass force of gravity, $e=u+\frac{1}{2} \boldsymbol{v}^2 $ is the sum of internal and kinetic energy, and qc = q + qT is the total heat flux (which contains molecular heat flux and turbulent heat flux, respectively). Next εpl is plastic deformation tensor, α is the beck-stress tensor of kinematical hardening, r is the parameter of isotropic hardening, and Jr, is the kinematic flux of isotropic hardening. Finally, the set of governing equations are closed via the density sources: mass, momentum, energy: Se, plasticity Spl, kinematical hardening Sα and isotropic hardening Sr. In particular, calibration of these sources needed more detailed analysis based on dedicated experiments and have been done in the papers by Banaszkiewicz et al. (Banaszkiewicz et al., 2019) as well as by Dudda et al. (Duda, 2019).
3.3 Thermal-FSI tools
The thermal-FSI analysis consists of CFD analysis, the results of which are exported to a solid-state solver (CSD). Next, the CSD solver, on the basis of imported data (temperature, pressure), determines the stress and displacements in the analysed geometry.
The schematic principle of the analysis is shown in Figure 7.
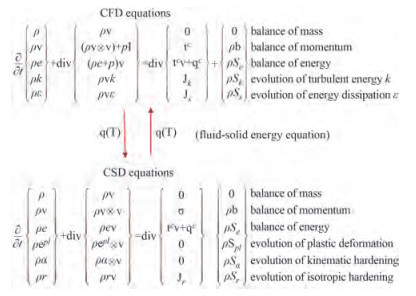 Figure 7 Principle of operation of the Thermal-FSI (Badur et al., 2019)
There are two types of Thermal-FSI analysis described in the literature: one-way FSI and two-way FSI (Badur et al., 2019; Bryk et al., 2019). There is a difference to the momentum-FSI where, in the one way FSI, after the CFD calculations are done, the solution of pressure field is exported to the CSD solver and the stress and displacements are determined on their basis. In one way thermal-FSI, the cooling or heating of fluid by a solid body, is realised with the Neumann type boundary conditions.
In the case of two-way Thermal-FSI analysis, both models (CFD and CSD) are coupled together during the entire simulation via energy equation balance. Precisely speaking, this coupling takes place on a common surface between solid and fluid domain, where the crucial boundary condition is placed (7) (Badur, 2005):
$$ \left(\boldsymbol{q}+\boldsymbol{q}^{\mathrm{t}}+\boldsymbol{q}^{\mathrm{rad}}+\boldsymbol{q}^{\mathrm{D}}\right) \cdot \boldsymbol{n}_{\text {|solid }}+\left(\boldsymbol{q}+\boldsymbol{q}^{\mathrm{t}}+\boldsymbol{q}^{\mathrm{ph}}\right) \cdot \boldsymbol{n}_{\mid \text {fluid }}=0 $$ (7) This means that the normal component of total heat flux qc∙n vector flows from solid to fluid and vice versa. In both cases, fluid and solid, the molecular heat flux q is described usually by the Fourier mode of transport.
The Thermal-FSI codes are differently organised. After calculating one CFD time step, the results are exported to the CSD solver. Then, stress and displacement are determined. Then, due to deformations of the analysed geometry (mesh), automatic re-meshing is carried out. The next time step in the CFD solver is calculated with the new mesh. The entire process is carried out automatically until the last time step.
FSI calculations have many advantages over the experiment. First, the interference with the structure of the ele‐ ment under analysis is allowed. Without changing the actual model, the effect of different structural variations of the element on the performance can be analysed.
The disadvantage of the model is that it is determined by experience in modelling issues. The adequate knowledge of both fluid and solid mechanics and the relationships between them to make the representation of the actual process as accurate as possible is needed. In addition, one must have multiple steps to perform, such as checking the influence of the mesh on the results, selecting appropriate turbulence models, etc.
The two-way Thermal-FSI analyses were chosen. Temperature fields were automatically imported, both from solid to fluid and vice versa from fluid to solid. Finally, from the field of temperature, a new pressure in fluid and new thermal stress fields in solid in the analysed numerical domain was determined.
3.4 Boundary and initial conditions
The detailed start-up curves for the analysed turbine were not available, however, for this turbine power of 41 MW the 8 MPa boiler was used (Marine Engineering Practice Vol1). Therefore, the starting curves for another turbine, which cooperates with the 8 MPa boiler, were used. The starting curves of steam temperature and steam pressure are presented in Figure 8. Starting temperature of turbine has been taken as uniform and equal to 25 ℃.
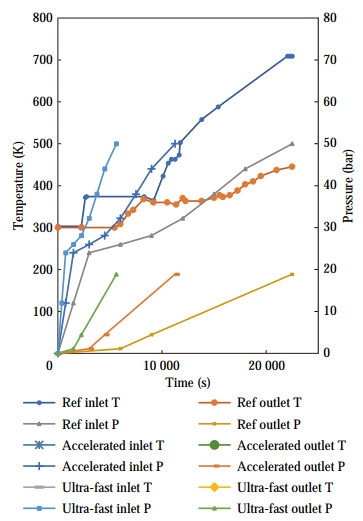 Figure 8 Start-up curves (Marine Engineering Practice Vol1)
The calculations were carried out using Ansys Fluent and Ansys Mechanical software.
Due to 2D calculations, only pressure and temperature curves were used. For 3D calculations (which are the future work), parameters such as change in power, flow rate and shaft speed will be added to pressure and temperature.
A pressure and temperature condition were set at the inlet, the same situation applies to the outlet. The inlet and outlet for the modified geometry are shown in Figure 9. For the reference geometry, only one inlet and one outlet were set, which correspond respectively to the inlet and outlet edges of Figure 9.
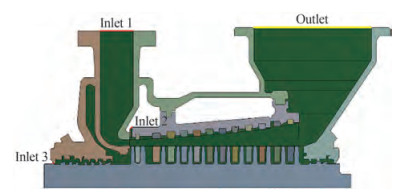 Figure 9 Inlet and outlet edge marking
The reference start-up (6 h 15 min), accelerated start-up (3 h 20 min) and ultra-fast start-up (1 h 40 min) were compared. Additional injection of cooling steam was carried out in the places marked on the Figure 9. The first one can be achieved by a simple structural change of the turbine, the second one is a steam inlet through seals. The use of additional steam inlet through seals makes steam traps at this point of the turbine unnecessary.
The parameters of the additional steam were a constant temperature of 473 K, which corresponds to the saturation temperature for the pressure of about 1.6 MPa, and the pressure of 0.5 MPa higher than the pressure of the inlet steam to the turbine. The cooling process with additional steam takes place from the moment when the steam reaches the temperature of 473 K, until then steam of parameters such as fresh inlet steam flows through additional inlets to the turbine.
An enthalpy decrease in the turbine was necessary to implement due to the fact that the analysis is a 2D analysis. Since the existing blade profiles were simplified, it was necessary to write the code for the temperature drop (Energy) in the turbine, using UDF (User Defined Function) code (Badur et al., 2019). Taking into account the real temperature drops in the turbine, the enthalpy drop in the flow channel was mapped using the abovementioned code. It should be mentioned that the turbine fan work in the initial start-up phase was also taken into account here. In addition, due to the two-dimensional analysis, it was necessary to use as inlets - edges from which the vapor flow occurs in the normal direction to the edge.
4 CFD Results
The distribution of the temperature field for each of the analysed start-up cases was showed in Figures 10 to 15.
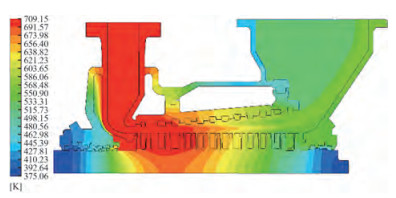 Figure 10 Temperature field in 22 500 s of reference geometry reference start-up
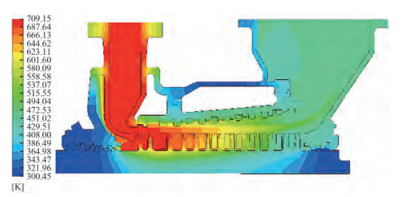 Figure 11 Temperature field in 12 000 seconds of accelerated start-up of reference geometry
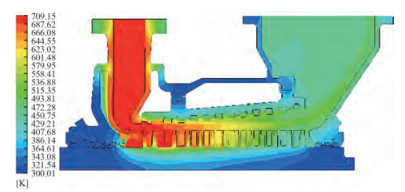 Figure 12 Temperature field in 6 000 seconds of ultra-fast start-up of reference geometry
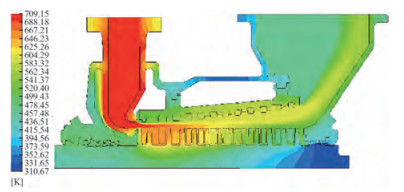 Figure 13 Temperature field in 22 500 seconds of modified geometry reference start-up
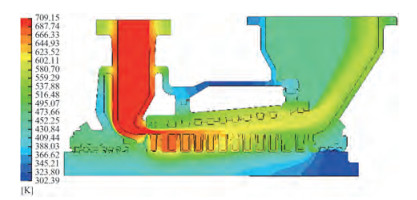 Figure 14 Temperature field in 12 000 seconds of modified geometry accelerated start-up
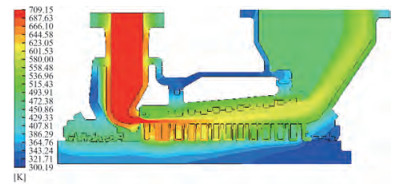 Figure 15 Temperature field in 6 000 seconds of modified geometry ultra-fast start-up
A standard temperature distribution in the turbine construction were obtained for reference start-up. The observed temperature gradients between steam and metal do not take high values. The distribution of the temperature field in the shaft is analogous to that given in (Dominiczak et al., 2020).
The distribution of the temperature field for the final time of the accelerated turbine start-up is shown in Figure 11.
Compared to Figure 10, there are higher temperature gradients between steam and metal, which will lead to higher stress values in the structure. Main changes in shaft, inletneighbor and hull can be observed.
For ultra-fast start-up, as shown in Figure 12, the greatest temperature gradients between steam and metal are obtained.
The turbine structure is not sufficiently warmed up, therefore high stress values are expected.
For reference start-up with the applied cooling steam (Figure 13), the high temperature influence field has been limited to the main flow channel up to the second stage.
In addition, there are smaller temperature gradients between steam and metal than during the start-up without cooling. The temperature gradient near the additional inlet (inlet2) can be observed, but the value of gradient is not dangerous. The temperature gradient in area of inlet 3 takes smaller values than in case without cooling steam injection.
For accelerated start-up with cooling steam injection (Figure 14) there are higher temperature gradients between steam and metal than in the case of Figure 13, however, the limitation of the influence of high temperatures on the turbine structure can also be seen here.
The temperature gradient in area of inlet 3 takes smaller values than in case without cooling steam injection.
The temperature field in the final second of an ultra-fast start-up with cooling steam injection is shown in Figure 15.
High temperature gradients between steam and metal occurred, but the influence of high temperatures is also limited. The temperature gradient near the additional inlet (inlet2) and also in live steam channel occurred but the value of gradient is not dangerous. The temperature gradient in area of inlet 3 takes smaller values than that in case without cooling steam injection.
5 CSD Results
Based on the obtained results of the flow simulation, a strength simulation was carried out. The time-varying stresses generated in the turbine structure during start-up were determined for all the analyzed cases.
Due to the fact that the calculations performed are two-dimensional calculations, there are difficulties in confirming the hull geometry.
For this reason, the presented results of the strength simulation will apply only to the turbine shaft. This step was taken because of the simple restraining of the shaft in the two-dimensional consideration. The shaft was fixed in two places. The first one is edge 1, which has been prevented from movement in the OX-axis. The second edge is edge 2, which was prevented from motion in the OY axis (Figure 16). It is worth mentioning that the same method of restraint the turbine shaft can be found in the study (Dominiczak et al., 2020).
 Figure 16 Boundary conditions for CSD analysis and designation of the analysed shaft points
The results are presented in two critical points of the shaft (A, B), marked in Figure 16 and as a result of the whole shaft geometry.
The reference start-up without cooling is shown in Figure 17. Reduced stress arising in the shaft at the two analyzed points take on a similar character, however, different values.
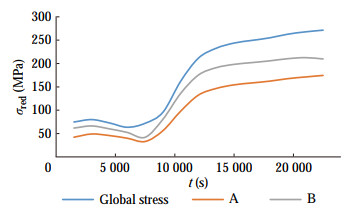 Figure 17 Reduced stress curves during reference start-up of the reference geometry
At the end of the start-up, the global maximum stresses are about 270 MPa.
The reference start-up without cooling compared to the reference start-up with cooling is shown in Figure 18.
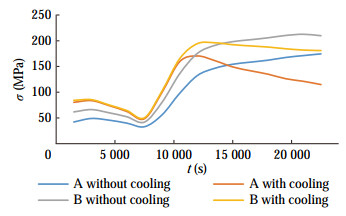 Figure 18 Reduced stress curves during reference start-up for start-up with and without cooling steam injection
The stresses in the shaft at the two analyzed points are similar in character to those at about 7 500 s. After this time, the cooling process begins, which results in a reduction of stresses compared to an uncooled start-up. The difference in stress between the two start-up modes is about 95 MPa. The higher values of stress in case with cooling steam injection from the start to 14 000 s due to additional steam injection and extra temperature gradients is observed, but the stress does not take much higher values. After this time, the stress takes lower values than in case without cooling steam injection.
The stress pattern during an accelerated start-up without cooling compared to an accelerated start-up with cooling is shown in Figure 19.
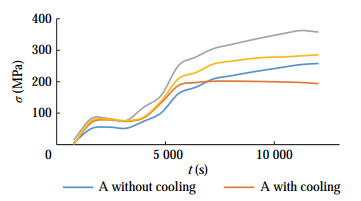 Figure 19 Reduced stress curves during accelerated start-up for start-up with and without cooling steam injection.
The stresses occurring in the shaft at the two analyzed points take on a similar character to the time of about 6 400 s. After this time, the cooling process begins, which results in a reduction of stress values in comparison to uncooled start-up. Difference in the stress value between the two start-up modes is about 70 MPa. An analogous stress behavior in the initial start-up phase as in the previous case is observed. The stress with additional steam injec‐ tion is higher about 35 MPa.
The stress pattern of an ultra-fast start-up without cooling compared to an ultra-fast start-up with cooling is shown in Figure 20.
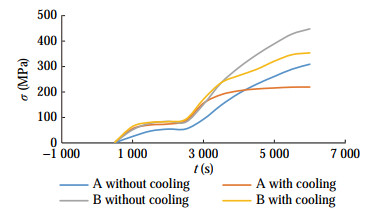 Figure 20 Stress curves during ultra-fast start-up for start-up with and without cooling steam injection
The stresses occurring in the shaft at the two analyzed points are similar in character to the time of about 3 000 s. After this time, the cooling process begins, which results in a reduction of stresses in comparison to an uncooled start-up. Difference in the stresses between the two starting modes is about 90 MPa. An analogous stress behavior in the initial start-up phase as in the previous case is observed. The stress with additional steam injection is higher about 40 MPa.
Turbine start-up is primarily limited by thermal stress and differentia expansion between rotor and casing. The conditions for operating the turbine startup is affected by these two aspects. As presented in Section CSD Results, the thermal stresses do not reach values that are dangerous from an operational point of view, so the difference in expansion between the rotor and the hull was taken into consideration. Elongations of the rotor and hull components lead to a reduction in the technological clearances and increase the risk of turbine component seizure. In the case of an off-design run, it was necessary to check for the risk of seizure and/or turbine damage associated with backlash cancellation. For the analysis, an example of the longitudinal axial clearance behavior according to an experiment conducted by Kosman et. al (Kosman et al., 2009) were used.
The research described in this paper concerns the axial elongations of the components of the model turbine shown in Figure 21.
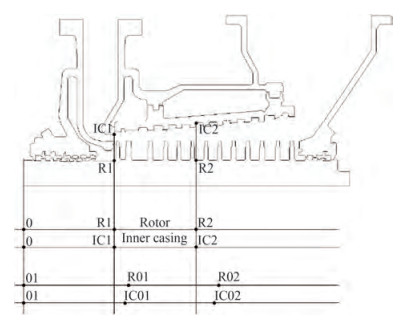 Figure 21 Points of rotor and inner casing taking into consideration to elongation analysis
The HP rotor (R) and inner casing (IC) of a turbine were analyzed above mentioned paper. The fixed point of the rotor is located at the axial bearing. In Figure 21 it is assumed to be at point 0. The fixed point of the internal casing assembly is located on the axis of the steam inlet (cross-section IC1-R1 in Figure 21). The selection process for axial clearances must determine the relative elongations: rotor to internal casing ∆ER−IC=R01 − IC01 and ∆ER−IC=R02 − IC02. Elonga‐ tions are shown at two points due to the highest tempera‐ ture gradients accompanying the start-up process at these locations.
The following designations were used for the analyzed start-ups:
• ref_ref–reference geometry, reference start-up (22 500 s– 6 h 15 min);
• ref_acc–reference geometry, accelerated start-up (12 000 s –3 h 20 min);
• ref_uf–reference geometry, ultra-fast start-up(6 000s– 1 h 40 min);
• cool_ref–modified geometry with cooling steam injec‐ tion, reference start-up (22 500 s–6 h 15 min);
• cool_acc–modified geometry with cooling steam injec‐ tion, accelerated start-up (12 000 s–3 h 20 min);
• cool_uf–modified geometry with cooling steam injec‐ tion, ultra-fast start-up (6 000 s–1 h 40 min).
The rotor elongations for different start-up cases are shown in Figures 22 and 23.
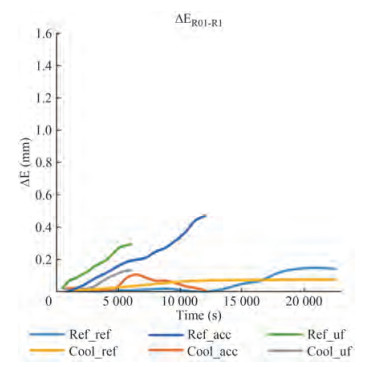 Figure 22 Elongation of point ER01 and ER1 in rotor during a start-up for various startup cases.
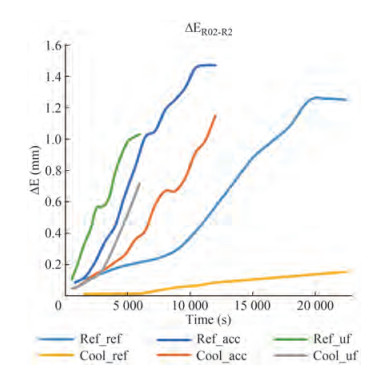 Figure 23 Elongation of point ER02 and ER2 in rotor during a start-up for various startup cases
The inner casing elongations for different start-up cases are shown in Figures 24 and 25.
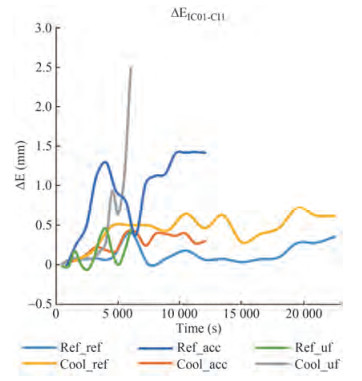 Figure 24 Elongation of point EIC01 and EIC1 in inner casing during a start-up for various startup cases
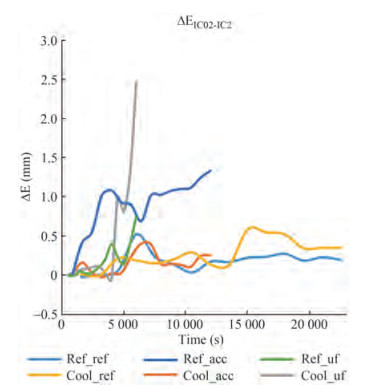 Figure 25 Elongation of point EIC02 and EIC2 in inner casing during a start-up for various startup cases
The highest values of elongation during the reference start-up were obtained for the rotor at point R2 and reached 1.26 mm. The highest value of elongation for accelerated startup occurred for the case without cooling steam injection for the rotor at point R2 and were 1.47mm. The largest elongation with a value of 2.5mm took place for ultra-fast start-up, and occurred in the inner casing (at both IC1 and IC2).
The elongation curves presented in the Figures 22-25 show that the application of cooling has a positive effect on elongation values and their gradients. In the case of start-ups without cooling steam injection, the amplitude of the elongation increase is significantly greater than when cooling is applied. The greatest difference in elongation occurs for accelerated and ultra-fast start-up. Because of the additional steam inlet, with a lower temperature value, there is a change in the temperature gradients that positively affects the elongation curves. If cooling is not used, thermal shock and drastic increases in elongation occur due to excessive heating of the rotor structure and inner casing.
The relative elongations for cross sections 1 and 2 during different starting cases are shown in Figures 26 and 27. The largest differences between the elongations of the inner casing and the rotor occurred for the ultra-fast startup without the applied cooling steam injection. The lowest values of relative elongation occurred for the accelerated start-up with applied cooling. It should be noted the nature of the curves, the case of the reference start-up for the reference geometry the largest difference occurred in section 2 and was 1.05 mm difference between the inner casing and rotor elongation. For ultra-fast starting with cooling steam applied, the largest difference reached 0.83 mm. The use of cooling steam injection has improved the clearances situation occurring in the turbine.
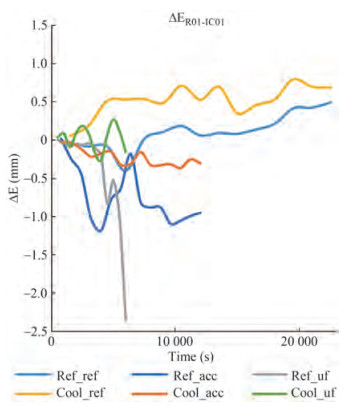 Figure 26 The relative elongations in the cross-section 1 during a start-up for various startup cases
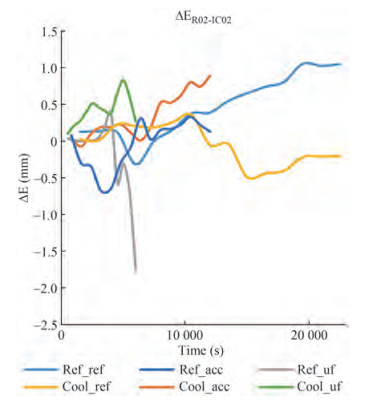 Figure 27 The relative elongations in the cross-section 2 during a start-up for various startup cases
The analysis concerns thermal loads occurring in the components exposed to different steam loads (start-up time). The proposed cooling-steam injection does not cause any problems for the turbine as long as the elongations are taken into consideration at the design stage, when the axial clearances are chosen. For such a shortened start-up condition, the heating process is much more intensive, the temperature of the components increases faster and as a result the relative elongations are more dynamic.
6 Fuel savings
When talking about fuel savings in the case of combined cycles with a gas/steam cycle with an HRSG, one is referring to the extent to which energy is used that would ulti‐ mately be lost to the environment. Bringing the drivetrain to maximum efficiency in the shortest possible time is desirable for economic and ecological reasons.
For the example given in (Domachwoski et al., 2004), the fuel consumption for a COGES combined cycle (2x LM2500 and 1 ST 10 000 kW) is 183 g/kWh (8 784 t/h), at a fuel price of 140 USD/t hourly the power plant operation price is 1229, 76 USD/h. In this case, reducing the start-up time of the steam turbine results in faster achievement of maximum cycle efficiency and thus lower emissions.
In the case of the ENERGY FRONTIER vessel which is powered by a 26 900 kW steam turbine (for details see https://www.classnk.or.jp/register/regships/one_dsp.aspx?imo=9245720), the turbine is powered by two boilers with a common output of 56t/h for this system, extensive analyses were carried out which showed fuel costs of 1 172 USD/h (Mosleh et al., 2012). The calculations performed in the article refer to a 41MW turbine, for which the start-up time is about 6.5h. For the Steam Turbine on the Energy Frontier, this time may vary, but for the purpose of the analysis, a start-up time of 6.5 h is most reasonable. By reducing the start-up time by half one is able to save 4 102 USD per start-up. By reducing the start-up time to 1 h 40 min, it is possible to save about 5 372 USD per start-up. In addition, the cooling steam injection method can be applied as a reduction of the time needed to reduce the turbine load, e.g., during manoeuvring. The application would be applicable during short port stays. Faster turbine shutdown with adequate boiler load reduction time would result in reduced fuel consumption.
7 Conclusions
The numerical research has shown that the idea of additional cooling steam injection control shows benefits in the process of the steam turbine start-up.
Figure 28 shows the compared stress reduced in the turbine rotor shaft during start-up with and without cooling.
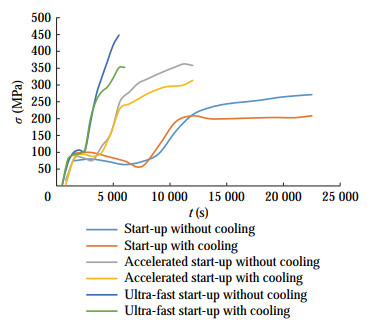 Figure 28 Global stress curves during start-ups with and without cooling steam injection
Although the difference in stress during start-ups is not drastic, it should be noted that it depends on the temperature of the cooling steam. In this case, the temperature is 200 ℃ (473 K). Lower temperature steam can be used, which would lead to a faster reduction of thermal stress in the structure during start-up. Nevertheless, the idea of using internal cooling to speed up the start-up of a marine steam turbine is justified.
For the steel used, that is St12T, the strength limit at 450 ℃ is 555 MPa (Duda et al., 2019). This means that ultra-fast start without cooling steam injection would be possible (σmax = 450 MPa). However, looking at the thermal stresses developed in the structure, as well as elongations, this would be dangerous. The most reasonable solution would be to use a half the start-up time reduction with cooling steam applied. However, in the case of ultra-fast start-up with cooling steam injection, the stresses take a value far below the strength limit. (σmax = 350 MPa). It is promising that the stresses at accelerated start-up with cooling steam injection increase by only about 40 MPa and during ultra-fast start-up about 79 MPa. From the construction reason, the stress value along with speed of temperature change is acceptable. In addition, this solution could be used for fast load changes of the steam turbine, but this idea should be properly investigated.
The proposed method of accelerating the start-up guarantees operational safety while maintaining appropriate values of clearances between the rotor and the inner casing. Although for a newly designed turbine the clearances could be adjusted for accelerated start-up, in case of working units this method of start-up can be introduced without the risk of axial clearance erasure. The relative displacement curves between the inner casing and rotor show operation in the more favorable elongation range. For the reference start-up without cooling steam injection, the highest relative elongation value reaches 1.05 mm compared to 0.89 mm for the ultra-fast startup with cooling steam injection.
Reducing the start-up time results in a reduced fuel consumption of $ 5 372 per one start-up. Adding in the ability to shut down the turbine faster and reduce the load can save additional money, but the value of the savings should be a separate analysis.
The concept proposed by the authors is safe, less expensive and does not affect the life of the device. In addition, results and applications from Siemens prove that additional injection of cooling steam is possible, although Siemens introduces this steam into the mid-pressure part of the turbine (Wieghardt, 2015; Arrel, 2006).
To summarize the conclusions, they were brought down to the following points:
1) The maximum stress during the ultra-fast start-up with cooling steam injection takes the value of 350 MPa;
2) The highest relative elongation value reaches 0.89 mm for the ultra-fast start-up with cooling steam injection (1.75 mm without cooling);
3) The ultra-fast start-up can reduce the fuel consumption up to 5 372 USD per one start-up;
4) The ultra-fast start-up with cooling steam injection guarantees operational safety.
Acknowledgement: The authors would like to acknowledge the support of Prof. Janusz Badur in terms of CFD and CSD model preparation.Competing interest The authors have no competing interests to declare that are relevant to the content of this article. -
Figure 1 Longitudinal cross-section of the HP turbine part of the ship Queen Elizabeth Ⅱ (Marine Engineering Practice Vol1)
Figure 2 Reference geometry
Figure 3 Modified geometry
Figure 4 P1 Path
Figure 5 Mean temperature at selected locations in Path P1
Figure 6 Discretized geometry of the turbine additional inlet
Figure 7 Principle of operation of the Thermal-FSI (Badur et al., 2019)
Figure 8 Start-up curves (Marine Engineering Practice Vol1)
Figure 9 Inlet and outlet edge marking
Figure 10 Temperature field in 22 500 s of reference geometry reference start-up
Figure 11 Temperature field in 12 000 seconds of accelerated start-up of reference geometry
Figure 12 Temperature field in 6 000 seconds of ultra-fast start-up of reference geometry
Figure 13 Temperature field in 22 500 seconds of modified geometry reference start-up
Figure 14 Temperature field in 12 000 seconds of modified geometry accelerated start-up
Figure 15 Temperature field in 6 000 seconds of modified geometry ultra-fast start-up
Figure 16 Boundary conditions for CSD analysis and designation of the analysed shaft points
Figure 17 Reduced stress curves during reference start-up of the reference geometry
Figure 18 Reduced stress curves during reference start-up for start-up with and without cooling steam injection
Figure 19 Reduced stress curves during accelerated start-up for start-up with and without cooling steam injection.
Figure 20 Stress curves during ultra-fast start-up for start-up with and without cooling steam injection
Figure 21 Points of rotor and inner casing taking into consideration to elongation analysis
Figure 22 Elongation of point ER01 and ER1 in rotor during a start-up for various startup cases.
Figure 23 Elongation of point ER02 and ER2 in rotor during a start-up for various startup cases
Figure 24 Elongation of point EIC01 and EIC1 in inner casing during a start-up for various startup cases
Figure 25 Elongation of point EIC02 and EIC2 in inner casing during a start-up for various startup cases
Figure 26 The relative elongations in the cross-section 1 during a start-up for various startup cases
Figure 27 The relative elongations in the cross-section 2 during a start-up for various startup cases
Figure 28 Global stress curves during start-ups with and without cooling steam injection
Table 1 Some of Marine Steam Turbine application (Sinan and Ust, 2011)
Name Type Power (kW) US Enterprise War Ship 210 000 Knock Nevis Tanker 38 000 Simaisma Tanker 28 000 InigoTapias Tanker 28 000 Energy Frontier Gas Carrier 26 900 Disha Gas Carrier 26 500 Excalibur Gas Carrier 26 500 Excel Gas Carrier 26 500 Radiance of the Seas Cruise Ship 59 000 Brilliance of the Seas Cruise Ship 59 000 Queen Elisabeth Ⅱ Cruise Ship 80 900 Millenium Ship Cruise Ship 590 000 Seri Camellia LNG Tanker 23 910 Seri Cenderawasih LNG Tanker 23 910 Table 2 Temperature in Path P1 for different mesh densities
l (m) Grid 1 (oC) Grid 2 (oC) Grid 3 (oC) Grid 4 (oC) 1.37 360.1 359.2 357.9 358.2 1.35 334.2 328.1 330.9 331.1 1.34 309.0 303.2 306.9 307.3 1.33 288.3 282.5 285.9 286.4 1.32 270.1 268.2 268.9 269.6 1.30 255.4 253.1 253.9 255.1 1.29 240.1 241.2 241.9 242.5 1.28 231.2 232.3 232.9 234.2 1.27 223.5 224.9 225.9 226.1 1.25 220.2 221.0 221.9 222.0 1.24 219.7 219.2 219.9 219.9 -
Armellini A, Daniotti S, Pinamonti P, Reini M (2019) Reducing the environmental impact of large cruise ships by the adoption of complex cogenerative/trigenerative energy systems. Energy Conversion and Management 198. https://doi.org/10.1016/j.enconman.2019.111806 http://www.sciencedirect.com/science/article/pii/S0196890419307885 Arrel D (2006) Next Generation Engineered Materials for Ultra Supercritical Steam Turbines. Final Technical Report, Siemens Orlando Badur J (2005) Five lectures of contemporary fluid termomechanics. Gdansk, Poland (in Polish) Badur J, Sławinski D, Kornet S, Kowalczyk T, Bryk M, Ziołkowski PJ, Stajnke M, Ziołkowski P (2016) Overdesign limitations from the maintaining availability of large steam turbine. Energetyka 11: 652-654 Badur J, Bryk M (2019) Accelerated start-up of the steam turbine by means of controlled cooling steam injection. Energy 173: 1242-1255. https://doi.org/10.1016/j.energy.2019.02.088 Balcombe P, Brierley J, Lewis C, Skatvedt L, Speirs J, Hawkes A, Staffell A (2019) How to decarbonise international shipping: Options for fuels, technologies and policies. Energy Conversion and Management 182: 72-88. https://doi.org/10.1016/j.enconman.2018.12.080 Banaszkiewicz M (2015) Multilevel approach to lifetime assessment of steam turbines. International Journal of Fatigue 73: 39–47. https://doi.org/10.1016/j.ijfatigue.2014.10.009 Banaszkiewicz M, Dudda W, Badur J (2019) The effect of strength differential on material effort and life-time of steam turbine rotors under thermo-mechanical load. Engineering Transactions 67: 167–184. https://doi.org/10.24423/EngTrans.964.20190426 Bryk M, Kowalczyk T, Ziółkowski P, Badur J (2019) The thermal effort during marine steam turbine flooding with water. AIP Conference Proceedings 2077. https://doi.org/10.1063/1.5091870 http://www.researchgate.net/publication/331283010_The_thermal_effort_during_marine_steam_turbine_flooding_with_water Casella F, Pretolani F (2006) Fast Start-up of a Combined-Cycle Power Plant: a Simulation Study with Modelica. Modelica 2006, September. https://doi.org/10.1063/1.5091870 http://www.researchgate.net/profile/Francesco_Casella2/publication/237826713_Fast_Start-up_of_a_Combined-Cycle_Power_Plant_A_Simulation_Study_with_Modelica_Fast_Start-up_of_a_Combined-Cycle_Power_Plant_a_Simulation_Study_with_Modelica/links/00b4952b8ad9a59d88000000.pdf COATS R. Marine Engineering Practice Vol 1, Part 8, Marine Steam Turbines, The Institute Of Marine Engineers Domachowski Z, Dzida M (2004) An analysis of characteristics of ship gas turbine propulsion system (in the light of the requirements for ship operation in the Baltic Sea). Pol Marit Res 73–78 (Special Issue) International Gas Union 2021 world LNG report: Technical report 2021 Dominiczak K, Drosińska-Kmor M, Rządkowski R, Głuch J (2020) Optimisation of turbine shaft heating process under steam turbine run-up conditions. Archives of Thermodynamics 41: 255-268. https://doi.org/10.24425/ather.2020.135863 Dotto A, Campora U, Satta F (2021) Feasibility study of an integrated COGES-DF engine power plant in LNG propulsion for a cruiseferry. Energy Conversion and Management 245. https://doi.org/10.1016/j.enconman.2021.114602 http://www.sciencedirect.com/science/article/pii/S0196890421007780 Dudda W, Banaszkiewicz M, Ziółkowski PJ (2019) Validation of a Burzyński plasticity model with hardening – a case of St12T. AIP Conference Proceedings 2077. https://doi.org/10.1063/1.5091877 http://www.researchgate.net/publication/331280044_Validation_plastic_model_with_hardening_of_St12t Głuch J, Drosińska-Komor M (2021) Neural Modelling of Steam Turbine Control Stage, Studies in Systems. Decision and Control 313: 117-128. https://doi.org/10.1007/978-3-030-58964-6 doi: 10.1007/978-3-030-58964-6_9 Haglind F (2008a) A review on the use of gas and steam turbine combined cycles as prime movers for large ships. Part Ⅰ: Background and design. Energy Conversion and Management 49: 3458-3467. https://doi.org/10.1016/j.enconman.2008.08.005 Haglind F (2008b) A review on the use of gas and steam turbine combined cycles as prime movers for large ships. Part Ⅱ: Previous work and implications. Energy Conversion and Management 49: 3448-3475. https://doi.org/10.1016/j.enconman.2008.08.004 Haglind F (2008c) A review on the use of gas and steam turbine combined cycles as prime movers for large ships. Part Ⅲ: Fuels and emissions. Energy Conversion and Management 49: 3476-3482. https://doi.org/10.1016/j.enconman.2008.08.003. Inomata A; Yamashita K; Saito K, Inukai T, Wada K, Ikeda K; Suga T (2014) Steam turbine, method of cooling steam turbine and heat insulating method for steam turbine. United States Patent US 8, 727, 705 B2, May 20 Ito M (2007) Development of Mitsubishi High Efficiency Marine Propulsion Plant (Ultra Steam Turbine). KANRIN (Bulletin of The Japan Society of Naval Architects and Ocean Engineers) 12: 43. https://doi.org/10.1016/j.enconman.2018.12.080 http://mhi.co.jp/technology/review/pdf/e443/e443015.pdf Ji DM, Sun JQ, Dui Y, Ren JX (2017) The optimization of the start-up scheduling for a 320 MW steam turbine. Energy 125: 345-355. https://doi.org/10.1016/j.energy.2017.02.139 Ji DM, Sun JQ, Sun Q, Guo HC, Ren JX, Zhu QJ (2018) Optimization of start-up scheduling and life assessment for a steam turbine. Energy 160: 19-32. https://doi.org/10.1016/j.energy.2018.07.015 http://www.onacademic.com/detail/journal_1000040420043610_b474.html Kehlhofer RH, Warner J, Nielsen H, Bachmann R (1999) Combinedcycle gas & steam turbine power plants. 2nd ed. PennWell, Tulsa, OK Kosman G, Rusin A (2001) The influence of the start-ups and cyclic loads of steam turbines conducted according to European standards on the component's life. Energy 26: 1083-1099. https://doi.org/10.1016/S0360-5442(01)00071-8 http://www.sciencedirect.com/science?_ob=ShoppingCartURL&_method=add&_eid=1-s2.0-S0360544201000718&originContentFamily=serial&_origin=article&_ts=1438705332&md5=019f857d1f75b793fc26508a3eedc4a3 Kosman W, Roskosz M, Nawrat K (2009) Thermal elongations in steam turbines with welded rotors made of advanced materials at supercritical steam parameters. Applied Thermal Engineering 29. https://doi.org/10.1016/j.applthermaleng.2009.05.016 http://www.tara.tcd.ie/bitstream/handle/2262/50528/PEER_stage2_10.1016%252Fj.applthermaleng.2009.05.016.pdf?sequence=1&isAllowed=y Kosman G, Rusin A, Taler J, Pawlik M (2010) Issues of design and operation of boilers and turbines for supercritical coal blocks. Gliwice: Publishing House of the Silesian University of Technology Kowalczyk T, Badur J, Bryk M (2019) Energy and exergy analysis of hydrogen production combined with electric energy generation in a nuclear cogeneration cycle. Energy Conversion and Management 198. https://doi.org/10.1016/j.enconman.2019.111805 http://www.sciencedirect.com/science/article/pii/S0196890419307873 Madejski P, Taler D, Taler J (2016) Numerical model of a steam superheater with a complex shape of the tube cross section using Control Volume based Finite Element Method. Energy Conversion and Management 118:179-192. https://doi.org/10.1016/j.enconman.2016.03.069 http://www.sciencedirect.com/science/article/pii/S0196890416302072 Mosleh M, Banawan A, El-Maghlany WM, Mohamed AG (2012) Parametric Study of Marine Steam Turbine Plants. Engineering Research Journal 35: 373-381. https://doi.org/10.21608/ERJM.2012.67196 http://www.xueshufan.com/publication/2998926153 Sinan Karakurt A, Ust Y (2011) Marine Steam Turbines, 1st International Symposium on Naval Architecture and Maritime INT-NAM, 24-25 October, Istanbul, Turkey Wieghardt K (2015) Siemens Steam Turbine Design for AD700 Power Plants. AD700 Conference Milan Zhu S, Ma Z, Zhang K, Deng K (2020) Energy and exergy analysis of a novel steam injected turbocompounding system applied on the marine two-stroke diesel engine. Energy Conversion and Management 221. https://doi.org/10.1016/j.enconman.2020.113207 http://www.sciencedirect.com/science/article/pii/S0196890420307512 Ziółkowski P, Kowalczyk T, Lemański M, Badur J (2019) On energy, exergy, and environmental aspects of a combined gas-steam cycle for heat and power generation undergoing a process of retrofitting by steam injection. Energy Conversion and Management 192: 374-384. https://doi.org/10.1016/j.enconman.2019.04.033 http://www.sciencedirect.com/science/article/pii/S0196890419304455 Ziółkowski PJ, Ochrymiuk T, Eremeyev VA (2021) Adaptation of the arbitrary Lagrange–Euler approach to fluid–solid interaction on an example of high velocity flow over thin platelet. Continuum Mechanics and Thermodynamicsm33:2301-2314. https://doi.org/10.1007/s00161-019-00850-7 https://www.classnk.or.jp/register/regships/one_dsp.aspx?imo=9245720