Underwater Radiated Noise Evaluation and Experimental Analysis of the Support Mother Ship for a Manned Submersible
https://doi.org/10.1007/s11804-023-00341-x
-
Abstract
This study investigates the underwater radiated noise (URN) of a manned submersible support mother ship. To this end, a detailed finite element model of the hull and outflow field is established, and the vibration wet mode of the scientific research ship is calculated. A combination of finite element and boundary element methods is used to analyze the spectral features of ship low-frequency URN. The URN source is comprehensively analyzed, the vibration energy is considered the basic parameter to describe the vibration, and the medium- and high-frequency URN of the ship are calculated using the statistical energy analysis. To obtain the full frequency-band URN of the ship, the risk position of exceeding the standard is determined, and the contribution of each main noise source in the ship to the URN is analyzed. The URN level of the ship is comprehensively measured in the free navigation state. The accuracy of the URN control evaluation model, and the method of the ship are verified.The data support for the ship to apply for the classification society certificate provides a scheme reference for the URN control of other scientific research ship in the future.Article Highlights• A combination of finite element and boundary element methods is used to analyze the spectral features of ship low-frequency URN.• The statistical energy method is used to analyze the medium- and highfrequency URN of the ship.• To obtain the full frequency-band URN of the ship, the risk position of exceeding the standard is determined, and the contribution of each main noise source in the ship to the URN is analyzed.• The URN navigation test is performed on the ship after construction. The measured URN level of the ship meets the requirements of CCS-URN-2. The ship is eligible for the CCS Underwater Noise 2 certificate. -
1 Introduction
The new manned submersible support mother ship Shen Hai Yi Hao is a 4 000 t special support mother ship that provides underwater and surface support and maintenance to the deep-diving operations of the manned submersible Jiaolong. It enables the submersible in the fields of deep-sea exploration, seabed mining, and deep-sea biological gene research. The mother ship can satisfy the development needs of China's deep-sea industries. Its global navigation capabilities, design concept, technical sophistication, and scientific payloads are on par with the advanced levels of similar ships globally (Figure 1). At the design stage, the research team involved in the development of Shen Hai Yi Hao proposed that the URN of the ship should meet the requirements of CCS-URN-2. To effectively control the URN of the new scientific research ship, the noise must be predicted and evaluated at the design stage, and the navigation test must be conducted according to the requirements of the classification society after construction. This will provide data support for obtaining the relevant certificates.
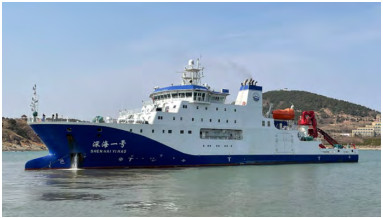 Figure 1 Manned submersible support mother ship, Shen Hai Yi Hao
Wang et al. (2012), Li et al. (2010), and Wang et al. (2018) calculated and analyzed the full-band underwater acoustic radiation characteristics of the ship using a combination of finite element method (FEM), boundary element method (BEM), and statistical energy analysis (SEA). Thus, they studied the impact of various vibration-reduction measures on the underwater radiated sound power and acoustic radiation efficiency of the ship. Wang and Liu (2013) summarized and analyzed the causes of URN of ships and the control methods at home and abroad, then pointed out that URN can be reduced by strengthening the early demonstration design, construction process control and later testing. Li et al. (2019) and Li et al. (2018) used the coupled acoustic finite element, far-field automatic matching, and coupled acoustic indirect boundary element methods (BEM), which strictly followed the acoustic solid coupling dynamic equation, to perform the comparative calculation of the URN of ships in the low-frequency domain. They verified that the coupled acoustic indirect boundary-element method based on the acoustic solid coupling mode was the most efficient method for predicting the URN of ships in the domain. Liu et al. (2020), Huang and Wu (2020), Lu et al. (2021) analyzed the excitation source affecting the URN of the ship by establishing new cruise FEM and BEM models. They calculated the rate of contribution of the excitation source to the URN. Fu et al. (2015) calculated the structure vibration and URN of ship structure caused by the propeller excitations using the FEM and BEM models. The URN of ship is the biggest excited by the transverse force, then is the vertical force, last is the shaft force. Zhu (2018) analyzed the characteristics of underwater noise induced by propeller pulse pressure exciting the stern structure and optimized the stern structure. Compared to other optimization measures, to increase the size of crosswise ribs in the area with pulse pressure exciting had higher cost-effect- iveness to reduce the underwater noise induced by each order of pulse pressure components.
Wang and Qiu (2014) studied a certain type of vessel, established its statistical energy model on VA One, analyzed the factors influencing the calculation of the URN of the ship by the SEA, calculated the URN of the ship in the medium- and high-frequency bands, and verified the accuracy and feasibility of the calculation method in the prediction of the URN of a real ship by comparing it with the result of a real ship test. In terms of experimentation and research on the URN of ships, Det Norsk Veritas (DNV) established different muteness levels and URN limits according to the requirements of underwater acoustic operability of different ships, given data correction standards based on the measurement method of underwater fixed hydrophones, and provided DNV ship classification services. The China Classification Society (CCS) has conducted further research on the technical requirements and measurement procedures of URN based on guidelines for the detection of URN of ships (2016), formulated the guidelines for the URN of ships (2018) and combined them with China's shipbuilding industry standards, and accordingly provided ship-classification services for the industry. Wu and Lin (2020) and Wang et al. (2021) used the simulated sound source excitation method to establish model of real ship URN caused by cabin air noise excitation, verified the feasibility and validity of the real ship transfer characteristics test and analysis method.
In this study, the research object is a new manned submersible-supporting mother ship named Deep Sea No.1. We establish an FEM of the hull and external flow field of the mother ship based on available schematics. The model calculates the vibration wet mode of the ship. The spectral features of the low-frequency URN of the ship are analyzed by a combination of finite and BEMs. The FEM of the scientific research ship is used to establish its statistical energy model and analyze the noise source, with the vibration energy as the basic parameter describing the vibration of the ship. The coupled dynamic model of sound, structural vibration, and other subsystems is established to calculate the high-frequency underwater radiation noise. The model results provide the full-frequency URN and help locate the position on the ship at which a risk of exceeding the standard exists. Meanwhile, an operable and targeted vibration- and noise-reduction scheme is proposed. After the completion of construction, the URN level of the ship in the free navigation state is measured, the accuracy of the URN control evaluation model and the method of the ship are verified, and a schematic reference for reducing the URN is provided.
2 Ship parameters and equqipment
The B3-ice-strengthened mother ship with DP-1 dynamic positioning capability has a single hull, a long forecastle, a double-pod electric-propulsion device, and a bow full-rotation telescopic propulsion device, and supports a manned submersible. Nine decks are arranged from bottom to top: inner bottom plate, platform, lower, main, forecastle, lifeboat, Captain, navigation, and compass decks. The main cabins include equipment space, crew working space, scientific research cabin, accommodation, laboratory, storage room, and public area. The lifeboat deck and lower levels are made of steel. The level above is made of aluminum alloy. The ship parameters are listed in Table 1. The ship is equipped with four diesel engines, two full-swing pod electric thrusters, and bow thrusters. The main power equipment parameters are listed in Table 2.
Table 1 Parameters of Shen Hai Yi HaoShip type Submersible support mother ship Total hull length, Loa (m) 90.2 Length between vertical lines, Lbp (m) 8.4 Profile width, B (m) 16.8 Shape depth, H (m) 8.3 Design speed (kn) 16 Service speed (kn) 12 Staffing (P) 60 Table 2 Parameters of main power equipmentNo. Equipment Name Parameters 1 No. 1 & 2 Main diesel generator set Diesel engine model Wärtsilä 8L26 Continuous power (kW) 2 600 Quantity 2 Continuous speed (r/min) 1 000 2 No. 3 & 4 Main diesel generator set Diesel engine model Wärtsilä 4L20 Continuous power (kW) 800 Quantity 2 Continuous speed (r/min) 1 000 3 Full swing pod electric propulsion Quantity 2 Type Fixed pitch propeller Design power (kW) 2 500 Propeller diameter (m) 3 Number of blades 5 Speed (r/min) 0~310 4 Bow thruster Quantity 1 Design power (kW) 800 Propeller diameter (m) 1.7 3 Evaluation of URN in low-frequency range of ship
A combination of FEM and BEMs was used to evaluate URN in the low-frequency band of the research vessel. Rong (2006) introduced the modeling method in the book finite element method The FEM was established based on the schematic of the ship. The whole hull model is divided into stern, engine room section, intermediate structure, bow, and superstructure. The whole hull FEM included 118 542 elements and 52 195 nodes. The length direction of the hull is x direction, the width Y direction, and the height Z direction. The FEM of the ship's overall structure is illustrated in Figure 2.
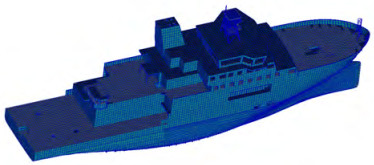 Figure 2 Finite element model (FEM) of the ship structure
Based on the vibration analysis of the ship structure, the vibration response of each node of the system structure, including displacement, velocity, and acceleration, was extracted. These data can be imported into LMS Virtual.Lab Acoustics as the *.rst format. The surface mesh was directly extracted from the imported FEM as the acoustic BEM, to establish the underwater fluid structure coupling model of the hull structure. At a low frequency, the water damping was significantly smaller than the structural damping of the hull; therefore, it had little effect on the vibration response of the hull structure. The prediction of URN at 16–250 Hz in the low-frequency band of the ship is illustrated in Figure 3. The radiated sound pressure level peaked at 153 dB near 125 Hz, with an average sound pressure level of 145.73 dB. Compared with the URN sound pressure level limit of the ship when sailing at a speed of 11kn, according to the technical specification, the whole low-frequency range meets the design requirements.
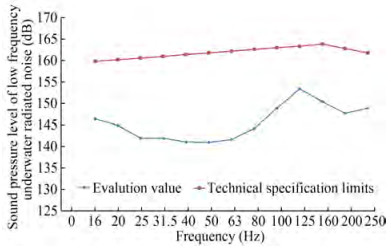 Figure 3 Sound pressure level of underwater radiated noise (URN) at low-frequency bands of a ship
4 Evaluation of URN in medium- and high-frequency ranges of ships
The SEA is primarily used to solve the problem of high-frequency sound and complex acoustic vibrations of structures. Yao and Wang (1995) introduced the principles and methods in detail in the book principles and applications of statistical energy analysis It can be used to extract the research object from the overall structure described by random parameters. The method does not involve the absolute parameters of the research object; rather, it considers the statistical average values of those parameters in the time, frequency, and space domains. It adopts the "energy" perspective to uniformly solve the problems of structural vibrations and acoustic field. When the ship structure is in medium and high frequency vibration, it presents short wave high modal characteristics. The finite element method with displacement as the main variable cannot meet the requirements of at least 6 units per wavelength in the evaluation of vibration and noise in medium and high frequency. The SEA is applicable to systems with modal numbers greater than 5. He et al. (2008) used the SEA to analyze the middle-high frequency vibration and sound radiation from the cylindrical shell with ring stiffeners under force excitation. The numerical results agree very well to those obtained by analytic methods, which shows that the SEA is applicable to such problems.
Therefore, this study used the SEA to evaluate the URN in the medium- and high-frequency bands of ships.
4.1 Establishment of evaluation model
The engineering drawing of the acoustic model from the FEM and layout of the cabin is illustrated in Figure 4. The cabin is mainly composed of flat plates with stiffeners and wooden partitions. In the calculation of the URN, the noise source is assumed to be concentrated below the waterline, and the superstructure had little influence on underwater noise or multi-beam self-noise. Therefore, for ease of calculation, only the draft (part of the hull under water) is retained in the model (Figure 5). A field point is established 100 m from the bottom of the ship directly below it, to simulate the hydrophone receiving sound waves underwater (Figure 6).
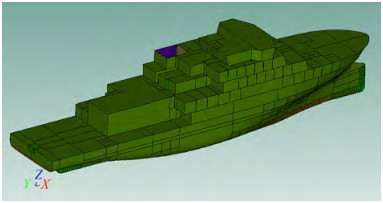 Figure 4 Three-dimensional outline of cabin noise acoustic model
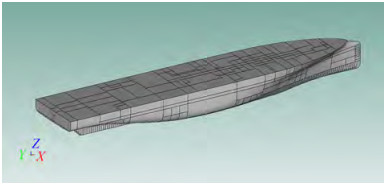 Figure 5 URN Calculation cavity
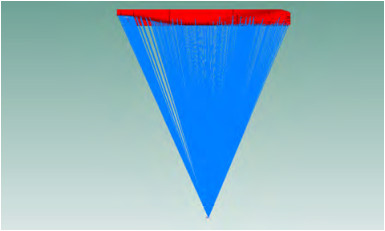 Figure 6 Calculation model of URN
4.2 Assessment of noise source analysis
According to the working conditions of the manned submersible-supporting mother ship, combined with previous evaluation experience from similar types of ships, the main vibration and noise sources of the ship must include generator sets, pod thrusters, telescopic thrusters, and air conditioning units, which radiate sound energy in the form of structural and air noises. The ship houses several scientific equipment and deck machinery, such as seismic air compressor unit and lifting equipment, which may emit noise during the test. The research and deck equipment were not opened during the evaluation. Therefore, their noise levels were dismissed.
4.2.1 Generator set
The engine room of the ship was arranged at Fr 53–77 in the middle of the ship in the form of a double-layer engine room, symmetrically arranged with two Wartsila 4L20 and two 8L26 generator sets. The specifications impose limit-curve requirements for the vibration speed level transmitted by the generator installed at the hull base (Figures 7 and 8). The vibration speed levels of 8L26 and 4L20 decrease with the increase of frequency. Meanwhile, the measurement results are plotted in the same graph; the measured effect is below the limit curve and meeting the design requirements. These measurement results were obtained from the actual scientific research ship "Science" with the same type of generator set and similar base structure. The measured data were used as the excitation loads of the ship in the model.
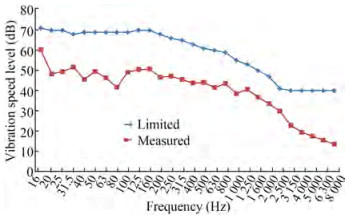 Figure 7 Vibration speed level of hull base of 4L20 generator set
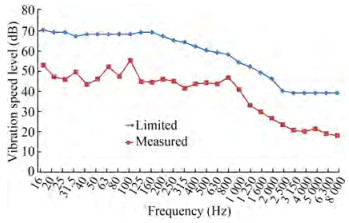 Figure 8 Vibration speed level of hull base of 8L26 generator set
The vibration of the generator set radiates air noise outward, which is the primary noise source of the engine room and nearby cabins. This air noise also stimulates the hull to vibrate and radiate sound energy into the water. The manufacturer of Wartsila provided the air noise data of the unit (Figure 9). It shows that the air noises of 8L26 and 4L20 are all high, and the average air noise of each frequency band of 8L26 is higher than that of 4L20, with the average values of 110.05 dB and 102.7 dB, respectively. The maximum air noise value of 8L26 is 115 dB at 250 Hz.
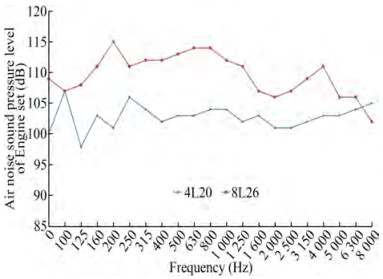 Figure 9 Air noise data of the generator set
The exhaust noise of the unit is an important noise source of the superstructure. Fresh air enters the engine room through the fan room and air inlet duct. The exhaust of the unit is discharged through the engine room shed. The shed is the main noise source of the superstructure. In other words, it can easily cause the vibration and noise of nearby cabins and open decks to exceed the standard. The measured data of exhaust noise of the unit are illustrated in Figure 10. It shows that the exhaust noises of 4L20 and 8L26 are all high, and the average exhaust noise of each frequency band of 4L20 is higher than that of 8L26, with the average values of 121.16 dB and 114.64 dB, respectively. The maximum exhaust noise value of 8L26 is 142 dB at 63 Hz.
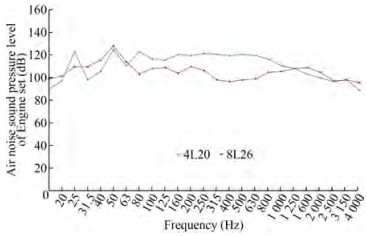 Figure 10 Exhaust noise data of the generator set
From the above analysis of the structure noise, air noise and exhaust noise of the two generators, the main noise source of the generator set is the exhaust noise at the low frequency stage, mainly because the generator starts ignition. In order to reduce the exhaust noise, the ship's ventilator room has been designed for noise reduction. The exhaust pipe is installed with an exhaust muffler for low-frequency noise, and an elastic connection should be used at the connection between the pipe and the engine room shed.
4.2.2 Pod thrusters
The ship adopts electric propulsion and is equipped with two ABB pod propellers. The pod is mainly composed of a propulsion motor and propeller. The pod power is 2 500 kW. The sound power in the POD propeller fat test is illustrated in Figures 11 and 12. It shows that the main air noise source of the pod thruster is the propeller. The average air noise of the motor and propeller of the pod thruster are 59.59 dB and 131.39 dB, respectively. The maximum air noise value of the propeller is 150 dB at 300 Hz.
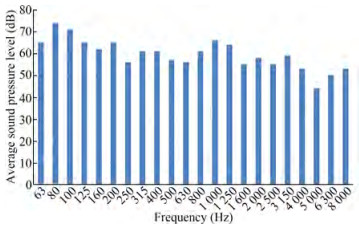 Figure 11 Pod air noise data
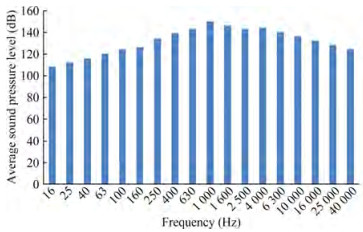 Figure 12 Propeller air noise data
4.2.3 Telescopic propeller
The bow propeller cabin is present in the bow at the position of FR116~130. The propeller is a telescopic full rotation propeller, which is driven by a motor. Under the DP working condition, the propeller coordinates with the pod to achieve positioning and ensure the scientific research needs of the ship. The rated power of the propeller is 800 kW, and the speed is 329–1 200 r/min. The sound energy of the propeller is radiated through air and structural sounds. Because the manufacturer did not provide specific vibration and noise excitation data of the equipment, the report will be evaluated by comparison with the excitation data of a similar equipment. The excitation data of the structural and air noise are depicted in Figures 13 and 14. It shows that the telescopic thruster vibrates greatly from 0-2 500 Hz, decreases with the increase of frequency after 2 500 Hz. The average vibration speed level is 63.25 dB. The air noise at the full frequency of telescopic thruster is high and evenly distributed, with an average value of 86.73 dB.
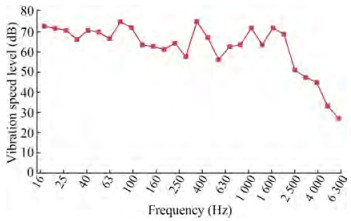 Figure 13 Vibration speed level of telescopic rotary propeller
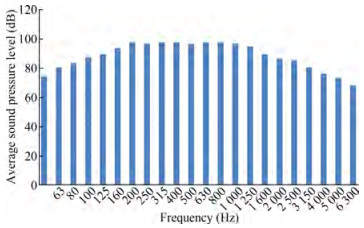 Figure 14 Propeller air noise data
4.2.4 Air conditioning and ventilation system
The air-conditioner room is located on the multi-story deck, with many living quarters nearby. The air-conditioner unit is an important local noise source. The air-conditioner room should be treated for noise reduction, and the interiors should be covered with sound-absorbing materials. Figure 15 illustrates the sound-pressure-level excitation data of the ship's air-conditioner unit according to empirical data. It shows the air noise distribution of the air conditioning unit at full frequency is evenly distributed, with an average value of 67.10 dB.
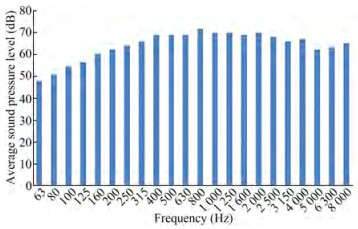 Figure 15 Sound pressure level data of air conditioning unit
4.3 URN assessment
The SEA model of the whole ship was used to predict the major noise from generator sets, pods, telescopic thrusters, pump sets, etc. for energy superposition. Based on the ship's specifications, the displacement under each design condition is 4 350.9~4 955.4 t. the model was simulated based on the DESIDEP mode—that is, design loading, 100% consumables, 5.487 m average draft and 4 616.2 t displacement at 11 kn. No boundary constraints were imposed during the calculation. To compensate for the conditions of the SEA and the frequency band limitation of manufacturer data, trend-extension processing was performed for certain frequency bands. This step, combined with the front underwater acoustic radiation evaluation of the ship's low-frequency band, yielded the URN curve of the whole ship (Figure 16). Meanwhile, the silent a and silent s calibration curves of the DNV GL (2018) underwater noise standards are illustrated in the same graph. The evaluation result in the frequency band of 1 000–3 150 Hz was marginally higher than the reference curve.
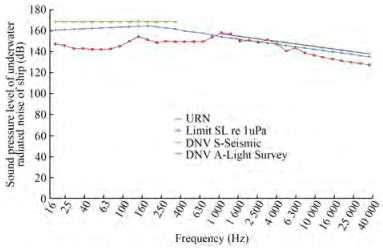 Figure 16 Sound pressure level of full-frequency-band URN of the ship
To better analyze the source of exceeding the standard, Figure 17 depicts an analysis of the contribution of each main noise source of the ship to the URN. The pod is the main contributor to the URN, followed by the propeller noise. The air noise of the generator set excites the hull vibration, and the radiated sound energy therefrom is the third-largest noise source. In contrast, the contribution of the pump set to the URN is relatively small.
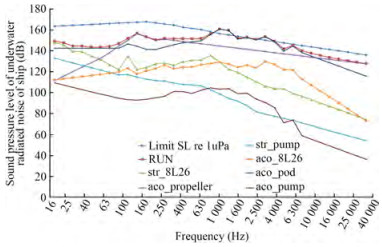 Figure 17 Contribution analysis of ship URN
The evaluation of the full-frequency-band underwater acoustic radiation of the mother ship revealed that it satisfies the technical specifications. During construction of the model, the generator set was installed with double-layer vibration isolation and floating-raft vibration isolation. The mechanical and air noise of the equipment itself was greatly reduced. The underwater radiation noise was also reduced. The ultra-high frequency band of 1 000–3 150 Hz occurred mainly because of the large noise of the pod. Considering the independence and tightness of the pod design, the implementation of passive noise-reduction measures may be difficult. This noise can be reduced by reasonably adjusting the working frequency of the pod on the premise of ensuring its propulsion function. Meanwhile, the engine room will require the incorporation of insulating and sound-absorbing materials with a certain thickness and damping materials on the plate and shell to suppress the vibration of the plate and further reduce the noise radiation of the ship.
5 Analysis of URN navigation test of ships
To verify the accuracy of the method of analyzing the URN level of the ship through finite element software simulation before the construction of the actual ship, the URN navigation test was performed ship after construction of the ship based on the national standards and requirements of CCS.
5.1 Test method
The measurements for the test were performed according to the single hydrophone method in the CCS guidelines for the URN of ships (2018). The measurement frequency range was 10 Hz – 40 kHz (1/3oct), and the subsequent frequency band (50 – 100 kHz) was extended according to the slope of the test results. The layout of the hydrophone is shown in Figure 18. The ship was maneuvered away from the hydrophone. Meanwhile, the hydrophone measured and recorded the background noise, after which the URN navigation test was performed.
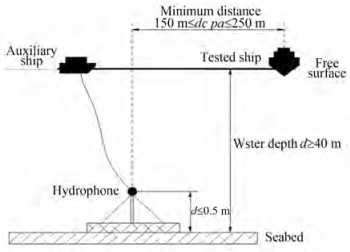 Figure 18 Layout diagram of hydrophone
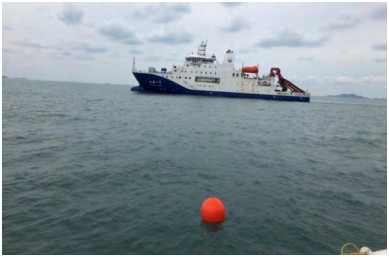 Figure 19 URN Test of the ship
5.2 Test conditions
The vessel did not tow any objects and sailed along a fixed course in the East China sea near Zhoushan for URN testing (Figure 22). The wind speed was 3.5 m/s, the wind force was level 1, and the sea condition was level 2. Table 3 lists the ship operational parameters measured during the URN test.
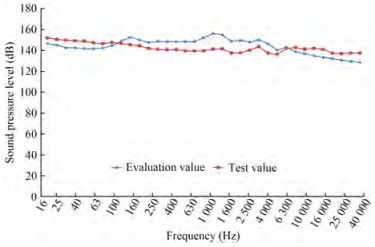 Figure 22 URN assessment vs. measured dataTable 3 Survey voyage and ship operation
No. Time start/end Log speed (kn) Unit power (kW) Pod speed (r/min) Left/right Pod power (kW) Left/right 1 0 936/0 945 11 1# & 2# 1 220 117/117 400/390 2 0 950/0 953 11 1# & 2# 1 150 117/117 380/350 3 1 000/1 006 11 1# & 2#900 120/120 280/220 4 1 015/1 018 11 1# & 2#1 100 120/120 380/290 5 1 027/1 032 11.4 1# & 2#1 200 120/120 420/360 6 1 038/1 042 11.8 1# & 2#1 200 120/120 420/360 5.3 Test system and instrument
The URN test system is depicted in Figure 20, which includes a hydrophone, signal amplifier, data analyzer, computer, hydrophone support, nylon rope, floating ball, counterweight, distance meter, and other instrumentation. Table 4 displays the instrumentation.
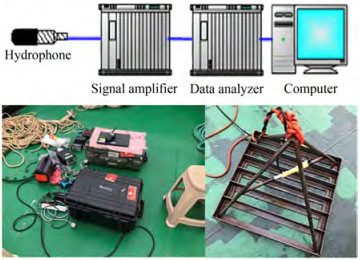 Figure 20 URN Test systemTable 4 Measurement instruments and equipment
Instrument Trademark Model Product number Hydrophone Denmark B & K 8105-M-100 3 097 852 Signal amplifier Denmark B & K 2692-014 2 589 185 Signal acquisition and analysis system Denmark B & K 3052-A-030 105 228 5.4 Data processing method
The hydrophone data were recorded as one sample. The background noise and propagation loss were corrected according to the sound pressure level of 1/3 octave band. The band sound pressure level of each 1/3 octave band was corrected as follows:
The arithmetic mean value of background noise is calculated according to the following formula:
$$ L_n=\frac{L_{n, s}+L_{n, e}}{2} $$ where Ln, s is the sound pressure level of the background noise band measured by the hydrophone before measurement; and Ln, e is the sound pressure level after measurement.
Change in the background noise recorded before and after measurement is as follows:
$$ \Delta L_n=\left|L_{n, s}-L_{n, e}\right| $$ The difference between the original underwater noise sound pressure level (including background noise) and the background noise is calculated as follows:
$$ \Delta=L_{p n}-L_n $$ For all 1/3 octave bands:
When Δ is more than 10 dB, the background noise correction is not required;
When 3 < Δ < 10 dB and adequately stable, the background noise is corrected according to the following formula:
$$ L_p=10 \lg \left(10^{\frac{L_{p n}}{10}}-10^{\frac{L_n}{10}}\right) $$ where Lp is the band sound pressure level corrected by the background noise.
The error caused by the background noise correction is calculated from the following formula:
$$ \text { Error }=10 \lg \left(\frac{1-10^{\frac{-\Delta}{10}}}{1-10^{\frac{-\Delta+\Delta L_n}{10}}}\right)<2 \mathrm{~dB} $$ When the error caused by the background noise correction is greater than 2 dB, the measurement is invalid.
When Δ ≤3 dB, it must be re-measured.
To obtain the underwater noise sound pressure level 1 m from the reference distance of the sound source, the propagation loss caused by the sound propagation in the water must be considered, and the distance propagation loss of the underwater noise sound-pressure level must be corrected according to the following formula:
$$ \begin{gathered} L_{p o}=L_p+L_T \\ L_T=18 \lg r \end{gathered} $$ where Lpo is the underwater noise sound-pressure level 1 m from the reference distance of the sound source after distance correction; r is the distance between the sound source and the hydrophone.
Notably, when the water depth at the survey site is greater than 100 m,
$$ L_T=20 \lg r $$ In addition, considering the reflection effects of the free surface and seabed, the sound pressure level of each 1/3 octave band should be corrected by − 5 dB. And the data collection time is 4 minutes.
The selection of empirical formula of transmission loss, "− 5 dB correction" and "4 minutes" are all based on the CCS guidelines for the URN of ships (2018).
5.5 Analysis of test results
Figure 21 illustrates the URN of the mother ship in the 1/3 octave frequency range at a speed of 11kn. The figure reveals that the measured underwater radiation noise of this ship meets the requirements of CCS-URN2 and can apply for the CCS Underwater Noise 2 Certificate.
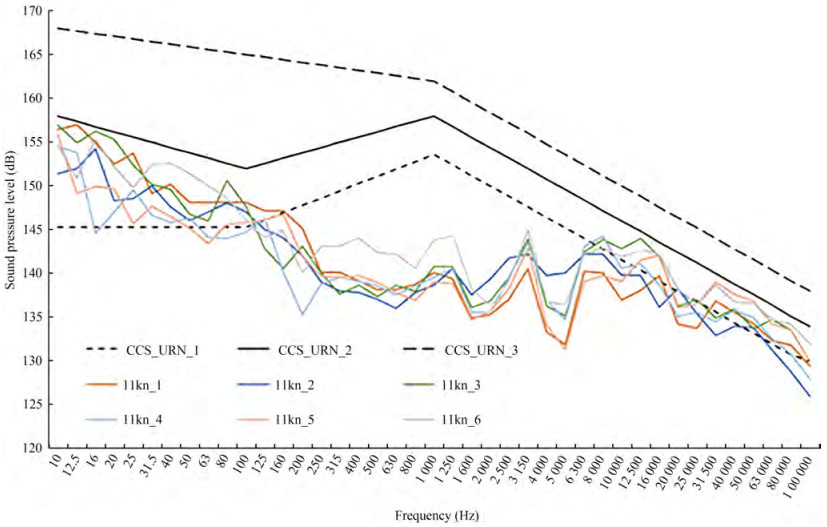 Figure 21 One-third octave frequency chart of URN at a speed of 11 kn
Figure 22 illustrates the URN assessment vs. measured data. As indicated in the figure, the measured value of the URN of the mother ship is equivalent with the evaluation result and the trend is close, with average sound pressure levels of 141.795 and 143.674 dB, respectively. That verified the accuracies of the combination of FEM and BEM to evaluate the underwater acoustic radiation in the low-frequency band and SEA to evaluate the radiation in the medium- and high-frequency bands. One cause of simulation error is that the part of the noise loaded calculation was obtained through empirical formula or comparison with similar classes of ships. The second cause is that the influence of external factors, e.g., wind, sea water, and occasional door opening and closing sounds, was not considered. The third reason is that the acoustic model was simplified, and certain small structures were ignored.
6 Conclusions
Requirements for the URN of ships for scientific research have burgeoned. This study calculates the low-frequency URN of a submersible-supporting mother ship using a combination of FEM and BEM, and calculates the medium- and high-frequency URNs of the ship based on the SEA, Thus, it obtains the full-frequency URN of the ship, locates the position at which risk of exceeding the standard is imminent, and proposes a targeted vibration-and noise-reduction scheme. After model construction, the ship was sailed with URN sources onboard. Thus, the accuracy of the evaluation results was verified. The major conclusions of the study are as follows:
1) A comparison of the navigation test data, the accuracies of the combination of FEM and BEM to evaluate the underwater acoustic radiation in the low-frequency band and SEA to evaluate the radiation in the medium- and high-frequency bands are basically accurate.
2) In the design stage, a comprehensive analysis of the noise sources of URN produced by the ship and the prediction of URN are conducive to improving the structure and determining effective vibration- and noise-reduction schemes. This will provide a schematic reference for URN control.
3) According to the national standards and requirements of the CCS, the URN navigation test is performed on the ship after construction. The measured URN level of the ship met the requirements of CCS-URN-2. The ship is eligible for the CCS Underwater Noise 2 certificate.
Competing interest The authors have no competing interests to declare that are relevant to the content of this article. -
Figure 1 Manned submersible support mother ship, Shen Hai Yi Hao
Figure 2 Finite element model (FEM) of the ship structure
Figure 3 Sound pressure level of underwater radiated noise (URN) at low-frequency bands of a ship
Figure 4 Three-dimensional outline of cabin noise acoustic model
Figure 5 URN Calculation cavity
Figure 6 Calculation model of URN
Figure 7 Vibration speed level of hull base of 4L20 generator set
Figure 8 Vibration speed level of hull base of 8L26 generator set
Figure 9 Air noise data of the generator set
Figure 10 Exhaust noise data of the generator set
Figure 11 Pod air noise data
Figure 12 Propeller air noise data
Figure 13 Vibration speed level of telescopic rotary propeller
Figure 14 Propeller air noise data
Figure 15 Sound pressure level data of air conditioning unit
Figure 16 Sound pressure level of full-frequency-band URN of the ship
Figure 17 Contribution analysis of ship URN
Figure 18 Layout diagram of hydrophone
Figure 19 URN Test of the ship
Figure 22 URN assessment vs. measured data
Figure 20 URN Test system
Figure 21 One-third octave frequency chart of URN at a speed of 11 kn
Table 1 Parameters of Shen Hai Yi Hao
Ship type Submersible support mother ship Total hull length, Loa (m) 90.2 Length between vertical lines, Lbp (m) 8.4 Profile width, B (m) 16.8 Shape depth, H (m) 8.3 Design speed (kn) 16 Service speed (kn) 12 Staffing (P) 60 Table 2 Parameters of main power equipment
No. Equipment Name Parameters 1 No. 1 & 2 Main diesel generator set Diesel engine model Wärtsilä 8L26 Continuous power (kW) 2 600 Quantity 2 Continuous speed (r/min) 1 000 2 No. 3 & 4 Main diesel generator set Diesel engine model Wärtsilä 4L20 Continuous power (kW) 800 Quantity 2 Continuous speed (r/min) 1 000 3 Full swing pod electric propulsion Quantity 2 Type Fixed pitch propeller Design power (kW) 2 500 Propeller diameter (m) 3 Number of blades 5 Speed (r/min) 0~310 4 Bow thruster Quantity 1 Design power (kW) 800 Propeller diameter (m) 1.7 Table 3 Survey voyage and ship operation
No. Time start/end Log speed (kn) Unit power (kW) Pod speed (r/min) Left/right Pod power (kW) Left/right 1 0 936/0 945 11 1# & 2# 1 220 117/117 400/390 2 0 950/0 953 11 1# & 2# 1 150 117/117 380/350 3 1 000/1 006 11 1# & 2#900 120/120 280/220 4 1 015/1 018 11 1# & 2#1 100 120/120 380/290 5 1 027/1 032 11.4 1# & 2#1 200 120/120 420/360 6 1 038/1 042 11.8 1# & 2#1 200 120/120 420/360 Table 4 Measurement instruments and equipment
Instrument Trademark Model Product number Hydrophone Denmark B & K 8105-M-100 3 097 852 Signal amplifier Denmark B & K 2692-014 2 589 185 Signal acquisition and analysis system Denmark B & K 3052-A-030 105 228 -
China Classification Society (2018) Guide for underwater radiated noise of ships, China Det Norsk Veritas (2018) DNV-GL Rules for Classification, Norway Fu J, Wang YS, Ding K, Wei YS (2015) Research on vibration and underwater radiated noise of ship by propeller excitations. Journal of Ship Mechanics, 19(4): 470-476. https://doi.org/10.3969/j.issn.1007-7294.2015.04.016 He WP, Chen MX, Gao J, Chen QK (2008) Numerical analysis of middle-high frequency vibration and sound radiation from a ring-stiffened cylindrical shell by SEA. Chinses Journal of Ship Research, 6(3): 7-12 http://en.cnki.com.cn/Article_en/CJFDTOTAL-JCZG200806006.htm Huang R, Wu G (2020) Analysis of underwater radiated noise of polar icebreaking research vessel. Journal of Unmanned Undersea Systems, 28(4): 370-375. https://doi.org/10.11993/j.issn.2096-3920.2020.04.003 Li B, Dai J, Miao JL, Lin L (2010) Research on fast predict method for underwater radiation noise. Ship Science and Technology, 32(10): 54-56. https://doi.org/10.3404/j.issn.1672-7649.2010.10.014 Li Q, Yang DQ, Yu Y (2018) Numerical methods for ship underwater sound radiation in low frequency domain with vibro-acoustic coupling. Journal of vibration and shock, 37(3): 174-179. https://doi.org/10.13465/j.cnki.jvs.2018.03.028 Li Q, Yang DQ, Yu H (2019) A computational method for underwater sound radiation of surface ships considering the free surface wave shape. Journal of Ship Mechanics, 23(11): 1394-1403. https://doi.org/10.3969/j.issn.1007-7294.2019.11.014 Liu ZZ, Jiang GH, Sun JH, Chen G, Yuan SS (2020) Contribution rate of excitation sources of a X·Bow type of polar exploration cruise to their underwater acoustic radiation. Shipbuilding of China, 61(4): 150-163. https://doi.org/10.3969/j.issn.1000-4882.2020.04.017 Lu XK, Zou LR, Chen XB, Li JB (2021) Analysis and application of underwater radiation noise control measures for research vessel. Zaochuan Jishu, 49(6): 50-54. https://doi.org/10.12225/j.issn.1000-3878.2021.06.20210610 Rong XC (2006) Finite element method. Southwest Jiaotong University Press Wang GZ, Tang ZY, Hu YC (2012) Research on underwater acoustic forecast and reduction of noise and vibration for a survey ship. Journal of Jiangsu University of Science and Technology(Natural Science Edition), 26(2): 118-122. https://doi.org/10.3969/j.issn.1673-4807.2012.02.003 Wang JZ, Qiu P (2014) A calculation method for structural noise radiation of underwater cylindrical shell based on FEM/BEM. Ship Science and Technology, 36(9): 50-54. https://doi.org/10.3404/j.issn.1672-7649.2014.09.010 Wang WG, Hou P, Wu D, Li GY, Fan YM, Wang Y (2021) Research on horizontal directivity measuring method of ship underwater radiated noise. Ship Science and Technology, 43(11): 149-153. https://doi.org/10.3404/j.issn.1672-7649.2021.11.028 Wang XX, Liu JH (2013) Control analysis of underwater radiation noise for surface ship. Ship & Boat, 24(1): 36-39. https://doi.org/10.3969/j.issn.1001-9855.2013.01.007 Wang XJ, Shan YH, Qin XH, Gao SY (2018) A fast prediction method for underwater radiation noise from ships. Noise and Vibration Control, 38(5): 75-80. https://doi.org/10.3969/j.issn.1006-1355.2018.05.014 Wu GQ, Lin J (2020) Tests for underwater radiated noise transmission characteristics caused by ship cabin air noise excitation. Journal of Vibration and Shock, 39(21): 42-46. https://doi.org/10.13465/j.cnki.jvs.2020.21.006 Yao DY, Wang QZ (1995) Principle and application of statistical energy analysis. Beijing University of Technology Press Zhu DH (2018) A Characteristics of underwater noise and stern structure optimization for SWATH ship.Ship Science and Technology, 40(12): 44-48. https://doi.org/10.3404/j.issn.1672-7649.2018.12.009