Large Eddy Simulation of Flow and Separation Bubbles Around a Circular Cylinder from Sub-critical to Super-critical Reynolds Numbers
https://doi.org/10.1007/s11804-023-00343-9
-
Abstract
A large eddy simulation of wall-adapting local eddy-viscosity model (LES-WALE) is used to simulate the three-dimensional flow around a circular cylinder with a diameter of 0.25 m from sub-critical to super-critical Reynolds numbers at 1×10⁵, 2.5×10⁵, and 7.2×10⁵, respectively. The present results such as drag crisis, surface pressure distribution, and Strouhal number are in good agreement with the classical experimental data. When entering the critical region, a small plateau was found on the pressure distribution curves, corresponding to the appearance of laminar separation bubbles, and the separation point is delayed and the recirculation bubbles become narrowed and shortened. The tangential velocity of the cylinder surface changes from positive to negative at the separation point. The instantaneous vorticity and time-averaging separation bubbles embody an unstable feature. Within the separation bubble, the pressure varies dramatically with time, but not with position. The surface pressure fluctuates greatly after the laminar separation bubble appears, and it is gradually stabilized until the basic pressure is reached. The process of laminar separation, transition from laminar flow to turbulent flow and turbulent reattachment is also shown. The three-dimensional Q criterion of vortex structure and the two-dimensional spanwise vorticity reveal the phenomenon that the wake structure narrows with the increase of the Reynolds number.Article Highlights• Flow and separation bubbles around a circular cylinder with diameter of 0.25 m was studied with LES-WALE model.• Those from sub-critical to super-critical Reynolds numbers were addressed.• Characteristics of drag crisis, recirculation bubbles and wake structures are revealed.• Mechanism of LSB is detailed revealed. -
1 Introduction
The circular cylinder is a very common structure in offshore engineering applications, such as drilling platform risers, piers, cables, submarine pipelines, etc. Those real engineering structures often suffer very high Reynolds number current environment. The study of flow around a cylinder in the critical Reynolds number is of great engineering significance. The alternating shedding of fluid through the cylinder leads to large pressure pulsations in both cross flow and in line directions. Williamson (1996) pointed out that the action of these forces can cause vibration, noise and resonance of the structure, and even fatigue failure. Compared with the flow in the sub-critical region, Ding et al. (2004) and Raghavan and Bernitsas (2011) pointed out that the flow of marine engineering structures in the critical Reynolds number region will cause huge vibrations, which greatly increases the safety hazards of marine engineering. Studying subcritical to critical to supercritical flows is helpful to provide guidance on avoiding such safety incidents.
The flow around a cylinder at the critical Reynolds number contains many complex features such as flow separation, turbulent transition, re-attachment and turbulent boundary layer separation. These complex flows lead to some typical phenomena, such as the delay of separation point, the appearance of laminar separation bubble (LSB), the shift of wake vortex structure, the sudden drop of drag coefficient on cylinder surface (drag crisis) and the increase of the non-dimensional vortex shedding frequency (Strouhal number, St).
The critical region can be defined by the variation of the drag coefficient and the range of the Reynolds number. For sub-critical region, 3 × 10² < Re < 2 × 10⁵, Cd stays around 1.2. Wake topology remains almost unchanged in this region (Williamson, 1996). For critical region, 2 × 10⁵ < Re < 3.5 × 10⁵, Cd drops rapidly to its lowest point Cd ≈ 0.2. For super-critical region, 3.5 × 10⁵ < Re, Cd stays around 0.2~0.6.
The research methods commonly used experimental study and numerical simulation. In experimental studies, Achenbach (1968) reported a reduction in Cd from 1.02 to 0.4 at Re from 6 × 10⁴ to 5 × 10⁶, and a change in the separation point angle φ from 95° to 140°. Roshko (1961) studied the hydrodynamic characteristics in the super critical region for 106 < Re < 107, when Re = 106, Cd is 0.3. However, at his measuring station, vortex shedding was not observed at Re < 3.5 × 10⁶. When Re > 3.5 × 10⁶, St =0.27. Bearman (1969) measured flows around a cylinder at Re ranging from 2 × 10⁵ to 4 × 10⁵. He reported a drop in the drag coefficient from 1.14 (sub-critical) to 0.45 (critical) and to the minimum of 0.23 (super-critical), St is 0.18, 0.23 and 0.46, respectively. He discovered three flow patterns: no bubble, one bubble, two bubbles in different Re regions. Farell and Blessmann (1983) summarized the characteristics of sub-critical and critical regions: symmetric pressure distributions and intense vortex shedding for sub-critical region, intense flow oscillations associated with formation and bursting of laminar-separation bubbles for critical region. Schewe (1983) observed two discontinuous transitions within the critical Reynolds number range: Cd dropped to 0.52 and then to 0.22, and St increased to 0.3 and then to 0.48. The asymmetric flow and formation of one bubble on one side of the cylinder in the critical range are caused by the fact that boundary-layer transition from laminar to turbulent occurred on only one side of the cylinder. Kamiya et al. (1979) also reported three flow patterns: 1) no bubbles, Cd is about 1 and Cl is essentially zero. 2) one bubble, Cd is about 0.4 and Cl is not equal to zero. 3) two bubbles, Cd is about 0.2 and Cl is essentially zero. Pfeil and Orth (1990) investigated the effect of inlet disturbances on separation bubbles and flow transition in critical region.
In numerical simulation, a large number of studies have adopted the unsteady Reynolds Averaged Navier-Stokes (URANS) methods to solve the Navier-Stokes equations. URANS methods require fewer computing resources and provide satisfactory results in laminar flow state and sub-critical region. Benim et al. (2007) and Ong et al. (2009) used URANS methods to study the flow around a cylinder in sub-critical and critical regions, a good agreement of Cd and St was attained at sub-critical region, but underestimated the drop of Cd and overestimated St in critical region. Ye and Wan (2017) used URANS methods with the overset grid approach to study flow characteristics over a wide range of Re. They also failed to provide an accurate quantitative prediction of the sharp changes in critical region. In order to get more accurate predictions, some studies have used the Detached Eddy Simulation (DES) in which RANS is used in the near wall and Large Eddy Simulation (LES) is used in the far field. You and Kwon (2010) conducted the comparisons between URANS and DES methods for the simulation of high Reynolds number. The flow fields are less dissipative and more realistic in the DES methods.
Direct numerical simulation (DNS) is not currently feasible at such large Reynolds numbers. LES gives more accurate results than URANS and DES in predicting the drop of Cd and capturing complex fluid behaviors in the critical region. Some studies using LES have obtained more reliable results. Ono and Tamura (2008) obtained more accurate Cd = 0.2~0.4 and St = 0.42~0.48 for Re = 6 × 10⁵, successfully simulated the fragmentation of separated bubbles, and analysed the development and separation of boundary layer turbulence along the surface of the cylinder in the reattachment region. Breuer (2000) reported that the recirculation length of critical Re is much shorter than for sub-critical Re. Laminar separation angle θ = 91.45°, which is consistent with the experiment dates of Achenbach (1968) and Son and Hanratty (2006). Achenbach (1968) found that the boundary layer separates laminarly at φ = 78° for Re = 105, and φ = 94° for Re = 2.6 × 10⁵. Lehmkuhl et al. (2014) showed a drop of Cd that matched well with experiments, Cd = 0.833 for Re = 2.5 × 10⁵, and drop to Cd = 0.232 for Re = 6.5 × 10⁵. Span wise two-point correlations have been used to decide a span-wise length. The span-wise length of 0.5πD seems to be acceptable for Re = 2.5 × 10⁵. Flow average streamlines showed the position of laminar separation bubbles at different Reynolds numbers. It is worth noting that only one bubble on the bottom side of the cylinder is detected at Re = 2.5 × 10⁵. This asymmetric flow feature is also found in Rodriguez et al. (2014). The flow transition to turbulence on one side of the cylinder results in this single bubble and asymmetric pressure distribution phenomenon, which has also been reported in experiments of Schewe (1983). However, this asymmetric flow has not been confirmed in other numerical simulations. The wake width dw/D at Re = 3.8 × 10⁵ is narrower than at Re = 2.5 × 10⁵ being about dw/D = 0.675. And dw/D > 1 for subcritical Re. Kelvin-Helmholtz (KH) instabilities frequency increases with the Reynolds number (Bloor Susan, 1964). The ratio of KH instabilities frequency to the vortex shedding (fKH /fvs) is correlated with Re0.67, which matches quite well with the scaling obtained by Prasad and Williamson (1996). Yeon et al. (2016) gave the positions of laminar separation, turbulent transition, turbulent reattachment and turbulent separation at different Reynolds numbers. The law of minimum pressure and basic pressure was analyzed. The shedding vortices are apparent for the sub-critical Re but blurred for critical and super-critical Re.
Based upon the above studies review, we think that the drag crisis phenomenon of flow around a cylinder for the critical Re flow has reached a broad agreement in many experiments and numerical simulations, and satisfactory prediction results have been obtained by LES. However, the behavior and structure of some tiny vortices need in-depth study. In particular, studies on the emergence, development and characteristics of laminar separation bubbles and recirculation bubbles are lacking. The processes of laminar separation, transition to turbulent flow, and turbulent reattachment are also unclear. The variation of these typical features and behaviors in the critical Reynolds number region requires further study.
In this study, the flow around a cylinder is simulated by LES with sub-grid scale models in sub-critical, critical and supercritical regions. The distribution of pressure coefficient (Cp), drag coefficient (Cd), lift coefficient (Cl) and vortex shedding frequency (St) were compared under different Reynolds numbers. The characteristics of wake topology, such as recirculation bubbles, laminar separation, turbulent transition, turbulent reattachment, etc., are analyzed by means of average flow field and instantaneous calculation results. The appearance, characteristics and pulsatile unsteadiness of laminar separation bubbles in the critical region are analyzed. Laminar flow separation, transition from laminar flow to turbulent flow, and turbulent flow reattachment are demonstrated through separation bubbles. The separation bubble was further studied, the mechanism of the separation bubble was revealed, the temporal and spatial instability of the separation bubble was found, and the characteristics of the formation of the separation bubble and the pressure changes before and after were shown. The results are compared with experimental results and previous studies, and the reliability of the calculated results is confirmed.
2 Numerical methods and scheme
In order to accomplish the Large Eddy Simulations, two steps need to be completed: first, the filtering function is established to filter out the vortices with smaller scale than the filtering function from the instantaneous motion equation of turbulent flow. And then the motion equation of large eddy field is obtained. The filtered small vortices are represented by inserting subgrid scale (SGS) stress into the motion equation of large eddy field. The second is to establish the SGS model. The spatially filtered Navier–Stokes equations for the incompressible viscous flow with constant density and viscosity can be written as,
$$ \frac{\partial \bar{u}_i}{\partial t}+\frac{\partial \bar{u}_i \bar{u}_j}{\partial x_j}=-\frac{1}{\rho} \frac{\partial \bar{p}}{\partial x_i}+v \frac{\partial^2 \bar{u}_i}{\partial x_j \partial x_i}-\frac{\partial T_{i j}}{\partial x_j} $$ (1) $$ \frac{\partial \bar{u}_i}{\partial x_i}=0 $$ (2) where the subgrid scale stress tensor equation Tij = uiuj-uiuj. < ⋯ > means the filtered parameter, for example, p is the filtered pressure. ρ is the density of the fluid and v is the kinematic viscosity of the fluid. xi is the spatial position in the i direction, t is the flow time.
Based on our simulation comparisons for different turbulence model, here a subgrid scale models based on an eddy-viscosity assumption to model the subgrid scale tensor is selected, that is wall-adapting local eddy-viscosity model (LES-WALE) (Nicoud and Ducros 1999):
$$ T_{i j}-\frac{1}{3} T_{k k} \delta_{i j}=2 v_{\mathrm{SGS}} \overline{S_{i j}} $$ (3) where the deformation tensor of the resolved field Sij = (gij + gji)/2, the velocity gradient tensor gij = ∂ui/∂xj. δij is the Kronecker delta. WALE model is an adaptive numerical model developed by Nicoud and Ducros (1999) at the local viscosity wall, which is suitable for the calculation in the more complex geometric region. Based on the square of the velocity gradient tensor, the strain and rotation rate of the minimum soluble turbulence pulsation are affected. Moreover, good results of vortex viscosity can be obtained without dynamically determining Smagorinsky constant (Smagorinsky, 1963) near the wall surface, and the vortex kinematic viscosity is defined as follows:
$$ v_{\mathrm{SGS}}=\left(C_W \Delta\right)^2 \frac{\left(S_{i j}^d S_{i j}^d\right)^{3 / 2}}{\left({\bar{S_{i j}}} {\bar{S_{i j}}}\right)^{5 / 2}+\left(S_{i j}^d S_{i j}^d\right)^{5 / 4}} $$ (4) where CW is the model coefficient, CW = 0.325 is used. ∆ is the filtration scale. Sijd is the traceless symmetric part of the square of the velocity gradient tensor. Sijd = (gij2 + gji2-δijgkk2/3, where gij2 = gikgki.
LES-WALE model based on the square of the velocity gradient tensor has the following advantages compared to the classical Smagorinsky formulation: first, the spatial operator consists of a mixing of both the local strain and rotation rates. Thus, all the turbulence structures relevant for the kinetic energy dissipation are detected by the model; second, this model produces zero eddy viscosity in case of a pure shear. Thus, it is possible to reproduce the laminar to turbulent transition process through the growth of linear unstable modes. Third, the eddy-viscosity goes naturally to zero in the vicinity of a wall so that neither (dynamic) constant adjustment nor damping function are needed to compute wall bounded flows. LES-WALE model provides a very reliable turbulence model for calculating the flow around a cylinder in the critical region of the transition from laminar to turbulent flow with wall-separated flow.
All the numerical simulations are carried out using the transient pressure-based solver provided by FLUENT 19.2. Issa (1991) pointed that the PISO scheme has more advantages in calculating transient flow field, which is adopted for pressure velocity coupling. In the spatial discretization scheme, least squares cell based is used for gradient, second order is used for pressure and bounded central differencing is used for momentum. The transient formulation used second order implicit to obtain a more accurate solution in complex flows.
3 Setting of the case and conditions
Three characteristic Reynolds numbers were selected in sub-critical, critical and super-critical regions: Re = 1 × 10⁵, Re = 2.5 × 10⁵ and Re = 7.2 × 10⁵, respectively. The cylinder's centre (x, y, z) = (0, 0, 0) is in the origin of the coordinate system. The in-line, cross-flow and spanwise directions correspond to X, Y and Z directions, respectively. The size of the computational domain in Y direction being of y = [ − 10D, 10D], therefore, the blockage ratio is 5%, satisfying the requirement that the blockage ratio less than 6% has negligible effect on the results (West and Apelt 1982). The size of the computational domain in X direction being of x = [ − 10D, 25D]. Yeon et al. (2016) pointed out that for the critical and supercritical regions, the results of the small aspect ratio (LZ /D < 2) of the cylinder are more accurate. Based on the correlation analysis of the velocity at different positions of the cylinder, Lehmkuhl et al. (2014) and Rodriguez et al. (2014) concluded that the length of the cylinder LZ of 1D for Re = 7.2 × 10⁵ was acceptable. The spanwise width here is set to be 0.5πD, which should be enough according to the studies of Yeon et al. (2016), Lehmkuhl et al. (2014) and Rodriguez et al. (2014). Considering the real size and working conditions of most risers in marine engineering, the diameter of the cylinder is set to be D = 0.25 m, with a uniform inflow of Re = 1 × 10⁵, Re = 2.5 × 10⁵ and Re = 7.2 × 10⁵. Freestream density and dynamic viscosity equal to ρ = 998.2 kg/m3 and μ = 1.003 × 10⁻³ kg/ms.
A structured O-block mesh is adopted which is compact at the near wall and sparse at the far field. In order to capture the characteristics of laminar separation, turbulent transition and reattachment near the cylinder wall, the grid of the wall needs to be dense enough. In the flow field behind the cylinder, there are small scale vortices accompanied by strong vortex shedding, and the grid should be denser. In the flow field region far from the cylinder, the change of the flow field is no longer drastic, and the hydrodynamic influence on the cylinder is negligible. The grid can be loosened to save computing resources. Furthermore, it is worth noting that the boundary layer at the cylinder surface needs to be well resolved, and there are no wall functions used in LES-WALE. Thus, the mesh is designed to keep the non-dimensional wall distance y+ < 1. Figure 1 shows the near-wall mesh and y+. The number of single-layer grids is about 1.7 × 10⁵. The density independence of the mesh in Z direction was verified, and 20, 40, and 50 layers were selected in the span direction. Table 1 shows hydrodynamic coefficients of different spanwise layers. The results of calculation at the 40 spanwise layers are relatively scattered, while those at the 20 and 50 layers are relatively consistent. The total number of grids for 50 layers is 8.3 million, which is 2.5 times the total number of grids for 20 layers of 3.4 million, but there is no significant difference between the calculation results of 20 layers and 50 layers. Considering the accuracy of the calculation results and the acceptable number of grids, a mesh with a span of 20 layers was selected for further study.
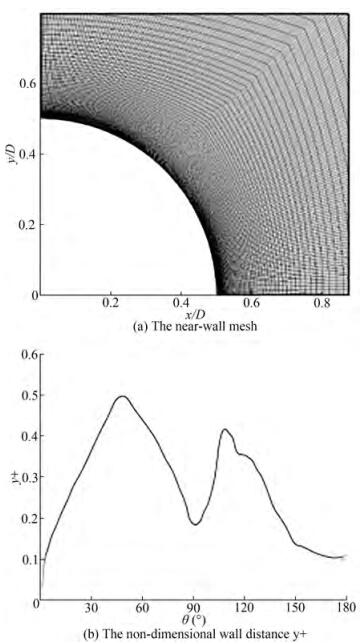 Figure 1 The near-wall mesh and the non-dimensional wall distance y+Table 1 Hydrodynamic coefficients of different spanwise layers
layer Cd Clrms St 20 0.36 0.16 0.30 40 0.32 0.11 0.33 50 0.33 0.14 0.29 In the present study, the boundary conditions consist of uniform velocity without perturbations at the velocity-inlet, gauge pressure equal to zero at the pressure-outlet. And symmetry conditions at the top, bottom, front and back boundaries of the computational domain. On the surface of the cylinder, the static and no-slip wall condition is adopted.
4 Results
4.1 Hydrodynamic coefficient and pressure distribution
When the calculation is stable, 20 vortex cycles are used for data analysis to compare the hydrodynamic coefficient and pressure distribution. Figure 2(a)-(d) show the drag coefficient Cd, RMS lift coefficient Clrms, Strouhal number St and the negative base pressure coefficient − Cpb against Re. The present data were compared with several experiment measurements from Fage (1931), Vaz et al. (2007), Wieselsberger (1921), Schewe (1983), Achenbach (1968), Szepessy and Bearman (1992), Norberg (2003) and Bearman (1969) and simulation results from Cheng et al. (2017), Rodriguez et al. (2014) and Yeon et al. (2016). Table 2 shows the present calculation of Cd, Clrms and St at three characteristic Reynolds numbers.
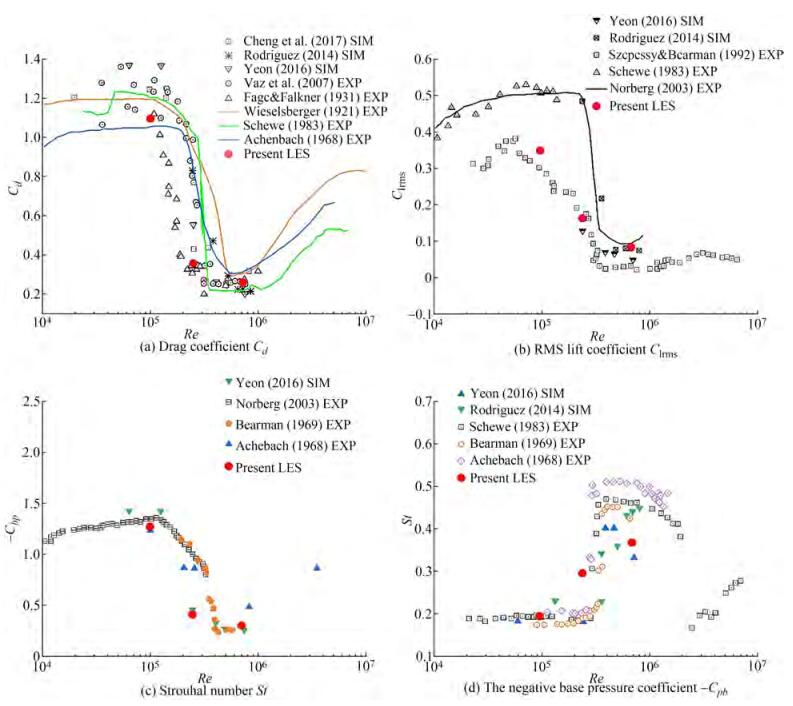 Figure 2 Hydrodynamic coefficient against ReTable 2 The present LES results of Cd, Clrms and St
Re Cd Clrms St 1×10⁵ 1.10 0.35 0.20 2.5 × 10⁵ 0.36 0.16 0.30 7.2 × 10⁵ 0.26 0.08 0.38 In the figure of drag coefficient Cd changing with Re, it is obvious that Cd decreases from 1.10 to 0.26. Cd drops sharply in the critical region. The present LES successfully predicts the drag crisis. The results are very close to those measured by Fage (1931). The present LES underestimated Clrms of the experimental results of Szepessy and Bearman (1992) and Norberg (2003), but it is close to experimental results of Schewe (1983). Clrms also decreases significantly, and in the super-critical region, Clrms is almost 0. Figure 2(c) shows the variation of − Cpb with Re. Cpb is the pressure coefficient downstream of the cylinder (pressure coefficient at θ = 180°, θ is clockwise from the stagnation point in front of the cylinder). In the critical region, − Cpb also drops sharply. The pressure coefficient Cp at the stagnation point in front of the cylinder is always equal to 1, − Cpb dropped from 1.26 to 0.28, which means that the difference between the pressure coefficients of the two points before and after the cylinder is also reduced the same value. This is consistent with the drop of Cd from 1.1 to 0.26. The change of the pressure difference before and after the cylinder surface is reflected in the decrease of Cd with the change of Re.
Figure 2(d) shows the dimensionless vortex shedding frequencies St at three characteristic Reynolds numbers. It is evident that St increases as the Reynolds number increases. When Re = 7.2 × 10⁵, St is equal to 0.38, which is less than the value of 0.45~0.53 observed in the experiment. When Re = 2.5 × 10⁵, St =0.30 overestimates the experimental results of Achenbach (1968) and Bearman (1969). The reason for the over prediction of St for Re = 2.5 × 10⁵ is that the present LES shows the flow enters the critical region in advance. And the flow on both sides of the cylinder transitions from laminar flow to turbulence, and the frequency increases in advance.
There are significant differences in pressure distribution in different Re regions. Figure 3(a)~(c) shows pressure distribution curves at three characteristic Reynolds numbers Re = 1 × 10⁵, Re = 2.5 × 10⁵ and Re = 7.2 × 10⁵. The experimental data of Cantwell and Coles (1983), Roshko (1961) and Spitzer RE (1965) are added for comparison. The pressure distribution at all three Reynolds numbers is quasi-symmetric, so only the pressure distribution at θ = 0~180° is shown. Table 3 shows the minimum pressure coefficient Cpmin, the angle at which the minimum pressure occurs θcpm and base pressure coefficient Cpb at different Re.
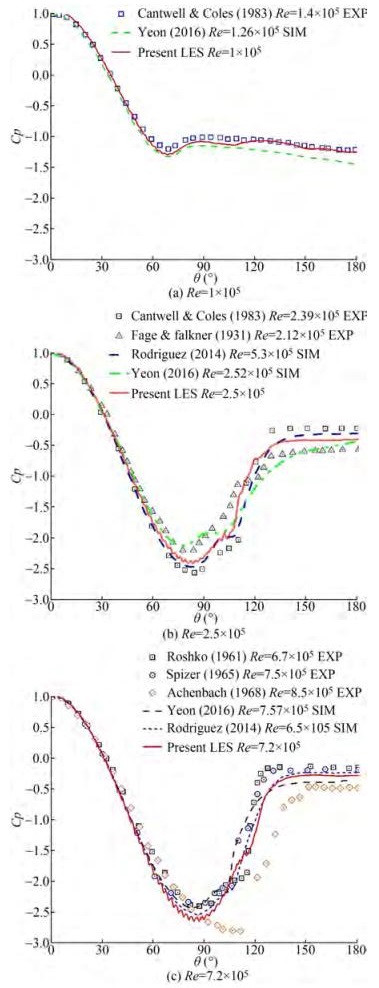 Figure 3 Pressure distribution at different Reynolds numbersTable 3 The present Cpmin, θcpm and Cpb at different Re
Re Cpmin θcpm Cpb 1×10⁵ −1.29 69° −1.25 2.5 × 10⁵ −2.39 81° −0.40 7.2 × 10⁵ −2.64 86° −0.28 At Re = 1 × 10⁵, the minimum pressure coefficient Cpmin = − 1.29 at θcpm = 69°, as the Reynolds number increases, Cpmin becomes smaller and the place where the minimum pressure occurs is gradually closer downstream. The trough in the pressure distribution curve becomes more pronounced. At Re = 2.5 × 10⁵, no asymmetric pressure distribution is found. At θ = 96°, a small plateau appears in the pressure distribution, which is caused by the appearance of laminar separation bubbles (LSB). No such small plateau has been observed in the sub-critical region. In the super-critical region Re = 7.2 × 10⁵, the small plateau appears closer to the downstream about θ = 107° and has a shorter plateau period. Inside the separation bubble, that is, the small pressure plateau, the pressure remains constant with the change of angle.
There are three obvious differences in pressure distribu decreases with the increase of Re and appears closer to the wake of cylinder. (Ⅱ) Cpb increases with the increase of Re. (Ⅲ) Small pressure plateaus appear in the critical and super-critical regions. With the increase of Re, small plateaus become shorter and closer to the downstream.
4.2 Mean flow
In Figure 4(a)~(c), the mean streamlines in the near wake region are depicted for all Reynolds numbers. The mean flow field was obtained by averaging the velocity over 20 vortex shedding cycles. The mean streamlines show the formation of long, wide and symmetrical recirculation bubbles behind the cylinder. When the fluid flows through the cylinder, the fluid close to the wall flows along the surface of the cylinder for a certain distance under the combined action of the no-slip condition on the wall and the positive pressure gradient. After entering the adverse pressure gradient for a short distance, the momentum of the fluid is not enough to overcome the adverse pressure gradient, and the fluid no longer flows along the wall, but leaves the wall and flows downstream into the recirculation zone. The point where the recirculation bubbles form is also the point where the fluid separates from the cylinder surface. After the fluid is separated from the cylinder surface, it enters the recirculation zone, where two closed large eddies are formed. For example, at Re = 2.5 × 10⁵, Figure 3(b) and Figure 4(b) show the pressure distribution and mean streamline, respectively. At θ between 0° and 81° is the positive pressure gradient, and at θ between 81° and 135° is the adverse pressure gradient. The fluid first flows along the wall under the positive pressure gradient, and then flows for a certain distance after entering the adverse pressure gradient, and then separates from the wall at θ = 96°.
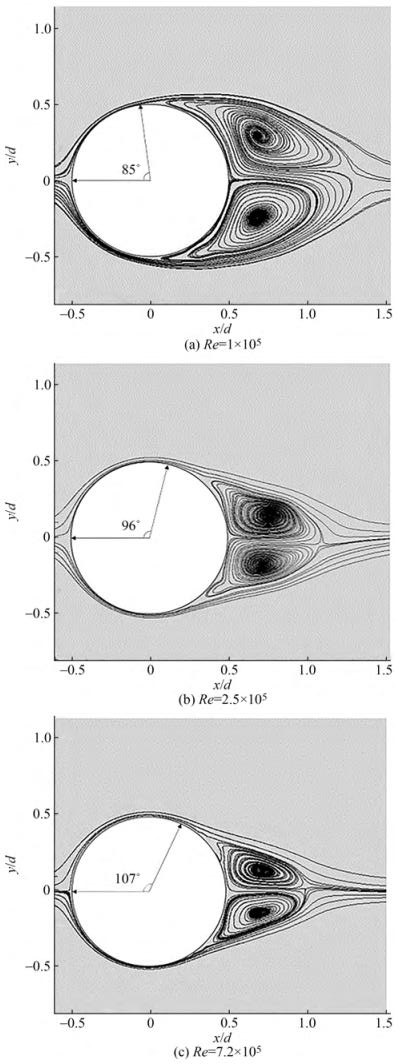 Figure 4 The mean streamlines in the near wake region at different Reynolds number
In the sub-critical region, recirculation bubbles are more pronounced, and the formation of recirculation bubbles starts at about θ = 85°. The recirculation bubbles are longer and wider. Table 4 shows the mean streamlines defining the separation angle θs (compared with the experimental data of Achenbach 1968), recirculation bubble length Lr and vortex centre coordinates (Xvc, Yvc).
Table 4 The mean streamlines defining the φ, Lr and (Xvc, Yvc)Re θs (°) Lr/D Vortex centre 1 Vortex centre 2 Present LES Achenbach (1968) EXP Xvc1/D Yvc1/D Xvc2/D Yvc2/D 
1×10⁵ 85 78 0.796 0.689 0.295 0.683 −0.243 2.5 × 10⁵ 96 94 0.581 0.771 0.147 0.721 −0.177 7.2 × 10⁵ 107 105 0.508 0.734 0.133 0.699 −0.146 As the Reynolds number increases into the critical and super-critical regions, recirculation bubbles become longer and narrower, the two symmetrical vortex centres gradually approach and move downstream as shown in Figure 4(a)~(c). The separation angle θs gradually increases and the separation point moves downstream. The rearward movement of the separation point makes the separation delayed, the closeness of the separation point makes the recirculation bubble narrower, and the vortex centres of the two large eddies are also closer together. Moreover, the separation point is delayed and the separation flow is closer to the cylinder wall, making it easier for the separation flow to interact with the wall in the tiny space between the recirculation bubble and the wall, and the flow is more complex.
4.3 Laminar separation bubbles (LSB)
The pressure distribution on the surface of the cylinder and mean flow field reflect the appearance of laminar bubbles. Tani (1964) proposed that the laminar separation bubble is the result of the time-averaged flow field. Laminar separation bubbles can be divided into long separation bubbles and short separation bubbles according to the aspect ratio. The separation bubbles in the flow around a cylinder are short ones which have little effect on pressure distribution. In order to further study the characteristics of LSB, the mean flow field at critical Reynolds numbers Re = 2.5 × 10⁵ is further analyzed. The average tangential velocity of the cylinder surface uτ is defined as: uτ = usinθ + vcosθ, where u is the velocity in the x direction, v is the velocity in the y direction and θ is clockwise from the stagnation point in front of the cylinder. Figure 5 shows the contour plot of the ratio of the tangential velocity to the incoming flow velocity uτ /U for different Reynolds numbers. The fluid first flows along the surface with a forward velocity, as shown in the green contour line in Figure 5, and then under the action of the adverse pressure gradient, the tangential velocity of the fluid changes from positive to negative, corresponding to the blue part in the Figure, which is the location of LSB. For the sub-critical region at Re = 1 × 10⁵, the location of LSB is about x/d = − 0.06, and θ = 85°. For the critical region at Re = 2.5 × 10⁵, the location is about x/d = 0.056, and θ = 96°. For the super-critical region at Re = 7.2 × 10⁵, the location is about x/d = 0.152, and θ = 107°.
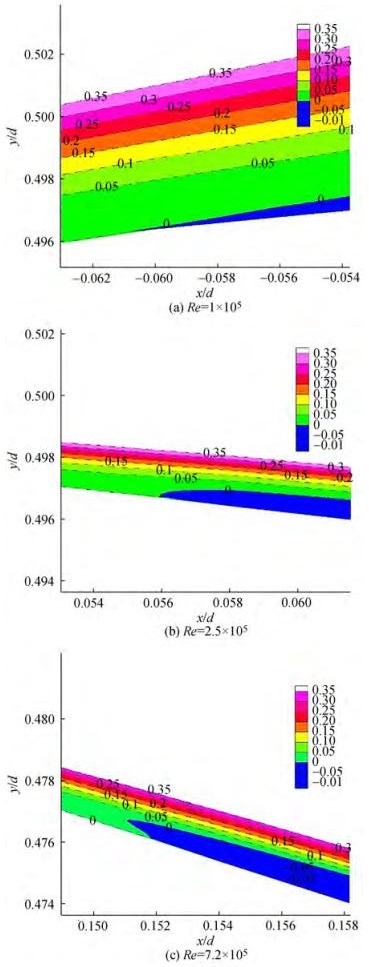 Figure 5 The contour plot of the ratio of the tangential velocity to the incoming flow velocity uτ/U at different Reynolds numbers
LSB is the result of averaging the instantaneous small eddies on the wall. After the shear layer becomes unstable, it rolls up from the wall and forms small vortices attached to the wall close to each other. The small vortices move downstream along the wall, and detach from the wall. Figure 6(a)~(c) illustrates this process and shows the instantaneous vorticity with a time interval ∆t = 0.1T, where T is the vortex shedding period. These small eddies on the wall surface are time-averaged separation bubbles after time-average processing as shown in Figure 6(d). The time-averaged laminar separation bubble is considered to be a stable structure. Horton (1968) believed that laminar separation bubbles have a "stable" large-scale structure. But when looking at this "stable" separation bubble structure, it is common to find low frequency oscillations in the flow field. Brendel and Mueller (1988) and Mcghee et al. (1988) measured the instability of laminar separation bubbles, explained low-frequency oscillations in the flow field. The present study also found the instability of the laminar separation bubble. In the upstream portion of the separation bubble, the shear layer begins to leave the wall steadily, but is unstable near the reattachment point. At the same time, the position of the reattached point is also unstable. The location and size of time-averaged separation bubbles are not completely fixed. Depending on the time period taken, the position and size of the separation bubbles will change slightly. It shows that the laminar separation bubble phenomenon is actually an unstable separation phenomenon.
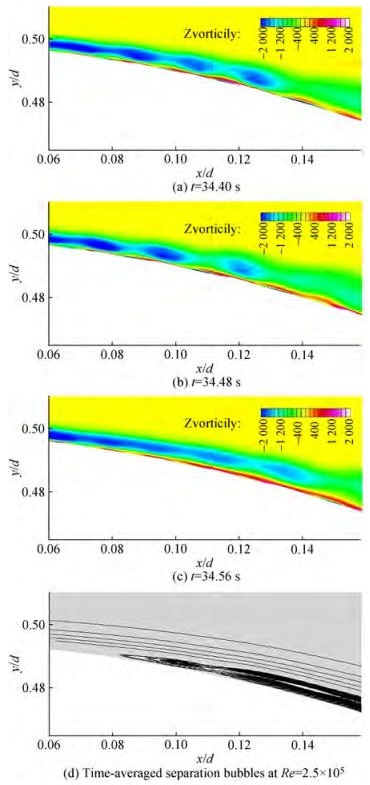 Figure 6 The instantaneous vorticity plot with a time interval ∆t=0.1T
There is a large pressure fluctuation on the surface of the cylinder from the appearance of the separation bubble to the complete formation of the recirculation bubble. Figure 7 shows the instantaneous pressure distribution on the cylinder surface at different times at critical Reynolds numbers Re = 2.5 × 10⁵ in two vortex shedding cycles. Before θ is less than 81°, the fluid flows along the surface of the cylinder under the positive pressure gradient, and the pressure is stable without significant fluctuations. At θ equalling 81° to 96°, the fluid flows along the surface of the cylinder under the adverse pressure gradient. The lowest pressure coefficient has a certain pulsating change under the influence of the adverse pressure gradient and laminar separation bubble. At θ equaling 96° to 140°, the pressure fluctuations start to become severe. In this interval, the laminar flow on the surface of the cylinder is separated, the shear layer is separated from the wall to form a small vortex, and the small vortex falls off and flows downstream and develops into a large vortex, as also shown in Figure 6. Figure 8 shows the instantaneous pressure fluctuations during the two vortex shedding cycles at θ = 96°~140°. At θ = 96°~110°, the small vortex is attached to the wall, and the pressure fluctuation is small. At θ = 110°~120°, small vortices break off from the wall, flow downstream and develop into large vortices, and the pressure fluctuates violently. At θ = 130° ~140°, two large vortices on the upper and lower sides of the cylinder interact to form time-averaged recirculation bubbles. The pressure gradually becomes stable, ending the adverse pressure gradient and forming a pressure platform.
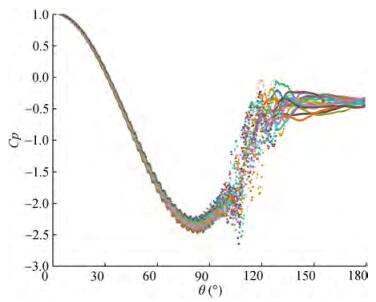 Figure 7 The instantaneous pressure distribution at different times at Re = 2.5 × 10⁵ in two vortex shedding cycles
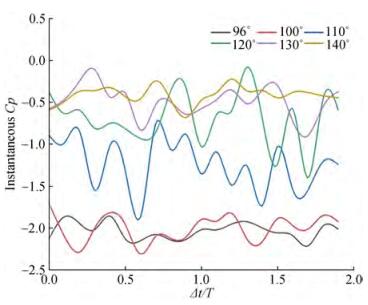 Figure 8 The instantaneous pressure fluctuations at θ = 96°~140°
The two large vortices shed by the upper and lower surfaces of the cylinder are equal and opposite in time averaged, so they are reflected as two recirculation bubbles in symmetrical opposite directions in the averaged flow field. As the Reynolds number increases, the separation point is delayed, and the two large vortices developed from the small vortices shed from the upper and lower surfaces of the cylinder come closer together, and the interaction becomes more intense, thus causing the vortex centres of the recirculation bubbles to become closer, the length of the recirculation bubbles is shorter. This is consistent with the results shown in table 4.
LSB is accompanied by the transition from laminar to turbulent flow and turbulent reattachment. Figure 9 shows the laminar separation, turbulent transition and reattachment processes. Due to the existence of the adverse pressure gradient, the momentum contained in the fluid in the laminar boundary layer cannot continue to overcome the adverse pressure gradient and move forward. At the separation point, the streamline gradually leaves the wall. Then, where the separation bubble thickness reaches a maximum, the separated laminar boundary layer transitions to form a turbulent boundary layer. Under the action of strong turbulent shear stress, the external energy is introduced, so that the boundary layer obtains enough momentum, causing the separated streamlines to return to the wall quickly, forming reattachment.
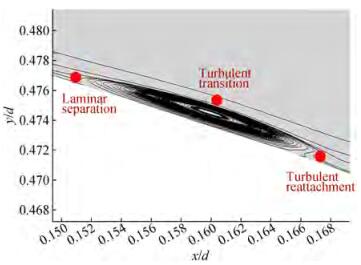 Figure 9 The laminar separation, turbulent transition and reattachment
4.4 Instantaneous vortex wake
Three-dimensional vortex structure can be revealed by iso-surface of Q criterion colored by vorticity magnitude. When the flow calculation is convergent and stable, the vortex structure and wake characteristics of the flow around the cylinder are stable and invariant. Figure 10 shows the three-dimensional vortex structure and spanwise vorticity contours and the close-up view at different Reynolds numbers when the calculation is convergent and stable. Figure 10 shows the three-dimensional vortex structure and spanwise vorticity contours and the close-up view at different Reynolds numbers. At sub-critical Reynolds numbers in Figure 10(a), obvious paired shedding vortices can be observed. The downstream vortex structure has obvious traces, the width of the wake becomes larger, the wake gradually spreads out, the large vortex spreads into small vortices, and there are still small vortices in the far field. As the Reynolds number increases, it enters the critical and supercritical regions. There are more intense and finer vortex shedding on the near wall of the cylinder, as shown in Figure 10(b) and (c). There are two vortices with strong vorticity behind the cylinder. The width of the wake is narrower, and there are more small vortices in the wake behind. and does not diverge to the far field. As the Reynolds number increases, the width of the wake dw/D gradually narrows. Table 5 summarizes the wake width at different Reynolds numbers and compares them with the data of Rodriguez et al. (2014) and Roshko (1961). In the sub-critical region, the wake width dw/D = 1.18 > 1. In critical and super-critical regions, the wake width dw/D < 1, and decreases as the Reynolds number increases. In the critical region, the present LES calculation is consistent with Rodriguez et al. (2014), and in the super-critical region, it is consistent with Roshko (1961).
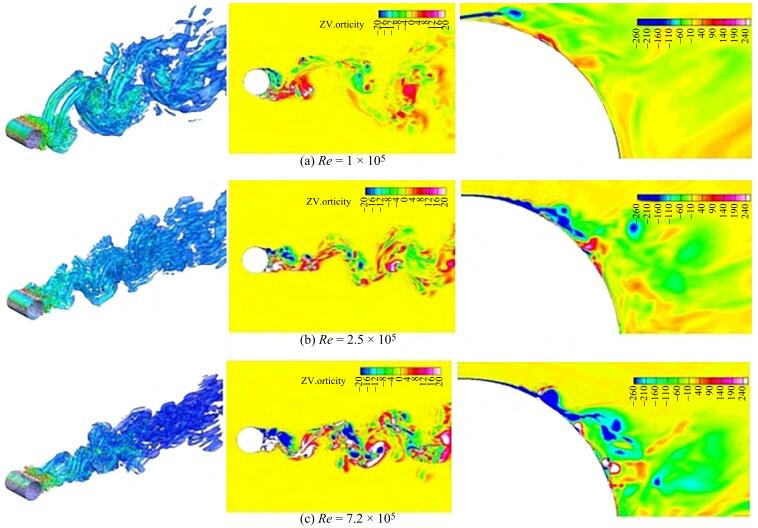 Figure 10 3D vortex structure and instantaneous spanwise vorticity contours, the far-right side shows the close-up views at different Reynolds numbersTable 5 Wake width at different Reynolds number
Re dw/D Present LES Rodriguez (2014) Roshko (1961) 
1×10⁵ 1.18 > 1 (sub-critical) - 2.5 × 10⁵ 0.88 0.87 - 7.2 × 10⁵ 0.80 0.4 (super-critical) 0.8 (trans-critical) The close-up view of the spanwise vorticity contours shows the shear layer shedding of the cylinder wall. In the sub-critical region, the angle of the separation point is before 90 degrees (θ < 90°). After the shear layer leaves the cylinder, it moves away from the cylinder in the y direction and does not directly interact with the vortex behind the cylinder. The detached shear layer has sufficient space to develop into large vortices. Therefore, two obvious large vortices can be observed behind the flow around the cylinder in the subcritical region. In the critical and super-critical regions, where the angle of the separation point is greater than 90 degrees (θ > 90°), the shedding shear layer is closer to the cylinder wall, and the movement of the shear layer toward the wall increases the chance of interaction with the boundary layer. The vortex cluster with strong vorticity is broken under the interaction, the structure of the wake is not obvious and the width is narrower.
5 Conclusions
The flow and separation bubbles around a circular cylinder from sub-critical to super-critical Reynolds numbers (at Re = 1 × 10⁵, 2.5 × 10⁵, and 7.2 × 10⁵, respectively) have been performed using large eddy simulations. The present LES-WALE model accurately captures the drag crisis phenomenon. In the critical Reynolds numbers region, Cd drops rapidly from 1.10 to 0.26. St rose from 0.20 to 0.38. With the increase of Reynolds numbers, Cpmin decreases, Cpb increases. Small pressure plateaus appear which represents the appearance of laminar separation bubbles in the critical and super-critical regions. LES-WALE model obtains results consistent with the experiments in the flow around a cylinder in the critical region with the characteristics of laminar-turbulent transition and wall-separated flow. LES-WALE is suitable for the present study.
The mean flow field shows that the recirculating bubbles get narrower and shorter as the Reynolds number increases. For sub-critical, critical and super-critical regions, the angles of laminar separation θs are 85°, 96°, and 107°, respectively. Laminar separation bubbles are an unstable feature of the time-averaged vortices shed by separation points. Within the separation bubble, the pressure varies dramatically with time, but not with position. Corresponds to the small plateau appearing on the pressure distribution curve. The surface pressure fluctuates greatly after the laminar separation bubble appears, and it is gradually stabilized until the basic pressure is reached.
The laminar boundary layer transforms into a turbulent boundary layer at the maximum separation bubble thickness. The turbulent boundary layer gets enough momentum and then attaches to the wall. In the region where the separation bubble appears and the vortex is completely detached from the wall, the pressure distribution on the cylinder surface shows a strong pulsation. The small vortices shed from both sides of the cylinder develop into two large vortices and interact with each other. After time averaging, two closed recirculation zones are obtained, that is, recirculation bubbles. The separation point delay enhances the mutual dissipation of the two large eddies, resulting in smaller recirculating bubbles in critical and super-critical regions.
The wake in the sub-critical region has a larger and more pronounced vortex structure. The wake width dw/D = > 1. In the critical and super-critical regions, the wake is more concentrated, and the width of the wake dw/D decreases with the increase of Reynolds number. With the delay of separation point, the morphology of the wall shear layer is significantly different for different Reynolds numbers. When the separation angle is greater than 90 degrees, the shear layer is closer to the wall, causing the wake width to decrease.
The present research shows the laws and characteristics of the flow around the cylinder from sub-critical to critical to super-critical regions, and reveals the mechanism of separation bubbles. The flow in the critical region needs further research, especially the large amplitude of the vortex-induced vibration (VIV) in the critical region deserves serious consideration, and the effect of separation bubbles on the VIV in the critical region is not yet clear. The present study can provide some help for the study of vortex-induced vibration in the critical region.
Competing interest The authors have no competing interests to declare that are relevant to the content of this article. -
Figure 1 The near-wall mesh and the non-dimensional wall distance y+
Figure 2 Hydrodynamic coefficient against Re
Figure 3 Pressure distribution at different Reynolds numbers
Figure 4 The mean streamlines in the near wake region at different Reynolds number
Figure 5 The contour plot of the ratio of the tangential velocity to the incoming flow velocity uτ/U at different Reynolds numbers
Figure 6 The instantaneous vorticity plot with a time interval ∆t=0.1T
Figure 7 The instantaneous pressure distribution at different times at Re = 2.5 × 10⁵ in two vortex shedding cycles
Figure 8 The instantaneous pressure fluctuations at θ = 96°~140°
Figure 9 The laminar separation, turbulent transition and reattachment
Figure 10 3D vortex structure and instantaneous spanwise vorticity contours, the far-right side shows the close-up views at different Reynolds numbers
Table 1 Hydrodynamic coefficients of different spanwise layers
layer Cd Clrms St 20 0.36 0.16 0.30 40 0.32 0.11 0.33 50 0.33 0.14 0.29 Table 2 The present LES results of Cd, Clrms and St
Re Cd Clrms St 1×10⁵ 1.10 0.35 0.20 2.5 × 10⁵ 0.36 0.16 0.30 7.2 × 10⁵ 0.26 0.08 0.38 Table 3 The present Cpmin, θcpm and Cpb at different Re
Re Cpmin θcpm Cpb 1×10⁵ −1.29 69° −1.25 2.5 × 10⁵ −2.39 81° −0.40 7.2 × 10⁵ −2.64 86° −0.28 Table 4 The mean streamlines defining the φ, Lr and (Xvc, Yvc)
Re θs (°) Lr/D Vortex centre 1 Vortex centre 2 Present LES Achenbach (1968) EXP Xvc1/D Yvc1/D Xvc2/D Yvc2/D 1×10⁵ 85 78 0.796 0.689 0.295 0.683 −0.243 2.5 × 10⁵ 96 94 0.581 0.771 0.147 0.721 −0.177 7.2 × 10⁵ 107 105 0.508 0.734 0.133 0.699 −0.146 Table 5 Wake width at different Reynolds number
Re dw/D Present LES Rodriguez (2014) Roshko (1961) 1×10⁵ 1.18 > 1 (sub-critical) - 2.5 × 10⁵ 0.88 0.87 - 7.2 × 10⁵ 0.80 0.4 (super-critical) 0.8 (trans-critical) -
Achenbach E (1968) Distribution of local pressure and skin friction around a circular cylinder in cross-flow up to Re=5×10⁶. Journal of Fluid Mechanics 34: 625-639. https://doi.org/10.1017/S0022112068 002120 https://doi.org/10.1017/S0022112068002120 Bearman PW (1969) On vortex shedding from a circular cylinder in the critical Reynolds number regime. Journal of Fluid Mechanics 37: 577-585. https://doi.org/10.1017/S0022112069000735 Benim AC, Cagan M, Nahavandi A, Pasqualotto E (2007) RANS predictions of turbulent flow past a circular cylinder over the critical regime. International Conference on Fluid Mechanics and Aerodynamics, Athens, Greece, 232-237 Bloor Susan M (1964) The transition to turbulence in the wake of a circular cylinder. Journal of Fluid Mechanics 19: 290-304. https://doi.org/10.1017/S0022112064000726 Brendel M, Mueller TJ (1988) Boundary-layer measurements on an airfoil at low Reynolds numbers. Journal of Aircraft 25: 612-617. https://doi.org/10.2514/3.45631 Breuer M (2000) A challenging test case for large eddy simulation: high Reynolds number circular cylinder flow. International Journal of Heat and Fluid Flow 21: 648-654. https://doi.org/10.1016/S0142-727X(00)00056-4 Cantwell B, Coles D (1983) An experimental study of entrainment and transport in the turbulent near wake of a circular cylinder. J Fluid Mech. https://doi.org/10.1017/S0022112083002189 Cheng W, Pullin DI, Samtaney R, Zhang W, Gao W (2017) Largeeddy simulation of flow over a cylinder with ReD from 3.9×10³ to 8.5×10⁵: a skin-friction perspective. Journal of Fluid Mechanics 820: 121-158. https://doi.org/10.1017/jfm.2017.172 Ding Z, Balasubramanian S, Lokken R, Yung T (2004) Lift and damping characteristics of bare and straked cylinders at riser scale Reynolds numbers. Offshore Technology Conference. https://doi.org/10.4043/16341-MS Fage A (1931) Further experiments on the flow around a circular cylinder. H.M. Stationery Office Place http://naca.central.cranfield.ac.uk/reports/arc/rm/1369.pdf Farell C, Blessmann J (1983) On critical flow around smooth circular cylinders. Journal of Fluid Mechanics 136: 375-391. https://doi.org/10.1017/S0022112083002190 Horton HP (1968) Laminar separation bubbles in two and three dimensional incompressible flow. Doctoral dissertation Queen Mary, University of London Issa RI (1991) Solution of the implicitly discretised fluid flow equations by operator-splitting. Journal of Computational Physics 62: 40-65. https://doi.org/10.1016/0021-9991(86)90099-9 Kamiya N, Suzuki S, Nishi T (1979) On the aerodynamic force acting on a circular cylinder in the critical range of the Reynolds number. 12th Fluid and Plasma Dynamics Conference doi: 10.2514/6.1979-1475 Lehmkuhl O, Rodríguez I, Borrell R, Chiva J, Oliva A (2014) Unsteady forces on a circular cylinder at critical Reynolds numbers. Physics of Fluids 26: 125110-. https://doi.org/10.1063/1.4904415 Mcghee RJ, Walker BS, Millard BF (1988) Experimental results for the Eppler 387 airfoil at low Reynolds numbers in the Langley lowturbulence pressure tunnel. National Aeronautics and Space Administration, Scientific and Technical Information Division Place http://hdl.handle.net/2060/19890001471 Nicoud F, Ducros F (1999) Subgrid-scale stress modelling based on the square of the velocity gradient tensor. Flow Turbulence and Combustion 62: 183-200 https://doi.org/10.1023/A:1009995426001 Norberg C (2003) Fluctuating lift on a circular cylinder: review and new measurements. Journal of Fluids & Structures 17: 57-96. https://doi.org/10.1016/S0889-9746(02)00099-3 Ong MC, Utnes T, Holmedal LE, Myrhaug D, Pettersen B (2009) Numerical simulation of flow around a smooth circular cylinder at very high Reynolds numbers. Marine Structures 22: 142-153. https://doi.org/10.1016/j.marstruc.2008.09.001 Ono Y, Tamura T (2008) LES of flows around a circular cylinder in the critical Reynolds number region. Proceedings of BBAA Ⅵ International Colloquium on Bluff Bodies Aerodynamics and Applications, Milano, Italy Pfeil H, Orth U (1990) Boundary-layer transition on a cylinder with and without separation bubbles. Experiments in Fluids 10: 23-32 https://doi.org/10.1007/BF00187868 Prasad A, Williamson C (1996) The instability of the separated shear layer from a bluff body. Physics of Fluids 8: 1347-1349. https://doi.org/10.1063/1.868942 Raghavan K, Bernitsas M (2011) Experimental investigation of Reynolds number effect on vortex induced vibration of rigid circular cylinder on elastic supports. Ocean Engineering 38: 719-731. https://doi.org/10.1016/j.oceaneng.2010.09.003 Rodriguez I, Lehmkuhl O, Chiva J, Borrell R, Oliva A (2014) On the flow past a circular cylinder from critical to super-critical Reynolds numbers: wake topology and vortex shedding. International Journal of Heat and Fluid Flow 55: 91-103. https://doi.org/10.1016/j.ijheatfluidflow.2015.05.009 Roshko A (1961) Experiments on the flow past a circular cylinder at very high Reynolds number. Journal of Fluid Mechanics 10: 345-356. https://doi.org/10.1017/S0022112061000950 Schewe G (1983) On the force fluctuations acting on a circular cylinder in crossflow from subcritical up to transcritical Reynolds numbers. Journal of Fluid Mech 133: 265-285. https://doi.org/10.1017/S0022112083001913 Smagorinsky J (1963) General circulation experiments with the primitive equations. Monthly Weather Review 91: 99-164. https://doi.org/10.1175/1520-0493(1963)091<0099:GCEWTP>2.3.CO;2 https://doi.org/10.1175/1520-0493(1963)091<0099:GCEWTP>2.3.CO;2 Son JS, Hanratty TJ (2006) Velocity gradients at the wall for flow around a cylinder at Reynolds numbers from 5×10³ to 105. Journal of Fluid Mechanics 35: 353-368. https://doi.org/10.1017/S0022112069001157 https://doi.org/10.1017/S00221120690011573 Spitzer RE (1965) Measurements of unsteady pressures and wake fluctuations for flow over a cylinder at supercritical Reynolds number. Doctoral dissertation, California Institute of Technology. https://doi.org/10.7907/WT4K-6337 Szepessy S, Bearman PW (1992) Aspect ratio and end plate effects on vortex shedding from a circular cylinder. J. Fluid Mech. 234: 191-217. https://doi.org/10.1017/S0022112092000752 Tani I (1964) Low-speed flows involving bubble separations. Progress in Aerospace Sciences 5: 70-103. https://doi.org/10.1016/0376-0421(64)90004-1 Vaz G, Mabilat C, Wal RVD, Gallagher P (2007) Viscos flow computations om smooth cylinders a detailed numerical study with validation. 26th International Conference on Offshore Mechanics and Arctic Engineering 2007(OMAE2007) https://doi.org/10.1115/OMAE2007-29275 West GS, Apelt CJ (1982) The effects of tunnel blockage and aspect ratio on the mean flow past a circular cylinder with Reynolds numbers between 104 and 105. Journal of Fluid Mechanics 114: 361-377. https://doi.org/10.1017/S0022112082000202 Wieselsberger C (1921) Neuere feststellungen uber die gesetze des flussigkeits und luftwiderstands. Phys. Z. 22: 321 Williamson C (1996) Vortex dynamics in the cylinder wake. Annual Review of Fluid Mechanics 28: 477-539 Ye H, Wan D (2017) Benchmark computations for flows around a stationary cylinder with high Reynolds numbers by RANSoverset grid approach.Applied Ocean Research 65:315-326. https://doi.org/10.1016/j.apor.2016.10.010 Yeon SM, Yang J, Stern F (2016) Large-eddy simulation of the flow past a circular cylinder at sub-to super-critical Reynolds numbers.Applied Ocean Research 59:663-675. https://doi.org/10.1016/j.apor.2015.11.013 You JY, Kwon OJ (2010) Numerical comparisons between URANS and hybrid RANS/LES at a high Reynolds number flow using unstructured meshes.International Journal of Aeronautical & Space Sciences 11:41-48. http://doi.org/10.5139/IJASS.2010.11.1.041