Influence of Laminar-to-Turbulent Transition on the Model Scale Propeller Performance and Induced Pressure Pulses in an Unsteady Case of Oblique Flow
https://doi.org/10.1007/s11804-023-00334-w
-
Abstract
In this paper, after the successful applications to open water propeller performance estimations, the influence of transition sensitive and modified mass transfer models tuned to account for the laminar flow in the prediction of the cavitation inception of marine propulsors is investigated from the point of view of the unsteady functioning and induced pressure pulses. The VP1304 (also known as PPTC) test case, for which dedicated data were collected during several workshops, is considered first. After preliminary analyses using RANS, also Detached Eddy Simulations (DES) are included to better account for the vortex dynamics and its influence on pressure pulses. Similarly to what observed in uniform inflow, results show a better agreement with the available measurements of propeller performances and confirm the reliability of the proposed approaches for unsteady, non-cavitating, model scale propeller predictions. The overall cavitation pattern is improved too by the application of the transition sensitive correction to the mass transfer model, but the complex dynamics of bubble cavitation observed in experiments prevents quantitatively better predictions in terms of thrust/torque breakdown and induced pressure pulses levels regardless the use of RANS or DES methods.Article Highlights• Transition sensitive turbulence models are used to improve the model scale propeller performances prediction in unsteady functioning;• A modification of the Schnerr-Sauer model is introduced to bridge transition sensitive and cavitation models since the laminar boundary layer influence on the cavitation inception is not accounted by standard mass transfer models;• The qualitative agreement of cavitation extensions with availabel ex‐periments results is significantly improved;• No positive effects on high-order pressure pulses harmonics are ob‐served with the application of the modified mass transfer model. -
1 Introduction
Dealing with model scale experiments is always challenging. Model scale tests represent the preferred investigation approach in many hydrodynamic contexts since they are controllable and reproducible in a confined environment. The limitation of the testing facility dimensions, however, poses serious concerns regarding the non-negligible differences in the flow regimens at order of magnitude different Reynolds numbers and the usability of the relative results in real scale is ensured only by extrapolation methods that, in case of ship powering and performance predictions, still represent the most valuable approach. While the availability of reliable numerical tools could allow for direct calculations in full-scale, avoiding the burden of the model scale laminar-to-turbulent transition since full-scale applications reasonably come under fully turbulent flow conditions, there is full of situations where the laminar-to-turbulent capabilities of the numerical methods are precious.
The validation of the methods themselves, especially when side effects like cavitation and pressure pulses are accounted, is one of these. Also, the renovated interest in benchmark campaigns on propellers performance (Tani et al., 2019a; Tani et al., 2019b), even if not strictly related to the role of the laminar boundary layer on propeller characteristics, points out the need of reliable numerical tools capable of accounting for these phenomena. Similarly, when the interest is on the experiment per se, without any issue related to scaling to full size but only, for instance, on the comparison of alternative designs in terms of radiated noise or pressure pulses, the availability of transition sensitive calculations could help avoiding doubtfully comparisons not accounting for the real flow conditions of the measurements.
These are the motivations behind the recent development of many transition sensitive turbulence models (Walters and Leylek, 2002; Langtry and Menter, 2005), their systematic application to propellers and to various types of propulsors (Baltazar et al., 2018, 2020; Bhattacharyya et al., 2016; Gaggero and Villa, 2018b; Gaggero, 2022a) as well as the customization of popular cavitation models, for instance the Schnerr-Sauer (Schnerr and Sauer, 2001), to include the role of the laminar flow on the cavitation inception (Ge et al., 2019; Gaggero, 2022b; Ge et al., 2021a).
By using transition sensitive approaches, like the γ-Reθ model of Langtry et al. (2006) and Langtry and Menter (2009), or the k−kL−ω model by Walters and Leylek (2002), many successful calculations of model-scale, fully wetted flow, propeller performances were proposed. The "single-point" (or local) nature of both these formulations, without the need of integral or non-local information to derive the transition point, facilitated their application in the case of the unstructured meshes which are necessary for the discretization of complex geometries. Results showed a substantial improvement in the prediction of the model scale propeller performances, with good correlations, especially with the γ-Reθ, also in terms of predicted limiting streamlines on propeller blade if compared to available paint tests.
At the same time cavitation models were modified to account for the relevant influence of the laminar boundary layer (and laminar separation point) on the cavitation inception, observed by Arakeri and Acosta (1981) in the case of very simple cavitators, by Franc and Michel (1985) on hydrofoils and by Kuiper(1978a, 1978b, 1981) on propeller blades. Ge et al. (2019, 2020) and Gaggero (2022b) proposed similar modifications of the Schnerr-Sauer mass transfer model to mimic the correlation of cavitation inception with the pressure at the laminar separation point when the analyses were carried out with a transition-sensitive turbulence model. Many test cases and recent benchmark activities (Barkmann et al. 2011; Salvatore at al., 2009; Vaz et al., 2015; Yilmaz et al., 2017) shown, indeed, an overestimation of the predicted sheet cavitation using RANSE and homogeneous two-phase flows approaches compared to model scale observations. Most of the cavitation models are based purely on local pressure and, consequently, cavitation develops when the pressure is below saturation, regardless the nature of the boundary layer. In particular, numerical calculations predicted even the presence of a vapour bubble when experiments were completely wet, especially at inner radial positions where the local Reynolds number is more representative of laminar than of turbulent boundary layer. A decent agreement was observed only when turbulence transition was artificially triggered in experiments by roughening the blade leading edge.
The proposed modifications (Ge et al., 2019, 2020; Gaggero, 2022b), which can be seen as a "calibration" of a mass transfer model purely based on pressure difference (exactly as transition sensitive turbulence models are a framework for the implementation of calibrated transition correlations (Langtry and Menter, 2005) rather than a solution of the physics of the transition process) allowed, instead, substantial improvements of the numerical predictions. The analyses of several, very different, propellers demonstrated the possibility to postpone, by the use of this calibrated formulation, the inception of cavitation in the case of persistent, non-separated, laminar boundary layer (as experimentally observed in Kuiper, 1978a, 1978b, 1981 and by Korkut and Atlar, 2000), even in presence of a local pressure well below the saturation, with predictions of the vapour bubbles extension closer to experiments and without any significant alteration of the calculated performances.
These analyses, however, were mainly restricted to open water functioning, investigating the influence of these models only on propeller thrust and torque and only few calculations are available in case of unsteady flow. Following the extensive analyses proposed in Gaggero (2022b), which already addressed the role of laminar-to-turbulent transition on open water propeller performance and cavitation, the well-documented VP1304 propeller from the ITTC test case (ITTC, 2017) and the SMP workshops (Barkmann et al., 2011; Heinke and Lubke, 2011; Kinnas et al., 2015) is considered for systematic analyses in oblique flow.
The aim of the analyses, indeed, is to verify, from both the (qualitative) point of view of cavitation dynamic and of unsteady propeller performances, the reliability of the developed transition-sensitive cavitating model in a more complex case for which an alternating of sheet and bubble cavitation was observed in experiments during each blade revolution, simultaneously on the suction and on the pressure side together with strong tip vortex cavitation. Moreover, since the most relevant side effects related to (unsteady) cavitation are an alteration of pressure pulse fluctuations and increased levels of radiated noise, the proposed test case serves also to verify the possible improvements in predicting such phenomena by the application of transition sensitive flow solvers. If tip vortex cavitation and dynamic can be assumed as the source of higher order pressure fluctuations (i. e. increased noise at higher frequencies), at lower blade passing frequencies (1st to 3rd) the fluctuations are mainly determined by the blade load and the growth and collapse of the sheet cavity bubble. Since the presence of prevalent laminar flow at the leading edge of the blade postpones the vaporization process, it is reasonable that measured pressure fluctuations depend also on the turbulent regime of the fluid and that only by accounting for these phenomena in the calculation of the sheet cavitation dynamic a reliable prediction of pressure fluctuations is possible, filling the gap often observed between experiments and fully turbulent calculations. The PPTC test case, thanks to the diversity of unsteady cavitating phenomena it is subjected to, and the availability of pressure pulses measurements on several locations above the propeller, represents an effective test case for an additional validation of the modified Schnerr-Sauer model not only limited to RANS calculations. The complex phenomena at the tip may require more accurate solvers (Ge et al., 2020; Ge et al., 2021b), which themselves may overall improve the reliability of predictions, also of side effects and especially in the high frequency range. In this respect, Detached Eddy Simulations are applied too, at first to verify the flexibility of the transition sensitive cavitation model when applied in this more advanced computational framework, and subsequently to investigate the influence of a better resolved (also in presence of laminar to turbulent transition) vortical structures on the propeller induced pressure pulses. After the presentation of the test case, introduced in Section 2, the numerical setup is illustrated in Section 3 and finally the results and the relative discussion are presented in Section 4.
2 Test cases
The VP1304 propeller (Heinke and Lubke, 2011) is a conventional propeller made available by SVA Potsdam in the course of the Propeller Workshop under the acronym PPTC (Potsdam Propeller Test Case), held for the first time at the 2nd Symposium on Marine Propulsors in Hamburg. During the second edition of the Workshop (Kinnas et al., 2015), the propeller was tested in oblique flow (shaft inclination of 12°) to address unsteady performances including unsteady cavitation and pressure pulses. Collected data, using a variety of BEM, RANS and LES solvers, showed scattered results, in particular for what concern the unsteady cavitating performances (Kinnas et al., 2015; Gaggero and Villa, 2018a; Morgut et al., 2019). As in the case of the steady analyses (Gaggero and Villa, 2017; Morgut and Nobile, 2012; Viitanen et al., 2020) proposed for the same propeller in the Part Ⅱ of this work (Gaggero, 2022b), one of the most evident issues of all the calculations was the massive over-prediction of sheet cavitation on the propeller blades in place of the bubble cavitation observed during experiments. This makes the case a very interesting benchmark for the modified cavitation model developed in Gaggero (2022b).
Table 1 Main geometrical characteristics of the VP1304 propellerModel scale diameter (mm) 250 Pitch/D at r/R = 0.7 1.635 Chord/D at r/R = 0.7 0.417 Skew at tip (°) 18.8 Blade Area Ratio 0.779 Hub Diameter Ratio 0.30 Number of Blades 5 The proposed analyses encompass all the functioning analyzed for the workshop, then three propeller advance coefficients at three different cavitation indexes and at two clearances from the tunnel top wall, corresponding respectively to "Case 2" and "Case 3" of the workshop (Table 2). Numerical calculations replicated the propeller rate of revolution (20rps) and the fluid properties listed in the Workshop instructions.
Table 2 Functioning condition for the VP1304 propellerCases J Rer/R=0.7(×106) σN Tip clearance (mm) 2.1/3.1 1.019 1.32 2.024 160/50 2.2/3.2 1.268 1.38 1.424 160/50 2.3/3.3 1.408 1.47 2.000 160/50 3 Numerical setup
All the calculations proposed throughout the paper have been carried out solving the RANS (or DDES) equations using StarCCM+ (Siemens, 2017) which is a finite volume solver based on cell-centered collocated variables and face-based implementation that allow for arbitrary cell shapes and unstructured meshes.
The numerical setup, with respect to that adopted and validated in the case of the fully wetted and cavitating calculations proposed for the steady analyses in uniform inflow in the first and second part of this work (Gaggero, 2022a, 2022b), required some modifications to deal with the unsteady nature of the calculations. The computational domain consists of a portion of the cavitation tunnel, since no tuning of the advance coefficient in equivalent open water calculations was adopted (i. e., thrust identity assumption). The total domain length is of 2.6 meters while the cross-sectional area is 14.5 times the propeller disk area (Figure 1). The propeller rotation is realized by sliding meshes of an inner region that is discretized with polyhedral cells including some helical refinements in the tip region obtained by envelopes of isosurfaces of Q-factor preliminarily computed on a coarser grid. The external region, instead, is described using hexa-dominant cells with some local refinements in proximity of the propeller. A description of the computational domain is shown in Figure 1, where also boundary conditions are listed. Inlet velocity and pressure outlet conditions were used for the foremost and the aftmost patches that bounds the computational domain, respectively to set the inflow velocity (i. e., the advanced ratio of the propeller) and the undisturbed pressure for the calculations (i. e., the cavitation index). Propeller, shaft, and tunnel surfaces are non-slip walls. Fully turbulent analyses were carried out using the SST k-ω while the transition sensitive model is the γ-Reθ (Langtry et al. 2006).
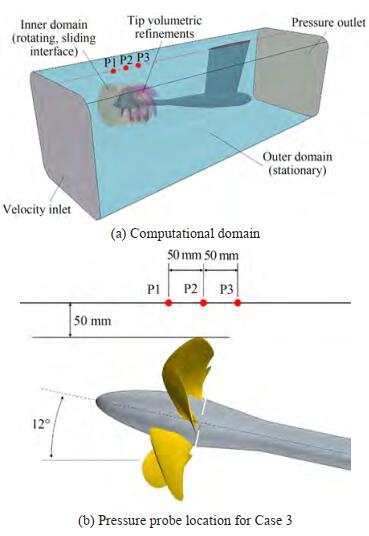 Figure 1 Computational domain of VP1304 (tunnel/propeller clearance for pressure pulses prediction) with the pressure probe locations (Kinnas et al., 2015) for induced pressure pulses samplingNotes: In yellow the sliding interface coupling the inner (propeller, rotating) and outer (fixed) domain
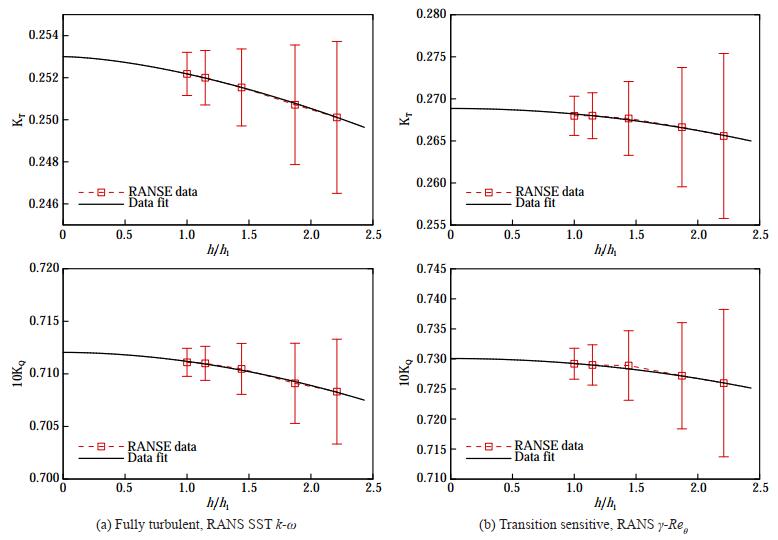
Prism layers around the blades are composed of 16 cells, arranged with a growing ratio of 1.3. The total thickness of the prims layer is 1.5 mm, resulting in a cell thickness at the wall suitable for calculations with an y+ in average equal to 0.4 (except few spikes, anyhow lower than 3, at the blade tip in correspondence of heavily deformed cells) regardless of the surface and volumetric refinements adopted for the calculations. In this respect, indeed, a grid sensitivity analysis (non-cavitating conditions) was preliminarily carried out to assess the numerical uncertainty associated with this type of calculations and rationally discuss the role of the transition sensitive turbulence models (and o the differences with respect to fully turbulent cases) in the prediction of the propeller performances. To this aim, five grid arrangements (Figure 2) have been considered ranging from 3.5 million (G5) to 38 million cells (G1). They were realized, with constant prism layer parameters, starting from the same surface and volume mesh isotropically refined. The results of the sensitivity analyses, computed by the method proposed by Eça and Hoekstra (2014), are summarized in Figure 3. The convergence trend for both fully turbulent and transition sensitive calculations has an estimated order of convergence (averaged thrust and torque coefficients, last two propeller revolutions, after reaching periodic convergence) very close to second order (exactly 2 for the transition sensitive analyses, about 1.8 for fully turbulent), in agreement with the theoretical second order nature of the numerical schemes employed in both space and time. The associated uncertainty is very small, too. The worst, 3.7%, is observed for the thrust coefficient when using the SST k-ω with the coarsest grid while, already from grid G3 (12 million cells) and regardless of the turbulence model, uncertainties drop below 1.5% with calculated values of thrust and torque less than 0.5% different from the extrapolated values. Based on these results, G2 with a total of 25 million cells, 17 of which in the rotating region, was selected for all the analyses, including the cavitating ones.
With both the choices of the turbulence model the default cavitation approach is that from Schnerr and Sauer (2001), using uniform distributed water nuclei (1012 per cubic meter) with constant diameter (2R = 10-6 m) under the assumption of a homogeneous and incompressible mixture (physical properties of density ρmixture and viscosity μmixture calculated as weighted average of phases) handled with a "Volume of Fluid" method. Adding mass transfer between phases determines a modification to the continuity equation and the need of solving an additional convective equation for the phase fraction α:
$$ \nabla \cdot \boldsymbol{U}=\left(\frac{1}{\rho_{\text {liq }}}-\frac{1}{\rho_{\text {vap }}}\right) \dot{m} $$ (1) $$ \frac{\partial \alpha}{\partial t}+\nabla \cdot(\alpha \boldsymbol{U})=\frac{\dot{m}}{\rho_{\text {vap }}} $$ (2) where ρliq and ρvap are, respectively, the densities of liquid and vapor phases of the water, U the velocity field. Condensation (Ccond) and vaporization (Cvap) constants in the net interphase mass flow rate per unit volume ṁare equal to 1, except for the modification introduced to account for the presence of laminar flow. Similar to the model of Merkle and Kunz, or to the full cavitation model of Singhal, the Schnerr and Sauer approach is exclusively pressure-driven: the interphase mass flow is positive (vaporization) or negative (condensation) depending on the local pressure p being lower or higher than the vapour pressure pvap. The analyses of the effect of the laminar to turbulent transition on the propeller functioning have shown (Baltazar et al., 2017; Baltazar et al., 2020, 2018; Gaggero, 2022a), however, very limited influence on the local pressure distribution over the propeller blades, which is sufficient to make numerical predictions closer to measurements, but it is far from being significant for substantial modifications of the inception and the cavitation extension. Then, to account for the postponing effect of the laminar boundary layer and the role of separation, it is not sufficient to rely on the updated pressure distribution but a modification of the activation criteria of the interphase mass flow rate is required. To this aim, the same method developed in Gaggero (2022b) is used.
The extensive analyses of Arakeri and Acosta (1981) did not evidence a single overriding factor to be responsible for the inception or the possibility to define a "universal" scaling law for any, very different, type of cavitation. The γ-Reθ transition model itself is a framework for the implementation of transition correlations rather than an attempt to model the real physics of the phenomenon. Currently, this transition model accounts for natural, bypass and separation induced transition and, then, only an empirical modification of the cavitation model, using the variables of the transition sensitive model to partially account for the most evident correlations between separation and cavitation, is logical. The natural modification of the model consists of an unbalancing between the vaporization and the condensation terms. For condensation, the original, pressure-driven, formulation is maintained while the vaporization term is made dependent on the quantities governing the transition onset (i.e., the intermittency γ and the local transition onset momentum-thickness Reynolds number Reθt of the γ-Reθ transition sensitive turbulence model). This modification is similar to that proposed by Ge at al. (2019):
$$ \dot{m}=\left\{\begin{array}{l} C_{\text {vap }}\left(\gamma, Re_{\theta t}\right)\left[3 \frac{\rho_{\text {liq }} \rho_{\text {vap }}}{\rho_{\text {mixture }}} \frac{\alpha(1-\alpha)}{R} \sqrt{\frac{2}{3} \frac{\left|p-p_{\text {vap }}\right|}{\rho_{\text {liq }}} \operatorname{sgn}\left(p_{\text {vap }}-p\right)}\right] \quad \text { if } p-p_{\text {vap }}<0 \\ C_{\text {cond }}\left[3 \frac{\rho_{\text {liq }} \rho_{\text {vap }}}{\rho_{\text {mixture }}} \frac{\alpha(1-\alpha)}{R} \sqrt{\frac{2}{3} \frac{\left|p-p_{\text {vap }}\right|}{\rho_{\text {liq }}} \operatorname{sgn}\left(p_{\text {vap }}-p\right)}\right] \quad\quad\quad\quad\quad \text { if } p-p_{\text {vap }}>0 \end{array}\right. $$ (3) The obvious dependence is on the intermittency γ of the γ -Reθ model, which is the variable that is used to trigger the production of the turbulent kinetic energy. Since through a modification of the constants of the intermittency also the separation induced transition is accounted (Menter et al., 2006), this makes the intermittency the primary variable to establish the correlation between laminar separation and cavitation inception. The modification of the model consists of a dampening of the vaporization where the intermittency reveals a laminar boundary layer. To this aim, the activation of the vaporization term is made dependent on the Reθt to extend the correction to the inception also outside the boundary layer and to avoid the sudden vaporization in the case of local values of the pressure below the vapor pressure far from boundaries. Both corrections are finally blended also accounting for the distance from the walls. The resulting Cvap is then a function of the working condition/spatial location around the blade (and its boundary layer) which weakens, based on the occurrence of laminar flow, the vapour production where the pressure difference naturally activates the phase change. For the specific application proposed in the paper, the activation thresholds, as well as the spatial blending functions, have been calibrated based on the simple hemispherical headform calculations and on the analyses of propeller performances in uniform inflow (Gaggero, 2022b). In particular, the threshold for the activation of the mass transfer using the Reθt criterion has been set equal to 1200. An "on/off" behavior of the laminar flow trigger Cvap has been finally preferred using a normalized threshold of 0.85 to activate the vapour production inside the boundary layer.
Based on the results of the influence of the turbulence level, extensively investigated in Gaggero and Villa (2018b), Gaggero (2022a) and Baltazar et al (2018, 2020), all the calculations also in cavitating conditions have been carried out by tuning the parameters of the turbulence model (turbulence intensity Tu, i.e., the ratio between the root-mean-square of the turbulent velocity fluctuations and the mean velocity, and eddy viscosity ratio, μt/μ as per Table 3) at the inlet to realize a turbulence intensity equal almost to 1% on the propeller plane. Without a dedicated assessment of the turbulence intensity level in the experimental facilities (or paint tests of the propeller to be used to adjust this parameter for current calculations), a 1% of intensity has been considered adequate on the basis of the previous analyses and many successful applications in uniform inflow conditions of this intensity level.
Table 3 Turbulence parameters calibration for γ-Reθ RANS analysesCases J Tu at inlet μt/μ k at inlet ω at inlet 2.1/3.1 1.019 2% 60 0.016 2 303 2.2/3.2 1.268 2% 80 0.025 2 354 2.3/3.3 1.408 2% 90 0.031 1 387 Due to a faster decay of the turbulence intensity, in the case of DES calculations the turbulence at inlet was set equal to 4% to achieve the desired value in correspondence of the propeller.
4 Results
4.1 Propeller performance in oblique flow
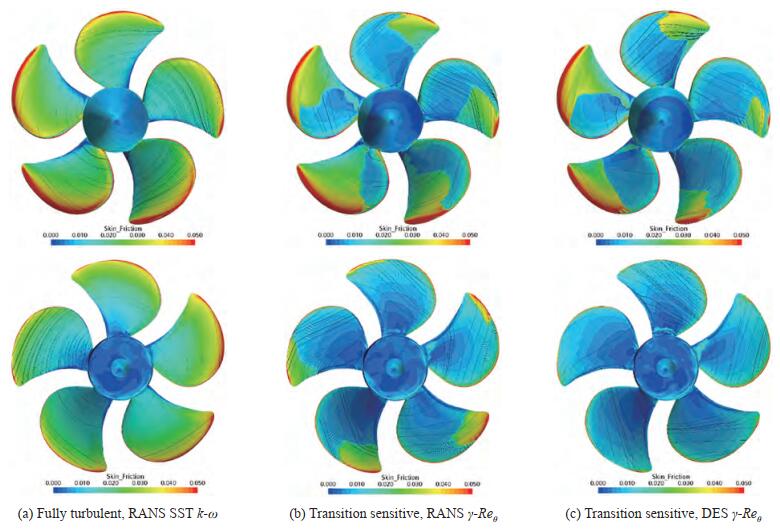
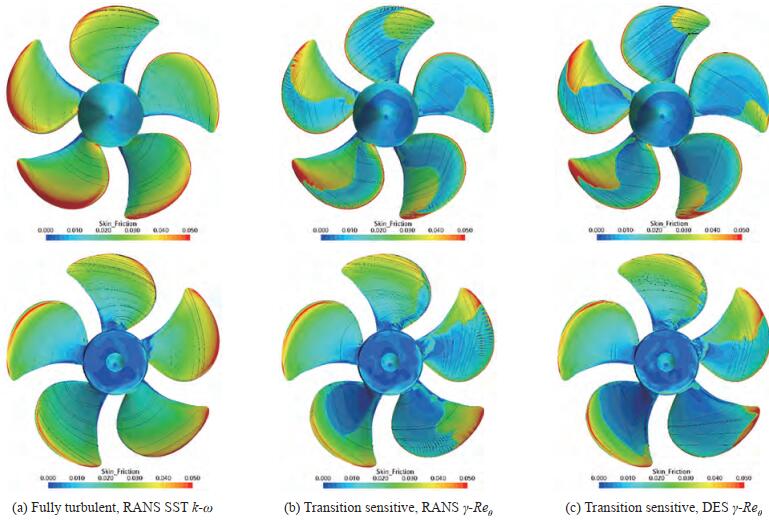
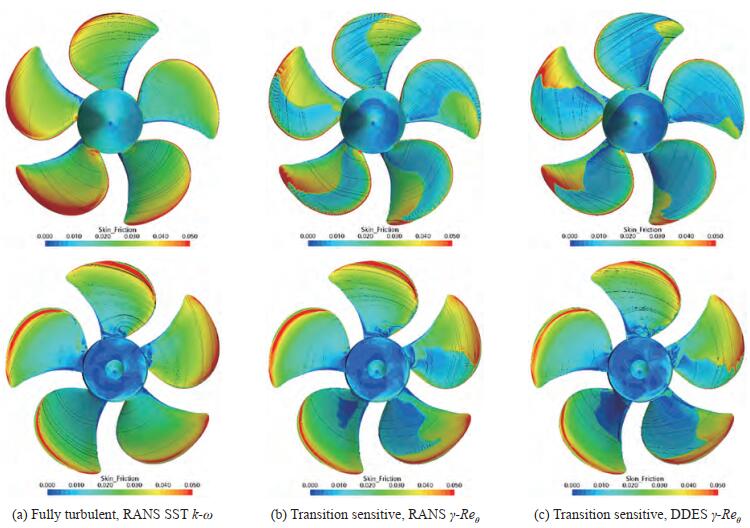
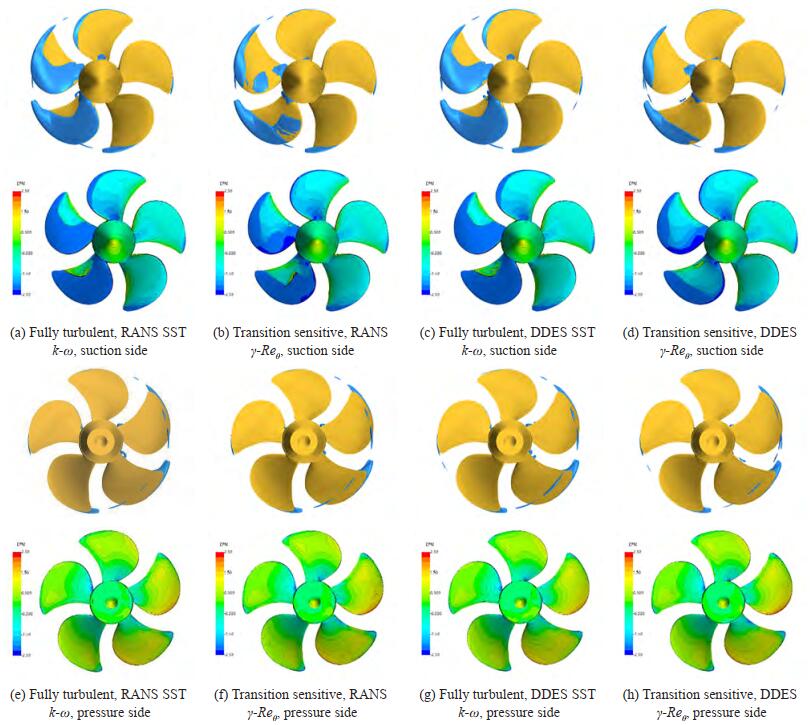
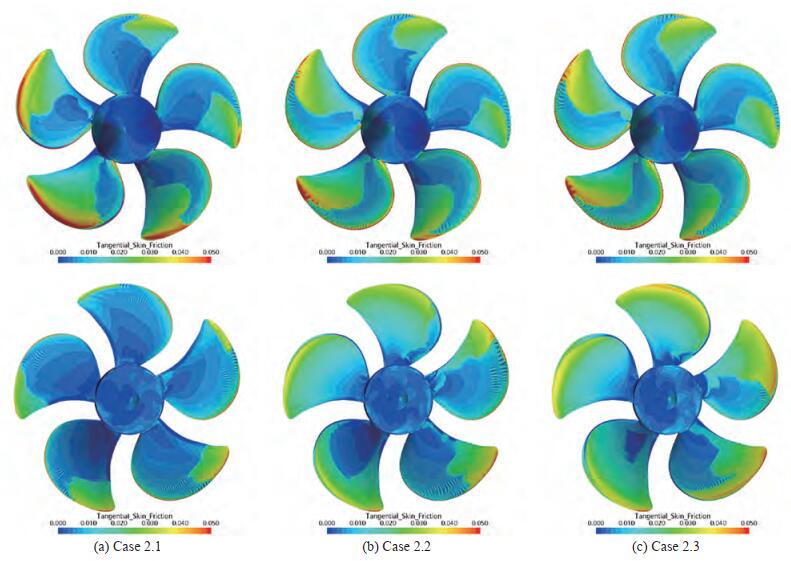
Non-cavitating conditions in oblique flow were considered at first to assess the risk of laminar-to-turbulent transition, clearly deduced from open propeller performance predictions (Gaggero 2022a), also in unsteady functioning. The presence of dominant laminar boundary layer at the blade leading edge, regardless the blade position (i.e. blade load ing during a revolution) or the overall loading condition (i.e. the advance coefficient under investigation) is clearly observable by both the absolute value of the skin friction coefficient and by the orientation of wall limiting streamlines of Figures 4 to 6. Compared to fully turbulent analyses, the use of the transition sensitive turbulence model leads to significantly lower values of skin friction and to root-tip oriented streamlines in place of the radial ones typical of fully turbulent flow observable instead when the standard SST k-ω model is employed. The presence of laminar flow on the back side of the blade is preeminent at blade positions characterized by lower values of loading (270 – 360 deg. position) while in the 90 – 220 deg. range the development of laminar flow is comparable to that observed for the equivalent loading conditions in uniform inflow and it is mainly confined at the leading edge of the blade. At tip there is a clear evidence of turbulent boundary layer, which is more pronounced for the heavily loaded functioning condition (case 2.1) and, in general, for the most loaded blade positions.
The adoption of a transition sensitive model has a beneficial influence on the predicted propeller performances, especially for the lightly loaded conditions like those of cases 2.2 and 2.3. Similarly to what observed in uniform flow, the adoption of the γ-Reθ model fills the gap with experiments. While with the standard SST k-ω model the predicted propeller performances at J=1.019 are already very close to measurements (in this case the transition sensitive model provides an overestimation of delivered thrust slightly lower than 4%, as also observed in Ge et al., 2021a), at the higher advance coefficients the γ-Reθ almost nullifies the significant underestimation (respectively -5 and -8.5%) provided by the fully turbulent model, leading to a predicted thrust coefficient 1.1% overestimated and 3.6% underestimated respectively.
The adoption of Detached Eddy Simulations mainly confirms the outcomes of RANS equations. In fully turbulent flow also the Delayed DES model foresees a certain underestimation in correspondence of the two highest advance coefficients, identical to that evidenced by the RANSE model, while for case 2.1 (J=1.019), as in the case of RANS analyses, the predicted thrust is already very close to measurements. The skin friction coefficient distributions and the streamlines over the propeller blades are, indeed, identical (and then have not been reported).
When the transition model is turned on, the delivered thrust in correspondence of the loaded condition of case 2.1 is predicted slightly higher (+6%) than experiments, and also compared to the already overpredicted γ-Reθ calculations using RANS, the outcomes of DES analyses with the transition model show a further overestimation. For cases 2.2 and 2.3, instead, DES calculations using the γ-Reθ model behave better, providing results much closer to experiments than fully turbulent (DES) analyses, but also in this case a bit overestimated if compared to equivalent transition sensitive RANS analyses.
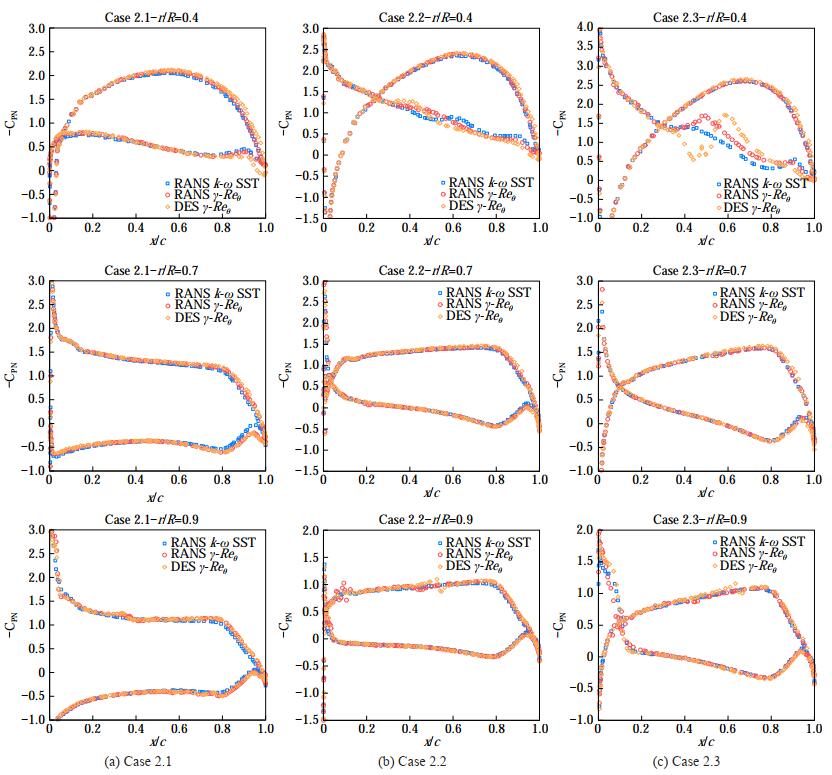
The massive presence of laminar flow, evidenced in Figures 4 to 6, is the main responsible of this. As discussed in Baltazar et al. (2018, 2020), the presence of laminar flow over the blades, with the resulting change in the streamlines orientation, has a "cambering" effect on the pressure distribution (Figure 7), that turns into the observed increase of propeller performances. This phenomenon, however, is exacerbated when the entire blade is artificially affected by laminar flow, which seems excessive given the functioning Reynolds number of the blade. This is particularly evident when DES calculations are employed. Compared to RANS analyses, the pressure side is predicted as completely covered by laminar flow (at the highest load ing condition of case 2.1) and also on the suction side the presence of laminar boundary layer is observable up to the blade trailing edge in correspondence of the lightly loaded blade positions (180–360 deg. angular range). Comparable differences are present also at the design point and at the lightest loading condition of case 2.3, where a larger portion of blade affected by laminar boundary layer is evidenced by DES calculations on both pressure and suction side. A possible reason of these differences can be found in the slightly different turbulence level in correspondence of the propeller position, that despite the additional tuning of the inlet parameters, resulted a bit lower than the prescribed 1% at which RANS calculations were carried out. Since the modified cavitation model relies on the estimation of laminar boundary layer extension and separation, this particular behavior in case of DES has significant consequences on the cavitating analyses, which are discussed in the next.
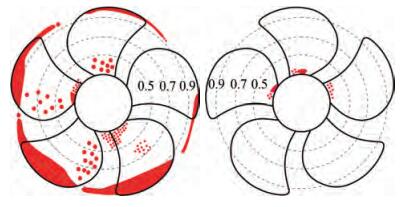
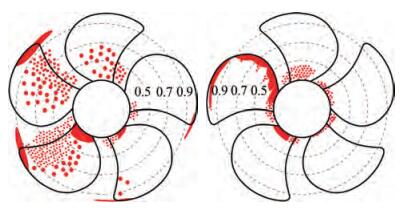
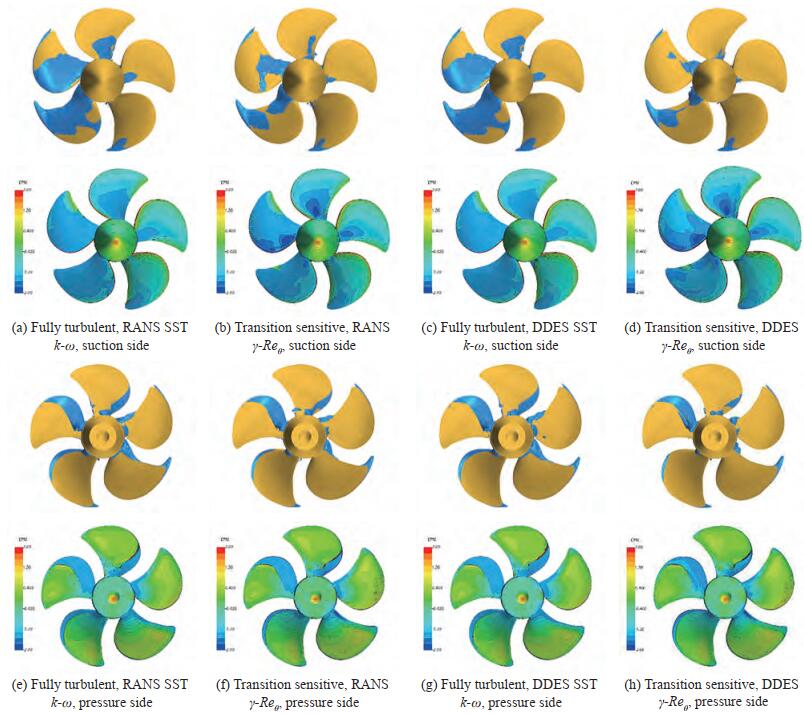
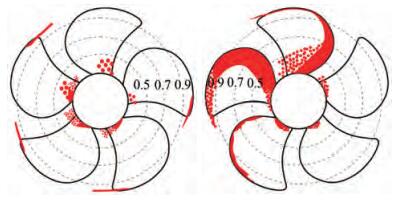
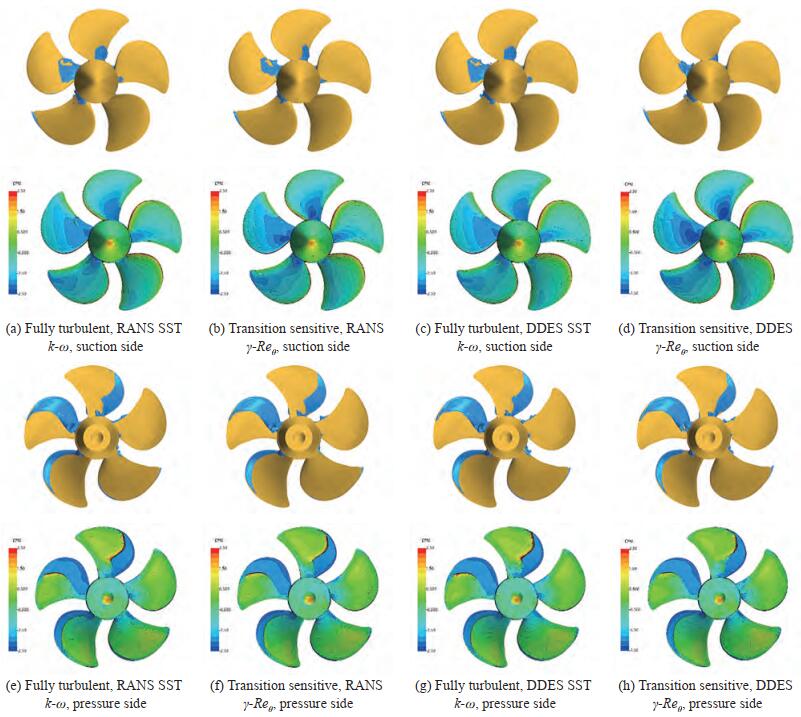
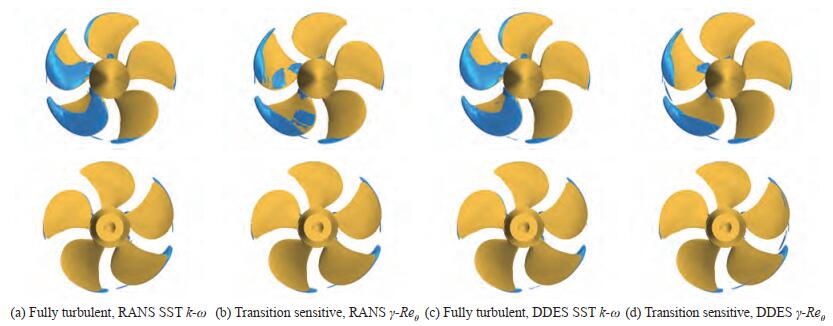
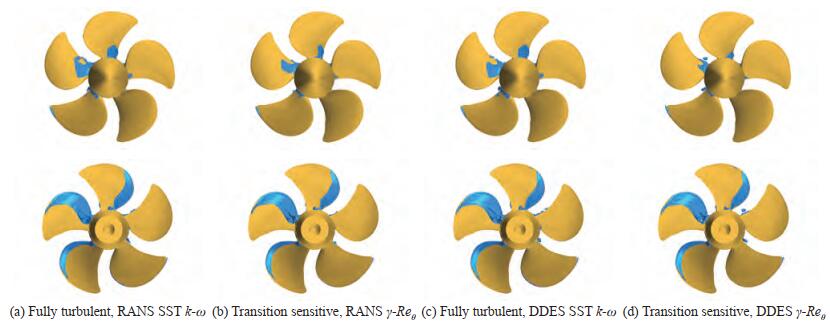
Based on these evidences, cavitating analyses were carried out employing four different combinations of turbulence and cavitation models. The original Schnerr-Sauer cavitation model was employed with the SST k-ω both under RANS and DES modeling. Its modified version was used with the γ-Reθ, considering also in this case RANS and DES. Since it was extensively shown that the negligible modifications of the pressure field provided by the application of the transition sensitive model (which in the end is a framework for the implementation of correlation-based transition models rather than a well-funded physical model of the transition process) are definitely insufficient to trigger inception with a criterion different from that based on pressure difference (Ge et al., 2019, 2021a), the application of the original cavitation model to transition sensitive analyses was deemed unnecessary. Results of calculations are collected in Figures 9, 11 and 13, and a comparison with cavitation sketches processed from experiment observations is given in Figures 8, 10 and 12.
Looking at the loaded condition of Case 2.1 it is possible to appreciate the benefits of the modified cavitation model, at least for what concern the prediction of the cavitation pattern when the RANS model is employed. From the experimental point of view, VP1304 is subjected to a rather limited sheet cavitation, mainly in the tip region (between r/R = 0.85 and r/R = 0.9, depending on the blade position), merged with a persistent (i. e., any angular position) cavitating tip vortex. On the remaining of the blade, massive bubble traveling cavitation was observed, especially for loaded positions between 90° and 180°. Bubble cavitation at root, moreover, was present on both suction and pressure side, reasonably as a consequence of the relevant thickness to chord ratio of this controllable pitch propeller. In this respect, however, it is worth noting that a second round of open water measurements, using a propeller model with slightly different leading edge finishing (SVA, 2020), highlighted the risk of streak cavitation from leading edge and, especially, a certain sensitivity to oxygen content. This indicates that the pressure at the leading edge is around the vapour pressure and that hardly controllable variations in the functioning conditions as well as in the final geometry due to manual grinding can effectively stimulate cavitation inception.
Current numerical analyses using the SST turbulence model are not different from the majority of the calculations from the participants to the workshop and from literature results made available in the meantime (Gaggero and Villa, 2017, 2018a; Ge et al., 2019, 2021a; Viitanen et al., 2020; Lungu, 2020). In most of the cases, a severe overestimation of sheet cavitation at any blade angular position was observed. That overestimation is easily observable also in the current isosurfaces of vapour (VoF = 0.5) collected in Figure 9(a). Without any boundary layer related correction, the presence of a sufficiently low pressure at the leading edge from root to tip activates the phase transition of the cavitation model with the formation of a sheet cavity bubble extending over most of the blade suction side in the angular range 0-180 deg., which is the most loaded one in the oblique flow configuration of the tests. Switching to fully turbulent DDES has no significant influence on the predicted cavitation pattern (Figure 9(c)) that is different only in the (slightly longer) extension of the cavitating tip vortex in the propeller wake.
The modification of the cavitation model, instead, seems feasible for a better estimation of the cavity pattern. The propeller exhibits a certain portion of the blade under laminar flow conditions even in the most loaded angular positions and consequently a postponement of the cavitation, which in this specific case means avoidance of sheet bubble at leading edge, is coherent with the suggested modification of the model. Also in this case, calculations predict a smooth laminar boundary layer on the pressure side, only partially affected by separation, approximatively monitored by the skin friction along the "tangential" direction of Figure 14, that is not sufficient to trigger the cavitation inception of the modified cavitation model in absence of a robust turbulent boundary layer. The proposed dampening of the vaporization constant effectively prevents the formation of a sheet cavitation bubble, and the resulting cavitation pattern is closer to the experimental observations (Figure 9(b)). When solving the RANS equations, in particular, the model predicts the sporadic presence of vapour in the shape of continuous bubbles at midchord in place of the travelling bubbles observed experimentally, in a way similarly to what evidenced in open water analyses for root cavitation phenomena. Being travelling bubbles cavitation beyond the capabilities of any homogeneous mixture models based on VoF, this approximation of midchord cavitation seems plausible.
The modified Schnerr-Sauer model is effective in avoiding the vaporization in the portion of the blade under laminar flow also when using the DES. In this case, however, the apparently overestimation of the laminar region over the suction side of the blades prevents the sporadic bubbles predicted at midchord using the same modified model but under RANS hypotheses (Figure 9(d)). Other phenomena seem not affected by the use of DDES in place of RANS: the sheet cavitation at tip for blade positions between 180° and 270° is similarly underestimated, since the bubble is predicted for r/R > 0.95 against experimental observations that highlight the presence of vapor already from r/R = 0.85. The cavitating tip vortex too, that in any case is underestimated due to a non-sufficient spatial resolution, seems qualitatively not influenced by the transition sensitive calculations.
These different cavity patterns influence the predicted propeller performances. Among the functioning points under investigation, indeed, for case 2.1 an appreciable agreement between measurements and fully turbulent calculations was observed in the results submitted to the workshop, if not in terms of absolute results in cavitating conditions at least in terms of relative reduction of performance with respect to the corresponding non-cavitating performance. The calculations with a fully turbulent model proposed in Gaggero and Villa (2018a), for instance, evidenced very good results (in that case using OpenFOAM and a computational grid composed by a tenth of the cells currently adopted) for the entire range of cavitation indexes under investigation at this loaded (J = 1.019) condition. Also recent literature results (Ge et al., 2021a) confirmed these outcomes, which are further verified by these analyses. When using the fully turbulent models (RANS or DES), indeed, the predicted thrust coefficient is very close to measurements (being overestimated by less than 2%) despite the overprediction of the sheet cavitation bubble. The application of the transition sensitive cavitation model reduces the agreement between measurements and calculations. The overestimation increases to 6 and 8%, respectively for the γ-Reθ applied to RANS or to DES. DES analyses, in particular, prevent the development of the cavitation bubble on most of the back side due to the overestimation of the laminar boundary layer extension (or insufficient development of turbulent flow). This leaves relevant portions of the blade, those visible in Figure 9(d), subjected to values of suction much higher than the vapour pressure, with obvious consequences on the predicted (overestimated) performances in cavitating conditions.
A very similar behavior, in terms of both cavitation pattern and cavitating performances, can be discussed for case 2.2 and 2.3. At the design point (case 2.2) the application of the modified cavitation model is effective in preventing the massive sheet cavitation from leading edge, predicted, instead, by both RANS and DES on the suction side when used with the original Schnerr-Sauer formulation. In addition to the tip, where a small sheet cavity is always predicted, cavitation with RANS and the modified formulation is visible only at the root of the blades and at midchord, approximating the bubbly phenomena observed experimentally. The underestimation of the turbulent boundary layer in DES analyses disables the production terms (then the occurrence of vaporization) on most of the blade suction side. Only a hint of vapour at the very trailing edge of the blade (or just below the tip cavitation) is present and this only barely approximate the massive presence of bubble during experiments. The unloaded functioning condition of case 2.3 naturally prevents sheet cavitation on the suction side that is, indeed, absent in all the analyses. Only root bubbles, with the well-known approximation of the model, are foreseen almost for any blade position.
On the face side predictions are closer to observations regardless the adopted model since, at first, the pressure side is more prone to turbulent boundary layer (Figures 5 and 6) in these loading conditions. Moreover, the separation of the flow, which is clear from the "tangential" skin friction of Figure 14, triggers turbulence and then the cavitation inception on the pressure side, that consequently is mostly unaffected by the modification of Schnerr-Sauer model or by the adoption of DES calculations. For both loadings, a slightly overestimated sheet bubble at leading edge in the range 270–360 deg. is foreseen, especially for case 2.2, in correspondence of which the occurrence of cavitation is anticipated to angular positions closer to 180 deg. Together with the underestimation of sheet cavitation on the back side for the same angular position in case of the lower advance coefficient, this may indicate a slight difference between the numerical and the experimental setup, already pointed out in Ge et al. (2021a).
The discrepancies observed in terms of thrust breakdown for case 2.1 are exacerbated in these two additional functioning conditions. Fully turbulent calculations (i.e., original formulation of the cavitation model, RANS or DES) provide thrust breakdown that are far from those measured, but very similar to the majority of the results posted to the PPTC Workshop. If for case 2.1 the thrust difference (ΔKT = 0.028) between non cavitating and cavitating measurements was accomplished by more than 70% by the numerical calculations (ΔKT = 0.02), in case 2.2 in particular the underestimation is much more relevant since only a bit more than half of the measured thrust reduction is observed. The application of the modified cavitation model to RANS equations provides a very similar percentage reduction, with the differences observed between SST k-ω and γ-Reθ in fully wetted flow explaining the differences in predicting the cavitating performances The use of DES coupled with the transition sensitive model worsens both the thrust breakdown (45% of the measured value) and the absolute propeller performance predictions since also non-cavitating DES are quite overestimated as a consequence of the excessive laminar boundary layer over the propeller blades in fully wetted flow.
4.2 Pressure pulses
Induced pressure pulses, and the influence of different turbulent and cavitating models, were monitored through Case 3 of the workshop. Compared to Case 2, only a modification of the position of the propeller inside the cavitation tunnel was introduced, moving blades closer to the top wall of the tunnel where pressure transducers were mounted. With a tip to tunnel distance of 50 mm, the pressure pulses were collected in correspondence of 3 locations just above the propeller on the symmetry plane, as shown in Figure 1, in both non-cavitating and cavitating conditions. For this case too, both RANS and DES analyses were considered, using the k-ω SST and the γ-Reθ as turbulence models.
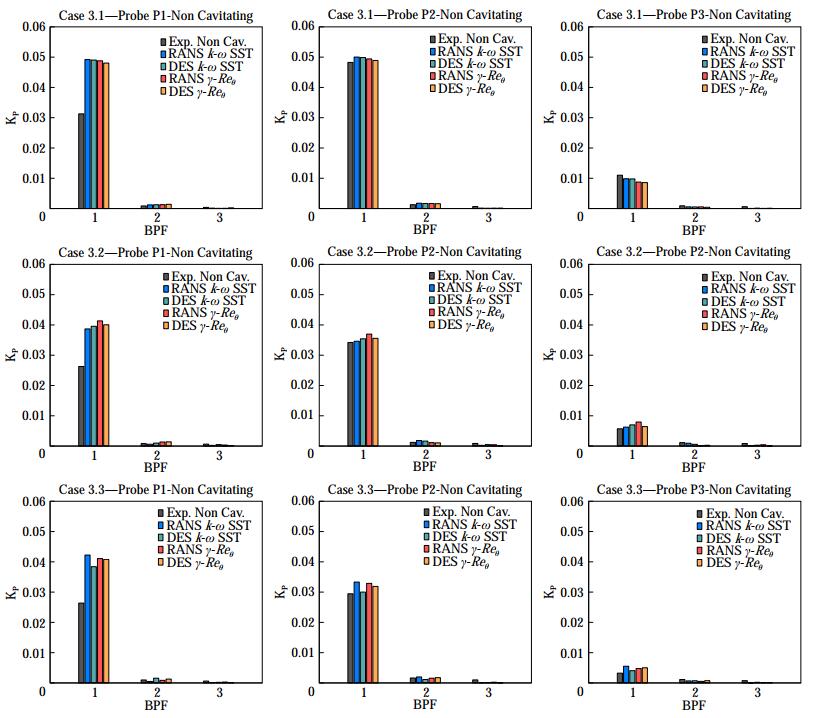
In non-cavitating condition the major source of pressure pulses is that associated with the loading of the blade and its spatial location during its revolution. The use of different numerical approaches (RANS or DES) does not affect significantly the pressure distribution over the blade, as indirectly shown by the predicted propeller performances of Table 4 or by the pressure distributions on the same propeller computed in Gaggero (2022a) and Ge et al. (2021a), as well as the use of transition sensitive turbulence model (even at very different levels of turbulence intensities) determines uninfluential and only local changes of the pressure field. A negligible influence of the different numerical methods on the predicted pressure pulses is then expected. The results, in terms of first to third order BPF pressure pulse levels of Figure 15, confirm this. In correspondence of probes P2 (just above the propeller tip) and P3 (on the pressure side) the predicted pressure pulse harmonics agree very well with the measurements. For any functioning conditions the difference with experiments is lower than 10% at P2. For the lightly loaded condition of case 3.3 differences are exacerbated in correspondence of the pressure side probe (P3) where, however, pressure pulses are very low. Only predictions at P1 show substantial differences with respect to measurements. Despite the good agreement between numerical methods, predicted values of first harmonic pressure pulses are on average 50% overestimated compared to experiments. In any case, this is a result in line with those collected during the 2nd PPTC Workshop.
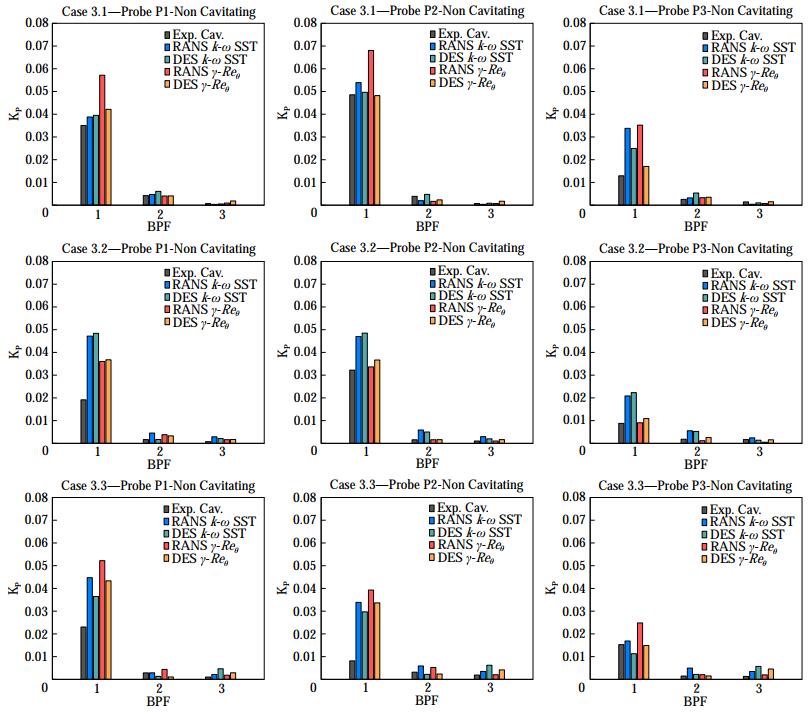
Table 4 Propeller performances in the non-cavitating conditions of case 2Case 2.1 Case 2.2 Case 2.3 KT 10KQ KT 10KQ KT 10KQ Exp. 0.391 - 0.265 - 0.189 - RANS, SST k-ω 0.390 0.983 0.252 0.711 0.173 0.544 RANS, γ-Reθ 0.406 1.007 0.268 0.729 0.182 0.551 DDES, SST k-ω 0.389 0.981 0.251 0.709 0.173 0.542 DDES, γ-Reθ 0.414 1.024 0.272 0.742 0.192 0.574 Table 5 Propeller performances in cavitating conditions (Case 2)Case 2.1 Case 2.2 Case 2.3 KT 10KQ KT 10KQ KT 10KQ Exp. 0.363 - 0.167 - 0.123 - RANS SST k-ω 0.370 0.952 0.195 0.604 0.131 0.474 RANS γ-Reθ 0.386 0.972 0.210 0.620 0.142 0.485 DDES SST k-ω 0.371 0.956 0.194 0.602 0.129 0.472 DDES γ-Reθ 0.393 0.982 0.226 0.652 0.155 0.514 Cavitating results of Figure 16, instead, are rather off from experimental measurements and no clear tendency can be appreciated by enhancing the complexity of the numerical methods employed for the analyses. Looking at first to fully turbulent analyses carried out with the original Schnerr-Sauer model under RANS or DES approximation, it is clear how the inclusion of cavitation determines a substantial overestimation of the pressure pulse levels at any points of functioning conditions 3.2 and 3.3. Only at the loaded condition of case 3.1, for P1 and P2, the predicted first harmonic pressure pulses are close to experiments, even if this result seems only a mere coincidence, since point P1 of case 3.1 corresponds to the condition of maximum overestimation of non-cavitating pressure pulses than suddenly drops in case of cavitating analyses, with an opposite behavior (measured pressure levels in cavitating conditions are higher than those in fully wetted flow) compared to experiments. Just over the blade tip, pressure levels are almost unchanged compared to non-cavitating analyses and measurements, while at the aftmost point numerical predictions foresee a substantial increase of pressure levels not observed in experiments. Cases 3.2 and 3.3, that experimentally correspond (probes P1 and P2) to a reduction of the pressure pulses when the propeller is cavitating, present the highest discrepancies despite the very good predictions in fully wetted flow since fully turbulent calculations almost double the pressure levels at these locations, with values higher than those of the non-cavitating conditions.
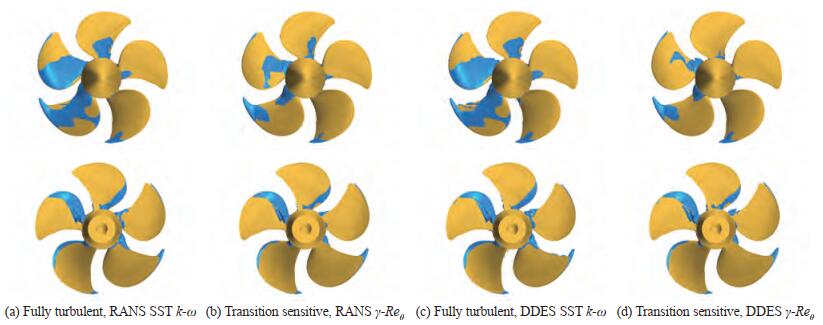
Unfortunately, also the calculations using the modified cavitation model are ineffective for more accurate pressure pulses predictions in cavitating flow. The massive overestimation of sheet cavitation observed when using the original cavitation model in current analyses and in most of the results of the participants to the PPTC Workshop inspired the idea that a better prediction of the cavitation inception and development, consistent with observations, could have led to a better estimation of the pressure pulses too. The predictions, instead, result only merely improved, as already observed by Ge et al. (2019) using a similarly modified cavitation model applied to two distinct model propellers operating in similar flow regimes. The change in the relative positioning between the propeller and the tunnel walls of this Case 3, indeed, does not alter the performances of the propeller, which predicted cavitation patterns are shown in Figures 17 to 19. As for Case 2, the application of a cavitation model influenced by the laminar or turbulent nature of the flow over the propeller blades turns into a reduction of the sheet cavitation bubble extension, which is prevented on most of the central portion of the blades where, experimentally, only traveling bubbles and intermittent cavitation streaks were observed indeed. Exactly as in Case 2, only few cavitating structures persist at midchord in correspondence of loading conditions 3.1 and 3.2, while the pressure side sheet cavitation of case 3.2 and especially 3.3 is almost unaffected by the modification of the cavitation model since on the face the inception is driven by the flow separation. This favorable, but only qualitative, modification of the cavitation pattern that had some influence on the propeller performances, has almost no positive effects on the induced pressures. In the case of RANS analyses at the higher loading condition, indeed, the predicted first harmonic accounting for the laminar-to-turbulent transition is the highest among the available results. The use of DES seems to mitigate this overestimation, since the same modified cavitation model leads to overall improved predictions, especially looking at the central (P2) and at the aftmost (P3) sampling point also at the design and at the lightly loaded condition, but results in most of the cases are however far from the measurements.
Reasons of these poor performances can be found exactly in the only qualitative influence on the cavitation phenomena introduced by the modified cavitation model. Observations at the cavitation tunnel, indeed, show an extremely rich dynamics of vapour bubbles over the blades, especially at the higher loading condition and at the design point. It is not the case of few, sporadic, bubbles of a cavitating propeller characterized by a dominant leading edge sheet cavitation governed by the unsteady loading of the propeller blade, and then easily describable with the usual "thickness" approximation (i.e. the second time derivative of the cavitating vapour volume) correctly captured by this modified mass transfer model, as done with success, for instance, in Ge et al. (2020). Current cases, instead, are characterized by massive bubbles (completely prevented in numerical calculations) that for sure have an influence on both the propeller performances and the induced pressure levels. The proposed modification works to dampen the vapour production in regions where laminar flow is prevalent, then avoiding the unrealistic sheet cavity bubble that usually in homogeneous VoF based approaches uniformly replaces the bubble cavitation at midchord, without substituting it with "true" bubble dynamics and interactions. If this was sufficient to improve the predictions of the sheet cavitation extension in uniform (steady) flow especially in the case of propellers affected mainly by sheet cavitation, as in the case of the VP1304 propeller itself and the Princess Royal test case (Gaggero, 2022b), with decent results also in terms of predicted forces under cavitating conditions, this approach seems ineffective to deal with strongly unsteady phenomena where missing traveling bubbles dynamics is a limitation as serious as that represented by the modeling of this phenomenon using the sheet cavity bubble approximation, which is typical of any non-modified mass transfer model under homogeneous VoF assumptions.
5 Conclusions
In present work, the improvements in model scale propeller performance predictions under cavitating conditions in unsteady regime (oblique flow) provided by the transition sensitive mass transfer model proposed in Gaggero (2022b) have been discussed. An acknowledged benchmark, the VP1304 propeller from the PPTC Workshop, was considered to assess the reliability of the proposed modelling approach and to investigate the possibility of improving the induced pressure level predictions, which raised as a crucial issue for this propeller. To this aim, also Detached Eddy Simulations were included in the analyses, verifying at the same time the feasibility of the modified cavitation model under this modelling assumption. The complete set of cases (from highly to lightly loaded conditions) collected during the workshop was addressed to assess the reliability of the proposed approach for a variety of functioning conditions (and cavitation regimes), including sheet cavitation on suction and pressure side, and massive bubble cavitation.
Results can be discussed in terms of predicted propeller performances (in non-cavitating and cavitating conditions), cavitation extension, and induced pressure pulses levels.
As already observed in the case of homogeneous inflow conditions (i. e., open water tests), the transition sensitive model evidenced consistent portions of the propeller blades under laminar flow. This corresponds to a local modification of the pressure field which is sufficient to improve the performance predictions of RANS and DES in model scale. Result, with the exception of few conditions discussed in the paper, are better in agreement with measurements, proving the reliability and credibility of transition-sensitive calculations also for unsteady model scale propeller performance predictions.
The adoption of the modified cavitation model had a heavy, positive, impact on the qualitative prediction of the cavitation extension, since most of the spurious sheet cavitation covering the blade at the loaded and at the design conditions not observed in experiments was prevented, leading to predicted cavity extension better in agreement with experimental observations. Only limited vapour structures (without the massive travelling bubbles of experiments) are visible at midchord of the suction side when the modified cavitation model is employed, while pressure side phenomena, driven by separation, are barely influenced by the proposed modification. This qualitative avoidance of vapour at midchord, without modification of the non-cavitating pressure distributions, however, deteriorates the predicted propeller cavitating performances which are, indeed, always overestimated with respect to the already overpredicted values of cavitating thrust and torque in fully turbulent flow.
No positive effects on the predicted induced pressure pulses, instead, were possible by the modified cavitation model. In non-cavitating conditions, where the "thickness" (i.e. displacement of fluid) and the "loading" (i.e. fluctuating pressures) effects of blades play the most important role, calculations reasonably predict (in line with the results of the Workshop) the first and second harmonics at any of the blade loading conditions and using any of the proposed models. In cavitating conditions, the agreement with measurements is in general poor and also the apparent improvement of the cavitation bubble prediction does not provide better pressure levels. Reasons of these differences can be found in the nature of the cavitating phenomena, which are far from the predictive capabilities of the model. As the presence of travelling bubbles (not predictable with this numerical approach) alters the propeller performances, an even more relevant influence can be expected in terms of induced pressures, where the dynamic of any cavitating bubble contribute to the induced pulse levels.
Results, in any case, are not conclusive. The modification of the cavitation model, in the end, is an empirical correction that requires further validations and calibrations, enlarging the set of geometries, functioning conditions and cavitation phenomena, in particular to verify the possible improvements also in unsteady functioning of less complex cases (i. e., leading edge sheet cavitation only), like those positively addressed in steady flow. Also, the role of the remaining parameters (nuclei concentration and size) of the cavitation model, as well as the modifications of condensation term, useful in case of desinence, could be worthy of investigation.
Competing interest The author has no competing interests to de‐clare that are relevant to the content of this article. -
Figure 1 Computational domain of VP1304 (tunnel/propeller clearance for pressure pulses prediction) with the pressure probe locations (Kinnas et al., 2015) for induced pressure pulses sampling
Notes: In yellow the sliding interface coupling the inner (propeller, rotating) and outer (fixed) domain
Table 1 Main geometrical characteristics of the VP1304 propeller
Model scale diameter (mm) 250 Pitch/D at r/R = 0.7 1.635 Chord/D at r/R = 0.7 0.417 Skew at tip (°) 18.8 Blade Area Ratio 0.779 Hub Diameter Ratio 0.30 Number of Blades 5 Table 2 Functioning condition for the VP1304 propeller
Cases J Rer/R=0.7(×106) σN Tip clearance (mm) 2.1/3.1 1.019 1.32 2.024 160/50 2.2/3.2 1.268 1.38 1.424 160/50 2.3/3.3 1.408 1.47 2.000 160/50 Table 3 Turbulence parameters calibration for γ-Reθ RANS analyses
Cases J Tu at inlet μt/μ k at inlet ω at inlet 2.1/3.1 1.019 2% 60 0.016 2 303 2.2/3.2 1.268 2% 80 0.025 2 354 2.3/3.3 1.408 2% 90 0.031 1 387 Table 4 Propeller performances in the non-cavitating conditions of case 2
Case 2.1 Case 2.2 Case 2.3 KT 10KQ KT 10KQ KT 10KQ Exp. 0.391 - 0.265 - 0.189 - RANS, SST k-ω 0.390 0.983 0.252 0.711 0.173 0.544 RANS, γ-Reθ 0.406 1.007 0.268 0.729 0.182 0.551 DDES, SST k-ω 0.389 0.981 0.251 0.709 0.173 0.542 DDES, γ-Reθ 0.414 1.024 0.272 0.742 0.192 0.574 Table 5 Propeller performances in cavitating conditions (Case 2)
Case 2.1 Case 2.2 Case 2.3 KT 10KQ KT 10KQ KT 10KQ Exp. 0.363 - 0.167 - 0.123 - RANS SST k-ω 0.370 0.952 0.195 0.604 0.131 0.474 RANS γ-Reθ 0.386 0.972 0.210 0.620 0.142 0.485 DDES SST k-ω 0.371 0.956 0.194 0.602 0.129 0.472 DDES γ-Reθ 0.393 0.982 0.226 0.652 0.155 0.514 -
Arakeri VH, Acosta AJ (1981) Viscous effects in the inception of cavitation. J. Fluids Eng. 103(2): 280-287. https://doi.org/10.1115/1.3241733 Baltazar J, Rijpkema D, Campos J (2018) On the use of the γ-Reθ transition model for the prediction of the propeller performance at model scale. Ocean Engineering, 170: 6-19. https://10.1016/j.oceaneng.2018.10.005 doi: 10.1016/j.oceaneng.2018.10.005 Baltazar J, Melo D, Rijpkema D (2020) Analysis of the blade boundarylayer flow of a marine propeller using a RANS solver. Ocean Engineering, 211, 107633. https://doi.org/10.1016/j.oceaneng.2020.107633 Bhattacharyya A, Krasilnikov V, Steen S (2016) A CFD-based scaling approach for ducted propellers. Ocean Engineering 123: 116-130. https://doi.org/10.1016/j.oceaneng.2016.06.011 Barkmann U, Heinke HJ, Lübke L (2011) Potsdam propeller test case(PPTC). In: Proceeding of the Second International Symposium on Marine Propulsors, Hamburg, Germany Franc JP, Michel JM (1985) Attached cavitation and the boundary layer: experimental investigation and numerical treatment. Journal of Fluid Mechanics, 154: 63-90. https://doi.org/10.1017/S0022112085001422 Gaggero S (2022a) Influence of Laminar-to-Turbulent transition on model scale propeller performances. Part Ⅰ: fully wetted conditions. Ship and Offshore Structures, 17(4): 715-727. https://doi.org/10.1080/17445302.2020.1863658 Gaggero S (2022b) Influence of laminar-to-turbulent transition on model scale propeller performances. Part Ⅱ: cavitating conditions. Ships and Offshore Structures, 17(4): 772-791. https://doi.org/10.1080/17445302.2020.1866819 Gaggero S, Villa D (2017) Steady cavitating propeller performance by using OpenFOAM, StarCCM+ and a boundary element method. Proceedings of the Institution of Mechanical Engineers, Part M: Journal of Engineering for the Maritime Environment, 231(2): 411-440. https://doi.org/10.1177/14750902166442 Gaggero S, Villa D (2018a) Cavitating propeller performance in inclined shaft conditions with OpenFOAM: PPTC 2015 test case. Journal of Marine Science and Application, 17(1): 1-20. https://doi.org/10.1007/s11804-018-0008-6 Gaggero S, Villa D (2018b) Improving model scale propeller performance prediction using the k-kL-ω transition model in OpenFOAM. International Shipbuilding Progress 67: 187-226. https://doi.org/10.3233/ISP-180146 Ge M, Svennberg U, Bensow RE (2019) Numerical Investigation of pressure pulse prediction for propellers mounted on an inclined shaft. In: Sixth International Symposium on Marine Propulsors, Rome, Italy. Ge M, Svennberg U, Bensow RE (2020) Investigation on RANS prediction of propeller induced pressure pulses and sheet-tip cavitation interactions in behind hull condition. Ocean Engineering, 209, 107503. https://doi.org/10.1016/j.oceaneng.2020.107503 Ge M, Svennberg U, Bensow RE (2021a) Improved Prediction of Sheet Cavitation Inception Using Bridged Transition Sensitive Turbulence Model and Cavitation Model. Journal of Marine Science and Engineering, 9(12): 1343. https://doi.org/10.3390/jmse9121343 Ge M, Svennberg U, Bensow RE (2021b) Numerical prediction of propeller induced hull pressure pulses using RANS and IDDES. In: Proceedings of the Ⅸ International Conference on Computational Methods in Marine Engineering, MARINE 2021. Heinke H, Lubke L (2011) The SMP 2011 workshop on cavitation and propeller performance-case 2, propeller open water perfor-mance and cavitation behaviour. In: Proceeding of the Second International Symposium on Marine Propulsors, Hamburg, Germany. ITTC (2017) Scaling of conventional and unconventional propeller, open water data. In: Report of the Propulsion Committee of the 28th ITTC. Kinnas SA, Abdel-Maksoud M, Barkmann U, Lubke L, Tian Y (2015) The second workshop on cavitation and propeller performance. In: Proceedings of the Fourth International Symposium on Marine Propulsors, SMP Korkut E, Atlar M (2000) On the importance of effect of turbulence in cavitation inception tests of marine propellers. Proceedings of Royal Society of London A: Mathematical, Physical and Engineering Sciences, 458: 29-48. https://doi.org/10.1098/rspa.2001.0852 Kuiper G (1978a) Scale effects on propeller cavitation. In: Twelfth Symposium on Naval Hydrodynamics, Washington D.C. Kuiper G (1978b) Cavitation Scale Effects-A case study. International Shipbuilding Progress, 25: 81-90 https://doi.org/10.3233/ISP-1978-2528401 Kuiper (1981) Cavitation Inception on Ship Propeller Models. PhD Thesis. Technical University of Delft http://www.marin.nl/web/Publications/Publication-items/Cavitation-inception-on-ship-ship-propeller-models.htm Langtry RB, Menter FR (2005) Transition modeling for general CFD applications in aeronautics. In: 43rd AIAA Aerospace Sciences Meeting and Exhibit. https://doi.org/10.2514/6.2005-522 Langtry RB, Menter FR, Likki D, Suzen Y, Huang P, Völker S (2006) A correlation-based transition model using local variables-Part Ⅱ: Test cases and industrial applications. Journal of Turbomachinery 128(3): 423-434. https://doi.org/10.1115/1.2184353 Langtry RB, Menter FR (2009) Correlation-based transition modeling for unstructured parallelized computational fluid dynamics codes. AIAA Journal 47(12): 2894-2906. https://doi.org/10.2514/1.42362 Lungu A (2020) A DES-SST based assessment of hydrodynamic performances of the wetted and cavitating PPTC propeller. Journal of Marine Science and Engineering, 8(4): 297. https://doi.org/10.3390/jmse8040297 Menter FR, Langtry RB, Likki S, Suzen Y, Huang P, Völker S (2006) A correlation-based transition model using local variables-part Ⅰ: model formulation. J Turbomach. 128(3): 413-422. http://dx.doi.org/10.1115/1.2184352 Morgut M, Nobile E (2012) Numerical predictions of cavitating flow around model scale propellers by CFD and advanced model calibration. International Journal of Rotating Machinery. https://doi.org/10.1155/2012/618180 Morgut M, Jošt D, Škerlavaj A, Nobile E, Contento G, Pigazzini R, Puzzer T, Martini S (2019) Numerical simulations of a cavitating propeller in uniform and oblique flow. International Shipbuilding Progress, 66(1): 77-90. https://doi.org/10.3233/ISP-180257 Salvatore F, Streckwall H, Van Terwisga T (2009) Propeller cavitation modelling by CFD-results from the VIRTUE 2008 Rome workshop. In: Proceedings of the First International Symposium on Marine Propulsors, Trondheim, Norway Schnerr G, Sauer J (2001) Physical and numerical modeling of unsteady cavitation dynamics. In: Proceedings of the 4th international conference on multiphase flow, New Orleans, Louisiana Siemens PLM (2017) StarCCM+ ver. 12.06.011 Users Guide SVA (2020) Potsdam Propeller Test Case PPTC, Update on Cavitation VP1304 vs. P1790 (https://www.sva-potsdam.de/wp-content/uploads/2020/11/PPTC-update_on_cavitation-VP1304vsP1790-1-1.pdf) Tani G, Viviani M, Felli M, Lafeber FH, Lloyd T, Aktas B, Atlar M, Seol H, Hallander J, Sakamoto N, Kamiirisa H (2019a) Round Robin test in radiated noise of a cavitating propeller. In: Sixth International Symposium on Marine Propulsors, Rome, Italy Tani G, Viviani M, Felli M, Lafeber FH, Lloyd T, Aktas B, Atlar M, Seol H, Hallander J, Sakamoto N (2019b) Noise measurements of a cavitating propeller in different facilities: results of the round-Robin test programme. In: The Sixth International Conference on Advanced Model Measurement Technology for the Maritimi Industry, Rome, Italy Vaz G, Hally D, Huuva T, Bulten N, Muller P, Becchi P, Herrer J, Whitworth S, Mae R, Korsstrom A (2015) Cavitating flow calculations for E779A propeller in open-water and in-behind conditions: Code comparison and solution validation. In: Proceedings of the Fourth International Symposium on Marine Propulsors, Austin, Texas Viitanen V, Siikonen T, Sánchez-Caja A (2020) Cavitation on modeland full-scale marine propellers: steady and transient viscous flow simulations at different Reynolds numbers.Journal of Marine Science and Engineering, 8(2): 141. https://doi.org/10.3390/jmse8020141 Walters DK, Leylek JH (2002) A new model for boundary-layer transition using a single-point RANS approach. In: ASME 2002 International Mechanical Engineering Congress and Exposition, American Society of Mechanical Engineers, 67-79 Yilmaz N, Khorasanchi M, Atlar M (2017) An Investigation into computational modelling of cavitation in a propeller's slipstream. In: Proceedings of the Fifth International Symposium on Marine Propulsors, Espoo, Finland


