A Novel Ship Domain-oriented Parameter of Ship Collision Risk Considering the Ship Maneuverability and Encounter Situation
https://doi.org/10.1007/s11804-023-00330-0
-
Abstract
The identification of ship collision risks is an important element in maritime safety and management. The concept of the ship domain has also been studied and developed since it was proposed. Considering the existing trend that the ship domain is increasingly widely used in collision risk-related research, a new domain-oriented collision risk factor, i.e., the current state of domain (CSD), is introduced in this paper, which can effectively reflect the current state and show a certain predictability of collision risk from the perspective of the ship domain. To further prove the rationality of the CSD, a series of different simulations consisting of three typical encounter scenarios were conducted, verifying the superiority of the proposed parameter. -
1 Introduction
How to effectively and accurately evaluate the risks of ship–ship collision is an important problem, especially re‐ garding the increasing maritime traffic volume (UNCTAD, 2020). Supported by advanced equipment, such as the Electronic Chart Display and Information System, automatic radar plotting aids (ARPAs), and automatic identification system, people can obtain real-time information about the movement of a particular ship and the traffic situation around it (Zhang et al., 2021a; Zhang et al., 2021b). This information, especially the dynamic information with the time series, undoubtedly lays a firm foundation for the analysis of collision risk and ship manipulative decisions. As a kind of passive warning system, the widely used ARPA system uses two classic parameters, i.e., the distance at the closest point of approach (DCPA) and time at the closest point of approach (TCPA), which is a textbook example (Chin and Debnath, et al., 2009). As relative indicators to mea‐ sure the collision risk of a single ship pair, the DCPA and TCPA are of great value and significance. For operators under actual sea traffic conditions, it is far from enough to make an accurate judgment by only relying on the state of ownership. Hence, we need some relative parameters, just like the DCPA and TCPA, but there are still some flaws. Szlapczynski thought that the major flaw of the DCPA/TC‐ PA is their ignorance of the target's bearing and aspects, and it is not its only limitation (Szlapczynski et al., 2016). Zhang W strongly argues against the possibility of misclas‐ sification in using the DCPA/TCPA for the assessment of collision risk, and they proposed a diverse indicator, i. e., vessel conflict ranking operator, which utilizes the relative speed, heading difference, and ship distance to rank the se‐ verity of ship encounters (Zhang et al., 2015). The effec‐ tiveness of the systematic method and multiple indicators in the collision risk evaluation has been proven by many research works (Liu et al., 2019; Cucinotta et al., 2017; Montewka et al., 2010; Chai et al., 2017).
One of the representative approaches among these quan‐ titative methods is the collision risk index (CRI) (Szlapczynski et al., 2021). The CRI is widely used in maritime research. However, some shortcomings seriously limit its application in different conditions, such as the weight dif‐ ference of some parameters (e. g., heading and speed) in different encounter situations (Szlapczynski et al., 2018), lack of standardization on parameters, problems in the ag‐ gregation method of variables, and lack of consideration of ship maneuverability, which has been strongly proven to be an important factor in many maritime-related works (e.g., ship arenas) (Davis et al., 1980; Colley et al., 1983). Gil introduced and developed the concept of the Collision Avoidance Dynamic Critical Area, a critical area that de‐ limits the closest distance that can be used to ensure the safety of ship encounters (Gil et al., 2020; Gil et al., 2021). This kind of research that combines ship maneuverability with the ship domain is of great reference significance for the CRI.
To assess the risk of ship collision scientifically and make the current CRI method effective, this study system‐ atically analyzes recent research works and developments concentrated on the CRI from the view of comparison. Then, a new domain-oriented collision risk factor called the current state of domain (CSD) is proposed. It aims to mine the current trend of introducing ship domain con‐ cepts into the CRI research and the analysis of the chang‐ ing regularity of ship domain-related parameters under three encounter scenarios of two ship byways of simula‐ tions, i.e., head-on situation, overtaking situation, and cross‐ ing situation. The possible collision avoidance behavior taken by ships are guided by the International Regulations for Preventing Collisions at Sea (COLREGs): paragraph (a) of Rule 14, paragraph (b) of Rule 13, and paragraph (a) of Rule 15. The ship maneuverability is considered during the simulation process. Its purpose is to be closer to the specific situation, especially in close-quarter situations (IMO, 1981), and it is implemented by the Nomoto motion equation and proportional–integral–derivative (PID) con‐ trol. The simulation results show the existing problems in the current CRI study and the superiority of our newly pro‐ posed parameters in the aspect of collision risk detection and reflection.
The rest of the paper is organized as follows: Section 2 provides a detailed review of the current CRI research from multiple perspectives. Section 3 provides an explana‐ tion of the calculation method and specific ship domain, where the CSD is also defined. Section 4 describes the sit‐ uation of various ship encounters and demonstrates the de‐ ficiencies of common CRI parameters, such as the DCPA. Section 5 describes the mathematical model used in subse‐ quent simulations and presents and analyzes the simula‐ tion results using three encounter scenarios of two ships. Section 6 provides the paper's conclusions.
2 Related works on the CRI
In the maritime field, especially maritime traffic, colli‐ sion avoidance begins with assessing the risk of collision and the category of methods that quantify the results of this risk analysis into a numerical value, i.e., CRI. When this index violates a preset threshold, a collision alarm is launched by a triggering system. The concept of the CRI was first proposed by Kearon, and the approach used in his research to obtain the specific value of the CRI was to combine the DCPA and TCPA into one parameter using a polynomial equation (Kearon et al., 1979). This became one of the methods that have been often used in subse‐ quent research.
In recent studies, it has become a trend to integrate more parameters into the CRI to obtain more scientific and reliable results, although this may cause disunity of dimen‐ sions or other problems.
Table 1 shows an overview of the factors considered in the CRI methods presented in the literature. Different methods apply different parameters, such as the DCPA/TCPA, ship position, and ship speed. Although there are many pa‐ rameters or methods available for CRI research, they still show great differences in the application frequency. The DCPA and TCPA are the most frequently used parameters in research based on actual data or simulation experiments. Some physical variables, such as ship length, ship posi‐ tion, and ship speed, are also widely used in determining collision risk. Undoubtedly, the addition of these variables makes the determination process of ship collision risk more scientific and reasonable than ever. It also includes some studies that introduce the ship domain or ship maneuver‐ ability into the collision risk assessment.
Table 1 Summary of the research on the CRIM1 M2 M3 M4 M5 M6 M7 M8 M9 DCPA and TCPA + + + + + - - + + Ship type - - - - - - - - - Ship length - + - - - + - - + Ship position - - - + + - + + + Ship speed - + - - + + + + + Ship heading - - - + + - + - - Maneuverability - - - - - - - - Encounter situation - - + - - - - - + Ship domain - - - - - + - - + Traffic complexity - - - - - - - - - Expert opinion + - + - - - - - + Simulation - + - + + - - + + Real data - - + - - + + - - Notes: M1: Chin et al., 2009; M2: Lee et al., 2001; M3: Mou et al., 2010; M4: Nguyen et al., 2018; M5: Zhao et al., 2016; M6: Zhang et al., 2019; M7: Zhang et al., 2015; M8: Gang et al., 2016; M9: Goerlandt et al., 2015. However, there are still some flaws in the current CRI research. For instance, most of the aforementioned studies ignore the impact of ship maneuverability in the process of avoiding collisions. In addition, few cases consider the encounter situation and ship domain simultaneously in the study of ship collision risk. To fill this gap, we will per‐ form a further analysis of the parameters used in current CRI studies and endeavor to propose a new parameter of the CRI that comprehensively considers ship maneuver‐ ability, encounter situation, and ship domain.
2.1 Factors in the CRI
The DCPA and TCPA are two variables of different di‐ mensions. At the quantitative analysis level, the aforemen‐ tioned dimensional problem arises. The most intuitive way to deal with this problem is weighting, where the DCPA and TCPA are integrated by assigning weights to them. Chin's approach is shown in Equation (1):
$$ \begin{array}{*{20}{c}} \ \ \ \ \ \ \ \ \ {{{\hat \tau }_{\rm{m}}} = {{\hat \beta }_1} \times {\rm{DCPA}} + {{\hat \beta }_2} \times {\rm{TCPA}}}\\ {{\rm{TCPA}} = {\rm{TCPA}}{{\frac{V}{L}}}}\ \ \ \ \ \ \ \ \ \ \ \ \ \ \ \ \ \ \ \ \ \ \ \ \ \ \ , \end{array} $$ (1) where the weight parameters are known parameters from the regression estimate process (Chin et al., 2009). This is consistent with the generalized form of CRI measurement, as shown in Equation (2).
$$ \mathrm{CRI}_1=w_1 f(\mathrm{DCPA})+w_2 f(\mathrm{TCPA}) $$ (2) This form is widely adopted because of its intuitive‐ ness, but in general, it is a relatively rough processing ap‐ proach, and the exact method to process the DCPA/TCPA is not fixed. To solve this problem, many attempts have been made.
Lee conducted nondimensionalized processing for the DCPA and TCPA and then further reasoned using the fuzzy reasoning method (Lee H J, Rhee K, 2001). The spe‐ cific mathematical methods used by him are presented as Equations (3) and (4):
Lee conducted nondimensionalized processing for the DCPA and TCPA and then further reasoned using the fuzzy reasoning method (Lee H J, Rhee K, 2001). The spe‐ cific mathematical methods used by him are presented as Equations (3) and (4):
$$ {\mathop{\rm TCPA}\nolimits} = {\mathop{\rm TCPA}\nolimits} \frac{V}{{{L^, }}} $$ (3) $$ DCPA = DCPA\frac{V}{{{L^, }}} $$ (4) where L is the length of the ship and V is the speed of the ship. The ship length and speed are also considered to some extent. An exponential relationship was established between the DCPA and TCPA values and risk in Mou's research (Mou et al., 2010). The equations are as follows:
$$ {R_{{\rm{colli }}}} = {R_{{\rm{basic }}}}{F_{{\rm{tcpa }}}}{F_{{\rm{cpa }}}}{F_{{\rm{angl}}{{\rm{e}}^{\rm{, }}}{\rm{ }}}} $$ (5) $$ {F_{{\rm{tcpa }}}} = {\exp ^{ - {\rm{tcpa/10 }}}}, $$ (6) $$ {F_{{\rm{cpa}}}} = {\exp ^{ - |{\rm{cpa}}|}}, $$ (7) where Rcolli and Rbasic stand for the dynamic and basic risks of collision, respectively; Fangle accounts for the different degrees of danger as a function of the type of encounter, and Ftcpa and Fcpa are the relative multipliers of the TCPA and CPA, respectively. tcpa is the value of the TCPA (min), and cpa is the value of the CPA (nm).
Different from the additive superposition in the general‐ ized form, multiplicative stacking was selected when the final collision risk parameters were synthesized. This is more reasonable because, first, time and distance are rela‐ tive concepts. If two ships encounter each other at a very close distance, the time left for the giving way ship to avoid collision will be shortened. Second, in some special cases, although the distance between the two ships is al‐ ready very close, it does not pose a potential high collision risk. In this case, the weighted addition of the DCPA and TCPA may lead to misjudgment.
In addition, the exponential form is more sensitive to the changes in independent variables and can better simu‐ late the rapid increase or attenuation of risks in the actual situation.
In Nguyen M. C. 's research, he also used the weighted stacking method to quantify the CRI (Nguyen et al., 2018). However, he set the weight of the TCPA at five times that of the DCPA. He believes that the TCPA has a much stron‐ ger impact on the ship collision risk than the DCPA. In his research, the value of the CRI is calculated as follows:
$$ {\rm{CRI}} = {\alpha _{{\rm{DCPA}}}}{U_{{\rm{DCPA}}}} + {\alpha _{{\rm{TCPA}}}}{U_{{\rm{TCPA}}}} + {\alpha _R}{U_R} + {\alpha _{\Delta B}}{U_{\Delta {B^, }}} $$ (8) where U DCPA, UTCPA, UR, and U∆B are the membership func‐ tions that represent the DCPA, the time to the closest point of approach, and the distance and the azimuth of the ship and target ship, respectively. Each factor has different ef‐ fects on the collision risk. The numbers αDCPA, αTCPA, αR, and α ∆B are weights ranging from 0 to 1, and they have a total value of 1. This result indicates the effects of the col‐ lision capability of each membership function on the colli‐sion risk.
This insight is very different from that of Zhao Y's re‐ search, which used the analytic hierarchy process calcula‐ tion to determine the weight values of the DCPA and TC‐ PA as 0.453 5 and 0.360 4, respectively (Zhao et al., 2016). Their outcome claims that the proportions of the DCPA and TCPA are similar and that the DCPA is slightly larger than the TCPA. However, there is still a similar point. In the studies of Nguyen M.C and Zhao Y, the DCPA and TC‐ PA play a major role in the overall CRI evaluation, ac‐ counting for more than 50% of the total, and the propor‐ tion reached more than 81% in Zhao Y's research.
In conclusion, as the earliest parameters used in ship collision risk analysis, the DCPA and TCPA still play an ir‐ replaceable role in the current CRI research and even the entire maritime research system. Moreover, many efforts have been made to integrate the new parameters into the CRI. For example, the degree of domain violation (DDV) and time of domain violation (TDV) introduced by Szlapc‐ zynski et al. have gained considerable attention (Szlapczynski et al., 2021).
2.2 Ship domain in the CRI
The ship domain or navigation safety domain was first introduced by Fuji in 1971 (Fuji Y, Tanaka K, 1971): "a two-dimensional area surrounding a ship which other ships must avoid – it may be considered as the area of eva‐ sion." The ship domain here is a relatively crude concept, but it is pioneering. Subsequently, on the basis of Fuji's work, several related research works focused on the development of the ship domain were made (Goodwin, 1975; Van der Tak and Spaans 1977; Davis et al., 1980; Hansen et al., 2013; Du et al., 2021; Zhang and Meng, 2019; Pietrzykowski, 2008; Zhu et al., 2001; Wang, 2010). The concept of the ship domain was also applied to other as‐ pects of maritime, especially those related to safety.
Fundamentally, the CRI is a value reflecting the risk of collision, and the ship domain is also for navigation safety and collision avoidance in most cases. Therefore, some re‐ searchers believe that the two concepts constitute a com‐ petitive relationship and represent two very different ap‐ proaches to risk analysis (Szlapczynski et al., 2017).
However, some studies have added certain values or change rules that can reflect the characteristics of the ship domain into the CRI analysis system (Goerlandt et al., 2014; Zhang et al., 2016).
The general rationale of a domain modeling approach in collision risk assessment takes the form of Equation (9):
$$ \mathit{f}{\rm{ = }}{\mathit{N}_\mathit{p}}{\mathit{N}_\mathit{c}}, $$ (9) where N c is the number of encounters and Nc is the causa‐ tion probability that an encounter becomes a collision (Goerlandt et al., 2014). Thus, the determination of a ship col‐ lision risk in a certain area can be divided into two process‐ es:
A. Determine the number of ship encounters in this area within a given period
B. Determine the probability of a normal encounter changing into a collision
This kind of classification is also consistent with the navigation experience that all ship collisions are the result of ship encounters, and not all ship encounters will lead to a collision between ships. The ship domain is also used in both processes.
However, regarding the role of a plethora of domain shapes, few studies have tested the link between the ship domain and potential ship collisions or collision risks (Zhang et al., 2016). This is also related to a problem with the concept of the ship domain itself, namely, its lack of universality; since Fuji came up with this concept, most of the research work relevant to the applications of the ship domain has focused on small areas or confined waters (Fuji Y, Tanaka K, 1971). Even today, about 50 years later, it is still a tough task to come up with a single-ship domain that could be applied to all circumstances. Therefore, many scholars have made explorations aimed at improving the adaptability of the ship domains; the fuzzy method and probabilistic ship domain are the typical representatives (Pietrzykowski, 2008; Zhao et al., 1993; Zhang and Meng, 2019).
Generally, the boundary of the ship domain is dealt with by the fuzzy method or a similar fuzzy method. In the face of a potential collision risk, the first step for the ownership is to make a judgment of the current situation. The subse‐ quent actions of the collision avoidance behavior are based on this kind of subjective judgment. In other words, navi‐ gators' knowledge referring to the assessment of naviga‐ tional situations makes a basis for determining the ship's fuzzy domain (Pietrzykowski, 2008).
Zhao thought that the boundary of a ship domain should be fuzzy and first proposed the concept of the fuzzy boundary for the domain (Zhao et al., 1993). The domain shapes and sizes are influenced by various factors, i.e., hu‐ man factor, type of the area, movement parameters, en‐ counter type, and size of the other ships. However, some further questions about these influencing factors are not fully answered in the article, including the specific deter‐ mination of a variety of human factors (e. g., knowledge, skills, and mental and physical qualities). Considering the numerous parameters above, the complexity of ship do‐ mains and related computations in practical applications have been considered by some researchers (Szlapczynski et al., 2016). Faced with these problems, a kind of ship do‐ main named the probabilistic ship domain is also a promising approach.
Zhang and Meng proposed a novel probabilistic ship do‐ main named α -domain, which could be intrinsically suit able for ship collision risk evaluation (Zhang et al., 2019). Specifically, the risk level determined by the probabilistic ship domain is a continuous value. Compared to the tradi‐ tional ship domain models, it is more suitable for quantita‐ tive collision risk.
Essentially, the probabilistic domain is data-driven, whereas the fuzzy domain always depends on expert knowledge.
2.3 Numerical continuity and risk grading of the CRI
Compared to the traditional ship collision risk analysis, the biggest characteristic of the CRI is its quantitative ex‐ pression of risks that makes risk analysis more scientific and accurate. Moreover, some approaches that could only provide the results of two risk statuses, i.e., risk or safe sta‐ tus. This is the scientific and interpretable advantage of the CRI.
Meanwhile, the exact numerical representation of a risk may not be very helpful or convenient to the navigator or the monitor's judgment, especially methods that use com‐ plex mathematical processes in the final synthesis of CRI results. Therefore, the grading of the CRI is also a fixed way during processing.
A common classification method is to classify the risk of ship collisions into three levels. According to Nguyen M.C's research, when CRI ≥ 0.666 7, there is a high proba‐ bility of collision, so the vessel needs to take immediate action to avoid the collision. When 0.333 3 ≤ CRI < 0.666 7, it is likely to collide, so the vessel needs to be not‐ ed. When CRI < 0.333 3, there is a low probability of colli‐ sion, so the vessel needs to be tracked (Nguyen et al., 2018). A similar division can be seen in Zhou and Wu's re‐ search, where the vessel collision risk is divided into three levels according to the CRI: "low risk" (0 ≤ CRI < 0:4), "moderate risk" (0.4 ≤ CRI < 0:7), and "high risk" (0.7 ≤ CRI < 1) (Zhou et al., 2004). This is not the only classifica‐ tion of the CRI. For example, Gang L believes that the rat‐ ing threshold determined by Zhou and Wu can be appropri‐ ately adjusted according to the actual situation (Gang et al., 2016).
Furthermore, most of the assessment grades of the CRI were divided in an equal way. The difference only exists in the number of categories of the CRI that the researchers classified as corresponding to the risk. Different from the methods used in the two studies mentioned above (Nguyen et al., 2016; Zhou et al., 2004), Zhao et al. (2016) graded the risk into five levels: "extremely high risk" (EH), "high risk" (HR), "moderate risk" (MR), "slight risk" (SR), and "safe" (S), and the risk interval related to each level is [1– 0.8) [0.8–0.6) [0.6–0.4) [0.4–0.2) [0.2-0]. This is a more nuanced classification. However, unlike Zhou and Wu's re‐ search, there are no recommendations about the specific actions that should be taken by the navigators.
3 Analysis of the proposed domain-based parameters
Combined with the above analysis related to the ship collision risk, we consider it promising to introduce the ship domain and its derived parameters into the quantita‐ tive analysis of the CRI. In this section, a new domain-ori‐ ented collision risk factors the CSD is introduced, which is a domain-based parameter that could be used in the CRI system. The related analysis and calculation methods of the CSD are also described.
3.1 Definition of the CSD
The CSD is a domain-based value used to quantify the DDV and reflect the dynamic trend of its change in the current ship encounter situation. It is not a static parameter that simply represents the current situation but more of a dynamic state tracking and monitoring method that could take into consideration the changing rate of the ship do‐ main state.
The CSD is calculated based on two parameters: the overlapped area of the ship domain and the rate of change of the overlapped area. To be specific, under a given cir‐ cumstance, the mathematical function of the CSD can be defined as Equation (10):
$$ \mathrm{CSD}=S_{\text {poa }} / S_{\text {domain }}+k \times R_s \text {, } $$ (10) where Spoa is the area of the overlapped domain, Sdomain is the area of the ship domain, Rs is the changing rate of the proportion of the overlapped domain, and k is a coefficient that is determined by Equation (12).
$$ R_s=\left(S_{\mathrm{poa}} / S_{\text {domain }}\right)_t-\left(S_{\mathrm{poa}} / S_{\text {domain }}\right)_{t-1} $$ (11) $$ \left\{\begin{array}{ccc} {k=0} & \text { head }- \text { on } \\ \text { if } R_s>0 & k=-10 & \\ \text { if } R_s<0 & k=10 & \text { crossing } \\ \text { if } R_s>0 & k=-5 & \\ \text { if } R_s<0 & k=5 & \text { over taking } \end{array}\right. $$ (12) To facilitate subsequent description, Spoa/Sdomain is abbre‐ viated as POA (proportion of the overlapped area), so this formula can also be expressed as follows:
$$ \mathrm{CSD}=\mathrm{POA}+k \times R_s $$ (13) We assigned different values to the parameter k accord‐ ing to different situations, which is first related to the val‐ ue of R S. If RS is positive, the value of parameter k is negative; otherwise, the value of parameter k is positive. The purpose of this design is to achieve the correction effect of the RS parameter on the POA parameter, i. e., the change rate of the overlapping area in the ship domain on the cur‐rent overlapping area in the sense of collision risk determi‐ nation. It also makes the proposed CSD parameter dynamic. In addition, the specific value of the parameter k was determined according to the different situations of the meeting.
When two ships of different sizes encounter each other, according to our method that relies on the vessel size as a part of the domain definition, there will inevitably be conflicting judgments about the danger of collision between the two ships. Therefore, we stipulate that the CSD value is equated between two vessels using the maximum value calculated from the viewpoint of each individual vessel. Similar approaches can be seen in other studies of the ship collision risk (Bukhari, A. C et al., 2013; Goerlandt, F., et al, 2015).
3.2 Eccentric elliptical ship domain
In this study, we selected an elliptic ship domain that will be used in the following research, and its specific shape is shown in Figure 1.
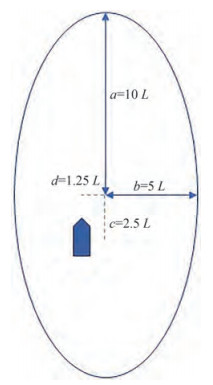 Figure 1 Eccentric elliptic ship domaina–semi-major axis, b–semi-minor axis, c–deviation of the ship's center on the long axis, d–deviation of the ship's center on the minor axis
The major reasons for choosing this kind of ship do‐ main are as follows:
1) A standard shape of the ship domain is convenient for subsequent mathematical expression and approximate pro‐ cessing.
2) Eccentric is a prominent character of the classic do‐ main; the hull is not at the center of the elliptic ship realm, that is, the starboard part is larger than the port part and the fore part is larger than the back part. This feature is widely inherited and accepted that it remains in this article.
3) Some recent views about ship domains have been re‐ viewed. In particular, some statements about navigators may incline to larger domains in many cases (Hansen et al., 2013). Therefore, a domain with a larger size is selected in this study to better focus the analysis on the overlapped domain area.
4) The length of the semi-major axis and semi-minor ax‐ is, which are the two most important variables in determin‐ ing the elliptical ship domain, is considered. Unlike some classic research that does not allow the overlapping of ship domains (Fujii Y, Tanaka K, 1971), the idea of our study is to allow a certain extent of ship domain overlap and ana‐ lyze the rate of change of the overlap on this basis. There‐ fore, a bigger ship domain size is needed to maintain the continuity of parameters related to the ship domain through‐ out the ship collision avoidance process. In other words, although a larger domain will lead to many more domain violations, it also means that they are more sensitive to small changes in the change rate. Eventually, we chose the eccentric elliptical ship domain with a = 10 L and b = 5 L, which has also been applied in other studies on ship do‐ mains (Szlapczynski et al., 2016).
3.3 Explanation of the CSD
It is not an uncommon practice to introduce the overlap‐ ping phenomena of the ship domain as an indicator of ship collision alarm or analysis. Some researchers have consid‐ ered that the risk of collision exists as long as two ship do‐ mains are overlapping and that the ship should take eva‐ sive actions immediately (Kijima et al., 2003). Hence, they believed that the ship domain should occupy a decisive role. This view may be rational and acceptable when only taking the small ship domain into account. However, in the case of this circumstance, we could only draw a rough bi‐ nary conclusion, safety or danger, and the specific colli‐ sion risk cannot be effectively quantified. Hence, it is more reasonable to make a direct quantitative analysis of the overlapping phenomenon of the ship domain.
In addition, it is not sufficient to evaluate a situation by only considering a certain moment of parameters, especially for a continuous process of movements, such as ship en‐ counters. Taking the ship domain overlap as an example, in some cases, although the current overlapped area is large, the rate of change is also large, so the overlapped area be‐ tween the two ships is rapidly decreasing, and they are rap‐ idly moving away from each other. Thus, it is not reason‐ able to infer that there is a high risk of collision between the two vessels. However, if we only consider the current performance of the overlapped area, it is easy to make a false judgment. For example, Szlapczynski's DDV parame‐ ter quantifies the risk degree between the target ship and the own ship by enlarging or shrinking the target ship's domain at a specific moment (Szlapczynski et al., 2016). Such a treatment is similar to the idea of calculating the POA in the CSD calculation formula proposed in this paper. That is, the DDV can only represent the risks deter‐ mined by the location of the target ship and own ship and their respective ship domain at the current time. Such pa‐ rameters can be misleading when dealing with some spe‐ cial cases, as shown in Figure 2. The same is true for small overlapped areas but rapidly increasing situations. A sche‐ matic diagram of the above two cases is shown in Figure 2
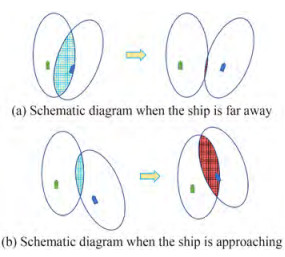 Figure 2 Schematic diagram of a moving ship
Taking the abovementioned samples into consideration, we decided to combine the overlapped area of the ship do‐ main and the rate of change at which the two ships encoun‐ ter to produce a parameter that can better describe the changing situation in the domain violation.
In addition, considering the dimension and numerical problems, the phenomenon of "a large number submerges the small number" occurs when the overlapping areas of the two vessels are directly superimposed with their chang‐ es. In other words, due to the small value of the change in the overlapped area, it will be diluted by the larger value of the change of the overlapped area to a large extent. Hence, the final result cannot effectively reflect the dy‐ namic trend change of the ship domain.
Therefore, at the mathematical level, we chose to divide the area of the overlapping part of the ship domain by the area of the whole ship domain. The obtained overlapped area is then superimposed with the change rate. The factor that can reflect the situation of the ship domain in the ship encounter, namely CSD, can be obtained through this pro‐ cessing method.
4 Examples of the deficiency of the DCPA
In this section, we will first discuss the DCPA, which is the most commonly used parameter in the current CRI analysis. By comparing the parameters of the DCPA and domain-based parameter, the necessity of introducing the ship domain, especially the overlapped area of the ship do‐ main, into the collision risk study is further illustrated.
To make the comparison results representative, we se‐ lected 15 scenarios under three main encounter situations: head-on, overtaking, and crossing. For the 15 encounters, the specific situations are in line with or close to the nearmiss concept.
This setting aims to control the variables to a certain ex‐ tent. A near-miss itself is also a concept closely combined with collision risk in maritime research, and it is reason‐ able to use it as the uniform setting standard for specific situations. Generally, a near-miss is a situation in which encountering ships have almost collided (but without any physical contact) (Szlapczynski et al., 2021). In our re‐ search, we adopted Yoo Sl's definition of a near-miss be‐ cause of its conciseness. He defined a near-miss as thresh‐ olds of DCPA < 0.1 NM, TCPA < 3 min, and ship distance < 0.3 NM (Yoo et al., 2018). The schematic diagram of vari‐ ous scenarios is shown in Figure 3.
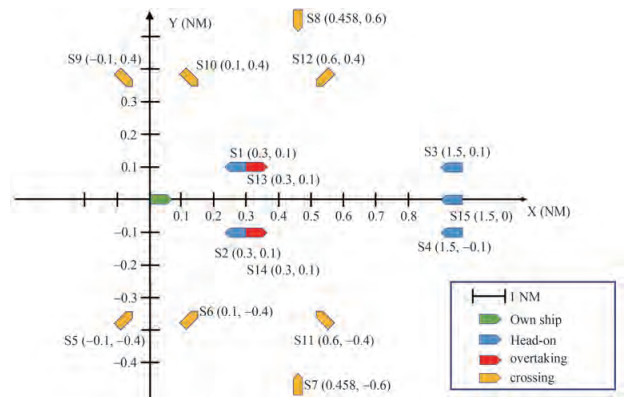 Figure 3 Description of various scenarios
The relevant data in Figure 3 are gathered in Table 2.
Table 2 Detailed data of various scenariosSituation Target X Target Y DCPA TCPA (s) Ship distance Ship domain violation (%) Own ship speed (°) Target ship speed (°) Relative VX Relative VY S1. head-on 0.3 0.1 0.1 76 0.312 5 50.70 7-90 7-270 -14 0 S2. head-on 0.3 -0.1 0.1 76 0.312 5 86.30 7-90 7-270 -14 0 S3. head-on 1.5 0.1 0.1 179 1.495 1.78 13-90 17-270 -30 0 S4. head-on 1.5 -0.1 0.1 179 1.495 6.30 13-90 17-270 -30 0 S5. crossing -0.1 -0.4 0.1 143 0.409 6 43.14 10-90 10.2-45 0 10 S6. crossing 0.1 -0.4 0.1 143 0.409 6 41.05 10-90 10.2-45 0 10 S7. crossing 0.458 -0.6 0.1 180.3 0.74 39.90 10.5-90 10.5-0 -10.5 10.5 S8. crossing 0.458 0.6 0.1 180.3 0.74 31.14 10.5-90 10.5-180 -10.5 -10.5 S9. crossing -0.1 0.4 0.1 143 0.409 6 49.51 10-90 10.2-135 0 -10 S10. crossing 0.1 0.4 0.1 143 0.409 6 51.35 10-90 10.2-135 0 -10 S11. crossing 0.58 -0.4 0.1 186.2 0.700 9 58.70 6-90 6.2-315 -12 6 S12. crossing 0.58 0.4 0.1 186.2 0.700 9 36.40 6-90 6.2-225 -12 -6 S13. overtaking 0.3 0.1 0.1 179 0.314 6 66.68 10-90 4-90 6 0 S14. overtaking 0.3 -0.1 0.1 179 0.314 6 66.65 10-90 4-90 6 0 S15. head-on 1.5 0 0 179 1.5 4.39 13-90 17-270 -30 0 A total of 15 specific situations of the three types of en‐ counters can be observed. Compared with the figure above, for the own ship placed in (0, 0), the simulation results shown in the picture have covered the most common en‐ counters, which include the target ships coming in differ‐ ent directions and at different speeds. In these cases, the own ship is not always a stand-on ship according to COLREGS. This setting is convenient for analyzing the collision risk after adopting collision avoidance behavior.
According to the data in the table, the DCPA parameter for all the encounter situations, which include S1 to S14, is 0.1 NM. However, the proportion of the overlapped area (POA) of each corresponding encounter is quite different. In terms of numerical analysis, the distribution ranges from a minimum of 1.78% to a maximum of 86.30%. Moreover, both extremes occur under the head-on encounter, i.e., S2 and S3. This is a great example of the limitations of the DCPA. For S2 and S3, except for the same DCPA value of 0.1 Nm, other parameters, such as the relative speed and the relative position of ships, are greatly different, and S2 fully conforms to Soo Sl's definition of a near-miss. Based on the abovementioned data and navigation knowledge, the encounter type of S2 is much more dangerous than that of S3. In addition, the POA can significantly indicate the difference in collision risk between them, but only relying on the DCPA in this case may result in misleading.
Another phenomenon is worthy of attention, unlike the aforementioned head-on encounter scenario, which has a significant difference in the distribution of POA values. When two ships form a crossing encounter, the POA, i.e., the value of the proportion of overlapped domain areas, is relatively stable, and the value is concentrated between 30% and 60%. Based on the simulation results, crossing encounters are always accompanied by a medium level of domain violation. In other words, just from the perspective of the ship domain, there is a certain risk of collision. The simulation results are also consistent with the results of some studies that focused on the intersection angle of ship encounters (Szlapczynski et al., 2018).
In summary, this chapter conducts a simulation analysis of the situation of ship encounters in a near-miss or closeto-near-miss state. In particular, there is a great difference in the actual risk degree under the specific encounter situa‐ tion when the DCPA index is 0.1 nm. In addition, the com‐ parison between the POA and DCPA in the same situation explains to some extent the rationality of introducing the ship domain, especially the overlapped area of the ship do‐ main, into the risk analysis. This is the basis for the evalua‐ tion performance under the consideration of collision avoid‐ ance behavior in the next section.
5 Dynamic performance of the CSD
In the previous chapter, we considered the near-miss sit‐ uation as a centralized background for risk analysis and conducted a simulation analysis on 15 specific ship encounter scenarios. Through a comparative analysis of data, the effectiveness and sensitivity of the POA in reflecting ship collision risk are explained to a certain extent. How‐ ever, all of the above situations are static. That is, although in each case, dynamic information, such as the ship's speed and heading, are set separately, we only analyzed the situa‐ tion of ship encounters under a specific time node, which is not enough for a complete evaluation of the perfor‐ mance of the CSD factor during the entire procession of ship encounters.
For the above consideration and also for the continuity of the study, in this section, we will further analyze the dy‐ namic ability of the CSD parameter to describe risk chang‐ es in the collision avoidance process considering ship ma‐ neuverability and COLREGS.
5.1 Mathematical model of the ship maneuvering motion
The mathematical relationship between the rudder angle δ and the ship's heading angle ϕ · is expressed as Equation (14) (Yang et al., 2003):
$$ \ddot{\phi}+\frac{K}{T} H(\dot{\phi})=\frac{K}{T} \delta, $$ (14) where K is the steering quality index, and T is the steering quality time constant. These parameters are a function of the ship's constant forward velocity and its length. This formula will serve as the basis for simulating the ship heading adjustment in this research.
The mathematical model of the velocity of ship maneu‐ vering can be expressed as Equation (14) (Yoshimura et al., 1978):
$$ \dot V + {a_{vv}}{V^2} + {a_{rr}}{\dot \phi ^2} + {a_{\delta \delta }}{V^2}{\delta ^2} = {a_{nn}}{n^2} + {a_{nv}}nV, $$ (15) where V is the velocity of the ship, n is the propeller revolution, ann and anv are thrust coefficients, and avv, arr, and aδδ are damping coefficients.
5.2 Simulation experiment
To reduce unnecessary variables and make the simula‐ tion intuitive, in the whole simulation experiment, the own ship and target ship have the same principal particulars and maneuverability characteristics. This part of the research is based on Wang Xin's work (Wang X, et al., 2017). Based on his research, the PID control is used as the specific ship motion control mode, and the PID control mechanism pa‐ rameters are K n = 0.1, K p = 10, Kd = 150, and Ki = 0.001. Other specific parameters are shown in Table 3.
Table 3 Principal particulars and maneuverability characteristics of the sample shipLength (m) 126.0 K 0.48 avv 1.4x10⁻⁴ Breadth (m) 20.8 T 216.5 arr 101.5 Draft (m) 8.0 KE 1 aδδ 1.6x10⁻³ Block coefficient 0.681 TE 2.5 ann 1.4x10⁻² Displacement (t) 14.278 N (r/min) 120 anv 5.9x10⁻⁴ 5.2.1 Scenario 1: Head-on situation
In this part, the S1 scenario of the above encounter is an‐ alyzed in detail, and the initial coordinates of the own ship and target ship are (0, 0) and (0.3, 0.1), respectively. The initial heading angles of the own ship and target ship are 90°and 270°, respectively. The initial velocities of the own ship and target ship are the same, i. e., 7 kn. Clearly, the current encounter situation of the own ship and target ship reached a close-quarter situation. According to paragraph (a) of Rule 14 of COLREGs, when two vessels meet in op‐ posite or nearly opposite directions, and there is a collision danger, each vessel shall alter its course to the starboard so that each shall pass on the port side of the other. To com‐ pare and illustrate the effectiveness of the dynamic perfor‐ mance of the CSD under different collision avoidance be‐ haviors, it is assumed that there are two patterns of action to avoid a collision:
A. Under this pattern, it is supposed that the action to avoid collision is taken by the own ship or target ship alone.
B. Under this pattern, it is supposed that the action to avoid collision is taken by both encounter ships.
In Pattern A, only one of the two ships in the situation takes avoid action. As described in Section 5.2, as the own ship and target ship have the same principal particulars and maneuverability characteristics, we supposed that the action to avoid collision is taken by the target ship alone. To be more specific, the target ship will alter its course to the starboard in three kinds of extensions (30°, 45°, and 60°) during the simulation procession. The simulation results are presented in Figures 4~10. The trajectories of two ships at time t = 100 s, 200 s, and 300 s are shown in Figure 4.
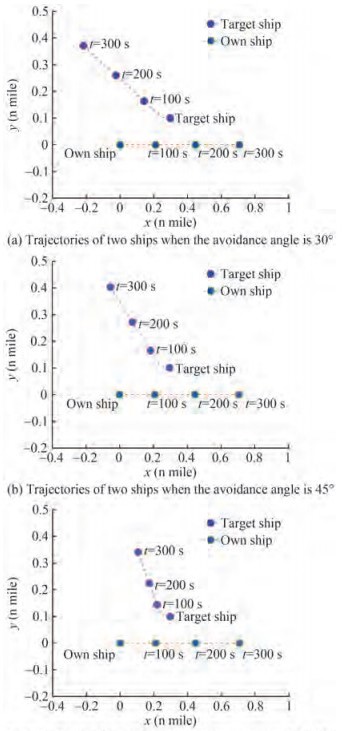 Figure 4 Trajectories of two ships in S1. Pattern A
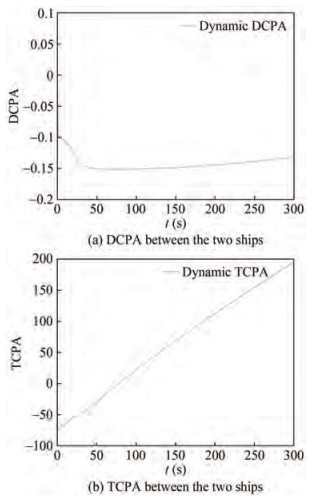 Figure 5 DCPA and TCPA between the two ships in S1. Pattern A
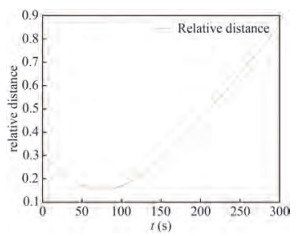 Figure 6 Relative distance between the two ships
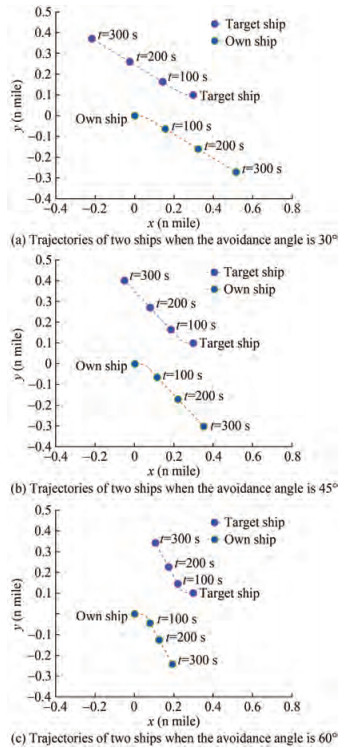 Figure 7 Trajectories of two ships in S1. Pattern B
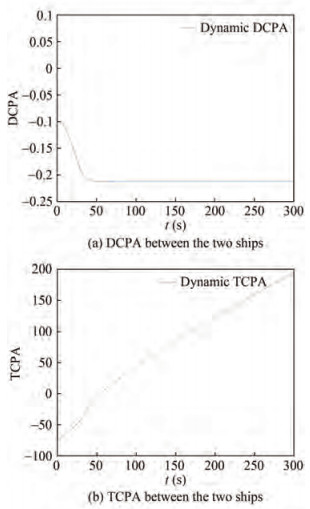 Figure 8 DCPA and TCPA between the two ships in S1. Pattern B
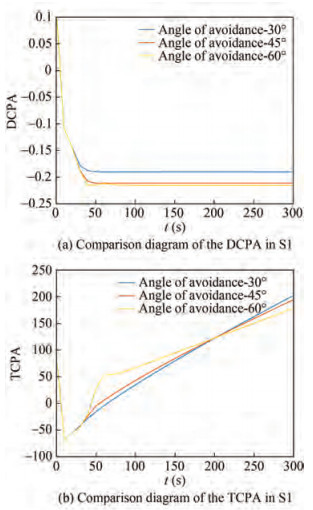 Figure 9 Comparison diagram of the DCPA and TCPA
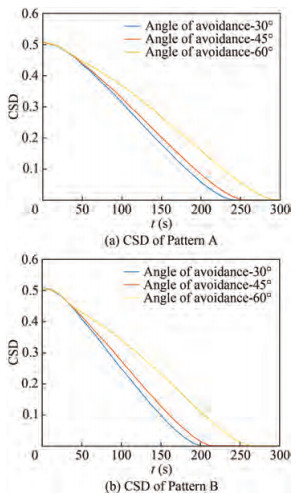 Figure 10 CSD of S1
Figure 5 shows the curve of the dynamic DCPA and TCPA when the target ship alters its course to 315°, with an avoidance angle of 45°.
Through the abovementioned diagrams, especially the trajectory diagram of the target ship, we can obviously no‐ tice the influence of ship maneuverability characteristics, such as large inertia, time delay, and nonlinearity, on the ship collision avoidance movement. This result also con‐ firms the necessity of considering ship maneuverability in the simulation process. As shown in Figure 5, the DCPA begins to change rapidly at t = 0. That is, after the target ship begins to take collision avoidance behavior, the TCPA rapidly increases, indicating a reduction in the ship colli‐ sion risk. That is, from the perspective of the DCPA and TCPA, the collision risk between the two ships continues to decrease during the entire course of the ship encounter, starting from t = 0.
However, as shown in Figure 6, during the process of avoiding a collision, the relative distance between the own ship and the target ship experiences a decreasing to in‐ creasing trend. The relative distance between the two ships reached a minimum value of around 70 s. From the per‐ spective of navigation, as the relative distance between ships decreases, the collision risk increases. This feature cannot be effectively reflected in the changing trend of the DCPA/TCPA.
In Pattern B, the action to avoid collision is taken by both encounter ships. Compared to Pattern A, it is also a typical collision avoidance behavior under a head-on situa‐ tion. Analogously, for the sake of comparison, the adjust‐ ment angles for the ship maneuvering of the two ships were set as 30°, 45°, and 60°. The trajectories of the two ships at time t = 100 s, 200 s, and 300 s are shown in Figure 7.
For the sake of comparison, Figure 8 shows the DCPA/ TCPA curve between the own ship and the target ship when the two ships both changed their course to the starboard at 45°.
Although the situation of the single-ship avoidance in pattern A has changed to that of the two-ship avoidance in pattern B, there is no significant difference in the two indi‐ cators of the DCPA and TCPA. In particular, the curve trend shows a strong similarity, and there are only differ‐ ences at some extreme values, such as the lowest DCPA value.
Figure 9(a) presents the curves of the DCPA and TCPA between the own ship and the target ship. In Figure 9(a), although there is an obvious difference in the predetermined angle of the heading adjustment, the difference ultimately reflected in the change in the DCPA value is even small. In particular, the two curves of the ship's heading adjustment of 45° and 60 ° show the red and yellow curves in the figure, which are very close to each other. Moreover, the three curves are highly similar or even completely overlapped in the initial stage of about t = 0 s to t = 35 s. This feature is also reflected in the corresponding part of Figure 9(b).
The analysis of the traditional DCPA/TCPA indexes in the dynamic process of different collision avoidance be‐ haviors in the head-on situation is presented above. Gener‐ ally, it has the following characteristics:
1) In the initial stage, that is, at the beginning of the col‐ lision avoidance behavior, the DCPA/TCPA index varia‐ tion trends are approximately completely consistent under different collision avoidance angles or show a high degree of similarity. This phenomenon should be affected by the ship's own maneuverability performance.
2) The value changes of the indicators are highly limited in reflecting the difference in collision risk changes caused by different collision avoidance amplitudes, especially re‐ flected in the TCPA.
Similarly, to make the comparative test scientific, we also conducted a simulation test on the performance of the proposed CSD parameters according to the two possible collision avoidance choices of Pattern A and pattern B. All relevant parameters involved in the simulation experiment remain unchanged, and the specific values are shown in Section 5.2.
Figure 10(a) shows the curves of the CSD under a spe‐ cific situation of Pattern A. The three curves in different colors in the figure represent the changes in the CSD parameters under avoidance amplitudes of 30°, 45°, and 60°. Similarly, Figure 10(b) depicts the simulation result of the CSD under Pattern B.
Obviously, regardless of having Pattern A with a single ship's avoidance or Pattern B with both ships' avoidance, the CSD can describe the whole dynamic process of a ship avoiding collision and reflect it effectively through regular numerical changes. As time goes by, the value of the CSD parameter also continues to decline, and among the three preset avoidance ranges, the value of the CSD with the pre‐ set avoidance range of 30° declines the fastest. Of course, it is the first one to get to 0 at about 240 s in Pattern A and at about 200 s in Pattern B.
Moreover, the CSD parameters decrease at a significant‐ ly faster rate in Figure 10(b) (Pattern B, i.e., the situation in which both ships involved in the encounter take star‐ board avoidance) compared with that in Figure 10(a). From the perspective of navigation knowledge, Pattern B shows a faster decline rate of collision risk than Pattern A. In other words, the proposed CSD parameter can effectively reflect this characteristic. Compared with the aforemen‐ tioned DCPA/TCPA parameter curves, which are highly similar, it further reflects the rationality and advantages of CSD parameters.
5.2.2 Scenario 2: Crossing situation
In this part, the S7 scenario of the above encounter is an‐ alyzed in detail, and the initial coordinates of the own ship and target ship are (0, 0) and (0.458, − 0.6), respectively. The initial heading angles of the own ship and target ship are 90°and 0°, respectively. The initial relative distance is 0.41 n mile. The initial velocities of the own ship and tar‐ get ship are the same, i.e., 10.5 kn. Obviously, the current encounter between the own ship and the target ship consti‐ tutes a crossing situation, and the specific intersection an‐ gle is 90°, which was considered by some studies to be the most dangerous ship intersection angle (Szlapczynski et al., 2018). In consideration of this, S7 was used as a typical crossing scenario for the simulation analysis in this study. According to paragraph (a) of Rule 15, the own ship and target ship in S7 reach the crossing situation to involve the risk of collision. Acting according to COLREGS, the own ship shall keep out of the way of the target ship and avoid crossing ahead of the target ship. Because the colli‐ sion avoidance rules do not make specific provisions on the ship avoidance angle and consider the complexity and diversity of the actual maritime traffic environment, we supposed that the action to avoid collision taken by the own ship will contain three different avoidance ranges (30°, 45°, and 60°). The simulation results are presented in Figures 11~14.
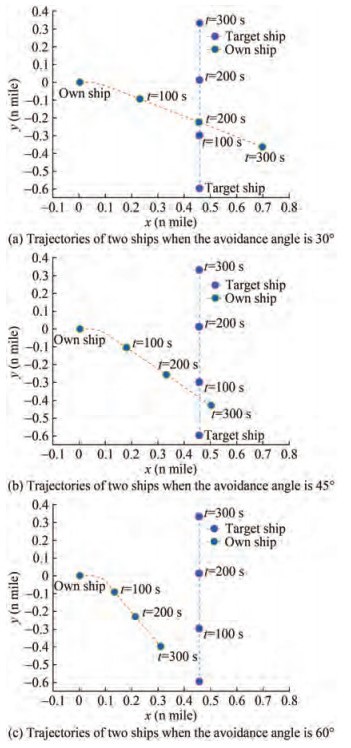 Figure 11 Trajectories of two ships in S7
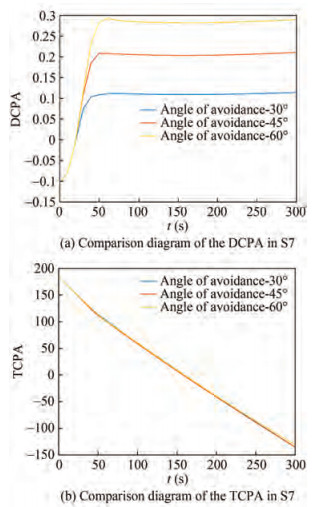 Figure 12 DCPA and TCPA between the two ships in S7
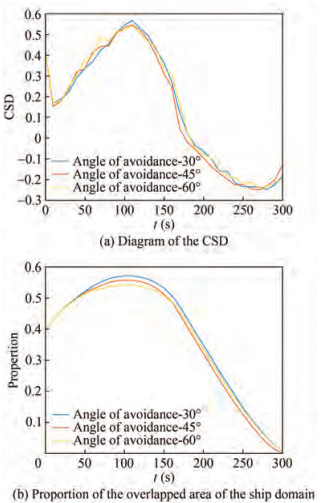 Figure 13 CSD and variation in the ship domain overlapped area under S7
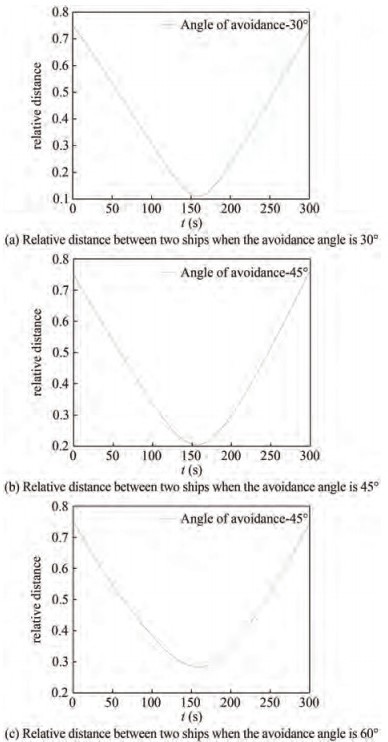 Figure 14 Relative distance between two ships in S7
The trajectories of the two ships at time t = 100 s, 200 s, and 300 s are shown in Figure 11(a), (b), and (c), respec‐ tively.
In the three simulated tracks shown in the figure, the own ship can cross its own track from the stern of the tar‐ get ship after taking corresponding avoidance maneuvers and meet the requirements of COLREGS for a crossing sit‐ uation that the give-way vessel needs to avoid crossing ahead of the stand-on vessel. That is, the three avoidance options of different amplitudes are in line with the rules and hence are feasible. Accordingly, the ability of each parameter to depict risks in the collision avoidance process will be further analyzed below.
Figures 12(a) and Figure 12(b) present the curves of the DCPA and TCPA between the own ship and target ship under crossing situations, respectively. This is similar to Figure 9(a) and Figure 9(b), i.e., head-on situation, where the curves of the DCPA and TCPA show a strong similarity, especially in the TCPA, and the three curves remain almost perfectly overlapping during the whole encounter process.
Figure 13(a) shows the curves of the CSD under the spe‐ cific situation of S7. The three curves in different colors in the figure represent the changes in the CSD parameters under avoidance amplitude angles of 30°, 45°, and 60°. For the sake of comparison, we also depict the numerical variation of the ship domain-overlapped area under S7 in Figure 13(b) to further illustrate the advantages of using CSD parameters.
For the crossing encounter situation, e.g., S7, after tak‐ ing the starboard steering action of the give-way vessel, that is, the own ship in S7, the change in the CSD index is the sudden attenuation of the CSD value around 0–10 s, as shown in Figure 13(a). In other words, the new parameter proposed in this paper, namely CSD, is reflected in the rap‐ id decline of collision risk between ships. It is reason‐ able to consider nautical knowledge and COLREGS. If the give-way vessel takes the behavior in accordance with the COLREGS in the encounter, it will certainly be reflected as a sudden decline in the aspect of collision danger at that moment. However, we cannot see the effective reflection and description of this feature in Figure 13(b), which is the change in the overlapped area of the ship domain.
Another point worth noting is the change phenomenon of the CSD index increasing first and then decreasing rap‐ idly in the time range of 10–175 s. We analyzed the rapid increase in the CSD value at the beginning from the per‐ spective of the ship movement and the formation of colli‐ sion risk between ships at sea based on the trajectory dia‐ gram in Figures 11(a), (b), and (c). Although the ship has taken the starboard avoidance behavior, from the perspec‐ tive of common CRI indicators, such as the ship's relative position and relative course, the two ships under the en‐ counter state are still getting close to each other, and there are increasing potential collision risks. Figures 14(a), (b), and (c) show the relative distance curve of different avoid‐ ance amplitudes in S7.
As shown in the figures above, because S7 simulates a crossing-encounter scenario, the relative distance between the two ships minimizes at the moment when the give-way vessel passes the stern of the stand-on vessel. After this moment, the risk of collision between ships can decrease rapidly and even be nonexistent. As shown in Figure 13(a), the CSD value starts to decrease rapidly around t = 150 s and decreases to 0 around t = 180 s, which is specifically consistent with the relative distance of the ships shown in Figure 14(a), (b), and (c).
5.2.3 Scenario 3: Overtaking situation
In this part, the S13 scenario of the above encounter is analyzed in detail, and the initial coordinates of the own ship and target ship are (0, 0) and (0.3, 0.1), respectively. The initial heading angles of the own ship and target ship are the same, i.e., 90°. The initial relative distance is 0.3146 n mile. The initial velocity of the own ship and tar‐ get ship is 10 and 4 kn, respectively.
According to paragraph (b) of Rule 13, the own ship and target ship in S13 reach the overtaking situation to avoid the risk of collision. When acting according to COLREGS, the own ship that is overtaking the target ship shall keep out of the way of the target ship that is being overtaken. We supposed that the action to avoid collision taken by the own ship will contain three different avoidance ranges (30°, 45°, and 60°). The simulation results are presented in Figures 15~17.
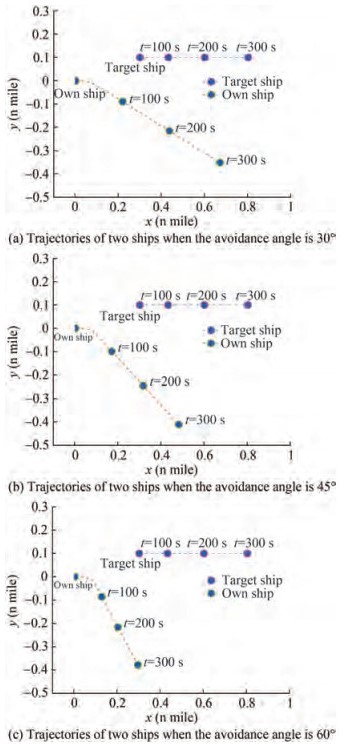 Figure 15 Trajectories of two ships in S13
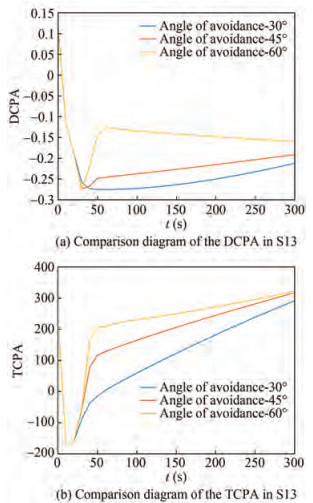 Figure 16 DCPA and TCPA between the two ships in S13
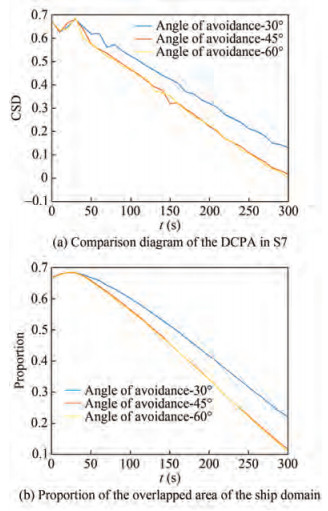 Figure 17 CSD and variation of ship domain overlapped area under S13
The trajectories of two ships at time t = 100 s, 200 s, and 300 s are shown in Figure 15(a), (b), and (c), respectively.
Although the own ship has adopted different ranges of collision avoidance behaviors, it can achieve the purpose of safety and meet the requirements of COLREGS for overtaking situations. That is, the three avoidance options of different amplitudes are in line with the rules and hence are feasible. Based on this, the ability of each parameter to depict risks in the process of collision avoidance will be further analyzed below.
Figures 16(a) and Figure 16(b) give the curves of the DCPA and TCPA between the own ship and target ship under overtaking situations, respectively. By comparing the head-on situation (Figure 9(a) and Figure 9(b)) and over‐ taking situation (Figure 12(a) and Figure 12(b)), one of the biggest features is that the curves of the DCPA and TCPA exhibit a high degree of resolution, and we can clearly dis‐ tinguish the curve under different avoidance amplitudes. Similarly, the initial phase of the curve, that is, the almost complete overlapped part, is a reflection of the specific collision avoidance maneuvering taken by the ship and the maneuverability ability of the ship.
Figure 17(a) shows the curves of the CSD under the spe‐ cific situation of S13. The three curves in different colors in the figure represent the changes in the CSD parameters under avoidance amplitude angles of 30°, 45°, and 60°. For the sake of comparison, we also depict the numerical variation of the ship domain overlapping area under S13 in Figure 17(b) to further illustrate the advantages of using CSD parameters. The comparison between the two figures shows that the proposed CSD parameter shows better distribu‐ tion characteristics at the numerical level than the original ship domain overlapped area ratio parameter. That is, the proposed CSD parameters can respond quickly after collision avoidance maneuvering and can reflect the vari‐ ation characteristics of collision risk in the case of overtaking.
By contrast, the original ship domain overlapped area ratio parameter exposes two obvious defects. First, at the stage when the ship adopts the collision avoidance behav‐ ior, i.e., at the time period of 0–25 s, as shown in the fig‐ ure, its response to collision risk is slow, and there is no significant change in the numerical value. Second, at the fi‐ nal time point t = 300 s, the value of the ship domain over‐ lapped area ratio parameter is still greater than 0.1, which is unreasonable from the perspective of reflecting collision risk. If it is directly used as one of the parameters of colli‐ sion risk, it does not accord with the relevant navigation cognition in the case of overtaking.
5.3 Discussions and analysis
The main purpose is to further design a method to test the dynamic performance of the CSD based on the basis of the static simulation experiment in Section 4. In the selec‐ tion of experimental methods, the particularity of ship data in the real navigation process is considered due to internal factors, including its own ship size, ship maneuverability characteristics, and the influence of external factors, such as water conditions and surrounding traffic situation. If we choose to use the data of only one region, waterway, or port as the data source, the applicability of the proposed parameter, namely CSD, will be reduced. In addition, due to the accuracy of various ship state recording equipment or information errors and information loss caused by improp‐ er human operations, these phenomena also affect the reli‐ ability of actual ship data to a certain extent (Harati-Mokhtari et al., 2007; Mccauley et al., 2016; Yang et al., 2022).
To avoid the unnecessary problems mentioned above, we decided to use a ship model simulation to perform this part of the research. At the same time, using the simulation research method, we carried out the experimental analysis of different collision avoidance measures and various colli‐ sion avoidance ranges that ships may take under a certain situation of encounter, which also makes the research and analysis have better flexibility. We introduced a framework that includes a mathematical model of ship motion and a ship collision avoidance model and conducted a series of simulation experiments based on this framework.
First, to make the simulation of the dynamic process of ship collision avoidance scientifically and reasonably, we applied the Nomoto model to describe and simulate the change law of ship motion characteristics, including the course and speed. This model is a relatively mature ship model and has been widely used in the simulation calcula‐ tion of ship maneuvering motion and the design and analy‐ sis of ship maneuvering motion control systems. Then, we decided to use PID control to simulate the ship handling process. The main reason for adopting the PID control al‐ gorithm is that the PID control algorithm is adopted in the automatic control system of the vast majority of ships in the world. Therefore, to accurately describe the current ac‐ tual situation, the PID control algorithm is adopted here.
In Section 5.2, we simulated three kinds of ship encoun‐ ters, namely, head-on situation, crossing situation, and over‐ taking situation, considering the ship maneuverability and COLREGS. A variety of feasible collision avoidance op‐ tions with different amplitudes were designed for each situ‐ ation, and we also made a further simulation of the feasi‐ ble measures. Compared with the traditional and common‐ ly used ship collision risk description parameters, includ‐ ing the DCPA and TCPA, the CSD parameter proposed in this paper shows a better and more detailed ability to de‐ scribe real-time ship collision risk. In particular, in cross‐ ing situations, the sensitivity of the CSD parameter is con‐ centrated and contrasted with that of the TCPA parameter. The CSD parameter is also a more reasonable description of ship collision risk in the overtaking situation.
Although ship maneuverability has always been an im‐ portant factor that cannot be ignored in ship collision risk assessment and even the whole maritime traffic research, its effect on risk assessment has not been fully researched in this study. When designing the simulation experiment, the own ship and target ship were set to have the same main characteristics and maneuverability characteristics. Such a setting reduces the computation cost and makes the experimental process clearer. However, there is still a lot of room for further improvement. In future research, im‐ portant factors, including the ship type, maneuverability, and other ship characteristics, still need to be used for a more detailed and comprehensive analysis and to further improve the performance of the proposed parameters in a variety of complex situations.
6 Conclusion and future works
In this paper, a new domain-oriented collision risk fac‐ tor called the CSD has been introduced. According to the CSD, the collision risk of an encounter is described by three computing methods corresponding to three different encounter situations, i.e., head-on situation, crossing situa‐ tion, and overtaking situation. First, a comprehensive anal‐ ysis of the current studies centered on the CRI was made. In particular, the role of the ship domain in the CRI research and some current research results are discussed. Second, as the main research content of this paper, we defined a new parameter to measure the risk of collision between ships from the perspective of the ship domain. This param‐ eter was computed using two variables: the proportion of the overlapped domain and the changing rate of the propor‐ tion of the overlapped domain. Ships keep moving in a continual state, so it is not sufficient to judge the risk by only considering the current state of factors. Thus, we ad‐ opted a calculation model that combines the current over‐ lapped situation of the ship domain and its change rate to track and monitor the trend of collision risk effectively. To validate the proposed parameters, a series of simulation ex‐ periments were conducted to evaluate its dynamic perfor‐ mance. The results show that the CSD parameters can re‐ flect the state and change of the ship domain in real time in the case of a two-ship encounter.
To the best of our limited knowledge, the major limita‐ tion of the current work lies in the aspect of the ship type: After all, the ship type is classified as one of the main fac‐ tors in a ship collision risk assessment. Different ship types also mean that the ships have varying physical characteris‐ tics, such as length, width, stroke, and turn, which would seriously affect the safety of navigation. For some special types of ships, such as cargo ships and oil tankers, the rela‐ tionship between the ship type and transportation safety is even closer, so there has been a lot of specific research on them (Zhou Q et al., 2016; Ahola M et al., 2014).
However, the effect of the ship type was not sufficiently considered in the present study. In future studies, this area can serve as a focus for further improvement. For example, we can fine-tune the details of the ship domain we used de‐ pending on the ship type to achieve better performance.
In addition, our work makes no mention of multi-ship encounters, which have been proven to be very important in the research on ship collision risk by many other studies (Szlapczynski et al., 2021; Du, L et al., 2020). In particu‐ lar, the comparison and comprehensive applications with other similar methods in complex situations can become an important part of the future development of our method.
Open Access This article is licensed under a Creative Commons At‐ tribution 4.0 International License, which permits use, sharing, adapta‐ tion, distribution and reproduction in any medium or format, as long as you give appropriate credit to the original author(s) and thesource, provide a link to the Creative Commons licence, and indicateif changes were made. The images or other third party material in thisarticle are included in the article's Creative Commons licence, unlessindicated otherwise in a credit line to the material. If material is notincluded in the article's Creative Commons licence and your intendeduse is not permitted by statutory regulation or exceeds the permitteduse, you will need to obtain permission directly from the copyrightholder. To view a copy of this licence, visit http:/creativecommons.org/licenses/by/4.0/.Competing interest The authors have no competing interests to de‐ clare that are relevant to the content of this article. -
Figure 1 Eccentric elliptic ship domain
a–semi-major axis, b–semi-minor axis, c–deviation of the ship's center on the long axis, d–deviation of the ship's center on the minor axis
Figure 2 Schematic diagram of a moving ship
Figure 3 Description of various scenarios
Figure 4 Trajectories of two ships in S1. Pattern A
Figure 5 DCPA and TCPA between the two ships in S1. Pattern A
Figure 6 Relative distance between the two ships
Figure 7 Trajectories of two ships in S1. Pattern B
Figure 8 DCPA and TCPA between the two ships in S1. Pattern B
Figure 9 Comparison diagram of the DCPA and TCPA
Figure 10 CSD of S1
Figure 11 Trajectories of two ships in S7
Figure 12 DCPA and TCPA between the two ships in S7
Figure 13 CSD and variation in the ship domain overlapped area under S7
Figure 14 Relative distance between two ships in S7
Figure 15 Trajectories of two ships in S13
Figure 16 DCPA and TCPA between the two ships in S13
Figure 17 CSD and variation of ship domain overlapped area under S13
Table 1 Summary of the research on the CRI
M1 M2 M3 M4 M5 M6 M7 M8 M9 DCPA and TCPA + + + + + - - + + Ship type - - - - - - - - - Ship length - + - - - + - - + Ship position - - - + + - + + + Ship speed - + - - + + + + + Ship heading - - - + + - + - - Maneuverability - - - - - - - - Encounter situation - - + - - - - - + Ship domain - - - - - + - - + Traffic complexity - - - - - - - - - Expert opinion + - + - - - - - + Simulation - + - + + - - + + Real data - - + - - + + - - Notes: M1: Chin et al., 2009; M2: Lee et al., 2001; M3: Mou et al., 2010; M4: Nguyen et al., 2018; M5: Zhao et al., 2016; M6: Zhang et al., 2019; M7: Zhang et al., 2015; M8: Gang et al., 2016; M9: Goerlandt et al., 2015. Table 2 Detailed data of various scenarios
Situation Target X Target Y DCPA TCPA (s) Ship distance Ship domain violation (%) Own ship speed (°) Target ship speed (°) Relative VX Relative VY S1. head-on 0.3 0.1 0.1 76 0.312 5 50.70 7-90 7-270 -14 0 S2. head-on 0.3 -0.1 0.1 76 0.312 5 86.30 7-90 7-270 -14 0 S3. head-on 1.5 0.1 0.1 179 1.495 1.78 13-90 17-270 -30 0 S4. head-on 1.5 -0.1 0.1 179 1.495 6.30 13-90 17-270 -30 0 S5. crossing -0.1 -0.4 0.1 143 0.409 6 43.14 10-90 10.2-45 0 10 S6. crossing 0.1 -0.4 0.1 143 0.409 6 41.05 10-90 10.2-45 0 10 S7. crossing 0.458 -0.6 0.1 180.3 0.74 39.90 10.5-90 10.5-0 -10.5 10.5 S8. crossing 0.458 0.6 0.1 180.3 0.74 31.14 10.5-90 10.5-180 -10.5 -10.5 S9. crossing -0.1 0.4 0.1 143 0.409 6 49.51 10-90 10.2-135 0 -10 S10. crossing 0.1 0.4 0.1 143 0.409 6 51.35 10-90 10.2-135 0 -10 S11. crossing 0.58 -0.4 0.1 186.2 0.700 9 58.70 6-90 6.2-315 -12 6 S12. crossing 0.58 0.4 0.1 186.2 0.700 9 36.40 6-90 6.2-225 -12 -6 S13. overtaking 0.3 0.1 0.1 179 0.314 6 66.68 10-90 4-90 6 0 S14. overtaking 0.3 -0.1 0.1 179 0.314 6 66.65 10-90 4-90 6 0 S15. head-on 1.5 0 0 179 1.5 4.39 13-90 17-270 -30 0 Table 3 Principal particulars and maneuverability characteristics of the sample ship
Length (m) 126.0 K 0.48 avv 1.4x10⁻⁴ Breadth (m) 20.8 T 216.5 arr 101.5 Draft (m) 8.0 KE 1 aδδ 1.6x10⁻³ Block coefficient 0.681 TE 2.5 ann 1.4x10⁻² Displacement (t) 14.278 N (r/min) 120 anv 5.9x10⁻⁴ -
Ahola M, Murto P, Kujala P, Pitkänen J. 2014. Perceiving safety in passenger ships-User studies in an authentic environment. Safety Science, 70: 222-232. https://doi.org/ 10.1016/j.ssci.2014.05.017 Bukhari AC, Tusseyeva I, Lee BG, Kim, YG. 2013. An intelligent real-time multi-vessel collision risk assessment system from vts view point based on fuzzy inference system. Expert Systems with Applications, 40(4): 1220-1230. https://doi.org/ 10.1016/j.eswa.2012.08.016 Chai T, Weng J, De-Qi X. 2017. Development of a quantitative risk assessment model for ship collisions in fairways. Safety Science, 91(Complete): 71-83. https://doi.org/ 10.1016/j.ssci.2016.07.018 Chin HC, Debnath AK. 2009. Modeling perceived collision risk in port water navigation. Safety Science, 47(10): 1410-1416. https://doi.org/ 10.1016/j.ssci.2009.04.004 Colley BA, Curtis RG, Stockel CT. 1983. Manoeuvring Times, Domains and Arenas. FORUM, 36. 10.1017/S0373463300025030. Cucinotta F, Guglielmino E, Sfravara F. 2017. Frequency of ship collisions in the strait of messina through regulatory and environmental constraints assessment. Journal of Navigation, 70(5): 1-21. https://doi.org/ 10.1017/S0373463317000157 http://www.onacademic.com/detail/journal_1000039866881910_7123.html Davis PV, Dove MJ, Stockel CT. 1980. A computer simulation of marine traffic using domains and arenas. Journal of Navigation, 33(02): 215. https://doi.org/ 10.1017/S0373463300035220. Du L, Banda O, Huang Y, Goerlandt F, Zhang W. 2021. An empirical ship domain based on evasive maneuver and perceived collision risk. Reliability Engineering System Safety, 213(9). https://doi.org/ 10.1016/j.ress.2021.107752 http://doc.paperpass.com/foreign/rgArti20214130799.html Du L, Banda O, Goerlandt F, Huang Y, Kujala P. 2020. A colregcompliant ship collision alert system for stand-on vessels. Ocean Engineering. 10.1016/j.aoceaneng.2020.107866 Fujii Y. 1971. Traffic capacity. Journal of Navigation, 24(4): 543-552. https://doi.org/ 10.1017/S0373463300022384 Gang L, Wang Y, Yao S, Zhou L, Zhang M. 2016. Estimation of vessel collision risk index based on support vector machine. Advances in Mechanical Engineering, 8(11). https://doi.org/ 10.1177/1687814016671250 Goerlandt F, Kujala P. 2014. On the reliability and validity of ship-ship collision risk analysis in light of different perspectives on risk. Safety Science, 62: 348-365. https://doi.org/ 10.1016/j.ssci.2013.09.010 Goerlandt F, Jakub Montewka, Vladimir Kuzmin, Pentti Kujala. . 2015. A risk-informed ship collision alert system: framework and application. Safety Science, 77(1): 182-204. https://doi.org/ 10.1016/j.ssci.2015.03.015 http://www.onacademic.com/detail/journal_1000037660788210_bd55.html Goodwin EM. 1975. A statistical study of ship domains. Journal of Navigation, 28(3): 328-344. https://doi.org/ 10.1017/S0373463300041230 Gil, M., Montewka, J., Krata, P., Hinz, T., & Hirdaris, S. . 2020. . Determination of the dynamic critical maneuvering area in an encounter between two vessels: Operation with negligible environmental disruption. Ocean Engineering, 213: 107709. https://doi.org/ 10.1016/j.oceaneng.2020.107709 Gil M. . 2021. A concept of critical safety area applicable for an obstacle-avoidance process for manned and autonomous ships. Reliability Engineering and System Safety, 107806. https://doi.org/ 10.1016/j.ress.2021.107806 http://www.sciencedirect.com/science/article/pii/S095183202100329X Hansen MG, Jensen TK, Lehn-Schi?Ler T, Melchild K, Rasmussen FM, Ennemark F. 2013. Empirical ship domain based on ais data. Journal of Navigation, 66(06): 931-940. https://doi.org/ 10.1017/S0373463313000489 Harati-Mokhtari A, Wall A, Brooks P, Wang J. 2007. Automatic identification system (AIS): data reliability and human error implications. Journal of Navigation, 60(3): 373-389. https://doi.org/ 10.1017/S0373463307004298 International Maritime Organization (IMO) (1981) Definition of the Term "Close-quarters Situation". Note by the Government of the German Democratic Republic, NAV 26/4/2 International Maritime Organization (IMO) (1972) Convention on the International Regulations for Preventing Collisions at Sea(COLREGS) Kearon J. 1979. Computer programs for collision avoidance and track keeping. In: Hollingdale SH Ed. Mathematical Aspects of Marine Traffic. Academic Press Inc. Ltd, London Kijima K, Furukawa Y. 2003. Automatic collision avoidance system using the concept of blocking area. IFAC Proceedings Volumes, 36(21): 223-228. https://doi.org/ 10.1016/S1474-6670(17)37811-4 Lee H J, Rhee K. 2001. Development of collision avoidance system by using expert system and search algorithm. International Shipbuilding Progress, 2001, 48 http://www.researchgate.net/publication/266296182_development_of_collision_avoidance_system_by_using_expert_system_and_search_algorithm Liu Z, Wu Z, Zheng Z. 2019. A novel framework for regional collision risk identification based on ais data. Applied Ocean Research, 89: 261-272. https://doi.org/ 10.1016/j.apor.2019.05.020 Mccauley DJ, Woods P, Sullivan B, Bergman B, Jablonicky C, Roan A. . 2016. Ending hide and seek at sea. Science, 351(6278): 1148-1150. https://doi.org/ 10.1126/science.aad5686 Montewka J, Hinz T, Kujala P, Matusiak J. 2010. Probability modelling of vessel collisions. Reliability Engineering & System Safety, 95(5): 573-589. https://doi.org/ 10.1016/j.ress.2010.01.009 http://www.onacademic.com/detail/journal_1000034109183710_46ff.html Mou JM, Tak C, Han L. 2010. Study on collision avoidance in busy waterways by using ais data. Ocean Engineering, 37(5-6): 483-490. https://doi.org/ 10.1016/j.oceaneng.2010.01.012 Nguyen ManhCuong, Zhang Shufang, Wang Xiaoye. 2018. A novel method for risk assessment and simulation of collision avoidance for vessels based on AIS. 10.3390/a11120204 Pietrzykowski Z. 2008. Ship's fuzzy domain: a criterion for navigational safety in narrow fairways. Journal of Navigation, 61(3): 499-514. https://doi.org/ 10.1017/S0373463308004682 Pietrzykowski Z, Uriasz J. 2009. The ship domain-a criterion of navigational safety assessment in an open sea area. Journal of Navigation, 62(1): 93-108. https://doi.org/ 10.1017/S0373463308005018 Szlapczynski R, Krata P, Szlapczynska J. 2018. Ship domain applied to determining distances for collision avoidance manoeuvres in give-way situations. Ocean Engineering, 165(1): 43-54. https://doi.org/ 10.1016/j.oceaneng.2018.07.041 http://www.onacademic.com/detail/journal_1000040431154410_3de1.html Szlapczynski R, Szlapczynska J. 2021. A ship domain-based model of collision risk for near-miss detection and collision alert systems. Reliability Engineering & System Safety. https://doi.org/ 10.1016/j.ress.2021.107766 http://www.sciencedirect.com/science/article/pii/S0951832021002945 Szlapczynski R, Szlapczynska J. 2016. An analysis of domain-based ship collision risk parameters. Ocean Engineering, 126(nov. 1): 47-56. https://doi.org/ 10.1016/j.oceaneng.2016.08.030 Szlapczynski R, Szlapczynska J. 2017. Review of ship safety domains: models and applications. Ocean Engineering, 145C: 277-289. https://doi.org/ 10.1016/j.oceaneng.2017.09.020 http://www.onacademic.com/detail/journal_1000040090540610_21b5.html Szlapczynski R, Krata P, Szlapczynska J. 2018. Ship domain applied to determining distances for collision avoidance manoeuvres in give-way situations. Ocean Engineering, 165(OCT. 1): 43-54. https://doi.org/ 10.1016/j.oceaneng.2018.07.041 http://www.onacademic.com/detail/journal_1000040431154410_3de1.html UNCTAD. 2020. Review of maritime transport Van der Tak C, Spaans J A. 1977. A model for calculating a maritime risk criterion number. The Journal of Navigation, 30(02): 287. https://doi.org/ 10.1017/S0373463300043964 Wang Ning. 2010. An intelligent spatial collision risk based on the quaternion ship domain. Journal of Navigation, 63(4): 733-749. https://doi.org/ 10.1017/S0373463310000202 Wang X, Liu Z J, and Cai Y, . 2017. The ship maneuverability based collision avoidance dynamic support system in close-quarters situation. Ocean Engineering, 146: 486-497. https://doi.org/ 10.1016/j.oceaneng.2017.08.034 Yang Y, Ren J. 2003. Adaptive fuzzy robust tracking controller design via small gain approach and its application. IEEE Transactions on Fuzzy Systems, 11(6): 783-795. https://doi.org/ 10.1109/TFUZZ.2003.819837 Yang T, Wang X, Liu Z. 2022. Ship Type recognition based on ship navigating trajectory and convolutional neural network. J. Mar. Sci. Eng. 10, 84. https://doi.org/ 10.3390/jmse10010084 Yoo SL. 2018. Near-miss density map for safe navigation of ships. Ocean Engineering, 163(SEP. 1): 15-21. https://doi.org/ 10.1016/j.oceaneng.2018.05.065 http://www.sciencedirect.com/science?_ob=ShoppingCartURL&_method=add&_eid=1-s2.0-S0029801818309375&originContentFamily=serial&_origin=article&_ts=1527905695&md5=aeca6ebec629b0fc4674c1678cc9e1a5 Yasuo Y, Kensaku N. 2009. Modeling of manoeuvring behaviour of ships with a propeller idling, boosting and reversing. Journal of the Society of Naval Architects of Japan, 1978(144): 57-69. https://doi.org/ 10.2534/jjasnaoe1968.1978.144_57 http://www.onacademic.com/detail/journal_1000040524062610_8a61.html Zhang L, Meng Q. 2019. Probabilistic ship domain with applications to ship collision risk assessment. Ocean Engineering, 186, 106130. https://doi.org/ 10.1016/j.oceaneng.2019.106130 Zhang M, Conti F, Sourne HL, Vassalos D, Hirdaris S. 2021a. A method for the direct assessment of ship collision damage and flooding risk in real conditions. Ocean Engineering, 237(109605), 20. https://doi.org/ 10.1016/j.oceaneng.2021.109605 http://www.sciencedirect.com/science/article/pii/S0029801821009872 Zhang M, Montewka J, Manderbacka T, Kujala P, Hirdaris S. 2021b. A big data analytics method for the evaluation of ship-ship collision risk reflecting hydrometeorological conditions. Reliability Engineering and System Safety, 213. 10.1016/j.ress.2021.107674 Zhang W, Goerlandt F, Kujala P, Wang Y. 2016. An advanced method for detecting possible near miss ship collisions from AIS data. Ocean Engineering, 124, 141-156. https://doi.org/ 10.1016/j.oceaneng.2016.07.059 Zhang W, Goerlandt F, Montewka J, Kujala P. 2015. A method for detecting possible near miss ship collisions from ais data. Ocean Engineering, 107(OCT. 1): 60-69. https://doi.org/ 10.1016/j.oceaneng.2015.07.046 http://www.onacademic.com/detail/journal_1000038184144110_3ef7.html Zhao Y, Wang L, Peng S. 2016. A real-time collision avoidance learning system for unmanned surface vessels. Neurocomputing, 182. 10.1016/j.neucom.2015.12.028 Zhao J, Wu Z, Wang F. 1993. Comments on ship domains. Journal of Navigation, 46(3): 422-436. https://doi.org/ 10.1017/S0373463300011875 Zhou J, Wu C. 2004. Construction of the collision risk factor model. Journal of Ningbo University (Natural Science & Engineering Edition), 17: 61-65 http://www.researchgate.net/publication/290483084_Construction_of_the_collision_risk_factor_model Zhou Q, Thai V V.. 2016..Fuzzy and grey theories in failure mode and effect analysis for tanker equipment failure prediction[J].Safety Science, 2016, 83:74-79. https://doi.org/ 10.1016/j.ssci.2015.11.013 Zhu X, Xu H, Lin J. 2001. Domain and its model based on neural networks.Journal of Navigation, 54(1): 97-103. https://doi.org/10.1017/S0373463300001247