
Selection Methodology of High-Cycle Fatigue Analysis Approach for Damage Estimation in Welded Structural Joints
https://doi.org/10.1007/s11804-022-00310-w
-
Abstract
The main purpose of this paper is to provide a summarized general guideline to aid decision making of choosing the type of fatigue analysis approach, best suited for modelling and evaluating high-cycle fatigue damage in welded structural joints. It describes how addition of stress concentration and stress direction information into fatigue assessment methodology affect simulated fatigue damage accumulation results and when it is beneficial or necessary to use a particular fatigue damage estimation approach. The focus is on stress-life curve based approaches, particularly when deciding between variants of nominal, hot-spot or multiaxial fatigue assessment approaches for evaluating fatigue damage within welded joint structures. Evaluation is illustrated through application of proposed methodology to choose and perform fatigue assessment for a non-conventional load-bearing tubular joint structure within a floating lemniscate crane upper arm, which has been observed of being prone to aggressive crack propagation within its welds. Damage within the structure is estimated using two non-optimal fatigue analysis approaches to verify applicability of proposed selection methodology. Results are then summarized through comparative assessment and findings are discussed based on what leads to result changes within each fatigue damage analysis approach.-
Keywords:
- Fatigue analysis ·
- Multiaxial fatigue ·
- Hot-spot fatigue ·
- Methodology ·
- Welded joints
Article Highlights• Defined decision making flowchart is meant to help choosing an optimal high-cycle fatigue analysis method for welded joints;• Detailed case study used for verification leads to good and comparable damage prediciton results to the real structure. -
1 Introduction
Between 60%–90% of the damage on mechanical parts belongs to fatigue damage (Gagg and Lewis, 2009), while fatigue failure accounts for the majority of mechanical failures worldwide (with the numbers ranging between 50% and 90% between different industry statistics). This is particularly important for load bearing welded joint structures which are cyclically loaded throughout their operational lifetime. When the welded joint setup and/or its loading conditions are complex in nature, it is difficult to determine in advance the minimum amount of detail is needed to sufficiently estimate its fatigue life in a manner which is representative of real damage accumulation. This concerns stress type used for evaluation and particular information included within evaluated stress response which could significantly change the results of fatigue analysis.
Depending on specifics of a particular structure, desired analysis complexity—accuracy ratio and available information about the structure—there is a large number of approaches established in the literature used to evaluate fatigue damage of welded structural joints. Some of the most commonly used fatigue assessment approaches for estimating high-cycle fatigue include conventional stress-life curved-based methods of nominal (Hobbacher, 2016), hotspot (Lotsberg, 2016) and notch (van Lieshout, 2020) stress which all differ in their stress formulations and in necessary amount of geometric detail.
Additionally, even though hot-spot stress and notch stress approaches include the effects of stress concentrations within their stress formulations that nominal stress is unable to capture, but at the same time none of the aforementioned approaches account for stress direction, which can be an important factor towards dictating the way cracks initiate and propagate. For this purpose, a large number of multiaxial fatigue assessment approaches have been in development, which are meant to account for stress/strain direction effects towards fatigue damage accumulation.
When performing fatigue analysis of welded joints for design or structural evaluation purposes, often it can be difficult to choose the most optimal fatigue analysis approach. It is not always clear what is the optimal amount of detail within the assessment necessary to realistically predict its fatigue damage. There is a large number of fatigue assessment methods available to choose from meaning that the choice should be determined based on particular factors of analyzed structure. These factors mainly include different structural geometry, its type and detail, loading conditions and expected stress/strain distribution. If a fatigue analysis method is chosen incorrectly, the results might not be representative of real fatigue damage, or could lead to an overly-complex assessment setup which wastes time and resources for a relatively low amount of improvement in result accuracy. To achieve desired precision while minimizing modelling and analysis efforts, it is important to choose a fatigue assessment approach that is most fitting for the evaluated case. In most situations this decision is made based on engineers experience, as the guidelines provided in standards are poorly streamlined for quick decision making. This is especially problematic when the user is not well familiarized with the various types and consequences of choosing a particular method.
As the principle of evaluating fatigue damage within welded structural joints is not new - over the years a large number of analysis methods have been defined to perform fatigue estimation. Work of Fricke (2003) illustrates that currently there is a significant amount of high-quality literature reviews, which focus on gathering information about different fatigue assessment methods fit for estimating fatigue damage in welded joints. Due to continuing advances in developed fatigue assessment methodology, reviews are still being updated and expanded (Fuštar et al., 2018), with works often focusing fatigue analysis methods best applied in particular fields and applications, such as marine structures (Corigliano and Crupi, 2022). However among this comprehensive literature, there is a lack of works focusing on providing guidelines for choosing fatigue analysis method for a particular study case based on desired level of accuracy and complexity.
At a first glance, analyzing fatigue damage is not particularly problematic when it comes to basic joint structures that are commonly used in offshore industry, as their applications have been extensively studied and can be evaluated based on procedures which are established in standards used for fatigue assessment of steel structures (DNVGL-RPC203, 2020; ISO, 2020; NEN, 2018). The problem arises when dealing with joints of complex geometry and/or when joints are exposed to compounded loading on one or multiple beams. This becomes troublesome due to the fact that such structures can form less predictable stress and strain responses when compared to highly studied cases of uniaxially-loaded standardized joints, and might require an additional precision within their fatigue assessment. However it might not always be clear what amount of detail is necessary in the case of a particular joint - understanding when it is beneficial or necessary to include additional stress information into fatigue assessment allows avoiding potential errors within fatigue assessment, as well as ensuring that the analysis is not overly complex to the point that additional information is no longer providing crucial benefit towards damage estimation.
This paper is meant to provide a streamlined decisionmaking guideline to make the selection of an optimal fatigue assessment approach for evaluating high cycle fatigue damage in welded joint structures. It provides a theoretical guide how inclusion of additional stress information - particularly stress concentrations and stress direction - influences simulated fatigue assessment results. Theory is then embodied through application of introduced decision flowchart by selecting a fatigue damage estimation method on a study case, which focuses on a non-conventional loadbearing tubular joint for a particular floating lemniscate crane that is prone to fatigue damage accumulation. To illustrate how wrong choice of fatigue analysis method affects fatigue damage estimation results, a comparative analysis is performed using two additional methods - one which underestimates damage for the particular structure and one which does not significantly increase result accuracy while requiring significantly larger amount of effort to perform.
Note that this investigation is mainly focused on fatigue assessment approaches which deal with high cycle fatigue approaches using stress-life curves as well as the potential necessity of introducing effects of local stress concentrations and stress direction into their stress and damage rule formulations. A guideline on how to pick fatigue assessment methodology when multiaxial stress response is present is limited to choices between proportional and non-proportional multiaxial fatigue analysis approach, rather than detailing choice directions for a specific multi-axial fatigue assessment method which could be best suited for a specific structure and its loading conditions.
This paper is structured as follows: section 2 introduces main strengths and drawbacks of high-cycle fatigue analysis methods through the lens of used stress detail; section 3 proposes a streamlined decision-making principle on choosing high-cycle fatigue assessment approach most suited for a particular application; in section 4 a case study is presented for applying proposed fatigue assessment method selection principle, which is then introduced in contrast to two sub-optimal fatigue assessment methods for the purpose of result verification; in section 5 results are compared and discussed between the optimal and sub-optimal fatigue analysis methods; while section 6 provides the conclusion of the entire paper.
2 Stress information and fatigue analysis
In order to choose an optimal approach for fatigue assessment, it is important to understand how inclusion or omission of additional stress information in fatigue analysis affects fatigue damage estimation. This section details the main benefits and weaknesses of averaging stress, adding stress concentration information and adding stress direction information into fatigue damage estimation.
2.1 Averaged stress in fatigue analysis
When evaluating damage on cyclically loaded tubular joints, it is not always worth establishing a detailed fatigue assessment model - simplicity within the analysis can prove to be the preferred path, especially when it has to be performed under strict time constraints. This is possible when dealing with standardized joint configurations loaded in a predicable fashion. In particular, a simplified fatigue analysis design can be commonly applied when evaluating fatigue damage of joints on which most significant loads affect just chord beams, or when there is a low amount of change present within the load type and direction over the entire loading cycle. In such cases fatigue damage prediction can be effectively performed using a nominal stress approach which does not localize stress concentration effects to their specific location.
By definition, nominal stress averages out its response over entire beam element cross-section using linear elastic beam theory, with stress values depending mainly on distance from cross-section center point. This produces a relatively simplistic definition of stress that can be calculated without large amount of effort or computational resources.
There are three main approaches for acquiring stress which can be used for nominal stress fatigue analysis:
1) Calculation based approach;
2) Beam model-based finite element analysis;
3) Higher order element-based finite element analysis.
As the principle of nominal stress definition is based on elastic beam theory, it is possible to assess resistance of a particular structure against fatigue damage using manual calculations. However this is mostly the case for calculating fatigue of separate beams or joints with a relatively simple and standardized geometric and loading configurations, thus being a method which should be used mainly for very quick fatigue life estimations of aforementioned joints of low importance.
In a more general case, nominal stress is most commonly used when estimating fatigue damage with finite element analysis (FEA) where the joint or relevant structure is modelled using a 1-dimensional beam elements. Due to the lack of data about the localised joint geometry within a beam element model, it measures relevant stress responses within a single node present at the beam connection point, which are then averaged out over a particular cross-sectional area and measured at desired points around the joint weld based on the distance away from the center point of the crosssection.
This is a simplistic approach which is commonly applied for quickly estimating fatigue damage within slender structures, such as offshore platforms, bridges and cranes, however its use is somewhat limited to positions which are not bound to experience significant concentration of local stress.
Approach for evaluating nominal stress through finite element analysis that uses shell or solid elements can be performed by extracting force and moment reactions at the cross section - small distance away from the actual weld position. As stress response cannot be directly obtained from the FEA response - it is then rather calculated using stress equations for linear beams, with appropriate surface area and area moment of inertia computed subsequently.
The fact that this method of calculating nominal stress uses force and moment reaction responses acquired from the detailed finite element model - this means that acquisition of nominal stress values is not sensitive to mesh size. This significantly reduces computational complexity of finite element analysis in comparison with more advanced fatigue analysis methods which rely on extracting accurate stress response directly from the finite element model. In the cases where efficient use of computational resources is of high importance, nominal stress fatigue analysis can be a very effective approach. Nevertheless, calculating nominal stress from a shell or solid element model requires a significant amount of additional effort by the engineer, which includes definition of measurement planes for extracting force and moment reactions, as well as the manual calculation of stress using the acquired response. It is important to note that in most cases, if desired stress type for fatigue analysis is nominal stress, it is recommended to stick towards using a beam element model of the evaluated structure as it is the most efficient approach providing directly comparable amount of result accuracy.
Nevertheless, with all of the benefits towards computational simplicity of nominal stress fatigue analysis, it also is relatively limited in accuracy. Dealing with joint structures generally means dealing with stress concentrations, which nominal stress is incapable of representing within its formulation. If presence of local stress is expected, a look into different types of stress for fatigue analysis is warranted.
2.2 Local stress concentrations in fatigue analysis
As established in section 2.1 - the main weakness of averaging stress and using its response in nominal stress fatigue analysis is its inability to account for stress concentration effects. Depending on geometry and loading conditions, stress concentrations commonly are the dominant factor for crack initiation, which can potentially lead to accumulation of fatigue damage and eventual failure of the structure. As fatigue cracks in structural joints generally tend to initiate and propagate from large localized stress fluctuations (commonly within the weld toe), in many cases it is critical to include stress concentration effects within stress formulation for fatigue analysis.
Hot-spot stress (also known as structural stress) describes the stress raising effect caused by the global geometric discontinuity of the welded joints, without considering the local notch geometries of the welds (Feng and Qian, 2017). For the purposes of fatigue assessment, hot-spot stress includes stress information relevant for evaluating fatigue damage while taking into account local stress concentration effects. The methodologies for acquiring hot-spot stress values can be separated into two main categories:
1) Using stress concentration factor values with nominal stress;
2) Directly simulating and extracting hot-spot stress.
The choice for each variant is dependent on specifics of the analysed structure and available geometry detail for simulating or calculating stress response at a desired location. To determine which method is most optimal for particular fatigue assessment, it is worth understanding principles of applying both approaches with their strengths and weaknesses.
The formulation of nominal stress presents a heavy limitation for the purposes of fatigue damage evaluation due to its quality of averaging stress. However in some cases nominal stress response can still be used for performing fatigue analysis with stress-life curves that take into account local stress concentration effects. This is done with the help of stress concentration factors (SCF).
SCF acts as a stress multiplier which converts nominal stress σnominal into localized stress σlocal as shown in equation 1.
$$\sigma_{\text {local }}=\mathrm{SCF}^* \sigma_{\text {nominal }} $$ (1) It is commonly applied for detailing fatigue damage accuracy in simple loading cases of standardized joint structures. Relative calculation equations of SCF for joints commonly applied in the offshore industry can be found in (DNVGL-RP-C203, 2020), with SCF values for more complex joint types being continuously developed within progressing research literature. When the preferred way of simulating stress within joint welds is by using only 1 dimensional beam elements, localising stress values with the help of stress concentration factors is an efficient way of reformulating nominal stress values into hot-spot stress for a more detailed fatigue damage evaluation.
This method however is not without its weaknesses. The main drawback of SCF approach for localizing stress using nominal stress response is linked to its individual characteristic, which constitutes that each SCF value is specific to such factors as overall joint configuration, its size parameters, loading conditions as well as the actual location around the weld where stress is being localized. This means that less common joint configurations generally lack SCF definitions, especially when their loading conditions are also of complex nature.
In FEA environment, when simulating stress responses within structures modelled with shell or solid elements, it is possible to estimate hot-spot stress with the help of stress values taken directly from the FEA model. This means that when dealing with complex analysis cases which do not have valid stress concentration factor definitions, it is still possible to acquire representative stress responses that maintain local stress information. This is of a particularly large benefit for fatigue assessment purposes, as understanding and predicting fatigue damage is most critical when either dealing with structural joints of unconventional setup, or when joints are exposed to compounded cyclic loading conditions.
The main benefit of an approach which uses simulated hot-spot stress values lies within its wide applicability range towards different use cases and the possibility of estimating effects of stress concentrations without necessity of modelling detailed weld geometry. Based on the intrinsic nature of finite element formulation - simulating stress within structural joint models which contain sharp reentrant corners, creates stress singularities at the points where beams connect - this negates the possibility to measure stress directly at the relevant weld toe if geometric weld information is not present. Since hot-spot stress does not represent real stress in the analysed structure, its measurement is also not done directly at relevant measurement position. Instead a linear stress extrapolation technique is used, as it allows avoiding the presence of stress singularity effects when measuring local stress responses.
The main principle of stress extrapolation is based on estimating stress response at the weld toe by measuring nodal stress at a predefined calculated distance away from the weld. Nodal stress measurements are made at two locations for each relevant hot-spot stress measurement position and then stress values are linearly extrapolated to the relevant location at the weld toe. Acquired stress values can then be used to estimate fatigue damage using appropriate hot-spot stress S-N curves and methodology, described in (DNVGL-RP-C203, 2020). As it has been observed by a comparative study in (Liu et al., 2015) - linear extrapolation technique yields sufficiently accurate hot-spot stress results which are very comparable to quadratic extrapolation method. Thus using linear extrapolation approach is preferred due to methods simplicity in comparison to the quadratic counterpart.
Performing stress extrapolation allows using both shell and solid elements for stress acquisition without the necessity of modelling detailed weld within the structure, when such information is not available or very detailed stress response might not be necessary for the purposes of performed fatigue assessment.
Stress extrapolation method for acquiring stress concentration effects is an approach which is more resource-intensive than SCF method, as it requires sufficient mesh detailing, setup of correct measurement distances, calculations of extrapolated stress and it still requires verification of defined stress extrapolation setup. However it can be applied towards a much wider array of use cases and provides the ability to estimate fatigue damage at any desired position around the joint weld, without the limitations present in the SCF method. Finally it has to be noted that inclusion of localized stress information into fatigue assessment in many cases can be a critical factor towards ensuring that the designed structure remains structurally sound under extended periods of cyclic loading.
2.3 Stress direction effects in fatigue analysis
The big drawback of conventional fatigue assessment methods, such as hot-spot fatigue is that they do not consider effects of stress direction within their damage formulation. When dealing with welded steel structures such as tubular joints, it is worth noting that crack formation tends to be relatively complex and directional. Considering the fact that stress distribution and failure for different materials is dependent not only on stress magnitude but stress angle as well, it can be beneficial to evaluate how fatigue damage accumulation differs when stress direction is included within the damage formulation. An additional important aspect of how conventional hot-spot stress fatigue assessment can be insufficient and introducing error into fatigue damage results, comes from a particular stress type which is used for analysis purposes. As it is most common, using the magnitude of first principal stress as the only response for fatigue damage evaluation does not consider the effects of smaller, but still potentially significant damage accumulation appearing from second principal stress, potentially underestimating fatigue damage. On the other hand, using von Mises stress within hot-spot fatigue analysis could produce potential damage overestimation, as its stress response does not contain any information about stress direction - it considers a combined effect of all stress components based mainly on the length of resultant stress vector, when in reality it is possible that not every stress component contributes towards fatigue damage accumulation. For the aforementioned purposes, multiaxial fatigue analysis can be performed to potentially increase accuracy of damage estimation. It is a blanket phrase containing a relatively wide group of fatigue assessment methods which take into account the effects of stress direction towards estimating accumulation of fatigue damage. Since it is a field still in development, many multiaxial fatigue assessment approaches differ in their damage model formulation, use of response component types, applicability towards different types of multiaxial stress, as well as general geometry that the method is designed for. An extensive overview of multiaxial fatigue assessment methods can be found in (van Lieshout, 2020). These methods commonly require presence of a temporal stress response which contains a number of sampling points throughout the loading cycle and can potentially expose changes in both stress magnitude and stress direction. Nevertheless, a lot of multiaxial fatigue assessment methods lack empirical data which could verify their applicability towards accounting for multiaxial stress effects towards fatigue damage accumulation in welded structural joints in a representative manner. Thus accuracy of how particular method performs in relation to real life fatigue damage accumulation can still be difficult to assess.
It is important to note that there are different aspects of multiaxial fatigue which might be present in some stress/strain responses but missing in others. Generally the most critical aspects include:
1) Non-proportional multiaxial stress - meaning that structure is exposed to significant stress magnitude variations of multiple stress components which leads to change of principal stress direction within the critical stress plane. It can be observed from changing direction of principal stress component/-s during the loading cycle,
2) Proportional multiaxial stress - experienced as a relatively constant stress angle (i.e. stress angle variation value at the measurement point does not pass the threshold of > 10 degrees) and it is positioned in a way that indicates multiple principal stress components contributing to fatigue damage accumulation at a single measurement point.
Both of these factors indicate presence of multiaxial stress response yet at the same time they help defining which multiaxial fatigue assessment approaches can be applied for damage evaluation. There are additional factors indicating presence of multiaxial stress, however the aforementioned two can be very significant towards changing fatigue analysis results when compared to conventional hot-spot stress approaches, which consider effects of stress concentration, but lack information about direction of stress. It is critical to first assess whether multiaxial stress is relevant for the particular analysis. To limit the complexity of the assessment, in most cases measuring presence of multi-axial stress should be made mainly at critical measurement points where significant fatigue damage accumulation is expected. The scope of evaluation should be limited because it is likely that points of low overall stress magnitude might fulfil these requirements, but their significance towards potential fatigue failure is negligible, and adopting use of multiaxial fatigue assessment would only lead to unnecessary increase in complexity for the analysis.
Overall, multiaxial fatigue is an advanced fatigue analysis approach which focuses on increasing damage estimation accuracy under presumption that stress direction has an effect towards fatigue damage accumulation. However it is quite likely that for many application cases of welded joint structures performing multiaxial fatigue analysis might not be necessary and expected analysis gains would not provide significant difference in comparison to more conventional fatigue analysis approaches. Majority of multiaxial fatigue approaches are relatively complex in setup and performance, thus their use should also be used based on the necessity rather taken as a rule for general application.
3 Methodology for selecting fatigue analysis approach
When deciding on the particular method for performing fatigue analysis, it is important to understand the consequences of this decision both in terms of acquired result accuracy and overall complexity of the performed analysis. On one hand, not providing enough information to fatigue assessment can lead to errors or even a completely incorrect evaluation of fatigue damage within the joint, while on the other hand, introducing additional information into fatigue analysis such as stress direction effects is bound to potentially provide more accurate results. However depending on the use case, the benefit might not always be worth the added complexity within the fatigue analysis. For these purposes it is beneficial to understand when fatigue assessment provides most desirable combination of result accuracy and analysis complexity.
Based on information the fatigue assessment principles introduced in section 2 and on theory within fatigue standards (Blodgett, 1966; DNVGL-RP-C203, 2020; NEN, 2018) - a general methodology for choosing particular fatigue analysis approach for analysing welded joint structures has been defined. Figure 1 presents a decision flowchart, which when followed is meant to help an engineer choose the most optimal high-cycle fatigue assessment approach for a particular application case and avoid underestimating fatigue damage or unnecessarily making the analysis overly-complex. The main basis of this assessment is for the engineer to determine how much detail is necessary to estimate fatigue damage with sufficient accuracy. This process includes the choice of detail for stress acquisition model as well as decision on whether it is beneficial to include information about stress concentration and stress direction for the particular application. All decision blocks within the decision flowchart in Figure 1 are defined to be self explanatory, however it can be explained in more detail as follows:
 Figure 1 Proposed decision flowchart for selecting an optimal high-cycle fatigue assessment method
1) Is it a conventional joint which is well studied in the literature and standards? - This relates to evaluation on whether the beam setup in the joint is standardized in the scientific literature and/or fatigue standards. This is important for the purpose of simplification of fatigue analysis as conventional joints generally have established formulas for calculating SCF values which can reduce complexity of fatigue analysis even when inclusion of stress concentration effects is necessary.
2) Is the joint loaded only on chord beam/-s, and mainly in one, non-changing direction? - This question relates closely to the availability of SCF values in the literature, as even when the joint setup is standardized, SCF factors are mainly established for loading conditions where only chord beams are loaded and generally in only one specific direction with one dominant force or moment component. This decision is meant to conclude whether fatigue analysis should be performed using a detailed shell/solid finite element model or it can be simplified through nominal stress calculations.
3) Is analysed joint of critical importance towards structural integrity? - This evaluates whether the welded joint in question is pivotal towards handling expected loads and could be at risk towards accumulating dangerous amount of fatigue damage. When such risk is not present, stress can be calculated using predefined formulations of nominal stress, while on the other hand establishing a beam element model in a simulation environment is recommended.
4) Is the loading expected to produce stress concentrations within joint welds? - In the case where presence of stress concentrations is expected to be significant for accumulation of fatigue damage in a particular joint and loading setup, it is worth including their effects even when using nominal stress. This question is relevant in the case fatigue analysis is performed using a beam element model in finite element analysis environment and determines whether a nominal or hot-spot stress fatigue analysis should be performed.
5) Is there a fluctuation in stress angle during load cycle (> 10°)? - This is the first question for deciding whether inclusion of stress direction is necessary for fatigue assessment. This can be evaluated by first observing change of principal stress direction within a node during the loading cycle, with a necessity of angle measurement when fluctuation magnitude surpassing 10° is expected. If the fluctuation reaches this threshold at critically important node/-s it can be presumed to be significant enough to evoke a need of evaluating fatigue damage using multi-axial fatigue analysis approach which is capable of accounting for effects of non-proportional stress. The threshold of 10 degrees is based on recommendations of multiaxial stress proportionality rule defined in (DNVGL-RP-C203, 2020). The choice of particular multiaxial fatigue approach is left to the reader.
6) Is there > 1 principal stress component of large magnitude (> 30% of max principal stress)? - It requires observing stress response within the nodes of a detailed finite element model and measuring if principal stress response at the point of interest (where significant fatigue damage is expected) experiences stress of significant magnitude in more than one principal stress direction. Threshold of significance for middle and minimum principal stresses is set at 30% of the absolute value of maximum principal stress based on fatigue parametric evaluation which indicates that around the threshold of 30% fatigue damage magnitude begins to produce considerable differences in fatigue life when two planar principal stress components contribute towards damage accumulation (based on multiaxial fatigue damage rule of (DNVGL-RP-C203, 2020)). This would indicate that the particular node is experiencing multiaxial stress and might require inclusion of stress direction within the fatigue analysis.
7) Is principal stress angle within critical plane between 45° and 60°? - This is the last evaluation point for a detailed finite element model. This rule measures if the principal stress angle measured perpendicularly from the weld direction is in the threshold between 45° and 60°. Figure 2 illustrates the principle of angle measurement setup. If the presence of stress matches the aforementioned condition, then it is clear that more than one principal stress component is contributing towards fatigue damage accumulation. Additionally since it has already been established that stress at this point does not experience significant fluctuations in direction, a multi-axial fatigue analysis approach which is suitable for evaluating proportional stress should be used. If the condition is not met, a hot-spot stress fatigue analysis is bound to provide sufficient amount of result accuracy.
 Figure 2 Directional measurement setup of principal stress angle θ used for determining the type of multiaxial stress
Following the aforementioned questions within the flowchart illustrated in Figure 1-the most optimal fatigue analysis approach can be chosen. The decision-making sequence proposed in the flowchart is recommended in its defined order, as it follows analysis assessment setup procedure based on available information at each stage (i. e., before and after FEA model is established, before additional detail is introduced, at each stage when particular information can be readily collected). Note that some of the checks can be performed at the same time (as it is in the case of evaluating magnitude and direction of principal stress components in a detailed FEA model), however the checks lead to a consistent binary decision-making procedure when followed in accordance to proposed order.
4 Case study
To investigate how decision flowchart introduced in section 3 can be applied when making a choice of fatigue assessment approach, the provided theory is illustrated by applying the flowchart and evaluating fatigue damage accumulation within a load bearing joint of a particular floating crane. For the purpose of illustrating how a non-optimal choice of fatigue analysis method can impact the assessment, two auxiliary fatigue analyses are additionally performed. Results of the three methods are then compared to verify the applicability of the flowchart.
The focus of the analysis is a welded tubular joint of Cornelis Tromp 25T lemniscate crane that is being operated at the Port of Amsterdam in the Netherlands and is used for handling bulk material. In the past, flawed design of identical crane variant has ended in structural failure of the upper arm structure and death of the operator. The main reason for the structural failure is assumed to be the initiation of crack at the welded joint connection between forestay and backstay beams as shown in Figure 3. An inspection of the analysed crane (Cornelis Tromp 25T) has revealed that it is experiencing comparable damage accumulation at the same location, which could potentially lead to structural failure in near future if left unattended. This similarity shows that there is a pattern in the cranes of this design. It is speculated that damage accumulation is a result of a design flaw which occurred due to damage underestimation during design process which could have been potentially noticed and fixed if fatigue assessment was performed with a correct method. Since multiple cranes of this type are still in operation, it is worth investigating what is the main contributing factor towards damage accumulation and how different fatigue analysis approaches are capable of estimating fatigue damage within the problematic joint.
 Figure 3 Crack propagation within upper arm joint of Cornelis Tromp 25T lemniscate crane
Loading conditions acting on the crane upper arm which are relevant towards analysing fatigue damage within the problematic tubular joint structure has been acquired using multi-body dynamic (MBD) simulations. For the purpose of evaluating stress fluctuations in the top joint of the upper arm during crane working cycle - a representative MBD model of Cornelis Tromp 25T lemniscate crane has been modelled using true-scale structural dimensions, calibrated and verified using measurements taken from the real crane during its operation. The simulation model includes operation of a representative motion and work cycle as well as pontoon motion effects. Using the aforementioned setup, temporal load responses of loads acting on crane upper arm structure are acquired. Figure 4 presents crane model established within multi-body dynamic simulation environment with a hoisting load response in XYZ directions, extracted at the crane upper arm front pulley location when the crane is performing one full cargo handling cycle.
 Figure 4 Multi-body dynamic model of the crane used for load acquisition (case study)
4.1 Application of proposed methodology
Figure 5 illustrates the overall decision track applied to the proposed flowchart. When performing fatigue analysis using simulated stress responses, the thought about which fatigue analysis type is most suited for a particular case should begin even before finite element simulation model is established. This relates to evaluation if the structure should be modelled at all, or whether this should be done with either beam or shell/solid elements. In the particular case, the analysed joint setup is not conventional and the way stress distributes at a particular location within the structure is not clear in advance - this leads to a conclusion that nominal stress fatigue analysis which uses averaged stress values is not a reliable option and inclusion of stress concentration information is necessary. Additionally, in an unconventional joint setup - the lack of pre-established SCF values concludes that nominal stress response cannot be used for acquiring hot-spot stress and evaluation will entail a need to include stress concentration information into the analysis through stress extraction from a detailed shell or solid element model.
 Figure 5 Decision flowchart applied to select the optimal fatigue assessment approach for damage evaluation in crane upper arm joint (case study)
Once the necessity of including stress concentration effects has been established, an evaluation is to be performed on whether stress direction can potentially have significant effects on analysis results. For this purpose a shell finite element model of the crane upper arm structure is then developed and loaded with temporal load responses acquired with the help of multi-body dynamic simulations. Within the established FEA model of the crane upper arm, stress response is evaluated around the welds of the analysed tubular joint. Measuring the change of stress angle during the loading cycle has shown that no single point surpasses the angle fluctuation limit of 10°. This indicates that stress response is proportional and does not require the performance of multi-axial fatigue assessment which uses non-proportional stress. Nevertheless the need of including stress direction information is still not fully discounted at this stage - further assessment needs to be performed.
Next step evaluates the magnitude of secondary principal stress components in relation to maximum principal stress. Measurement results have shown that a significant number of critical points experience planar stress leading to indication that stress response within the analysed joint welds is multiaxial. However, by estimating stress angle at critical points it has been observed that principal stress component angles perpendicularly to the weld direction are not within the threshold of 45°–60°, thus leading to the conclusion that the performance of proportional stress multiaxial fatigue assessment is not necessary. According to the flowchart, using hot-spot stress fatigue assessment approach is bound to provide a sufficient amount of result accuracy and makes it the most optimal analysis method for the particular analysis case.
Because decision flowchart has indicated the necessity to include stress concentration effects but no need to include stress direction into the formulation - a hot-spot stress analysis which uses extrapolated stress response is chosen as the most optimal approach.
To capture effects of stress fluctuations throughout the loading cycle of the structure, temporal stress responses necessary for fatigue analysis are acquired with the help of finite element analysis simulations using Ansys software, in which a detailed geometry variant of crane upper arm structure is defined for evaluation. Material of the structure is set to simulate the mechanical properties of structural steel used within the real structure, with structural steel containing density of 7 850 kg/m3, Young's modulus of 200 GPa, Poisson's ratio of 0.3 and tensile yield strength of 2.5 MPa. Meshing procedure of the geometry is established using plane meshing approach (Cao et al., 1998) with mainly quadratic Shell 281 elements. Mesh convergence test has been performed in 43 measurement locations around the weld to verify that the stress response represents desired accuracy of results. According to results - stress values tend to plateau and remain stable when mesh edge size around the welds reaches ≤12 mm, which in turn has lead to mesh size around the weld set consistently to 10 mm for stress acquisition purposes. Mesh size and quality at measurement locations is defined in accordance to general hotspot fatigue analysis requirements described in (DNVGL-RPC203, 2020), with a significant mesh size refinement around evaluated joint - fitting requirements of performed mesh convergence test. As illustrated in Figure 6, temporal load responses were applied at identical locations as they have been extracted from MBD simulation results, with constraints defined at the locations where upper arm connects to front and rear arms of the crane - both allowing a single rotational degree of freedom at both connection locations.
 Figure 6 Load and constraint setup of FEA model defined for stress response acquisition.
To limit the scope of performed fatigue assessment - stress measurements are taken at a limited number of points around the circumference of the welds present in the tubular joint. As per recommendations of (DNVGL-RP-C203, 2020) and as illustrated in Figure 7, measurement points are set up in 8 locations per circular connections (related to forestay-backstay weld), with same point distribution principle defined for chord-brace connection. Due to the fact that pylon legs overlap - this limits method applicability to 12 points for two leg beams (points P1-P12 and C1- C12) and extends measurement setup to additional 3 points defined for the weld connecting overlapping pylon leg beams (points P13-P15). In total 43 measurements positions are defined to assess fatigue damage in the problematic tubular joint - this measurement setup is used identically by all upcoming fatigue analyses.
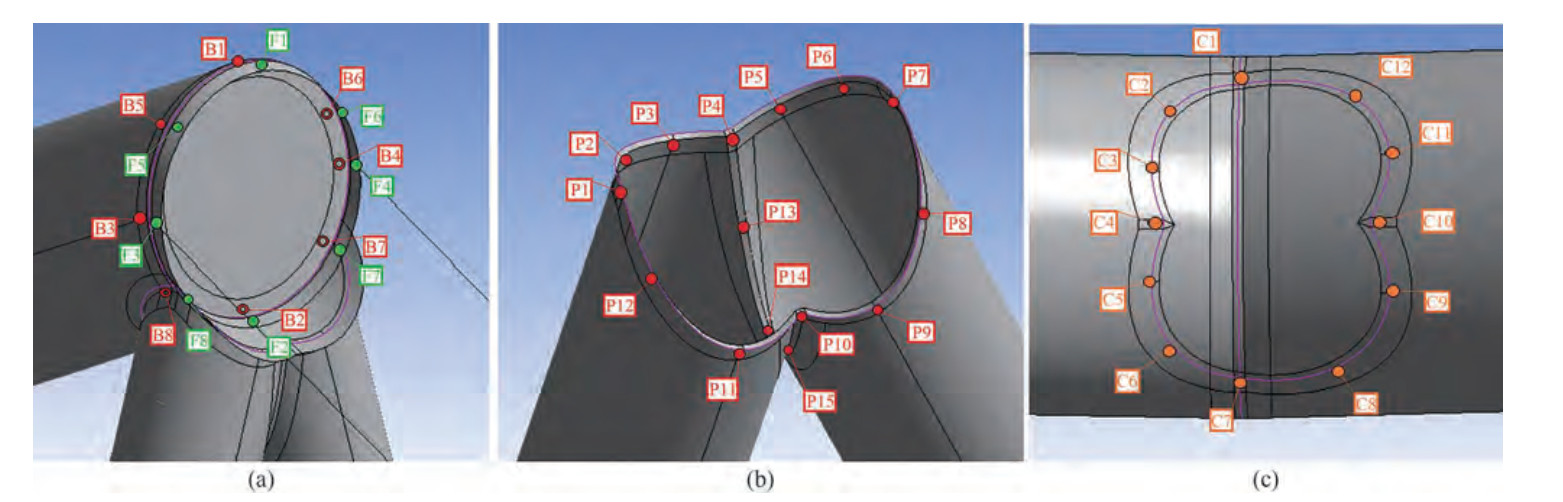 Figure 7 Fatigue damage measurement location setup for crane upper arm joint.
Values of hot-spot stress are measured at all measurement points illustrated in Figure 7 using von Mises stress response and stress cycles are established using Rainflow cycle counting algorithm (Amzallag and Gerey, 1994). Method applicability for calculating hot-spot stress with finite element analysis has been verified by performing stress concentration factor calculations for a more conventional uniplanar K-joint using SCF formulas defined in (DNVGLRP-C203, 2020) standard for "Fatigue design of offshore steel structures". SCF results were then compared with hotspot stress results acquired with FEA simulation.
Since the damage within the structure has been observed late, there is a lack of robust fatigue damage experimental data for the joint - thus damage comparison with the real structure is limited to damage inspection performed during the stage of crane maintenance. Fatigue damage accumulation within the performed analysis is evaluated for 23 years, based on how long the crane has been operating before critical crack has been observed. Using crane transshipment data, this timeline has been determined to include a total number of approximately 1.31 million work cycles, which was the cycle number chosen for evaluation of fatigue damage. Fatigue damage accumulation is then established using hot-spot stress-life (S-N) curves with a linear cumulative damage rule for two-sloped S-N curves of classes T and F acquired from (DNVGL-RP-C203, 2020):
$$D=\sum\limits_{i=1}^k \frac{n_i}{N_i}=\frac{1}{\bar{a}} \sum\limits_{i=1}^k n_i^*(\Delta \sigma)^m \leqslant \eta=\frac{1}{\mathrm{DFF}} $$ (2) where D stands for is accumulated fatigue damage; $\bar{a} $ is the intercept of the design S-N curve with the log N axis; m is the negative inverse slope of the S-N curve; k is the number of stress blocks; ni is the number of stress cycles in stress block i; Ni is the number of cycles to failure at constant stress range ∆σ; η is usage factor defined as the inverse of design fatigue factor; DFF is the design fatigue factor. S-N curve class is chosen based on the weld type, with points F1-F8 and B1-B8 (illustrated in Figure 7) assigned the class F with the rest of the point defined as class T.
4.2 Verification of proposed methodology
To verify the applicability of the aforementioned method, the results of optimal fatigue assessment approach is compared with two additional methods - particularly nominal and proportional multiaxial fatigue analyses. Although hot-spot fatigue analysis is supposed to provide sufficient result accuracy according to the presented theory, additional methods are performed for comparative purposes to evaluate applicability of the approach. The main point of these verification experiments is to observe how separately removal of stress concentration information and addition of stress direction information affect fatigue assessment results.
4.2.1 Nominal stress fatigue analysis
Based on decision tree presented in Figure 1, nominal stress approach is not the optimal method for fatigue assessment due to presence of stress concentrations within the model, leading to hypothesis that fatigue damage results will be underestimated when using nominal stress responses. This fatigue analysis is performed to verify whether aforementioned assumption is correct.
As the model of the tubular joint is established using 2-dimensional shell elements, stress acquisition is performed through extracting force and moment reactions from the finite element model using predefined planes positioned close to relevant welds, and then using acquired responses to calculate nominal stress at relevant positions. This allows to acquire nominal stress values at each time step based on the temporal force and moment reaction responses, which are then compiled into stress time histories for all measurement points.
As stated in (Kam and Dover, 1989), there are three major stress axes important for nominal fatigue loading in tubular joints - namely axial loading, in plane bending (IPB) and out of plane bending (OPB). Because nominal stress fatigue analysis assumes that normal stress components are dominant for fatigue damage accumulation - only normal stress components are used for the fatigue assessment. Cycle counting is performed using Rainflow cycle counting algorithm, which extracts relevant stress cycles out of the temporal stress history of each stress component. Fatigue damage is calculated based on recommendations of (Hobbacher, 2016), using its recommended nominal stresslife curves of Class 56 for points F1-F8 and B1-B8 (illustrated in Figure 7) and class 71 for the rest of measurement positions. Palmgren-Miner rule is used for estimating damage factor of each stress cycle:
$$ D_i=\sum\left(\frac{\Delta \sigma_{\text {range }}}{\Delta \sigma_{\text {FAT }}}\right)^3 \frac{C n}{N} $$ (3) where ∆σrange is stress range measured for evaluated stress cycle; ∆σFAT is fatigue life at 2 million cycles specific for applied S-N curve; C is the number of identical stress cycles within stress time history; n is the evaluated fatigue life of the structure (1.31 million cycles); and N being the reference cycle limit for fatigue life S-N curves (2 million cycle).
4.2.2 Proportional stress multiaxial fatigue analysis
Based on decision tree setup defined in Figure 1, an evaluation of multiaxial stress response has been performed. Stress measurement results which evaluate stress magnitude and direction throughout the loading cycle of analysed joint have shown that there is a presence of multiaxial stress within majority of measurement locations, mostly in the form of critical planes with significant stress magnitude in two principal directions. However, according to defined decision setup, hot-spot stress fatigue analysis should provide a sufficient amount of accuracy for the model to allow predicting fatigue damage in the structure. This is due to the fact that multiaxial stress response does not indicate presence of stress non-proportionality at any of the measurement locations, and even though some positions show presence of principal stress angle within critical stress plane being shifted between 45° and 60° in relation to the axis perpendicular to the weld - this is not present in the positions which indicate most critical stress concentrations where damage is accumulating in the real structure. These factors show that multiaxial stress response is proportional and in most cases a single stress component should contribute most towards fatigue damage accumulation. This concludes that including stress direction effects by performing multiaxial stress fatigue analysis is not necessary, as it is not bound to significantly impact the accuracy of analysis results.
Nevertheless, to evaluate whether the aforementioned statement is merited and the methodology proposed in Figure 1 is correct - multiaxial fatigue assessment is performed and fatigue damage is evaluated from the standpoint of stress direction. As multiaxial stress response experienced by the structure is proportional, a hot-spot stress critical plane multiaxial fatigue assessment method (introduced in (DNVGL-RP-C203, 2020)) is used. This decision of choosing particular method is based on the type of multiaxial stress that is being evaluated (i.e. proportional stress) as well as the fact that this fatigue assessment approach is particularly designed to evaluate multiaxial fatigue damage within welded structural joints. This method uses responses of two largest principal stress components within extrapolated hot-spot stress result to estimate fatigue damage. Aforementioned stress components are defined into parallel and perpendicular stress, based on value of principal angle θ illustrated in Figure 2.
As this method deals mainly with proportional stress response, it uses a conventional Rainflow cycle counting algorithm to establish number of cycles and their respective magnitudes. In order to evaluate fatigue damage - hot-spot stress S-N curves are used, with an identical damage rule applied as it has been used for hot-spot stress analysis. The rule for determining S-N curve class is based on stress measurement angle for each component (as indicated in Figure 2), depending on whether θ ≤ 30° or θ > 30° marking component S-N curve being of class T or class C2 respectively. Particular S-N curves can be found in (DNVGL-RP-C203, 2020). Calculated fatigue damage uses the following rule for choosing stress component inducing largest amount of damage D, based on principal angle θ value:
$$D=\max \left\{\begin{array}{l} D_{\perp}=\sum\limits_t D(\theta) \text { for }-60^{\circ} \leqslant \theta \leqslant 60^{\circ} \\ D_{\perp}=\sum\limits_t D(\theta) \text { for }-60^{\circ} \leqslant \theta \leqslant 60^{\circ} \end{array}\right. $$ (4) Since there is an angle overlap region between two rules - any measurement points with two stress components within overlap bounds are considered to experience combined effect, requiring summation of damage. The points within the overlap region are the locations where both principal stress components are contributing to fatigue damage and is the part which is bound to provide the largest amount of difference in damage accumulation when compared to hotspot stress analysis - as here summed up damage factor values present a cumulative rule of damage accumulation from both stress components. If this damage is present at critical stress concentration positions, using multiaxial fatigue assessment approach can potentially expose large fatigue damage underestimation. In the performed analysis, damage is evaluated for all measurement points to acquire final fatigue damage accumulation results. For comparative purposes the number of work cycles is kept the same (at 1.31 million). The aforementioned approach was applied to evaluate fatigue around all welds present in the joint at the same locations as for nominal and hot-spot stress fatigue approaches. An extended method overview for this particular multiaxial fatigue assessment method can be found in (DNVGL-RP-C203, 2020).
5 Results
To demonstrate how presented decision-making scheme for selecting fatigue analysis approach, the results of three aforementioned fatigue analysis approaches are compared. The flowchart assessment has lead to conclusion that hotspot stress is the preferred analysis type for evaluating fatigue damage within the analysed tubular joint structure, both in terms of accuracy and computational complexity. The comparison of the three fatigue assessment methods is meant to verify the conclusion and present how inclusions of stress concentration and stress direction information into fatigue assessment affect its results. As indicated at the start of the section 4.2, damage has been evaluated for 23 years of operation, as is the amount of time that the crane has been operating until an aggressive crack propagation has been observed within the load bearing tubular joint.
5.1 Hot-spot fatigue analysis results
Here the results are presented for the fatigue assessment method which has been indicated as the optimal approach based on methodology illustrated in Figure 1. Fatigue damage factor value calculations were performed for all measurement points defined in Figure 7. Results are summarized in Table 2.
Table 1 Accumulated fatigue damage factor DiHS of welded joint measurement points indicated in Figure 7, acquired using hot-spot stress fatigue assessment method (for 23 years of operation).Brace Point P1 P2 P3 P4 P5 P6 P7 P8 DiHS 3.139 0.078 0.233 0.066 0.299 0.081 4.548 0.314 Point P9 P10 P11 P12 P13 P14 P15 DiHS 0.169 0.009 0.094 0.263 0.184 0.000 0.140 Chord Point C1 C2 C3 C4 C5 C6 C7 C8 DiHS 3.235 0.321 0.191 0.209 0.220 0.408 4.449 0.896 Point C9 C10 C11 C12 DiHS 0.194 0.268 0.168 0.617 Forestay Point F1 F2 F3 F4 F5 F6 F7 F8 DiHS 0.011 2.946 0.081 0.095 0.013 0.020 2.023 1.414 Backstay Point B1 B2 B3 B4 B5 B6 B7 B8 DiHS 0.012 2.563 0.124 0.143 0.013 0.020 4.420 3.067 Table 2 Difference in accumulated fatigue damage ratio DiHS − DiN between hot-spot and nominal fatigue assessment results at points indicated in Figure 7, for 23 years of operation. Sign indicates which method leads to higher damage factor value (positive - hot-spot stress fatigue approach damage is higher, negative - nominal stress approach damage is higher.)Brace Point P1 P2 P3 P4 P5 P6 P7 P8 DiHS − DiN +2.763 −0.224 +0.196 −0.033 +0.253 −0.293 +3.887 −0.067 Point P9 P10 P11 P12 P13 P14 P15 DiHS − DiN +0.087 −0.017 +0.024 +0.259 +0.175 −0.232 +0.135 Chord Point C1 C2 C3 C4 C5 C6 C7 C8 DiHS − DiN +3.217 +0.266 +0.121 +0.137 +0.141 +0.340 +4.425 +0.816 Point C9 C10 C11 C12 DiHS − DiN +0.094 +0.164 +0.057 +0.522 Forestay Point F1 F2 F3 F4 F5 F6 F7 F8 DiHS − DiN −0.025 +2.882 +0.022 +0.025 −0.027 −0.034 +1.948 +1.356 Backstay Point B1 B2 B3 B4 B5 B6 B7 B8 DiHS − DiN −0.030 +2.502 +0.052 +0.083 −0.046 −0.023 +4.363 +2.993 Results show that for defined lifetime, joint structure is incapable of surviving experienced stress cycles. In total, 10 points (out of 43) indicate fatigue failure with their values exceeding fatigue damage limit of DiHS < 1 (with points P7, C7 and B7 exceeding the limit 4-fold). This is an indication that the structure is not safe for operation under defined loading conditions as it accumulates a large amount of fatigue damage along its welds. Figure 9 illustrates positions of critical failure points and their distributions.
 Figure 8 Results of crack propagation location comparison in the real crane and stress distribution in developed representative FEA model (stress capped at 250 MPa)
 Figure 9 Results of damage accumulation comparison between per‐ formed fatigue assessment approaches
Based on the positions of failure in the assessed upper arm joint - it appears that most points experiencing highest fatigue damage are in inaccessible locations both for inspection and repair (hidden by structure of pylon legs). Accessibility of critical potential failure points is a crucial aspect of well-established and safe structural design which in the analysed joint structure has not been properly taken into account. In terms of critical failure point locations - they are concentrated at the brace saddle on both sides of the joint, as well and along the bottom weld between forestay and backstay beams. This is an interesting observation which correlates well with positions of crack propagation which has been observed in the crane joint of Cornelis Tromp 25T as well as other cranes of the same model. This indication shows that performed hot-spot fatigue assessment is capable of distinguishing points of crack initiation and propagation in the analysed geometry. The only question concerning this approach lies in the magnitude of fatigue damage and whether performed hot-spot fatigue assessment which uses von Mises stress is too conservative in comparison to hot-spot fatigue approach which uses first principal stress as its response.
5.2 Stress concentration effects
This section is meant to compare the results between the optimal fatigue assessment method (hot-spot stress method) and results of sub-optimal choice which does not include stress concentration effects (nominal stress method). Table 2 presents a comparison of fatigue damage factor magnitude results acquired using nominal stress approach DiN and hot-spot stress approach DiHS. Here negative values indicate where nominal stress fatigue approach acquired higher damage factor Di value, while positive values show the opposite conclusion. Value comparison is established for identical point distribution setup in both analyses allowing for observing direct fatigue damage factor value contrast at all measurement points. For measurement point location setup and naming convention - refer to Figure 7.
Results show a very significant difference in accumulated fatigue damage between nominal and hot-spot stress approaches. In total, 31 out of 43 measurement points show larger fatigue damage accumulation factor when it is calculated using a hot-spot stress approach - with 10 of these points showing a factor value difference above |DiHS- DiN| = 1 (specifically for points P1, P7, C1, C7, F2, F7, F8, B2, B7, B8). These points are located at the brace saddle connection with the chord where a significant stress concentration has been observed in real structure (Figure 8), as well as at the bottom part of forestay-backstay beam weld. The difference in magnitude at these points (which in the case of hot-spot stress correlate well with the locations where the crane has experienced stress concentrations in FEA model and crack propagation in real crane) shows that a nominal stress fatigue assessment appears to severely underestimate fatigue damage appearing in the real structure. Additionally, when it comes to damage comparison between two methods - points P2, P6 and P14 show larger damage accumulation using a nominal stress approach by a relatively significant margin (i.e. |DiHS- DiN| > 0.2). However in the FEA model of the crane structure these specific locations do not appear to show a presence of stress concentrations. There are two key reasons why results between both fatigue assessments are different.
1) Nominal stress approach cannot distinguish the area over which stress is distributed in the cross-section - this method averages force and moment reactions over the entire cross section, leading to less accuracy in results at specific measurement points. This is very likely to be the main reason why points P2, P6 and P14 show larger damage accumulation factor values for nominal stress results, as their measurements were taken at the end points of an elliptical cross-section, which tends to increase stress result due to larger distance from the center point of a specific crosssection.
2) Hot-spot stress fatigue assessment extracts stress for extrapolation directly from an FEA simulation nodes, meaning its stress values are localised and are able to assess presence and effects of stress concentrations.
In a fatigue analysis, choice of S-N curve has a large effect on resultant values of fatigue damage factor. However, for both nominal and hot-spot stress approaches S-N curves were chosen on identical weld definitions. This means that both nominal and hot-spot S-N curves can be directly compared as they represent same points and weld types in uniform fashion, which indicates that choice of S-N curve is not the reason for difference in fatigue damage factor results. This means that the main reasons for result difference is mainly linked to how nominal stress approach is not able to account for and distinguish locations of stress concentrations.
Overall the entire process of nominal stress fatigue assessment is prone to providing non-representative result when compared to damage within the real structure. This indicates that fatigue assessment for unconventional joints which are prone to experience stress concentrations should be performed using a hot-spot fatigue assessment method, rather than a nominal stress approach as indicated within the proposed decision flowchart.
5.3 Stress direction effects
This section compares the effects of optimal analysis (hot-spot stress) against proportional stress multiaxial fatigue assessment approach. Table 3 presents a comparison of fatigue damage factor magnitude results acquired using multi-axial fatigue approach DiMA and hot-spot stress approach DiHS. Here negative values indicate where hot-spot stress fatigue approach acquired higher damage factor Di value, while positive values show the opposite result. Value comparison is established for identical point distribution setup in both analyses allowing to observe direct fatigue damage factor value contrast at all measurement points. For measurement point location setup and naming convention - refer to Figure 7.
Table 3 Difference in accumulated fatigue damage ratio DiMA − DiHS between hot-spot and multi-axial fatigue assessment results at points indicated in Figure 7, for 23 years of operation. Sign indicates which method leads to higher damage factor value (positive - multi-axial fatigue approach damage is higher, negative - hot spot stress approach damage is higher.)Brace Point P1 P2 P3 P4 P5 P6 P7 P8 DiMA − DiHS −0.195 −0.023 −0.061 −0.066 −0.106 −0.028 −0.312 −0.079 Point P9 P10 P11 P12 P13 P14 P15 DiMA − DiHS −0.012 −0.007 0.045 −0.101 −0.063 +0.002 −0.079 Chord Point C1 C2 C3 C4 C5 C6 C7 C8 DiMA − DiHS +0.135 +0.638 +0.207 +0.355 +0.267 +0.828 −1.533 −0.655 Point C9 C10 C11 C12 DiMA − DiHS +0.451 +0.390 +0.427 +0.341 Forestay Point F1 F2 F3 F4 F5 F6 F7 F8 DiMA − DiHS −0.010 −1.956 −0.026 −0.029 −0.013 −0.019 −0.126 −0.013 Backstay Point B1 B2 B3 B4 B5 B6 B7 B8 DiMA − DiHS −0.011 −1.698 −0.041 −0.040 −0.013 −0.019 −2.819 −2.699 As seen from the result summary in Table 3, differences between damage is relatively comparable for both methods. Nevertheless there are differences in damage magnitude and the change in how each measurement point is loaded using multi-axial fatigue. This is most significant in the case of points C7, F2, B2, B7 and B8, where hot-spot stress fatigue assessment approach shows significantly larger damage accumulation value than multiaxial fatigue assessment approach. Along with the aforementioned points, higher damage with multiaxial fatigue is also observed at the point C1, which does not contain a large increase, however it is important due to being one of the critical failure points where structure is experiencing crack propagation. Such results are linked to the fact that at these points for multi-axial fatigue assessment only a single principal stress component has been used (damage has not been summed up due to parallel stress angles not being between angle threshold of 45° < θ < 60°).
Another important observation is presented for fatigue damage accumulation factor values in measurement points located on the chord. Here majority of damage results indicate that calculations measured using multi-axial fatigue assessment method acquire larger amount of fatigue damage. This is mainly linked to the application of S-N curve for dominant principal stress component that is based on the angle value for parallel and perpendicular stress. Most of these points indicate that parallel stress is the dominant and accumulate more fatigue damage than its perpendicular stress counterpart - this results in application of more dangerous S-N curve (C2 for multi-axial fatigue and T for hot-spot stress approach), leading to higher estimated fatigue damage when stress direction is taken into account.
Aside from present differences in magnitude at some points, when it comes to critical locations for fatigue damage accumulation - both methods appear to indicate critical fatigue damage at same locations with comparable damage magnitude. This means that for the purposes of indicating presence of fatigue damage accumulation, both methods can be considered as feasible, with hot-spot stress approach which uses von Mises stress as response, in general providing more conservative results. As it has been assessed in section 4.2.2 - there is an indication that multi-axial fatigue assessment is beneficial for assessed joint structure due to presence of two significant principal stress components acting at most measurement point, which indicate effects of multi-axial stress. However since this multiaxial stress response is proportional and at critical positions does not contain necessary angle for both principal stress components to contribute towards fatigue damage, the effects of accuracy are relatively modest when compared to hotspot stress fatigue analysis. Additionally, since the presented assessment is based on simulation results which are compared to the real joint structure solely based on crack propagation locations, the accuracy of multi-axial fatigue assessment results should have to be backed with data on crack initiation location and propagation rate to fully confirm the statement for improved accuracy. Nevertheless, the high similarity between damage magnitude for both point locations show that it is unnecessary to perform multiaxial fatigue analysis for the particular joint as difference in results at critical locations remains marginal.
5.4 Applicability of decision making methodology
Main failure points where the structure is experiencing most fatigue damage is indicated in Figure 9. Here a comparison of accumulated damage magnitude is illustrated for the three performed fatigue assessment methods. As it has been observed through previous comparisons, not including stress concentration effects at critical location points significantly underestimates fatigue damage, while inclusion of stress direction effects provides a difference in results which is relatively modest in magnitude. This confirms that based on stress response evaluation, hot-spot fatigue assessment provides sufficient result accuracy which has not been reached by the nominal stress approach, while at the same time not having the added complexity of multiaxial fatigue analysis. This verifies the statement that proposed decision flowchart introduced in 1 is capable of predicting the optimal method for estimating high-cycle fatigue.
The applicability of this methodology and made observations are meant to be true and feasible not only for the specific joint geometry presented within this paper, but also in the case of a large variety of welded joint structures, which could be screened just as well based on the rules presented within the flowchart. However, since verification performed within this paper has been limited to a single joint geometry and loading case, a more in-depth comparative assessment with a larger variety of joint structures and loading conditions could be performed to fully verify validity of flowchart application.
6 Conclusion
This paper has reasoned and proposed a decision flowchart for judging when it is necessary to include effects of stress concentrations and stress direction into high-cycle fatigue assessment methodology. Information provided in this paper is meant to help streamline the process of choosing a fatigue assessment approach which provides balance between result accuracy and computational complexity.
To illustrate the presented theory, fatigue analysis selection methodology has been applied to evaluate fatigue damage within a problematic tubular joint of a lemniscate crane upper arm. An optimal fatigue analysis approach has been determined based on introduced decision making approach, which indicated use of hot-spot stress fatigue analysis as being the optimal method for the application. Hypothesis was then tested by performing fatigue damage estimation using nominal and multi-axial fatigue assessment approaches which are used for comparison purposes with the optimal method. Results have shown that nominal stress fatigue analysis is not capable to predict fatigue damage based on how it has accumulated in the real structure. This is due to the fact that nominal stress does not contain enough information to distinguish stress concentration effects. On the other hand, both hot-spot and multi-axial fatigue assessment approaches were able to define most critical failure points, with a relatively small difference in magnitude difference between both results. The similarity of acquired results and more simple approach of performing hot-spot stress fatigue assessment shows that there is no real necessity of evaluating multiaxial fatigue for the evaluated structure - making hot-spot stress approach most optimal in the analysed case. Nevertheless is expected that accounting for stress direction improves the accuracy of resultant damage accumulation, however more experimental measurement data is needed to fully verify this statement, and the benefits for the particular application are marginal enough to discount its necessity.
The comparative assessment performed in this paper has shown that it is very critical to consider effects of stress concentration when evaluating fatigue damage of complex welded joint structures, especially when they do not have standardized stress concentration factor values, as it was the case within the performed analysis. It additionally has shown that multi-axial fatigue assessment approach presented in (DNVGL-RP-C203, 2020) is well suited for estimating fatigue damage within welded tubular joints when evaluated stress response within the structure is proportional in nature, however in the particular case - the result accuracy improvements at critical failure points are relatively marginal, as it has been predicted by using the proposed decision-making flowchart. Performed verification experiments and compared fatigue analysis results do indicate that the proposed decision making structure provides a good conclusion and can prove to be a solid tool which can be used as a general guide for choosing the most optimal type of high-cycle fatigue analysis approach for a particular application case, balancing both result accuracy and computational complexity. Since application is verified with a single case - to ensure that the methodology is applicable to a general case of choosing fatigue analysis of welded joint structures - more investigations should be performed in the future with a larger variety of welded structural elements.
-
Figure 1 Proposed decision flowchart for selecting an optimal high-cycle fatigue assessment method
Figure 2 Directional measurement setup of principal stress angle θ used for determining the type of multiaxial stress
Figure 3 Crack propagation within upper arm joint of Cornelis Tromp 25T lemniscate crane
Figure 4 Multi-body dynamic model of the crane used for load acquisition (case study)
Figure 5 Decision flowchart applied to select the optimal fatigue assessment approach for damage evaluation in crane upper arm joint (case study)
Figure 6 Load and constraint setup of FEA model defined for stress response acquisition.
Figure 7 Fatigue damage measurement location setup for crane upper arm joint.
Figure 8 Results of crack propagation location comparison in the real crane and stress distribution in developed representative FEA model (stress capped at 250 MPa)
Figure 9 Results of damage accumulation comparison between per‐ formed fatigue assessment approaches
Table 1 Accumulated fatigue damage factor DiHS of welded joint measurement points indicated in Figure 7, acquired using hot-spot stress fatigue assessment method (for 23 years of operation).
Brace Point P1 P2 P3 P4 P5 P6 P7 P8 DiHS 3.139 0.078 0.233 0.066 0.299 0.081 4.548 0.314 Point P9 P10 P11 P12 P13 P14 P15 DiHS 0.169 0.009 0.094 0.263 0.184 0.000 0.140 Chord Point C1 C2 C3 C4 C5 C6 C7 C8 DiHS 3.235 0.321 0.191 0.209 0.220 0.408 4.449 0.896 Point C9 C10 C11 C12 DiHS 0.194 0.268 0.168 0.617 Forestay Point F1 F2 F3 F4 F5 F6 F7 F8 DiHS 0.011 2.946 0.081 0.095 0.013 0.020 2.023 1.414 Backstay Point B1 B2 B3 B4 B5 B6 B7 B8 DiHS 0.012 2.563 0.124 0.143 0.013 0.020 4.420 3.067 Table 2 Difference in accumulated fatigue damage ratio DiHS − DiN between hot-spot and nominal fatigue assessment results at points indicated in Figure 7, for 23 years of operation. Sign indicates which method leads to higher damage factor value (positive - hot-spot stress fatigue approach damage is higher, negative - nominal stress approach damage is higher.)
Brace Point P1 P2 P3 P4 P5 P6 P7 P8 DiHS − DiN +2.763 −0.224 +0.196 −0.033 +0.253 −0.293 +3.887 −0.067 Point P9 P10 P11 P12 P13 P14 P15 DiHS − DiN +0.087 −0.017 +0.024 +0.259 +0.175 −0.232 +0.135 Chord Point C1 C2 C3 C4 C5 C6 C7 C8 DiHS − DiN +3.217 +0.266 +0.121 +0.137 +0.141 +0.340 +4.425 +0.816 Point C9 C10 C11 C12 DiHS − DiN +0.094 +0.164 +0.057 +0.522 Forestay Point F1 F2 F3 F4 F5 F6 F7 F8 DiHS − DiN −0.025 +2.882 +0.022 +0.025 −0.027 −0.034 +1.948 +1.356 Backstay Point B1 B2 B3 B4 B5 B6 B7 B8 DiHS − DiN −0.030 +2.502 +0.052 +0.083 −0.046 −0.023 +4.363 +2.993 Table 3 Difference in accumulated fatigue damage ratio DiMA − DiHS between hot-spot and multi-axial fatigue assessment results at points indicated in Figure 7, for 23 years of operation. Sign indicates which method leads to higher damage factor value (positive - multi-axial fatigue approach damage is higher, negative - hot spot stress approach damage is higher.)
Brace Point P1 P2 P3 P4 P5 P6 P7 P8 DiMA − DiHS −0.195 −0.023 −0.061 −0.066 −0.106 −0.028 −0.312 −0.079 Point P9 P10 P11 P12 P13 P14 P15 DiMA − DiHS −0.012 −0.007 0.045 −0.101 −0.063 +0.002 −0.079 Chord Point C1 C2 C3 C4 C5 C6 C7 C8 DiMA − DiHS +0.135 +0.638 +0.207 +0.355 +0.267 +0.828 −1.533 −0.655 Point C9 C10 C11 C12 DiMA − DiHS +0.451 +0.390 +0.427 +0.341 Forestay Point F1 F2 F3 F4 F5 F6 F7 F8 DiMA − DiHS −0.010 −1.956 −0.026 −0.029 −0.013 −0.019 −0.126 −0.013 Backstay Point B1 B2 B3 B4 B5 B6 B7 B8 DiMA − DiHS −0.011 −1.698 −0.041 −0.040 −0.013 −0.019 −2.819 −2.699 -
Amzallag C, Gerey JP (1994) Standardization of the rainflow counting method for fatigue analysis. Fatigue, 16: 7 Blodgett C (1966) Design of welded structures. James F. Lincoln Arc Welding Foundation. Columbus, USA Cao JJ, Yang GJ, Packer JA, Burdekin FM (1998) Crack modeling in FE analysis of circular tubular joints. Engineering Fracture Mechanics, 61, 17 Corigliano P, Crupi V (2022) Review of fatigue assessment approaches for welded marine joints and structures. Metals, 12(6). https://doi.org/10.3390/met12061010 DNVGL-RP-C203 (2020) Fatigue design of offshore steel structures Feng L, Qian X (2017) A hot-spot energy indicator for welded plate connections under cyclic axial loading and bending. Engineering Structures 147: 598-612. https://doi.org/10.1016/j.engstruct.2017.06.021 Fricke W (2003) Fatigue analysis of welded joints: state of development. Marine Structures 16(3): 185-200. https://doi.org/10.1016/s0951-8339(02)00075-8 Fuštar B, Lukačević I, Dujmović D (2018) Review of fatigue assessment methods for welded steel structures. Advances in Civil Engineering, 2018, 1-16. https://doi.org/10.1155/2018/3597356 Gagg C, Lewis P (2009) In-service fatigue failure of engineered products and structures-Case study review. Engineering Failure Analysis, 16: 1775-1793. https://doi.org/10.1016/j.engfailanal.2008.08.008 Hobbacher AF (2016) Recommendations for Fatigue Design of Welded Joints and Components (2nd ed. ). Cham, Switzerland: Springer ISO (2020) ISO 19902: 2020. London: International Organization for Standardization Kam JCP, Dover WD (1989) Mathematical background for applying multiple axes random stress histories in the fatigue testing of offshore tubular joints. International Journal of Fatigue, 5: 8 Liu R, Ji B, Wang M, Chen C, Maeno H (2015) Numerical evaluation of toe-deck fatigue in orthotropic steel bridge deck. Journal of Performance of Constructed Facilities, 29(6). https://doi.org/10.1061/(asce)cf.1943-5509.0000677 Lotsberg I (2016) Fatigue Design of Marine Structures. New York, USA: Cambridge University Press NEN (2018) en13001-3-1. Delft: Nederlands Normalisatie Instituut Van Lieshout PS (2020) On the assessment of multiaxial fatigue resistance of welded steel joints in marine structures when exposed to non-proportional constant amplitude loading (PhD Offshore and Dredging Engineering). Delft University of Technology, Delft, Netherlands. https://doi.org/10.4233/uuid:afd39f40-7569-4cc6-ac1a-659342b45f9a
