
An Improved Unique Fatigue Crack Growth Rate Curve Model and Determination of the Model Shape Exponents
https://doi.org/10.1007/s11804-022-00305-7
-
Abstract
It is essential to precisely predict the crack growth, especially the near-threshold regime crack growth under different stress ratios, for most engineering structures consume their fatigue lives in this regime under random loading. In this paper, an improved unique curve model is proposed based on the unique curve model, and the determination of the shape exponents of this model is provided. The crack growth rate curves of some materials taken from the literature are evaluated using the improved model, and the results indicate that the improved model can accurately predict the crack growth rate in the near-threshold and Paris regimes. The improved unique curve model can solve the problems about the shape exponents determination and weak ability around the near-threshold regime meet in the unique curve model. In addition, the shape exponents in the improved model at negative stress ratios are discussed, which can directly adopt that in the unique curve model.Article Highlights• An improved unique fatigue crack growth rate curve model for the R-ratio effect on the near-threshold and Paris crack growth rate is proposed;• The improved model is verified by analyzing the fatigue crack growth rate curves of various materials at different stress ratios;• The method to determine the model shape exponents is established. -
1 Introduction
Metal structures, such as ships, offshore structures, aircraft, and bridges, will inevitably introduce initial defects during construction, those defects will grow into cracks under alternating loads, which may induce fatigue crack growth (FCG) in structures (Haghani et al., 2012; Mao et al., 2012; Barter and Molent, 2013; Askar and Havigh, 2017). Figure 1 shows typical pictures of the FCG phenomenon of those metal structures. There are three stages in the FCG process: the near-threshold regime, the stable crack growth regime also known as the "Paris regime" and the unstable crack growth regime (Ritchie, 1979). The unstable crack growth regime takes the least time in the FCG than other regimes, and if the FCG is in this regime, the structure will fail quickly (Forman et al., 1967). However, the crack growth around the near-threshold regime plays an important role in the FCG life prediction of structures for their lives are mainly consumed in the crack initiation and near-threshold stages (Ritchie, 1979; Ding et al., 2005; Sun et al., 2020). Hence, it is of great significance to accurately predict the FCG in the near-threshold and Paris regimes for the design and assessment of the FCG lives of structures.
 Figure 1 FCG phenomenon of metal structures
There are many FCG models that have been presented for the FCG life prediction of metal structures. The most famous is the Paris model (Paris and Erdogan, 1963), which first establishes the relationship between the FCG rate and stress intensity factor (SIF) range. But the effect of stress ratio R on the FCG has been unconsidered in the Paris model, then the concept of crack closure is proposed by Elber (Elber, 1970) to explain the R–effect on the FCG. With the development of research on the crack closure, Sadananda (Sadananda, 1995) and Paris et al. (Paris and Tada, 2002) found that the effect of crack closure on the total fatigue damage was overestimated, which just on the part of the crack tip. On the basis of this background, many researchers proposed the partial crack closure model (Kujawski, 2001a; Paris and Tada, 2002). Due to the crack closure is caused by many factors (Pippan and Hohenwarter, 2017), the theory of crack closure is imperfect, and the measurement of crack closure is difficult (Skorupa et al., 2007; Zhang et al., 2020), many researchers try to bypass the phenomenon of crack closure to explain the R–effect on the FCG. The two-parameter driving forces model (Walker, 1970; Kujawski, 2001b; Kujawski, 2001c; Zhan et al., 2014; Li et al., 2022) is one of the widely used methods; however, it is mainly suitable for the two-parameter driving forces model to analyze the FCG in the Paris regime. Many research shows that the FCG in the nearthreshold regime is related to microstructures (Kumar et al., 2013; Guo et al., 2019), stress ratio (Ritchie, 1977; Zhu et al., 2015), loading frequency (Tazoe et al., 2020), etc., the applicability of the proposed two-parameter driving forces model to FCG in the near-threshold regime remains to be discussed.
The author has proposed the unique curve model based on the two-parameter driving forces to consider the R-effect on the FCG (Huang and Moan, 2007; Huang et al., 2008). A large number of studies show that the unique curve model is suitable for the FCG in the Paris regime. In order to accurately predict the FCG in the near-threshold regime, Huang et al. (2009) proposed a relationship between the shape exponent at positive stress ratios and the SIF range. However, the applicability of this formula is limited and the determination of this formula is unclear, so it is necessary to provide a simple FCG model for the FCG prediction in the near-threshold and Paris regimes.
On the basis of the unique curve model proposed by Huang et al., the determination of the shape exponents in this model was given in this paper. It is difficult for the unique curve model to accurately predict the crack growth in the near-threshold regime. An improved unique curve model was presented to solve this problem, and the deduction of this model and the determination of the shape exponents in the present model were given. The FCG data of different materials obtained from the literature was analyzed to verify the proposed model. The shape exponents in the improved model at the negative stress ratios also were discussed in detail.
2 Fatigue crack growth model
2.1 The Paris model
The most prestigious and widely used FCG model is the Paris model, which has been accepted in many standards (BS7910, 2015; Hobbacher, 2016). The main idea of this model is that the relationship between the FCG rate in Paris regime and SIF range is linear in double logarithmic coordinates. It is expressed as:
$$\frac{\mathrm{d} a}{\mathrm{~d} N}=C(\Delta K)^m $$ (1) where C and m are material parameters at different stress ratios.
A log-log plot of FCG rate versus SIF range at different stress ratios is shown in Figure 2. It can be found from this figure that stress ratios have significant inference on the FCG in three regimes, the material parameter C at different stress ratios is disparate. Metal structures are subjected to alternating loads corresponding to different stress ratios during operation, if the Paris model is taken to accurately predict the FCG life of structures, C and m at different stress ratios will be required, which may be unrealistic for the engineering application.
 Figure 2 Crack growth rate curves at different stress ratios (Huang et al. 2009)
2.2 The unique curve model
To analyze the effect of stress ratio on the FCG, Huang et al. (Huang and Moan, 2007; Huang et al., 2008) proposed the unique curve model based on the models proposed by Walker (Walker, 1970) and Kujiawski (Kujawski, 2001b; Kujawski, 2001c). The main idea of this model is that the FCG rate curves at different stress ratios are equivalent to that corresponding to R = 0 by using equivalent SIF range as the driving force. So only the material parameters C, m, and ΔKth0 corresponding to R = 0 are required for the assessment of FCG life of structures. The formula of the unique curve model is listed below:
$$ \begin{gathered} \frac{\mathrm{d} a}{\mathrm{~d} N}=C\left[\left(\Delta K_{\text {eq } 0}\right)^m-\left(\Delta K_{\text {th } 0}\right)^m\right] \end{gathered} $$ (2) $$ \Delta K_{\text {eq } 0}=M_R \Delta K_R $$ (3) $$ M_R= \begin{cases}(1-R)^{-\beta_1} & (R <0) \\ (1-R)^{-\beta} & (0 \leqslant R <0.5) \\ \left(1.05-1.4 R+0.6 R^2\right)^{-\beta} & (0.5 \leqslant R<1)\end{cases} $$ (4) where C and m are Paris parameters corresponding to R = 0, ΔKeq0 is the equivalent SIF range corresponding to R = 0, ΔKth0 is the threshold of SIF range corresponding to R = 0, MR is the correction factor of stress ratio, β and β1 are sharp exponents depending on the material property and environment. If MR = 1, the unique curve model will degenerate into the Paris model.
Many experimental results show that the log-log plots of the FCG rate versus SIF range in the Paris regime at different stress ratios are approximatively parallel with each other; that is, C is related to stress ratio whereas m keeps fixed in the Paris regime, as shown in Figure 2. If the FCG rates at different stress ratios are the same, the equivalent SIF ranges corresponding to different stress ratios should meet the following relationship.
$$ M_{R_1} \Delta K_{R_1}=M_{R_2} \Delta K_{R_2}=\Delta K_{\text {eq } 0} $$ (5) The shape exponents in MR at the fixed stress ratio in Paris regime are independent of FCG rate, so at any FCG rate in Paris regime, the formulas of shape exponents β and β1 can be obtained as follows:
$$\beta_1=\log \left(\frac{\Delta K_{R_1}}{\Delta K_{R_2}}\right) / \log \left(\frac{1-R_1}{1-R_2}\right) \quad R_1, R_2 \leqslant 0 $$ (6) $$\beta= \begin{cases}\log \left(\frac{\Delta K_{R_1}}{\Delta K_{R_2}}\right) / \log \left(\frac{1-R_1}{1-R_2}\right) & 0 \leqslant R_1, R_2 <0.5 \\ \log \left(\frac{\Delta K_{R_1}}{\Delta K_{R_2}}\right) / \log \left(\frac{1.05-1.4 R_1+0.6 R_1^2}{1.05-1.4 R_2+0.6 R_2^2}\right) & 0.5 \leqslant R_1, R_2 <1 \\ \log \left(\frac{\Delta K_{R_1}}{\Delta K_{R_2}}\right) / \log \left(\frac{1-R_1}{1.05-1.4 R_2+0.6 R_2^2}\right) & 0 \leqslant R_1 <0.5, 0.5 \leqslant R_2 <1\end{cases} $$ (7) A log-log plot of the SIF range versus 1-R at negative stress ratios is built, and the slope of the curve is the shape exponent β1. A log-log plot of the SIF range versus 1-R or 1.05-1.4R+0.6R2 at positive stress ratios is built, the slope of this curve is the shape exponent β.
3 The improved unique curve model
3.1 Model deduction
As shown in Figure 2, the log-log plots of the FCG rate versus SIF range in the near-threshold regime at different stress ratios are not parallel with each other. The research shows that the shape exponent β at positive stress ratios decreases with the increase of the SIF range in the near-threshold regime and keeps constant in the Paris regime (Huang et al., 2009). The FCG rates of CrNiMoV (Guo et al., 2019) at R = 0.1-0.9 are taken as an example; Figure 3(a) is the original experimental data, and Figure 3(b) is the processed data based on the unique curve model, where the shape exponent in this model is β = 0.5 (Huang and Moan, 2007). It is interesting to note that the processed data at different stress ratios based on the unique curve model can collapse into a single curve corresponding to R = 0 in the Paris regime. In contrast, the unique curve model has a poor ability to predict the FCG in the near-threshold regime. The near-threshold FCG rate data at R = 0.5 and 0.9 below ΔKth0 are neglected in the unique curve model, which is precarious for the design and assessment of the FCG in metal structures, so the improved unique model is presented in this paper to better predict the FCG in the near-threshold regime.
 Figure 3 Fatigue crack growth rate of CrNiMoV
Firstly, the thresholds of SIF range at different stress ratios are equivalent to ΔKth0, and then the FCG rate can be expressed as follows:
$$\left(\frac{\mathrm{d} a}{\mathrm{~d} N}\right)_R=C_R^{\prime}\left(M_{R, \text { th }} \cdot \Delta K\right)^m $$ (8) Then, Eq. (8) is translated to Eq. (9) in double logarithmic coordinates,
$$ \log \left[\left(\frac{\mathrm{d} a}{\mathrm{~d} N}\right)_R\right]=\log C_R^{\prime}+m \log \left(M_{R, \text { th }} \cdot \Delta K\right) $$ (9) Finally, the log-log plots of the FCG rate versus equivalent near-threshold SIF range in the Paris regime at different stress ratios are approximatively parallel with each other, m is independent of stress ratio, so the FCG rate curves in the Paris regime at different stress ratios can be equivalent to the FCG rate curve corresponding to R = 0 by Eq. (10).
$$\log \left[\left(\frac{\mathrm{d} a}{\mathrm{~d} N}\right)_R\right]=\log \left(\frac{1}{A_R} C_0\right)+m_0 \log \left(M_{R, \text { th }} \cdot \Delta K\right) $$ (10) $$ \left(\frac{\mathrm{d} a}{\mathrm{~d} N}\right)_{R=0}=A_R\left(\frac{\mathrm{d} a}{\mathrm{~d} N}\right)_R $$ (11) Therefore, the improved unique curve model can be given as below:
$$ \left(\frac{\mathrm{d} a}{\mathrm{~d} N}\right)_R=\frac{1}{A_R} C_0\left[\left(M_{R, \mathrm{th}} \cdot \Delta K\right)^{m_0}-\left(\Delta K_{\mathrm{th} 0}\right)^{m_0}\right] $$ (12) $$ A_R= \begin{cases}(1-R)^{-\gamma_1} & (R<0) \\ (1-R)^{-\gamma} & (0 \leqslant R<0.5) \\ \left(1.05-1.4 R+0.6 R^2\right)^{-\gamma} & (0.5 \leqslant R<1)\end{cases} $$ (13) $$ M_{R, \text { th }}= \begin{cases}(1-R)^{-\beta_{1, \text { th }}} & (R<0) \\ (1-R)^{-\beta_{\text {th }}} & (0 \leqslant R<0.5) \\ \left(1.05-1.4 R+0.6 R^2\right)^{-\beta_{\text {th }}} & (0.5 \leqslant R<1)\end{cases} $$ (14) where AR is the correction factor of FCG rate considering stress ratio, MR, th is the correction factor of the threshold of SIF range considering stress ratio, γ, γ1 are shape exponents in AR, respectively, βth, β1, th are shape exponents in MR, th, respectively.
As shown in the dotted line in Figure 2, there is a transition point from the near-threshold regime to the Paris regime at a stress ratio, which is related to stress ratio and characteristic size of microstructures (Du et al., 2015; Zhuang et al., 2022). With the increase of stress ratio, the SIF range and FCG rate corresponding to the transition point will decrease. After the FCG rate curves were analyzed by the improved unique curve model, the transition points at different stress ratios can be equivalent to that corresponding to R = 0 in a narrow band. In addition, although the FCG rate curves in the Paris regime at different stress ratios are condensed to that corresponding to R = 0 by Equations (10) and (11), this method will have a weak influence on the FCG rate in the near-threshold regime as the FCG rate in the near-threshold regime increases dramatically with the slight increase of the SIF range.
The processed FCG data of CrNiMoV at different stress ratios based on the improved unique curve model are shown in Figure 3(c). It can be found that the transition points of CrNiMoV at different stress ratios are condensed to that corresponding to R = 0, and the FCG rate curves at different stress ratios in the near-threshold and Paris regimes are condensed to that corresponding to R = 0. The result indicates that the improved unique curve model has an excellent ability to predict the FCG in the near-threshold and Paris regimes at different stress ratios.
3.2 Determination of the shape exponents
The relationship between the threshold of SIF range at different stress ratios and the threshold of SIF range corresponding to R = 0 is given as follows (Huang et al. 2009):
$$\Delta K_{\text {th } 0}=M_{R, \text { th }} \Delta K_{\text {th }} $$ (15) Then according to Eqs. (6) and (7), the shape exponents βth, β1, th in MR, th can be drawn as follows:
$$\beta_{1, \text { th }}=\log \left(\frac{\Delta K_{\mathrm{th}, R_1}}{\Delta K_{\mathrm{th}, R_2}}\right) / \log \left(\frac{1-R_1}{1-R_2}\right) \quad R_1, R_2 \leqslant 0 $$ (16) $$\beta_{\mathrm{th}}= \begin{cases}\log \left(\frac{\Delta K_{\mathrm{th}, R_1}}{\Delta K_{\mathrm{th}, R_2}}\right) / \log \left(\frac{1-R_1}{1-R_2}\right) & 0 \leqslant R_1, R_2<0.5 \\ \log \left(\frac{\Delta K_{\mathrm{th}, R_1}}{\Delta K_{\mathrm{th}, R_2}}\right) / \log \left(\frac{1.05-1.4 R_1+0.6 R_1^2}{1.05-1.4 R_2+0.6 R_2^2}\right) & 0.5 \leqslant R_1, R_2<1 \\ \log \left(\frac{\Delta K_{\mathrm{th}, R_1}}{\Delta K_{\mathrm{th}, R_2}}\right) / \log \left(\frac{1-R_1}{1.05-1.4 R_2+0.6 R_2^2}\right) & 0 \leqslant R_1<0.5, 0.5 \leqslant R_2<1\end{cases} $$ (17) where ΔKth, R1 and ΔKth, R2 are thresholds of SIF range corresponding to R = R1 and R = R2, respectively.
The determination of shape exponents γ, γ1 in AR is similar to the determination of shape exponents βth, β1, th by replacing the thresholds of SIF range in Eqs. (16) and (17) with the crack growth rate. The shape exponents γ, γ1in AR are expressed as follows:
$$\gamma_1=\log \left[\frac{(\mathrm{d} a / \mathrm{d} N)_{R_1}}{(\mathrm{~d} a / \mathrm{d} N)_{R_2}}\right] / \log \left(\frac{1-R_1}{1-R_2}\right) \quad R_1, R_2 \leqslant 0 $$ (18) $$\gamma= \begin{cases}\log \left[\frac{(\mathrm{d} a / \mathrm{d} N)_{R_1}}{(\mathrm{~d} a / \mathrm{d} N)_{R_2}}\right] / \log \left(\frac{1-R_1}{1-R_2}\right) & 0 \leqslant R_1, R_2<0.5 \\ \log \left[\frac{(\mathrm{d} a / \mathrm{d} N)_{R_1}}{(\mathrm{~d} a / \mathrm{d} N)_{R_2}}\right] / \log \left(\frac{1.05-1.4 R_1+0.6 R_1^2}{1.05-1.4 R_2+0.6 R_2^2}\right) & 0.5 \leqslant R_1, R_2<1 \\ \log \left[\frac{(\mathrm{d} a / \mathrm{d} N)_{R_1}}{(\mathrm{~d} a / \mathrm{d} N)_{R_2}}\right] / \log \left(\frac{1-R_1}{1.05-1.4 R_2+0.6 R_2^2}\right) & 0 \leqslant R_1<0.5, 0.5 \leqslant R_2<1\end{cases} $$ (19) After the thresholds of SIF range at different stress ratios are equivalent to ΔKth0, as the shape exponents in AR are independent of the equivalent threshold SIF range MR, th ⋅ ΔK, the FCG rates at different stress ratios corresponding to the same equivalent threshold SIF range MR, th ⋅ ΔK in the Paris regime can be obtained, then the shape exponents γ, γ1 can be determined according to Eqs. (18) and (19).
If adequate FCG rate curves at different stress ratios in the near-threshold and Paris regimes are available, the loglog plots of the threshold of SIF range versus 1-R or 1.05- 1.4R+0.6R2 and FCG rate versus 1-R or 1.05-1.4R+0.6R2 can be established to determine the shape exponents in MR, th and AR. Otherwise, at least three sets of FCG rate data in the near-threshold and Paris regimes, one set of FCG rate at R > 0, one set of FCG rate at R = 0, and one set of FCG rate at R < 0, are required to determine the shape exponents in MR, th and AR according to Equations (16)–(19).
The determination of the shape exponents of CrNiMoV in Figure 3 is taken as an example. Firstly, the log-log plot of the threshold of SIF range versus 1-R or 1.05 - 1.4R+ 0.6R2 is established, as shown in Figure 4. The slope of this curve is 1, so the shape exponent in MR, th is βth = 1. Secondly, the log-log plot of the FCG rate versus the equivalent threshold SIF range MR, th ⋅ ΔK is established, as shown in Figure 5(a). Then, a vertical line is drawn at the equivalent threshold SIF range MR, th ⋅ ΔK = 30 MPa ⋅ m0.5 in Figure 5(a), which intersects with the FCG rate curves in the Paris regime at points A, B and C, respectively, and the FCG rates of points A, B, C are obtained. Finally, the log-log plot of the FCG rate versus 1-R or 1.05-1.4R+0.6R2 is established, as shown in Figure 5(b). The slope of this curve is 1.81, so the shape exponent in AR is γ = 1.81.
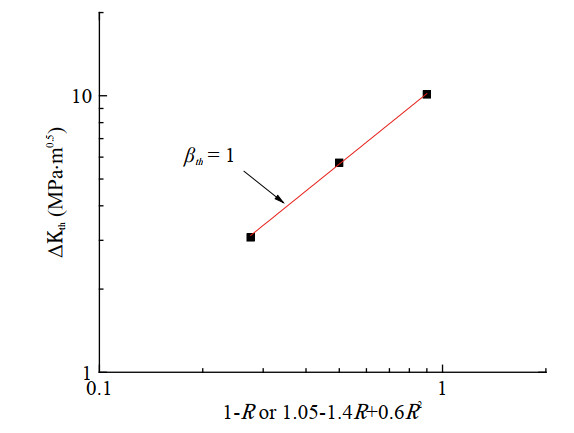 Figure 4 The relationship between threshold of SIF range and 1-R or 1.05-1.4R+0.6R2
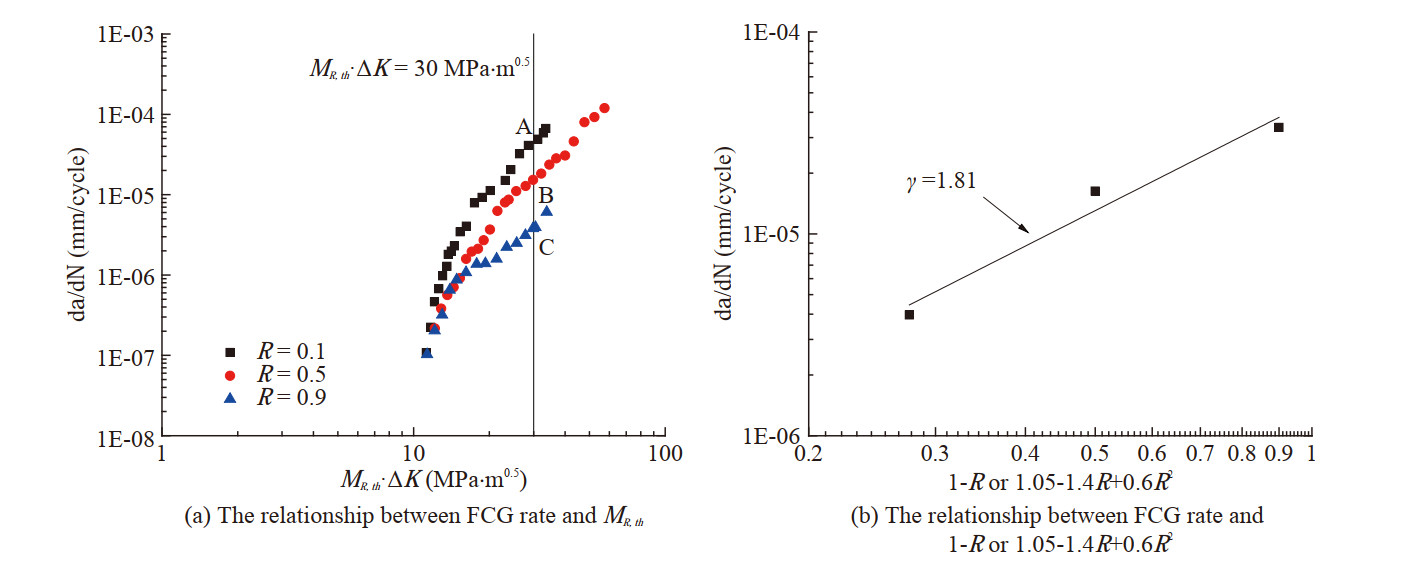 Figure 5 Determination of shape exponents in AR
4 Model validation
An improved unique curve model was proposed to consider the effect of stress ratio on the FCG in near-threshold and Paris regimes in Section 3, which can condense the FCG rate curves at different stress ratios to that corresponding to R = 0. When the assessment of FCG in metal structures is performed, only three sets of FCG rate data in the near-threshold and Paris regimes are required to determine the shape exponents in the improved unique curve model. It is of great significance for the accurate prediction of FCG in metal structures at different stress ratios in the absence of enough experimental data. In this section, the FCG rate data of various materials at different ratios are analyzed by the improved model to verify the validation of the present model.
The shape exponents of materials used in the improved model are determined by the method proposed in Section 3.2, as listed in Table 1. Figures 6~8 illustrate the application of the present model in aluminum alloy, the materials of aluminum alloy are Al 7075-T6 (Newman et al., 1999), Al 7075-T651 (Newman et al., 2014) and Al 6013 (Paris et al., 1999), respectively. The original experimental data of the three materials are shown in Figures 6(a)–8(a), and the corresponding processed data based on the present model are shown in Figures 6(b)–8(b). It can be found that the FCG rate curves of the three materials of aluminum alloy are condensed to that corresponding to R = 0. The FCG rate curves of Al 7075-T6 and Al 6013 in the near-threshold regime analyzed based on the improved unique curve model are less discrete than those analyzed based on the unique curve model (Huang and Moan, 2007). Therefore, the FCG rates of aluminum alloy at different stress ratios in the near-threshold and Paris regimes can be accurately predicted by the improved unique curve model, and the improved unique curve model can predict the near-threshold crack growth rate of aluminum alloy better than the unique curve model.
Table 1 Shape exponents of materialsMaterial β1, th βth γ1 γ Al 7075-T6 0.55 0.88 −0.50 1.06 Al 6013 0.96 0.80 −0.10 0.80 C45E 0.75 0.75 −0.45 1.65 S960 QL 0.84 0.33 −0.76 0.40 Al 7075-T651 0.40 0.04 25Cr2Ni2MoV 0.89 1.77 617B WM 0.70 1.40 CrMoV 1.00 1.80 X12CrMoWVNbN10-1-1 0.55 2.20  Figure 6 Fatigue crack growth rate of Al 7075-T6
 Figure 7 Fatigue crack growth rate of 7075-T651
 Figure 8 Fatigue crack growth rate of Al 6013
Figures 9~12 illustrate the application of the present model in turbine-rotor steel, the materials of turbine-rotor steel are 25Cr2Ni2MoV (Du et al., 2015), weld material (WM) of Inconel 617B (Li et al., 2021), and CrMoV (Bulloch, 1995) as well as X12CrMoWVNbN10-1-1 (Sun et al., 2020), respectively. The original experimental data of these materials are shown in Figures 9(a)–12(a), and the corresponding processed data based on the present model are shown in Figures 9(b)–12(b). It can be found that the FCG rate curves of the four materials are condensed to that corresponding to R = 0. Therefore, the FCG rates of turbine-rotor steel at different stress ratios in the near-threshold and Paris regimes can be accurately predicted by the improved unique curve model.
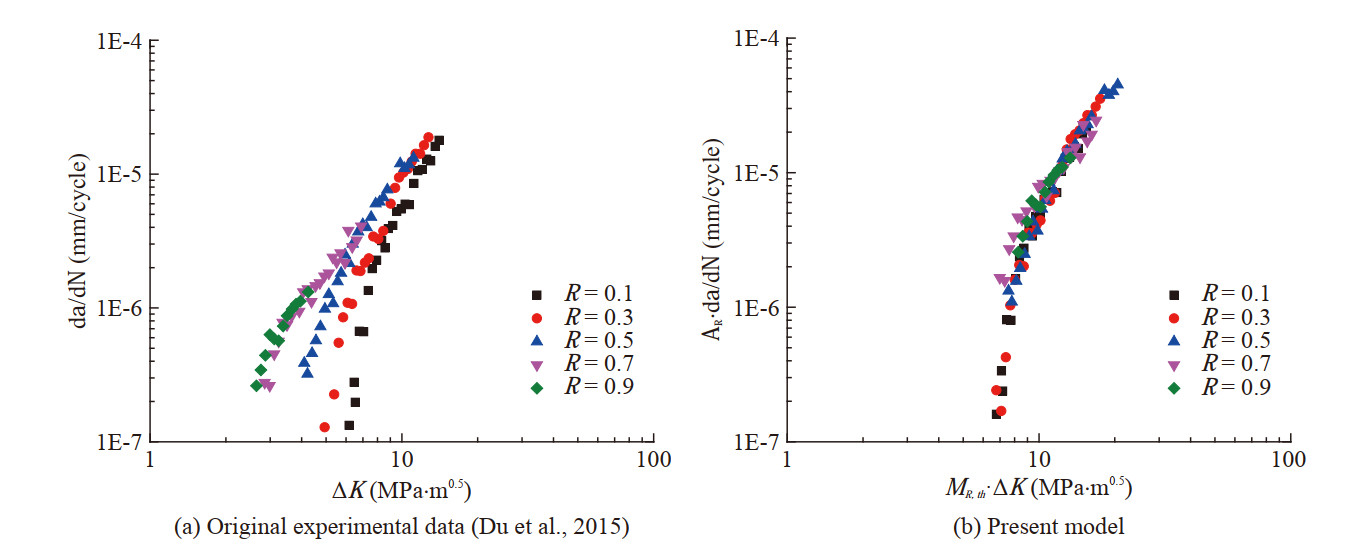 Figure 9 Fatigue crack growth rate of 25Cr2Ni2MoV
 Figure 10 Fatigue crack growth rate of WM of Inconel 617B
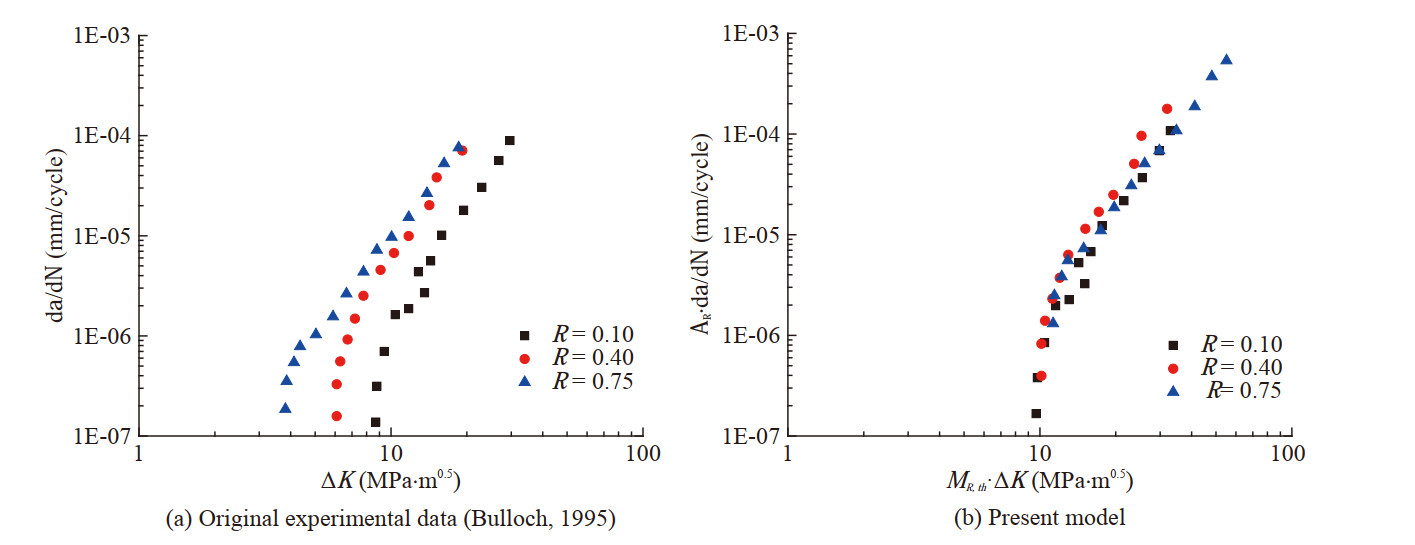 Figure 11 Fatigue crack growth rate of CrMoV
 Figure 12 Fatigue crack growth rate of X12CrMoWVNbN-10-1-1
Figures 13 and 14 illustrate the application of the present model in some typical steels, C45E (Steinbock and Gudladt 2011) is a kind of common carbon steel, and S960 QL (Kucharczyk et al. 2018) is a kind of high-strength alloy steel. The original experimental data of the two materials are shown in Figures 13(a) and 14(a), and the corresponding processed data based on the present model are shown in Figures 13(b) and 14(b). It can be found that the FCG rate curves of the two materials are condensed to that corresponding to R = 0. Therefore, the FCG rates of the two steels at different stress ratios in the near-threshold and Paris regimes can be accurately predicted by the improved unique curve model.
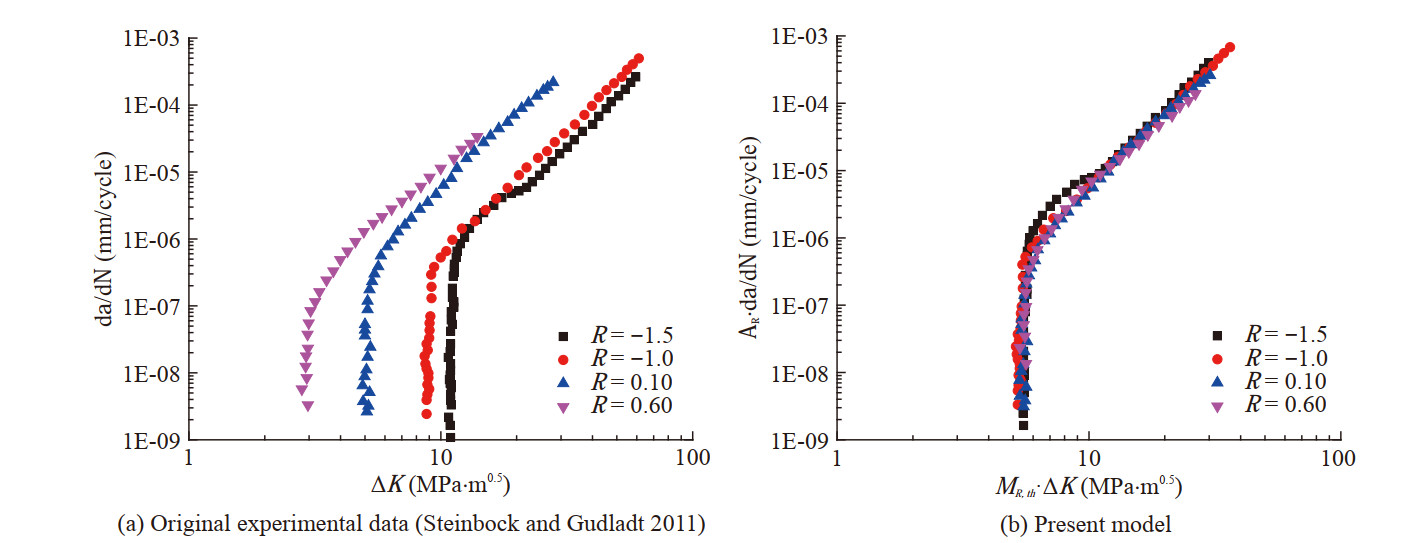 Figure 13 Fatigue crack growth rate of C45E
5 Discussion of the shape exponents at negative stress ratios
It can be found in Section 4 that the shape exponent γ1 in the improved curve model at negative stress ratios is less than 0, indicating that the FCG rate curves at negative stress ratios are higher than that corresponding to R = 0 at the same equivalent threshold SIF range. The transition points at negative stress ratios are higher than that corresponding to R = 0, which is consistent with the law present ed by the dashed line between the near-threshold regime and the Paris regime in Figure 2. It is difficult to obtain the near-threshold FCG rate data at negative stress ratios due to the crack closure (Zhang et al., 2019). To reduce the requirement of the near-threshold FCG rate data at negative stress ratios, the applicability of the shape exponent at negative stress ratios in the unique curve model to the improved model is discussed in this section.
The aluminum alloy Al6013 (Paris et al., 1999) and carbon steel C45E (Steinbock and Gudladt 2011) are taken as an example, the shape exponents at positive stress ratios remained constant, the shape exponents γ1 = 0 and β1, th = β1 at negative stress ratios. The improved model degenerates into the unique curve model at negative stress ratios. The shape exponents of the two materials are listed in Table 2. The processed data of the two materials based on the improved model using the shape exponents in Table 2 are illustrated in Figure 15. The processed data in Figures 15(a) and (b) are compared with those in Figure 8(b) and Figure 13(b), and the result shows that the FCG rate data in the near-threshold regime analyzed by the shape exponent at negative stress ratios in the unique curve model is smaller than that analyzed by the shape exponent at negative stress ratios determined by Section 3.2. However, the FCG rate data in the nearthreshold regime analyzed by the shape exponent at negative stress ratios in the unique curve model are more conservative than that corresponding to R = 0, indicating that the applicability of the shape exponent at negative stress ratios in the unique curve model to the improved model is reasonable.
Table 2 Shape exponents of materials at negative stress ratiosMaterial β1, th βth γ1 γ Al 6013 0.86 0.80 0 0.80 C45E 0.70 0.75 0 1.65 EA4T 0.95 0.85 0 2.00 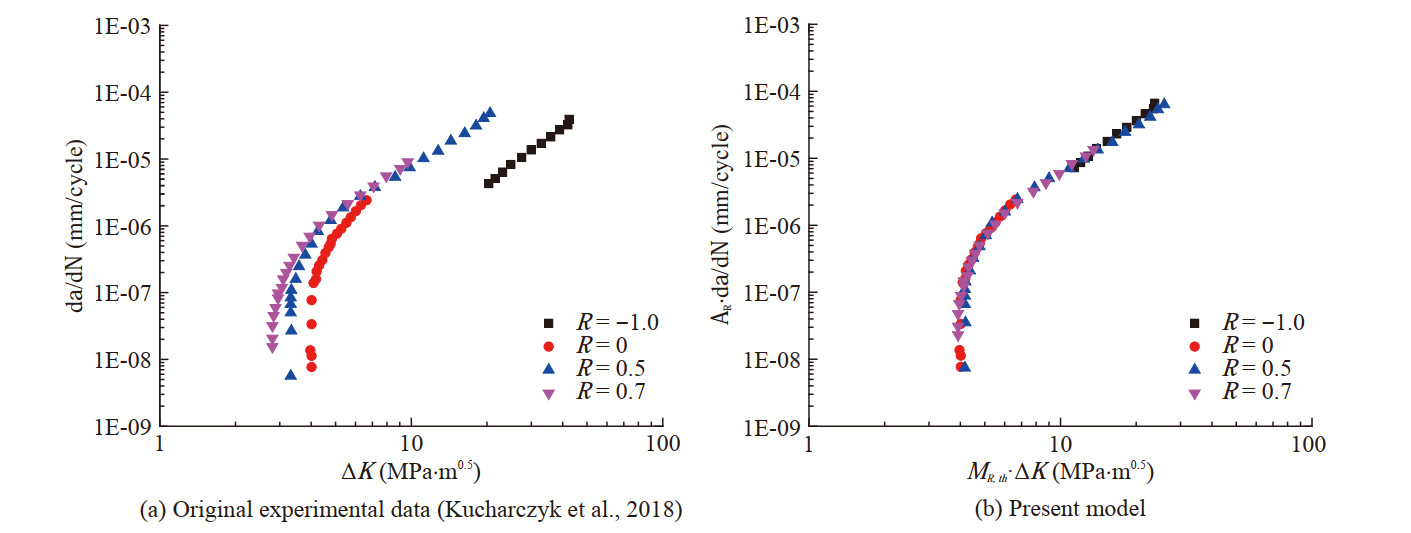 Figure 14 Fatigue crack growth rate of S960QL
 Figure 15 Fatigue crack growth rate based on the present model by using shape exponent at negative stress ratio
The FCG rates of low-carbon alloy steel EA4T (Maierhofer et al., 2020) are also taken as an example, R = -2, -1.5, -1, -0.5, 0.1, 0.7, as shown in Figure 16. The shape exponent in the unique curve model is adopted in the improved model at negative stress ratios, as listed in Table 2. Figure 16(b) illustrates that the FCG rate curves of EA4T are condensed to that corresponding to R = 0. The near-threshold and Paris FCG rate data at negative stress ratios can be predicted by the shape exponent in the unique curve model. So, it is noted that the shape exponent in the unique curve model can be directly adopted in the improved model, and at least one set of the Paris FCG rate is required to determine the shape exponent at negative stress ratios in the improved model.
 Figure 16 Fatigue crack growth rate of EA4T
6 Conclusions
Considering that the existing models have a weak ability in the prediction of FCG in the near-threshold regime, an improved model based on the unique curve model is proposed. The improved unique curve model has been verified by analyzing the FCG rate curves of various materials at different stress ratios extracted from literature. The improved model can condense the FCG rate curves at different stress ratios in the near-threshold and Paris regimes to that corresponding to R = 0, which may be useful for the FCG prediction of metal structures in engineering applications.
To accurately predict the near-threshold and Paris FCG in the metal structures, at least three sets of FCG rate data are required to determine the shape exponents in the improved model.
The method to determine the model shape exponents is also suitable for determining the shape exponents of the unique curve model. The shape exponents at negative stress ratios in the improved model are discussed, indicating that the shape exponent at negative stress ratios in the unique curve model can be directly adopted in the improved model.
-
Figure 1 FCG phenomenon of metal structures
Figure 2 Crack growth rate curves at different stress ratios (Huang et al. 2009)
Figure 3 Fatigue crack growth rate of CrNiMoV
Figure 4 The relationship between threshold of SIF range and 1-R or 1.05-1.4R+0.6R2
Figure 5 Determination of shape exponents in AR
Figure 6 Fatigue crack growth rate of Al 7075-T6
Figure 7 Fatigue crack growth rate of 7075-T651
Figure 8 Fatigue crack growth rate of Al 6013
Figure 9 Fatigue crack growth rate of 25Cr2Ni2MoV
Figure 10 Fatigue crack growth rate of WM of Inconel 617B
Figure 11 Fatigue crack growth rate of CrMoV
Figure 12 Fatigue crack growth rate of X12CrMoWVNbN-10-1-1
Figure 13 Fatigue crack growth rate of C45E
Figure 14 Fatigue crack growth rate of S960QL
Figure 15 Fatigue crack growth rate based on the present model by using shape exponent at negative stress ratio
Figure 16 Fatigue crack growth rate of EA4T
Table 1 Shape exponents of materials
Material β1, th βth γ1 γ Al 7075-T6 0.55 0.88 −0.50 1.06 Al 6013 0.96 0.80 −0.10 0.80 C45E 0.75 0.75 −0.45 1.65 S960 QL 0.84 0.33 −0.76 0.40 Al 7075-T651 0.40 0.04 25Cr2Ni2MoV 0.89 1.77 617B WM 0.70 1.40 CrMoV 1.00 1.80 X12CrMoWVNbN10-1-1 0.55 2.20 Table 2 Shape exponents of materials at negative stress ratios
Material β1, th βth γ1 γ Al 6013 0.86 0.80 0 0.80 C45E 0.70 0.75 0 1.65 EA4T 0.95 0.85 0 2.00 -
Askar MB, Havigh SN (2017) The Process of Fatigue Analysis on Fixed Metal Offshore Platforms. Mar Sci 7(1): 10-16 Barter SA, Molent L (2013) Service fatigue cracking in an aircraft bulkhead exposed to a corrosive environment. Eng Fail Anal 34: 181-188. https://doi.org/10.1016/j.engfailanal.2013.07.036 BS7910 (2015) Guide to methods for assessing the acceptability of flaws in metallic structures. BSI Stand Publ 3(1) Bulloch JH (1995) Near threshold fatigue crack propagation behaviour of CrMoV turbine steel. Theor Appl Fract Mech 23(1): 89-101. https://doi.org/10.1016/0167-8442(95)00007-2 Ding J, Hall R, Byrne J (2005) Effects of stress ratio and temperature on fatigue crack growth in a Ti-6Al-4V alloy. In: International Journal of Fatigue. pp 1551-1558 Du YN, Zhu ML, Xuan FZ (2015) Transitional behavior of fatigue crack growth in welded joint of 25Cr2Ni2MoV steel. Eng Fract Mech 144: 1-15. https://doi.org/10.1016/j.engfracmech.2015.06.065 Elber W (1970) Fatigue crack closure under cyclic tension. Eng Fract Mech 2(1): 37-44. https://doi.org/10.1016/0013-7944(70)90028-7 Forman RG, Kearney VE, Engle RM (1967) Numerical analysis of crack propagation in cyclic-loaded structures. J Fluids Eng Trans ASME 89(3): 459-463. https://doi.org/10.1115/1.3609637 Guo X, Zhao L, Liu X, Lu F (2019) Investigation on the resistance to fatigue crack growth for weld metals with different Ti addition in near-threshold regime. Int J Fatigue 120: 1-11. https://doi.org/10.1016/j.ijfatigue.2018.10.018 Haghani R, Al-Emrani M, Heshmati M (2012) Fatigue-prone details in steel bridges. Buildings 2(4): 456-476. https://doi.org/10.3390/buildings2040456 Hobbacher A (2016) Recommendations for fatigue design of welded joints and components. International Institute of Welding Huang X, Moan T (2007) Improved modeling of the effect of R-ratio on crack growth rate. Int J Fatigue 29(4): 591-602. https://doi.org/10.1016/j.ijfatigue.2006.07.014 Huang X, Moan T, Cui W (2009) A unique crack growth rate curve method for fatigue life prediction of steel structures. Ships Offshore Struct 4(2): 165-173. https://doi.org/10.1080/17445300902732370 Huang X, Torgeir M, Cui W (2008) An engineering model of fatigue crack growth under variable amplitude loading. Int J Fatigue 30(1): 2-10. https://doi.org/10.1016/j.ijfatigue.2007.03.004 Kucharczyk P, Madia M, Zerbst U, Schork B, Gerwien P, Münstermann S (2018) Fracture-mechanics based prediction of the fatigue strength of weldments. Material aspects. Eng Fract Mech 198: 79-102. https://doi.org/10.1016/j.engfracmech.2017.09.010 Kujawski D (2001a) Enhanced model of partial crack closure for correlation of R-ratio effects in aluminum alloys. Int J Fatigue 23(2): 95-102. https://doi.org/10.1016/S0142-1123(00)00085-2 Kujawski D (2001b) A fatigue crack driving force parameter with load ratio effects. Int J Fatigue 23(SUPPL. 1). https://doi.org/10.1016/s0142-1123(01)00158-x Kujawski D (2001c) A new (ΔK+Kmax)0.5 driving force parameter for crack growth in aluminum alloys. Int J Fatigue 23(8): 733-740. https://doi.org/10.1016/S0142-1123(01)00023-8 Kumar A, Singh SB, Ray KK (2013) Fatigue crack growth behaviour of ferrite-bainite dual phase steels. Mater Sci Technol (United Kingdom) 29(12): 1507-1512. https://doi.org/10.1179/174328408X282083 Li HF, Yang SP, Zhang P, Liu YQ, Wang B, Zhang ZF (2022) Materialindependent stress ratio effect on the fatigue crack growth behavior. Eng Fract Mech 259. https://doi.org/10.1016/j.engfracmech.2021.108116 Li S, Rui SS, Li K, Hu M, Zhang X, Li X, Cai Z, Pan J (2021) A modification to the two driving forces model for fatigue threshold prediction. Int J Fatigue 149. https://doi.org/10.1016/j.ijfatigue.2021.106259 Maierhofer J, Gänser HP, Simunek D, Leitner M, Pippan R, Luke M (2020) Fatigue crack growth model including load sequence effects-Model development and calibration for railway axle steels. Int J Fatigue 132. https://doi.org/10.1016/j.ijfatigue.2019.105377 Mao W, Li Z, Ringsberg JW, Rychlik I (2012) Application of a shiprouting fatigue model to case studies of 2800 TEU and 4400 TEU container vessels. Proc Inst Mech Eng Part M J Eng Marit Environ 226(3): 222-234. https://doi.org/10.1177/1475090212436606 Newman JC, Anagnostou EL, Rusk D (2014) Fatigue and crack-growth analyses on 7075-T651 aluminum alloy coupons under constantand variable-amplitude loading. Int J Fatigue 62: 133-143. https://doi.org/10.1016/j.ijfatigue.2013.04.020 Newman JC, Phillips EP, Everett R a (1999) Fatigue Analyses Under Constant- and Variable-Amplitude Loading Using Small-Crack Theory. Technology Paris P, Erdogan F (1963) A critical analysis of crack propagation laws. J Fluids Eng Trans ASME 85(4): 528-533. https://doi.org/10.1115/1.3656900 Paris PC, Tada H (2002) Near threshold fatigue crack growth versus long finite life. Fatigue Fract Eng Mater Struct 25(8-9): 727-733. https://doi.org/10.1046/j.1460-2695.2002.00560.x Paris PC, Tada H, Donald JK (1999) Service load fatigue damage-A historical perspective. Int. J. Fatigue 21 Pippan R, Hohenwarter A (2017) Fatigue crack closure: a review of the physical phenomena. Fatigue Fract. Eng. Mater. Struct. 40: 471-495 Ritchie RO (1979) Near-threshold fatigue-crack propagation in steels. Int Met Rev 24(1): 205-228. https://doi.org/10.1179/imtr.1979.24.1.205 Ritchie RO (1977) Near-threshold fatigue crack propagation in ultrahigh strength steel: Influence of load ratio and cyclic strength. J Eng Mater Technol Trans ASME 99(3): 195-204. https://doi.org/10.1115/1.3443519 Sadananda K VAK (1995) Fracture Mechanics: 25th Volume. ASTM International Skorupa M, Machniewicz T, Skorupa A (2007) Applicability of the ASTM compliance offset method to determine crack closure levels for structural steel. Int J Fatigue 29(8): 1434-1451. https://doi.org/10.1016/j.ijfatigue.2006.11.004 Steinbock J, Gudladt HJ (2011) More insights into fatigue crack growth from experiments on steels and aluminium alloys-Thresholds. Mater Sci Eng A 528(3): 1296-1301. https://doi.org/10.1016/j.msea.2010.10.005 Sun Q, Li K, Li X, Rui SS, Cai Z, Pan J (2020) Near-threshold fatigue crack growth behavior of 10% Cr martensitic steel welded joint with 9% Cr weld metal in high temperature air. Int J Fatigue 137. https://doi.org/10.1016/j.ijfatigue.2020.105650 Tazoe K, Tanaka H, Oka M, Yagawa G (2020) Near-threshold fatigue crack propagation without oxide-induced crack closure. Sci Rep 10(1). https://doi.org/10.1038/s41598-020-64915-3 Walker K (1970) The Effect of Stress Ratio During Crack Propagation and Fatigue for 2024-T3 and 7075-T6 Aluminum, Effects of Environment and Complex Load History on Fatigue Life. ASTM STP 462, Am Soc Test Mater: 1-14 Zhan W, Lu N, Zhang C (2014) A new approximate model for the R-ratio effect on fatigue crack growth rate.Eng Fract Mech 119:85-96. https://doi.org/10.1016/j.engfracmech.2014.02.010 Zhang P, Xie L qi, Zhou C yu, He X hua (2020) Experimental and numerical investigation on fatigue crack growth behavior of commercial pure titanium under I-II mixed mode loading at negative load ratios.Int J Fatigue 138. https://doi.org/10.1016/j.ijfatigue.2020.105700 Zhang P, Xie L qi, Zhou C yu, Li J, He X hua (2019) Two new models of fatigue crack growth rate based on driving force parameter and crack closure method at negative load ratios.Theor Appl Fract Mech 103. https://doi.org/10.1016/j.tafmec.2019.102315 Zhu ML, Xuan FZ, Tu ST (2015) Effect of load ratio on fatigue crack growth in the near-threshold regime: A literature review, and a combined crack closure and driving force approach.Eng Fract Mech 141:57-77. https://doi.org/10.1016/j.engfracmech.2015.05.005 Zhuang B Bin, Du YN, Weng S, Zhu ML, Xuan FZ (2022) On the significance of transition behavior in fatigue crack growth.Eng Fract Mech 262. https://doi.org/10.1016/j.engfracmech.2022.108271
