Optimal Design of the Superstructure of an Offshore Tourism Platform by Using Numerical Simulation
https://doi.org/10.1007/s11804-022-00297-4
-
Abstract
This paper aims to reduce the wind resistance of the self-designed offshore tourism platform by optimizing its superstructure, and a transparent shape design is finally suggested. A numerical simulation was performed to calculate the wind load on the platform to test the effect of wind resistance reduction. Two original scale models (sealed and transparent) were established in accordance with the design requirements. The numerical simulation uses the FLUENT software combined with the built-in self-compiled user-defined function (UDF). The stochastic wind was also applied on the basis of the Davenport wind spectrum. The detached eddy simulation (DES) model was used to solve the NS equation. Numerical simulation results show that the wind resistance reduction for the transparent shape model is subtle in the horizontal direction but can effectively reduce the drag force and moment in the vertical direction. Moreover, the force variation of the transparent shape model under different wind attack angles decreases, which reduces the wind load fluctuations.Article Highlights• Davenport spectrum was applied to generate the random fluctuating wind;• Drag force in three directions and wind tilt moment along the critical axis was obtained;• Time-averaged results for the two design schemes were compared and proved that the transparent design could effectively reduce wind resistance. -
1 Introduction
Researchers have investigated the offshore self-elevating platform loaded by natural factors, such as wind, current, and waves (Cassidy, 2002; Bienen and Cassidy, 2006). Among all these factors, platforms are most affected by the wind load, which is the most important control load in structural design (Cao et al, 2009). Calculation formulas are based on ideal conditions despite clarifications made by various classification societies (DNV, 2007; Shipping, 2008; CSS, 2020). In practical situations, the influence of the shading effect, turbulence, and boundary layer will cause differences in the calculation. Hence, wind load analysis is vital for the development of offshore platforms.
Common methods used worldwide to study wind load on offshore platforms currently include field observation, numerical simulation, and wind tunnel testing. However, the development of offshore engineering in China started late (Davenport and Hambly, 1984; Sahin and Aybar, 1985; Gomathinayagam, 2000). Thus, wind tunnel testing and numerical simulation are the main approaches in China due to the lack of relevant field data from offshore platforms. However, the wind tunnel test has the disadvantage of high cost, which is unsuitable for the early design stage. This disadvantage could be properly solved by the computational fluid dynamics (CFD) method.
The development of numerical simulation facilitated the utilization of this technique in many fields, such as ship design and manufacture and structural wind engineering. However, its application in the field of marine engineering is not yet widespread. On the subject of wind resistance on offshore platforms, Zhu et al. (2009) first used the SST k-ω model to simulate and calculate the overall wind load of a semisubmersible platform numerically and compared it with wind tunnel experiments. The calculation results were consistent. Lin et al. (2012) used the CFD method to conduct the numerical simulation calculation of a jack-up drilling platform and compared the calculation results with wind tunnel experiments and industry standards. They concluded that the numerical simulation results were consistent with the wind tunnel experiments and the accuracy was better than that of the industry standards. Gu et al. (2016) attempted to optimize the layout of the superstructure of a semisubmersible drilling service platform and introduced the random fluctuating wind in numerical simulation to calculate the wind loads of the three design schemes under different wind attack angles. Tan et al. (2014) performed the following: took an offshore drilling platform as an object, applied classification society rules, numerical simulation, wind tunnel test, and a civil engineering method to the wind load calculation on platforms, and comprehensively compared the differences between these methods.
The self-designed jack-up offshore tourism platform is studied in this paper. The mature marine engineering platform self-elevating technology is applied to provide tourists with a variety of marine leisure and entertainment projects to meet the growing demand for entertainment. Compared with the offshore engineering platform, the leisure tourism platform focuses on the tourist experience and aesthetics. The self-designed platform studied in this article is shown in Figure 1, and the overall dimensions of this platform are 75.26 m × 84.74 m × 35.50 m. The superstructure of the platform is similar to an ellipsoid and has three permeable layers. This design aims to optimize the wind load of the entire platform under self-existing conditions in the ocean while sustaining visual aesthetics and maintaining the stability of the platform under strong winds from different directions.
 Figure 1 Sketch of the self-designed offshore tourism platform
The offshore tourism platform discussed in this paper is a facility with marine engineering functions and architectural design aesthetics. The numerical simulation research of wind loads on the platform is all based on the above references. Meanwhile, this article applied the same-size model with the superstructure completely closed for comparison to verify the effect of wind resistance reduction of the transparent model. Schematic of the transparent and sealed models are shown in Figure 2. Moreover, using the numerical simulation method for conducting the comparative analysis of the wind load provides the basis for the subsequent detailed design.
 Figure 2 Schematic of the transparent and sealed models
2 Methodology
2.1 Generation of random pulsating wind
The downwind wind velocity in the time domain usually comprises two parts: steady and fluctuating winds. The wind acting on the superstructure of marine platforms in reality also comprises the two aforementioned parts, and the wind velocity V (z, t) at any given time and location could be represented as a stationary Gaussian stochastic process.
$$V(z, t)=v(z)+v(z, t)$$ (1) where v(z) is the steady wind component. Referring to the article (Gu et al. 2016), the value of 51.44 m/s is taken as the minimum design wind speed in self-existing conditions for deep sea ocean platforms and V (z, t) is the fluctuating wind component, which is generated by the harmonic superposition method according to the Davenport wind spectrum.
The Davenport wind spectrum obtained more than 90 strong wind records based on actual measurements at different locations and heights in the world. The turbulence integration scale L in the horizontal wind spectrum was constant along the height, and the constant value was taken as 120 0. The pulsating wind speed spectrum was taken as the average of the measured values from the ground. The empirical mathematical expression of the Davenport wind spectrum in the longitudinal direction is shown as follows:
$$S_v(f)=\frac{K U_0^2}{f} \frac{4 X^2}{\left(1+X^2\right)^{4 / 3}}$$ (2) where Sv (f) is the pulsating wind power spectrum (m2/s) and K is the roughness factor. According to the MARINTEK user guidebook, the typical value of K is taken as 0.002 5 for sea state; f is the frequency (Hz) of the fluctuating wind, f = ω/2π; U0 is the average wind speed at standard height (10 m above sea level), and its value in this article is taken as 20 m/s; X is the turbulence integral scale factor, X = 1 200 (f/U02).
The pulsating wind cannot be determined by an analytical method, and its features can only be understood through statistical characteristics from vast amounts of experimental data. In the numerical simulation, the random pulsating wind could be approximated by a related random function considering the pulsating wind as a stable and ergodic stochastic process. The wind generated in a numerical simulation should have similar statistical characteristics and power spectrum compared to reality. Only the impact of horizontal wind load is considered due to the low main body of the offshore platform in this article. The harmonic superposition method was first introduced by Shinozuka and Deodatis (1991). He stated that the random fluctuating wind could be simulated with a series of simple harmonic superpositions with specific amplitude and random phase, wherein the amplitude is determined by the power spectral density function. The expression of the weighted amplitude harmonic superposition method is shown in Equation 3:
$$g(t)=\sum\limits_{j=1}^N \sqrt{2 S_v\left(\omega_j\right) \Delta \omega} \cos \left(\omega_j t+\phi_j\right)$$ (3) where N is a sufficiently large positive integer and is taken as 1024 in this article; Δω is the frequency difference of adjacent harmonical waves, Δω = ωu/N; Sv (ωj) is the power spectral density of fluctuating wind; ωj is the angular frequency of the jth harmonical waves superimposed as the fluctuating wind; and ϕj is the independently, randomly, and uniformly distributed phase angle in the domain of [0-2π].
The number of harmonics j cannot be taken infinitely during calculation using Equation 3. An infinite integer will normally be taken within an allowable error range of ε.
$$\int_0^{\omega_u} S(\omega) \mathrm{d} \omega=(1-\varepsilon) \int_0^{\infty} S(\omega) \mathrm{d} \omega$$ (4) The allowable error range ε in this article is 0.015, and the effective cutoff frequency could then be calculated as ωu = 20π.
On the basis of the average wind speed at 10 m above the mean sea level, U0 = 20 m/s, the zero-mean fluctuating component of random pulsating wind within 100 s could be generated in MATLAB, which is illustrated in Figure 3.
 Figure 3 Random pulsating wind generated by MATLAB within 100 s
2.2 Calculation condition
The coordinates and wind attack angles of the offshore tourism platform are shown in Figure 4. The part under water is disregarded, and only the wind load on the platform superstructure is considered in this article. The calculating conditions of the numerical simulation are illustrated in Table 1.
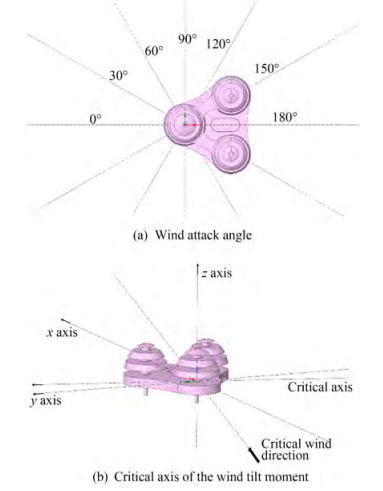 Figure 4 Schematic of wind attack angle and coordinate axisTable 1 Calculating conditions of wind load analysis on the platform
(°) Inclination Domain of wind angle Wind angle interval 0 0-180 30 Owing to the plane shape of the model, which is approximately an equilateral triangle, the range of the wind attack angle in this article is 0°–180°, and the calculation interval is 30° considering the symmetry of the model and the calculation cost.
From the previous chapter, the Reynolds number could be calculated on the basis of the dimension and inflow speed. Reynolds number is defined as follows (Sommerfeld, 1908):
$$R e=\frac{\rho u L}{\mu}$$ (5) where ρ is the density of the fluid (kg/m3), u is the flow speed (m/s), L is a characteristic linear dimension (m), and μ is the dynamic viscosity of the fluid (kg/m∙s).
The fluid domain is set filled with air with a density of 1.225 kg/m3 and dynamic viscosity of 1.789 4e−05 kg/m∙s. Considering the fluctuation of pulsating wind, the Reynolds number of this simulation falls in the range of 2.0e+08 –4.0e+08, which is in the ultra-supercritical domain (Architects and OC-1, 1988). The turbulence intensity can then be calculated on the basis of the Reynolds number, as shown in Equation 6. The value falls in the range of 0.013 5–0.014 7.
$$I=0.16 R e^{-1 / 8}$$ (6) 2.3 Computational domain and boundary conditions
The impact of wind on structures has a certain range of influence. Therefore, considering the calculation cost and the accuracy requirements of numerical simulation, a limited three-dimensional computational domain should be provided. In the numerical simulation, the spaces around the platform, especially the windward and wake areas, have a remarkably influence on the calculation accuracy of the wind load on buildings. Sufficient space should be provided for these regions when setting the computational domain. Referring to industry specifications for building wind simulation (Blocken, 2015) and relevant literature (Gu et al., 2016), the computational domain is taken as 500 m × 300 m × 200 m, which satisfies the distance requirement between the model and the inlet boundary (5 H) and the outlet boundary (10 H), where H is the height of the model. Meanwhile, considering the need to study the wind loads from different wind directions, the platform model must be rotated accordingly. Therefore, the platform model is placed on approximately 2/5 of the entire fluid domain, which has a centroid of 200 m from the inlet boundary. The boundary condition settings of the fluid domain are illustrated below.
1) The inlet boundary adopts a velocity inlet, which is generated with the help of compiled UDF. The steady component is based on the minimum self-existing design wind speed v(z) = 51.44 m/s, whereas the pulsating component is derived from the Davenport spectrum using the harmonic superposition method.
2) The outlet boundary adopts the pressure outlet setting, and all the fluids flow out of this boundary.
3) The upper and side boundaries adopt a symmetry setting, avoiding the influence of the wall effect; thus, the vertical component of the wall is zero.
4) The platform and water surfaces adopt a smooth wall setting, and fluids flow through the wall without slippage.
2.4 Meshing
The building model is a special-shaped structure and is relatively complex. Therefore, this article uses unstructured meshing, and the internal grids are tetrahedrons. Moreover, additional control was added to the default mesh before solving to improve the mesh quality. In this article, local sizing adjustments were applied to cells in the computational domain near the platform model and the vortex core region. Meanwhile, loose grids are used in spaces far from the core regions considering the computing power and cost. Global element size is used to control the overall number of mesh elements. The global element size is set to be 5 m, while the element size for dense areas is generally 1 m. Moreover, the value of the overall element size could reach 0.8 m for sharp edges and components of small sizes. The computational domain of the offshore tourism platform is meshed with around 3 million nodes and 1.6 million elements, as shown in Figure 6.
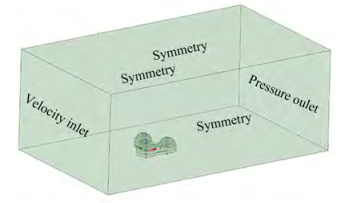 Figure 5 Boundary condition settings of the computational domain
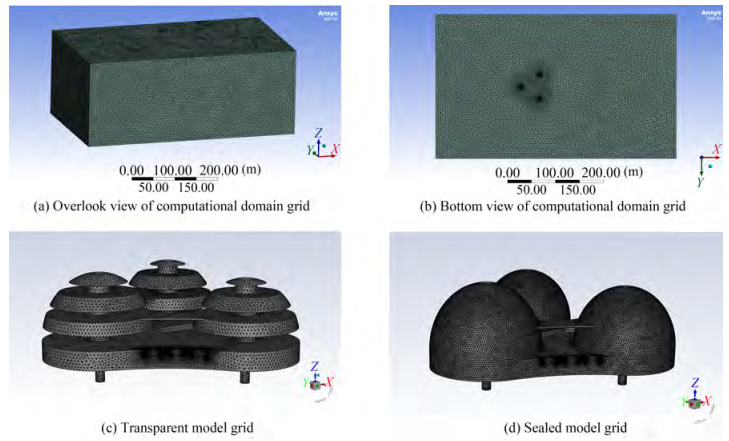 Figure 6 Schematic of mesh division for the two design schemes
Good mesh quality is the primary condition to ensure accurate analysis results. The result is still not necessarily reliable despite successful meshing but with poor quality. Mesh quality is normally evaluated by some parameters. Skewness and orthogonal quality were chosen as the criteria in this article. Fatchurrohman and Chia (2017) demonstrated the relationship between mesh quality and these parameters. Through suitable meshing methods, the average values of skewness and orthogonal quality reached 0.25 and 0.75, respectively, which demonstrated good mesh quality according to Table 2.
Table 2 Relationship between skewness, orthogonal quality, and mesh quality (Fatchurrohman, 2017)Skewness Orthogonal Quality Excellent Very good Good Acceptable Bad Bad Acceptable Good Very good Excellent 0-0.25 0.25-0.50 0.50-0.80 0.80-0.94 0.95-0.97 0.001-0.014 0.15-0.20 0.20-0.69 0.70-0.95 0.95-1.00 2.5 Settings of turbulence model and solvers
The turbulence model used in this article is DES. The main feature of DES lies in using the Reynolds-averaged Navier – Stokes (RANS) model inside the boundary layer and the large eddy simulation (LES) method in areas where a large amount of separation occurs (Spalart, 1997). DES combines the advantages of RANS and LES, which not only ensures accuracy at separation areas but also reduces the required number of mesh elements (Spalart, 2009). An unsteady viscous solver is used in mesh calculation, and the SIMPLEC method is utilized in the pressure – velocity compilation. The second-order precision discrete format is adopted to ensure the accuracy of results. The time step is set to be 0.05 s and the total run time is 100 s. However, the linear discrete format could be used at the initial calculation steps to accelerate the convergence rate.
2.6 Convergence analysis
In addition to meshing, computational convergence is another essential consideration that could affect the accuracy of the results. Two normally used methods of judging convergence are applied in this article based on the Fluent User Guidebook (Matsson, 2021).
The first method involves tracking the residual records of relevant physical variables, such as continuity, velocity, k, and omega, for the DES model. Except for the energy term, the default convergence scale in FLUENT is set to 1e−3, which indicates that the computation is considered converged when the residual values for all variables fall below 1e−3. Figure 7 shows the residual records for the first five calculation steps. The figure reveals that computation is converged when all variables fall below the convergence scale.
 Figure 7 Residual records for the first five steps
The first step takes additional iterations to reach convergence due to the initialization, which may not obtain an ideal prediction. However, the iteration times are quickly shortened as the calculation continues.
Moreover, the mass conservation of the system was checked to validate the convergence. Table 3 shows that the mass flow rates of the inlet and outlet boundaries for both design schemes are calculated. The difference between the mass flow inside and outside is substantially less than 0.01, which also proves the convergence of the result.
Table 3 Mass flow rate of the inlet and outlet boundariesMass flow rate (kg/s) Transparent case Sealed case inlet 3 705 917.8 3 723 752 outlet -3 705 921.6 -3 723 893.2 net -3.847 693 9 -141.2 deviation 1.04e-6 3.79e-5 3 Data processing and analysis
The trend of wind resistance and wind tilt moment in the time domain of the two design models (transparent modeling and sealed modeling) is obtained in this paper by FLUENT software, and the wind load comparison analysis is conducted on the basis of the calculation results under different wind attack angles. Moreover, the trend includes the average drag force and wind tilt moment from 40 s to 100 s and the distribution of total pressure on the surface of the platform model after the 100 s simulation.
3.1 Average drag force and wind tilt moment
Figure 8 shows the comparison of the average drag force and wind tilt moment of the two design schemes of the transparent and sealed models under different wind attack angles, respectively. The analysis in this article revealed that the positive direction of the drag force is defined as the inlet direction, that is, the positive x-axis direction. The origin of the wind tilt moment is defined as the origin of the coordinate axis of the model (0, 0, 0), and the critical axis is always perpendicular to the wind inlet direction. Considering the calculation accuracy and stability, the value range of the drag force and wind tilt moment in the time domain is 40–100 s. Meanwhile, the range of the wind attack angle is 0°–180° considering model symmetry. Figure 8(a) shows the overall wind load of the two models in the horizontal direction. The horizontal drag force for the sealed and transparent models is close to each other, and the value of the transparent shape slightly fluctuates with wind attack angles. Figure 8(b) shows the drag force of the two shapes in the z-axis direction. The fluctuation of wind resistance in the z-axis for the transparent model is more stable than that of the sealed model, and the fluctuation range of wind resistance is only 9.6% of that of the sealed model. Moreover, the maximum value of drag force of the transparent case is reduced by approximately 69% compared with the sealed shape model.
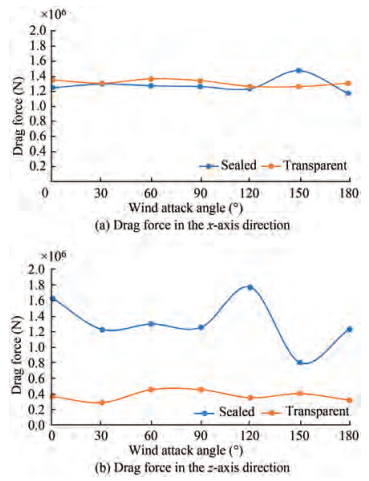 Figure 8 Variation trend of drag force with wind attack angles for transparent and sealed models
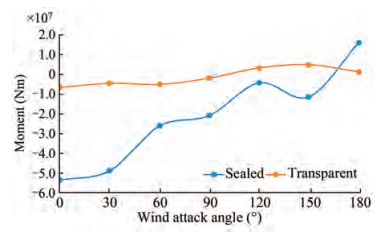 Figure 9 Variation trend of wind tilt moment with wind attack angles for transparent and sealed models
Figure 9 shows the variation of wind tilt moment around the y-axis for the sealed and transparent shape models with the wind angle of attack. The sign of the moment obeys the right-hand rule. The maximum wind tilt moment of the transparent shape is approximately 12% of that of the sealed model, and the fluctuation of the wind tilt moment with the angle of attack of the wind is approximately 16% of that of the sealed shape, indicating the stability of the moment variation for the transparent case.
3.2 Comparison analysis of force and moment at 100 s
Figure 10 shows the composition of force and moment at a simulation time of 100 s, and the comparative analysis is also conducted in different axis directions for the two design schemes. The figure reveals that the wind load of the offshore tourism platform comprises the following two items, namely the pressure and viscosity terms. The boundary condition of the platform surface is set to a smooth wall in the numerical simulation; thus, the forces and moments acting on the platform are mainly caused by pressures. In this part, two representative wind angles of 0° and 90° are selected for comparative analysis.
 Figure 10 Comparison of drag force and moment along three axes for the two design schemes
Figures 10(a) and (b) show that when the wind angle is 0°, the forces along the x- and y-axes for the transparent and sealed models are relatively close. In the x-axis direction, the force of the transparent model is even slightly larger than that of the sealed case. However, from the perspective of the force in the z-axis, the optimization effect of the transparent model is observed, and the force is reduced by approximately 86%. Similarly, for the case where the wind angle is 90°, the force on the transparent model in the z-axis has also been considerably improved, which is reduced by approximately 73%.
The moment analysis result is slightly different from the force. (c) and (f) respectively show that the moments of the two design schemes at a wind direction of 0° are only slightly different, and the transparent model is slightly larger than the sealed model in the y-axis direction. However, when the wind angle increases to 90°, (g) and (h) reveal that the transparent model is effectively optimized in the x- and y-axes, and the moment decreases by approximately 80%.
3.3 Distribution of surface pressure for the transparent case model
The above analysis revealed that the design scheme of the transparent model has a larger wind resistance reduction optimization effect than the sealed model. Therefore, the transparent case is selected to analyze the surface pressure distribution at wind angles of 90°, 120°, and 150°. This analysis aims to provide an intuitive understanding of wind load on the transparent case model under the aforesaid wind angles.
Figure 11 shows the distribution of total surface pressure for the transparent case model at wind angles of 90°, 120°, and 150°. Figure 11(a) shows that large positive pressure appears at the windward end of the model, while negative pressure appears on the bottom side of the windward end of the platform base and the top side of the windward end of the upper platforms (circular shape). This phenomenon is due to the wind hitting the windward side of the model, spreading out, and then forming a vortex attachment zone in the wake. In the positive direction of the x-axis, the pressure at the bottom side of the base platform gradually turns from negative to positive. Similarly, the windward side of the three circular support columns is all positive pressure. For the back side, the wake area is formed when winds flow over the surface due to wind separation by the column. Hence, the back sides of the columns are all negative pressure. A concave area is observed in the middle part on the top side of the base platform. The blocked front side of the concave area by the wall shows negative pressure, while the rear end presents positive pressure. Directly above the three circular columns of the model, three cylindrical hollow spaces are observed from the base platform to the roof of the highest circular platform. The internal pressures of hollow spaces are all negative due to the shelter effect. If the origin is taken as a reference point, then the moment around the y-axis of the model is generally negative when the wind attack angle is 90° because the pressure on the platform above the reference plane is larger than the one downwards. This finding means that the platform in this case tends to tilt downward.
 Figure 11 Distribution of total surface pressure for the transparent model
Figure 11(c) is the distribution of the total surface pressure of the transparent model when the wind angle is 150°. This scenario has a wide windward area due to the wind angle. Compared with case a, a large area of negative pressure appears on the top side of the windward end of the base platform. This phenomenon leads to a negative moment around the y-axis for the entire transparent case model, causing it to tilt upward.
Figure 11(b) is the total surface pressure distribution of the transparent model when the wind angle is 120°. Unlike cases a and c, the negative pressure zone at the underside of the base platform is relatively small for this scenario because one endpoint of the simplified triangle structure is at the forefront of the windward side, also leading to a relatively small contact area.
4 Conclusion
This article combined the FLUENT software with UDF and added random pulsating wind to analyze the wind load on offshore tourism platforms at different wind attack angles. The results revealed that appropriately adding a certain proportion of transparent layers in the superstructure of the platform not only increases the aesthetics of the building but also effectively reduces the wind resistance vertically, improves the moment around the y-axis, and optimizes its stability under different wind directions. Major conclusions can be inferred from the following three aspects: drag force, wind tilt moment, and surface pressure distribution.
4.1 Drag force
The transparent shape design has no wind resistance reduction effect in the horizontal direction, and the value of drag force in this direction is close to that of the sealed model. However, the wind resistance reduction effect of the transparent case in the z-axis direction is quite evident. Moreover, the wind resistance of the transparent model has minimal fluctuations with the change in wind attack angles.
4.2 Wind tilt moment
The transparent design has markedly improved the stability of the platform. The maximum value of the wind tilt moment around the y-axis is approximately 12% of that of the sealed model, and the fluctuation range of the wind tilt moment with the change in the wind angle of attack is approximately 16% of that of the sealed model.
4.3 Distribution of surface pressure
The surface pressure distribution of the offshore tourism platform is related to the shape of the structure, and the overall pressure distribution is different under different wind attack angles. However, the larger wind loads on the model consistently appear on the windward side of the platform. The transparent model effectively reduces the effective windward area by increasing the penetration layer, thereby optimizing the overall wind resistance of the platform.
Open Access This article is licensed under a Creative Commons Attribution 4.0 International License, which permits use, sharing, adaptation, distribution and reproduction in any medium or format, as long as you give appropriate credit to the original author(s) and thesource, provide a link to the Creative Commons licence, and indicateif changes were made. The images or other third party material in thisarticle are included in the article’s Creative Commons licence, unlessindicated otherwise in a credit line to the material. If material is notincluded in the article’s Creative Commons licence and your intendeduse is not permitted by statutory regulation or exceeds the permitteduse, you will need to obtain permission directly from the copyrightholder. To view a copy of this licence, visit http:/creativecommons.org/licenses/by/4.0/. -
Figure 1 Sketch of the self-designed offshore tourism platform
Figure 2 Schematic of the transparent and sealed models
Figure 3 Random pulsating wind generated by MATLAB within 100 s
Figure 4 Schematic of wind attack angle and coordinate axis
Figure 5 Boundary condition settings of the computational domain
Figure 6 Schematic of mesh division for the two design schemes
Figure 7 Residual records for the first five steps
Figure 8 Variation trend of drag force with wind attack angles for transparent and sealed models
Figure 9 Variation trend of wind tilt moment with wind attack angles for transparent and sealed models
Figure 10 Comparison of drag force and moment along three axes for the two design schemes
Figure 11 Distribution of total surface pressure for the transparent model
Table 1 Calculating conditions of wind load analysis on the platform
(°) Inclination Domain of wind angle Wind angle interval 0 0-180 30 Table 2 Relationship between skewness, orthogonal quality, and mesh quality (Fatchurrohman, 2017)
Skewness Orthogonal Quality Excellent Very good Good Acceptable Bad Bad Acceptable Good Very good Excellent 0-0.25 0.25-0.50 0.50-0.80 0.80-0.94 0.95-0.97 0.001-0.014 0.15-0.20 0.20-0.69 0.70-0.95 0.95-1.00 Table 3 Mass flow rate of the inlet and outlet boundaries
Mass flow rate (kg/s) Transparent case Sealed case inlet 3 705 917.8 3 723 752 outlet -3 705 921.6 -3 723 893.2 net -3.847 693 9 -141.2 deviation 1.04e-6 3.79e-5 -
Architects SoN, OC-1 MEP (1988) Guidelines for Wind Tunnel Testing of Mobile Offshore Drilling Units. Society of Naval Architects and Marine Engineers. Bienen B, Cassidy M (2006) Three-Dimensional Dynamic Analysis of Jack-up Structures. Advances In Structural Engineering 9(1): 19-37 https://doi.org/10.1260/136943306776232873 Blocken B (2015) Computational Fluid Dynamics for urban physics: Importance, scales, possibilities, limitations and ten tips and tricks towards accurate and reliable simulations. Building & Environment 91 Cassidy M, Taylor P, Eatock Taylor R, Houlsby G (2002) Evaluation of long-term extreme response statistics of jack-up platforms. Ocean Engineering 29(13): 1603-1631 https://doi.org/10.1016/S0029-8018(01)00110-X Cao MQ, Wang L, Liang W (2009) Analysis of wind load for deepwater semi-submersible based on model test. Research and Exploration in Laboratory 28(09): 17-19 CSS (2020) Rules for construction and classification of mobile offshore drilling units Davenport AG, Hambly EC (1984) Turbulent Wind Loading and Dynamic Response of Jackup Platform. Offshore Technology Conference DNV (2007) Recommended practice DNV-RP-C205. Environmental conditions and environmental loads Fatchurrohman N, Chia S (2017) Performance of hybrid nano-micro reinforced mg metal matrix composites brake calliper: simulation approach. IOP Conference Series: Materials Science And Engineering 257, 012060 https://doi.org/10.1088/1757-899X/257/1/012060 Gomathinayagam S, Vendhan CP, Shanmugasundaram J (2000) Dynamic effects of wind loads on offshore deck structures-a critical evaluation of provisions and practices. Journal of Wind Engineering and Industrial Aerodynamics 84(3): 345-367 https://doi.org/10.1016/S0167-6105(99)00113-0 Gu JY, Deng B, Jiang R, Jiang Z, Guan Y (2016) Calculation of Random Wind Load on BT3500 TSV and Optimization of Superstructure Resistance. Shipbuilding of China 57(04): 14-22 Lin Y, Hu AK, Xiong F (2012) Numerical simulation and experiment study on wind load of Jack-Up platform. Chinese Journal of Hydrodynamics 27(02): 208-215 https://doi.org/10.3969/j.issn1000-4874.2012.02.013 Matsson JE (2021) An Introduction to ANSYS Fluent 2021. SDC Publications Sahin I, Aybar A (1985) A survey on semi-submersible wind loads. Ocean Engeering 12(3): 253-261 https://doi.org/10.1016/0029-8018(85)90016-2 Shipping A (2008) Rules for building and classing mobile offshore drilling units Shinozuka M, Deodatis G (1991) Simulation of Stochastic Processes by Spectral Representation. Applied Mechanics Reviews 44(4): 191 https://doi.org/10.1115/1.3119501 Sommerfeld A (1908) A Contribution to Hydrodynamic Explanation of Turbulent Fluid Motions. International Congress of Mathematicians 3: 116-124 Spalart, PR (1997) Comments on the feasibility of LES for wings, and on a hybrid RANS/LES approach. In Proceedings of first AFOSR international conference on DNS/LES. Greyden Press Spalart PR (2009) Detached-Eddy Simulation. Annual Review of Fluid Mechanics 41(1): 181-202 Tan M, Feng J, & Xiong F (2014) Study on the Wind Load of Jack-up Drilling Platform. Naval Architecture and Ocean Engineering Zhu H, Zhe MA, Zhai GJ, Xie B, FU YJ, OU JP (2009) Numerical Simulation and Wind Tunnel Tests of Wind Loads Acting on HYSY-981 Semi-submersible Platform. Ship & Ocean Engineering 38(05): 149-152