A Cooperative Jamming Scheme Based on Node Authentication for Underwater Acoustic Sensor Networks
https://doi.org/10.1007/s11804-022-00277-8
-
Abstract
Cooperative jamming (CJ) is one of the important methods to solve security problems of underwater acoustic sensor networks (UASNs). In this paper, we propose a Cooperative Jamming Scheme based on Node Authentication for UASNs to improve the effect of CJ by selecting suitable jamming source for found illegal nodes. In the node authentication, all nodes will be identified by their trust value (TV). TV is calculated according to three types of evidence: channel-based trust evidence, behavior-based trust evidence and energy-based trust evidence. Besides, to deal with cases where legal nodes may be suspected, the historical TV and trust redemption will be considered when calculating TV. In cooperative jamming, according to the link quality, several nodes are selected to jam illegal nodes. Both simulation and field experiment show that the proposed scheme can accurately find the illegal nodes in the time-vary channel and improve the security of the network.Article Highlights• To improve the security of the network, node authentication is used in the cooperative jamming scheme.• In the node authentication, all nodes will be identified according to three types of evidence: channel-based trust evidence, behaviorbased trust evidence and energy-based trust evidence.• To demonstrate the reliability and effectiveness of the proposed scheme, field experiment had been carried out. -
1 Introduction
Underwater acoustic sensor networks (UASNs) have been widely used in disaster prediction, marine resource exploration and military applications (Han et al. 2015). However, due to the broadcast and open nature of underwater acoustic channel, the transmitted packets can be heard by illegal nodes (Huang et al. 2016). Besides, UASNs are vulnerable to spoofing attacks from illegal nodes (Diamant et al. 2019). Therefore, UASNs are facing increasing challenges in dealing with various additional security threats. In physical layersecurity (PLS), cooperative jamming (CJ) is an effective method to enhance transmission security by jamming signals to prevent illegal nodes from obtaining packets. The common means of CJ is to choose some nodes to transmit jamming signals. Without knowing the location of the illegal nodes, the transmitting power is designed to be sufficient to cover the entire networks. However, the energy consumption is high, and the communication between legitimate nodes may be affected. When illegal nodes are found, the above problems of CJ can be solved. In UASNs, it is necessary to designed an effective node authentication for CJ.
Current methods of node authentication fall into three main categories: cryptography, trust management mechanism, and physical layer authentication (PLA). Traditional cryptographic-based authentication mechanisms are widely used at the upper layer, where a symmetric secret key is shared among legitimate nodes (Xie et al. 2021). However, the limited computation and energy of sensor nodes makes these methods unsuitable for UASNs.
The trust management mechanism evaluates trust value (TV) of all nodes in the network by analyzing trust evidence, such as packet loss rate and bit error rate, and then finds out illegal nodes. To improve location privacy of UASNs, the author (Arifeen et al. 2019) proposed an Adaptive Neuro Fuzzy Inference System (ANFIS) to evaluate trustworthiness of nodes by Markov decision process (MDP). In each state of the MDP, a node evaluated the trust behavior of the forwarding node using the FIS learning rules and selected a trusted node. Su et al. (2021) proposed a redeemable Support Vector Machine Dempster- Shafer Fusion-based Trust Management mechanism for UASNs. The support vector machine was applied to classify the trust of nodes from three types of trust evidence: packet-based evidence, data-based evidence, and energy- based evidence. Based on historical performance and environmental influence, a trust redemption process was used in the calculation of TV. However, the trust management mechanism needs to observe nodes for a period of time before finding illegal nodes. In this case, the networks may have been attacked and cannot work normally.
PLA can distinguish legitimate nodes and illegitimate nodes by testing physical layer characteristics such as channel state information (CSI) (Liao, 2020). The basis of PLA is that when the spatial distance between legal and illegal nodes is greater than half of the wavelength, the legal and illegal channel are irrelevant and have significant differences (Liu and Wang 2016). PLA was initially proposed by Simmons and a model of message authentication was developed under a noiseless channel (Liu et al. 2015). The main methods of PLA are received signal strength (RSS), channel impulse response (CIR), and channel frequency response (CFR). RSS had been investigated for PLA due to the temporal correlation in the propagation environment (Zeng et al. 2010). The authors (Xiao et al. 2008) explored the properties of channel differences between two consecutive CFR in a time-variant channel. However, the performance of RSS and CFR is limited by the channel stability and noise. Using the inherent characteristics of channel amplitude and multipath delay, Liu and Wang (2016) proposed a Physical Layer Authentication Enhancement Using Two-Dimensional Channel Quantization. In order to simplify the decision rules for authentication, a two-dimensional quantization method is developed to preprocessthe channel variations. Zhao et al. (2022) proposed a Physical Layer Node Authentication in UASNs using Time-Reversal to effectively detect spoofing attacks. By calculating the Maximum Time-Reversal Resonating strength (MTRRS), this method enabled each node to make authentication decision in a timely and distributed way. However, the performance of these CIR-based authentication will be influenced by channel variations and the error of channel estimation.
In the trust management mechanism, when illegal nodes do not launch spoofing attacks but behave like legal nodes, the detection rate will decrease. In CIR-based authentication, the false alarm rate rises due to the time-varying nature of the underwater acoustic channel. In order to improve the performance of node authentication, based on trust management mechanism and CIR-based authentication, we propose to identify nodes by TV. TV is calculated according to three types of evidence: channel-based trust evidence, behavior-based trust evidence and energy-based trust evidence. Referring to the paper (Zhao et al. 2022), channel-based trust evidence is obtained by calculating the average TRRS between the received signals and historical signals. Behavior-based trust evidence is obtained by counting the packet forwarding rate and the bit error rate during the last communication. Energy-based trust evidence is obtained by calculating the energy consumption rate. To reduce the misjudgment of legal nodes, historical TV will be considered when calculating TV. Besides, trust redemption will be carried out when the power of noise is high. All nodes can be identified by comparing their TV with the threshold. When the TV of a node is lower than the threshold, the node will beregarded as an illegal node. In addition, we propose a cooperative jamming scheme. For a suspected node, the nearest node from the neighbor nodes of the suspected node is selected as the jamming source. The jamming source needs to transmit jamming signals to prevent the suspected node from hearing packets of the communication.
Section 2 introduces the network model and some reasonable assumptions of this work. In Section 3, the proposed scheme of node authentication is introduced. The description of cooperative jamming is given in Section 4. The results of simulation and experiment are given in Section 5. Conclusions are drawn in Section 6.
2 System model
A list of acronyms and abbreviations used in this paper is presented in Table 1.
Table 1 List of acronyms and abbreviations.CH Cluster head MN Member node Attacker Illegal node Helper Auxiliary node TD Trust degree TV Trust value IDENTITY The signal containing MNs' information AUTHEN The signal containing TDs of MNs NOTICE The signal when finding Attacker FIND The signal sent by Attacker's neighbor nodes CHOICE The signal after finding the jamming source SEND The signal used in the jamming scheme P0 The maximum transmitting power TRRS Time-reversal resonating strength 2.1 Network model
We consider cluster-based UASNs. As Figure 1 shows, the gateways are deployed on the water surface. All sensor nodes, equipped with half-duplex acoustic modem, are randomly distributed underwater. The network is divided into several clusters. There are three kinds of nodes in each cluster: one cluster head (CH), two auxiliary nodes (Helpers), and several member nodes (MNs). In a cluster, MNs will send data to the CH after data collection. CHs send the collected data to the gateways by collaborating with each other. Then, the data packages of all gateways are transmitted to the ground base station via satellite.
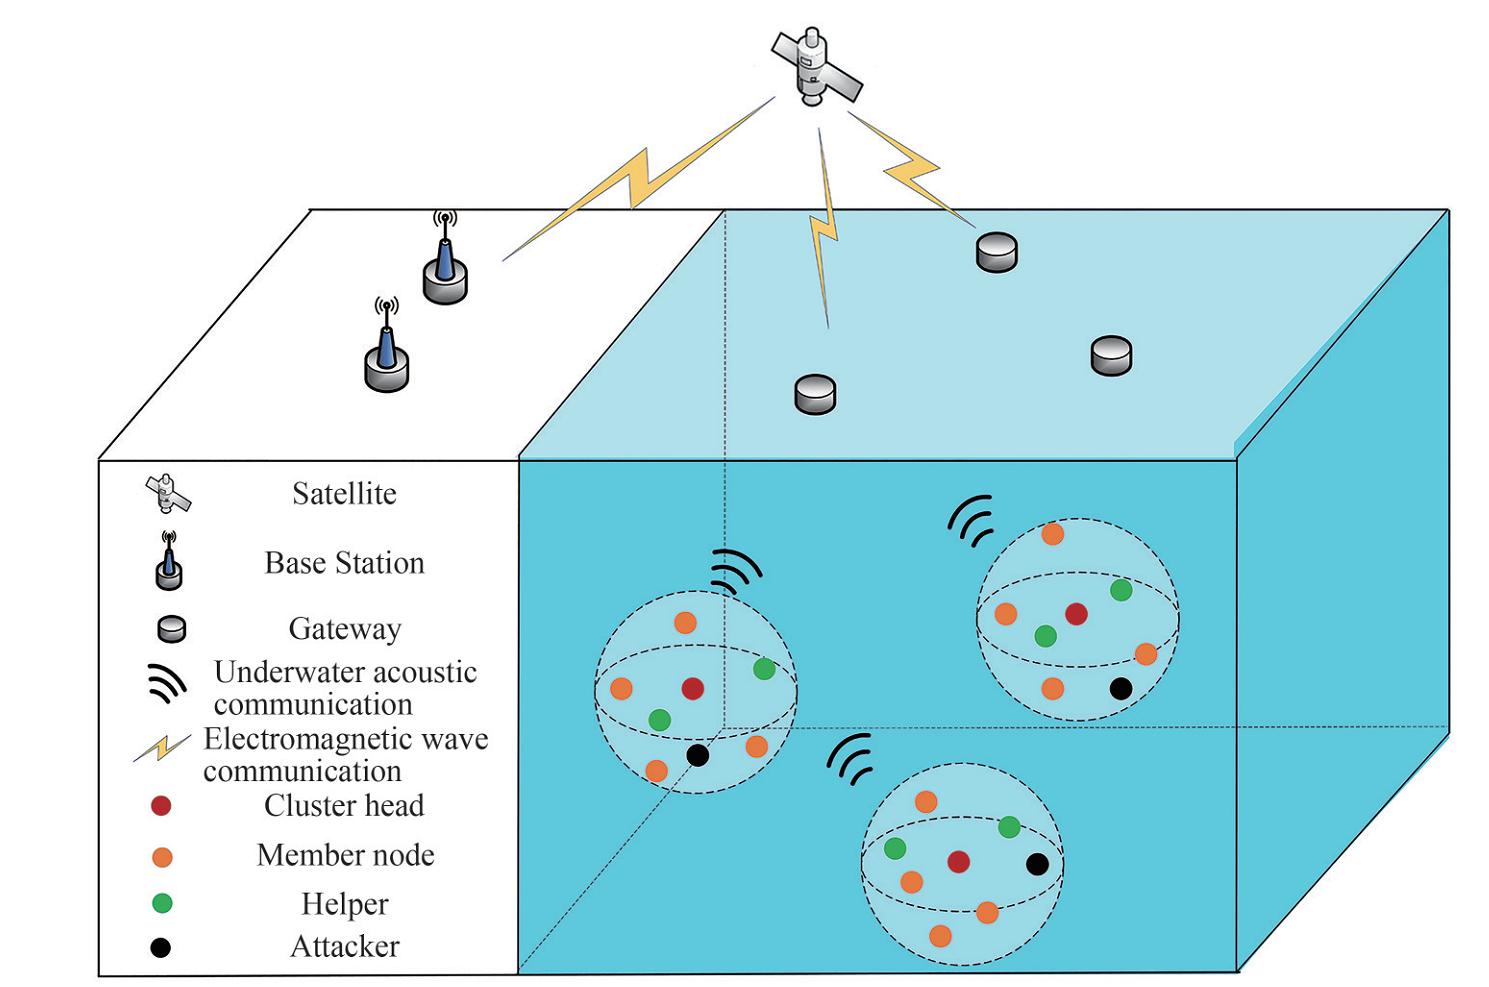 Figure 1 Network model
We assume that there is an illegal node (Attacker) whose location is unknown in a cluster. Attacker can hear and decode the package transmitted between nodes. Besides, in order to gain the trust of CH and Helpers and participate in the communication of the network, Attacker can send spoofing message to cheat CH and Helpers by simulating its neighbor node MNi. Once participating in the communication successfully, Attacker can conduct spoofing attacks and destroy the communication by transmitting false packages or refusing to forward the received packages.
To protect the network from spoofing attacks, before the communication, CH will identity all MNs in the cluster. However, when CH comes under deep fade or shadowing, the authentication decision of CH is unreliable. Therefore, there are two Helpers in a cluster applied to further enhance the authentication process. Before the communication between nodes, all MNs will transmit the signal IDENTITY to CH and Helpers. IDENTITY of MNi contains the ID and residual energy (RE) of MNi. MNi will tell CH and Helpers the bit error rate and packet forwarding rate of its neighbor nodes during the last communication. Then, CH and Helpers will calculate the TDs of all MNs. Helpers send the signal AUTHEN to CH which includes TDs. According to these results, CH will calculate the TV of all MNs and find out Attacker in the cluster. Finally, CH will select the node closest to Attacker to send jamming signals. The TV is represented by a real number ranging from 0 to 1. 1 represents trust and 0 represents distrust.
2.2 Assumptions
· All nodes in the cluster can only float with the ocean current.
· All nodes in the cluster have a unique ID and know their own RE.
· CH and Helpers are assumed to be safe nodes and they can store historical probe signal of MNs.
· The energy of Attacker and CH is unlimited and the power of Helpers and MNs is limited.
· When the network is first deployed, there is no Attacer and the TV of all MNs is 1.
3 Node authentication
In this section, we introduce the description of node authentication proposed in our work. As shown in Figure 2, the scheme of node authentication proposed in this paper consists of three parts: trust evidence collection, trust redemption and trust value update. In the first part, CH and Helpers will collect three kinds of trust evidence to calculate TDs by receiving IDENTITY of MNs. In the second part, by calculating the average SNR of all IDENTITY received, CH will analyze the power of the noise to decidethe ratio of trust redemption. In the third part, Helpers will send AUTHEN to CH, which contains TDs. CH will calculate and update the TV of all nodes in the network according to TDs.
 Figure 2 The Structure of Node Authentication
3.1 Trust evidence collection
In this part, we introduce three kinds of trust evidence and their collection process. To find out Attacker in the network quickly and accurately, referring to the trust management mechanism and the CIR-based authentication, trust evidence in this paper is divided into three categories: channel-based trust evidence, behavior-based trust evidence, and energy-based trust evidence. As shown in Figure 3, we assume that Attacker tries to deceive CH and Helpers by simulating its neighbor node MNi. Since the location of Attacker is different from that of MNi, their CSI is different. By collecting channel-based trust evidence, Attacker can be found before the launch of spoofing attacks. In order to improve the reliability of authenticationin the time-varying channel, behavior-based trust evidence and energy-based trust evidence are considered in the process of node authentication. Referring to the paper (Liu and Wang 2016), channel-based trust evidence is obtained by calculating the average TRRS between the received and historical signals. Behavior-based trust evidence is obtained by calculating the packet forwarding rate and bit error rate during the last communication between nodes. Energy-based trust evidence is obtained by calculating the energy consumption rate of nodes.
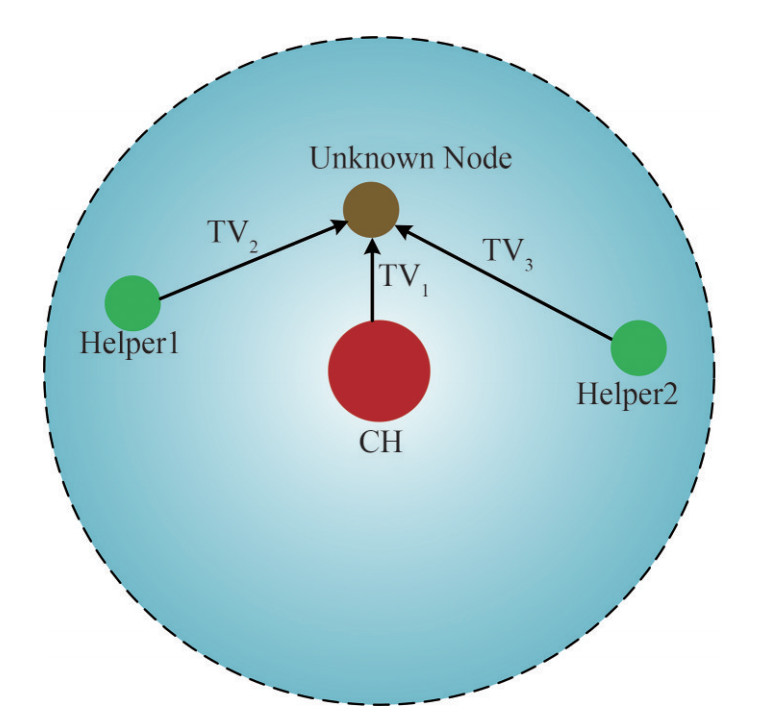 Figure 3 The Network of Node Authentication
Before the communication of the network, CH needs to identity all MNs in the cluster to protect the network from spoofing attacks. CH will send Request to Send (RTS) to all nodes in the cluster with maximum transmitting power P0. After hearing RTS, MNs will transmit IDENTITY to CH and Helpers. Figure 4 shows the structure of IDENTITY. The probe signal of IDENTITY is used to calculate the average TRRS. The LFM with high autocorrelation is chosen as the probe signal. For MNi, the data of IDENTITY contains its ID and RE. Besides, the bit error rate and the packet forwarding rate of its neighbor nodes during the last communication will be put into the data. Attacker will also send its own IDENTITY to CH and Helpers.
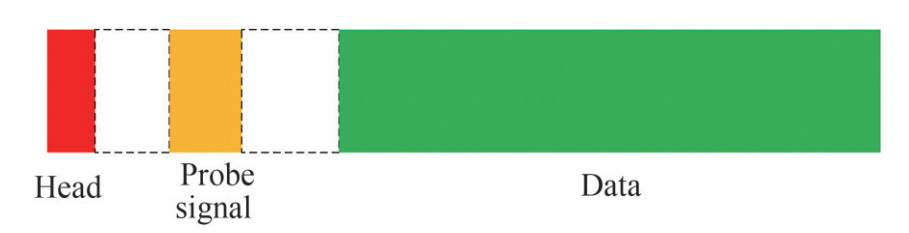 Figure 4 The Structure of IDENTITY Packet
3.1.1 Channel-based trust evidence
Time-reversal (TR) is a signal processing technique that has a wide range of applications in acoustic and electromagnetic due to its ability to focus the received signal in complex temporal and spatial environments Zhao et al. (2022). The research ofTR dates back to the early 1970s when phase conjugation was first observed and studied (Chen, 2014). Since TR can make full use of multi-path propagation and does not require complicated channel processing and equalization, it was later verified and tested in wireless radio communication systems (Chen, 2014).
A node communication system is demonstrated in Figure 5. At first, transceiver B will transmit a probe signal p(t) that propagates through a scattering and multi- path environment. Transceiver A will hear the probe signal y1 (t), which can be expressed as
$${y_1}(t) = p(t) \times {h_1}(t)$$ (1) 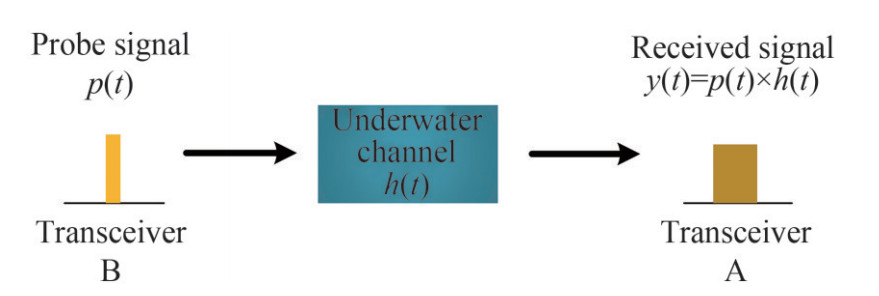 Figure 5 Node communication system
where h1 (t) is the channel transfer function. Transceiver A will reverse the time (conjugate, if the signal is complex valued) of the received waveform, which can be expressed as
$$y_1^*(- t) = {p^*}(- t) \times h_1^*(- t)$$ (2) Then, transceiver B transmit the same probe signal p (t) again through the same channel to transceiver A. A can calculate the convolution between y1* (−t) and y2(t), which can be expressed as
$$r(t) = {y_2}(t) \times y_1^*(- t)$$ (3) By analyzing the result, A can determine whether y1 (t) and y2 (t) are from the same transceiver. In order to improve the accuracy of the cross-correlation, the LFM with high autocorrelation is chosen as the probe signal.
It is assumed that there are no illegal nodes during the network deployment phase. To improve the accuracy of the channel-based trust evidence in the time-varying acoustic channel, referring to Zhao et al. (2022), CH will establish a CIR database DCM to capture the CIR of each link between CH and a MN. Helper1 will establish a CIR database DHM1 and Helper2 will establish a CIR database DHM2, too. For the link between CH and MNi, the CIR sub-database DiCM consists of CIRs recorded at different times to capture their patterns over time, which can be represented as
$$D_i^{{\rm{CM}}} = \left\{ {{h^{{\rm{C}}{{\rm{M}}_i}}}\left({t = {t_1}} \right), \cdots, {h^{{\rm{C}}{{\rm{M}}_i}}}\left({t = {t_N}} \right)} \right\}$$ (4) where hCMi (t = tu) is the CIR between CH and MNi at time tu and N is the database size. hCMi (t = t1) is the earliest CIR and hCMi (t = tN) is the latest CIR. During the authentication process of each node, CH and Helpers will calculate the CIR of each link based on the signals sent by MNi and update each CIR database.
To obtain the channel-based trust evidence of each MN, CH and Helpers will calculate the average TRRS of each MN based on the established CIR databases. The closer the time, the smaller the variation of the underwater acoustic channel and the higher the TRRS. When calculating the average TRRS, the later the CIR is in the CIR database, the higher the weight of the CIR will be. The average TRRS $ {\dot H_{Ci}}$ of MNi calculated by CH can be expressed as
$${\bar H_{Ci}} = \frac{{\sum\limits_{j = 1}^N {\left({j \times {H_{Cij}}} \right)} }}{{\sum\limits_{j = 1}^N {(j)} }}$$ (5) where HCij is the jth normalized TRRS score of MNi based on the CIR database. HCij can be calculated by
$${H_{Cij}} = \frac{{\left\| {{h^{C{M_i}}}\left({t = {t_{{\rm{new }}}}} \right) \times {h^{*{\rm{C}}{{\rm{M}}_i}}}\left({t = {t_i}} \right)} \right\|}}{{\left\| {{h^{C{M_i}}}\left({t = {t_i}} \right) \times {h^{*{\rm{C}}{{\rm{M}}_i}}}\left({t = {t_i}} \right)} \right\|}}$$ (6) where hCMi (t = t) is the jth CIR of MNi in the CIR database of CH and h*CMi (t = ti) is the time-reversed jth CIR. hCMi (t = tnew) is the CIR of the new probe signal.
After calculating the average TRRS of all MNs, CH and Helpers can obtain the channel-based trust evidence E1. For CH, the channel-based trust evidence E1Ci of MNi can be expressed as
$$E{1_{Ci}} = {\dot H_{Ci}}$$ (7) 3.1.2 Behavior-based trust evidence
As shown in Figure 6, after receiving the packet S1 from MNx, MNy will forward the packet S2 to its neighbor MNz. During the process, MNx can also receive S2 and determine whether MNy has correctly forwarded packets or tampered with the data. According to the behavior of Attacker, the packet forwarding rate and bit error rate are chosen as the index to calculate behavior-based trust evidence. During the node authentication process, MNs will tell the bit error rate and packet forwarding rate of their neighbor nodes during the last communication to CH and Helpers. Besides, CH and Helpers will calculate the bit error rate and packet forwarding rate of neighbor nodes.
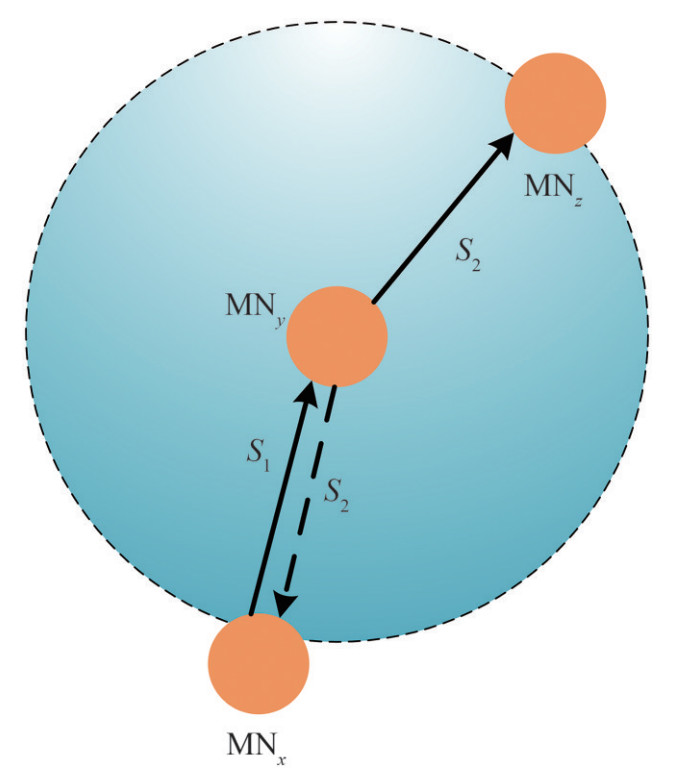 Figure 6 The Model of Behavior-based Trust Evidence Collection
Attacker may affect the communication by refusing to forward a part of all received packets. Therefore, the nodes with lower data forwarding rate are more likely to be Attacker. According to the beta distribution (Su et al. 2021), the packet forwarding rate canbe defined as follows:
$${f_F} = \frac{{{\rm{Sf}} + 1}}{{{\rm{Sf}} + {\rm{Uf}} + 2}}$$ (8) where Sf and Uf are the number of successfully and unsuccessfully forwarded packets respectively.
Besides, the communication will be affected by the false packets of Attacker. Therefore, the nodes with higher bit error rate are more likely to be Attacker. Bit error rate can be defined as follows:
$$f_{\text {ber }}=\frac{\mathrm{Nb}_{\text {error }}}{\mathrm{Nb}_{\text {all }}}$$ (9) where Nberror is the number of error bits in a packet and Nball is the number of all bits in a packet.
After collecting the average bit error rate and packet forwarding rate of all MNs, CH and Helpers can obtain the channel-based trust evidence E2. For CH, the behavior- based trust evidence E2Ci of MNi can be expressed as
$$E{2_{Ci}} = \frac{1}{2} \times \left({E{2_{Cia}} + E{2_{Cib}}} \right)$$ (10) where E2Cia is the trust evidence obtained by packet forwarding rate and E2Cib is the trust evidence obtained by bit error rate.
E2Cia can be calculated by
$$E{2_{Cia}} = \frac{{{{\bar f}_{Fi}}}}{{{f_{F{\rm{ th }}}}}}$$ (11) where fFi is the average packet forwarding rate of MNi and fFth is the threshold value of packet forwarding rate.
E2Cib can be calculated by
$$E{2_{Cib}} = \frac{{1 - {f_{{\rm{ber }}}}}}{{1 - {f_{{\rm{berth }}}}}}$$ (12) where fberi is the average bit error rate of MNi and fberth is the threshold value of bit error rate.
3.1.3 Energy-based trust evidence
Since Attacker will refuse to forward a part of all received packet, the energy consumption of Attacker is unusual. The energy consumption rate of nodes can be chosen as a trust evidence. During the node authentication, MNs will tell their RE to CH and Helpers. By calculating the energy consumption rate, CH and Helpers can obtain the energy-based trust evidence E3. For CH, the energy- based trust evidence E3Ci of MNi is defined as follows:
$$E{3_{Ci}} = 1 - \frac{{\left| {{f_{{\rm{R}}{{\rm{E}}_i}}} - {f_{{\rm{RE\ th }}}}} \right|}}{{{f_{{\rm{RE\ th }}}}}}$$ (13) where fREi is the energy consumption rate of MNi and fREth is the threshold vaule of energy consumption rate. fREi can be calculated by
$${f_{{\rm{RE}}i}} = \frac{{{\rm{R}}{{\rm{E}}_{i\ {\rm{ last }}}} - {\rm{R}}{{\rm{E}}_{i\ {\rm{ new }}}}}}{{{\rm{R}}{{\rm{E}}_{i\ {\rm{ last }}}}}}$$ (14) where REi last is the last RE of MNi and REi new is the current RE of MNi.
3.2 Trust redemption
When the power of noise is high, the collected trust evidence will be affected. In this situation, the possibility of causing MNs to be misclassified as Attacker will rise. In order to improve the reliability of node authentication, trust redemption will be carried out when the power of noise is high. During node authentication, CH will calculate the average SNR of all received signals. According to the average SNR, CH will calculate the trust redemption coefficient Erede, which can be expressed as
$${E_{{\rm{rede }}}} = \left\{ {\begin{array}{*{20}{l}} {{\rm{ rede}}{{\rm{ }}_1}, }&{\overline {{\rm{SNR}}} \in \left[ {{\rm{SN}}{{\rm{R}}_1}, + \infty } \right)}\\ {{\rm{ rede}}{{\rm{ }}_2}, }&{\overline {{\rm{SNR}}} \in \left[ {{\rm{SN}}{{\rm{R}}_2}, {\rm{SN}}{{\rm{R}}_1}} \right)}\\ {{\rm{ rede}}{{\rm{ }}_3}, }&{\overline {{\rm{SNR}}} \in \left[ { - \infty, {\rm{SN}}{{\rm{R}}_2}} \right)} \end{array}} \right.$$ (15) where SNR is the average SNR of all received signals. SNR1 and SNR2 are the thresholds of SNR. rede1, rede2 and rede3 are the constants, andtheir relationship is
$${\rm{ rede}}{{\rm{ }}_1} < {{\mathop{\rm rede}\nolimits} _2} < {{\mathop{\rm rede}\nolimits} _3}$$ (16) When SNR is larger than SNR1, the power of noise is low and the trust redemption is rede1. When SNR is smaller than SNR2, the power of noise is high and the trust redemption is rede3.
After calculating the trust redemption, CH will tell the trust redemption to Helpers.
3.3 Trust update
After the collection of trust evidence and the calculation of trust redemption, CH and Helpers will calculate the TDs of all nodes in the cluster. For CH, the TD TrustCi (tk) of MNi in the time slot tk can be calculated by
$$\begin{array}{l} {\rm{Trust}}{{\rm{ }}_{Ci}}\left({{t_k}} \right) = \delta \times {\rm{ Trust}}{{\rm{ }}_{Ci}}\left({{t_{k - 1}}} \right) + (1 - \delta) \times {E_{{\rm{rede}}}}\\ \;\;\;\;\;\;\;\; \times \left[ {\alpha E{1_{Ci}} + \beta E{2_{Ci}} + (1 - \alpha - \beta)E{3_{Ci}}} \right] \end{array}$$ (17) where TrustCi (tk−1) is the TD of MNi in the time slot tk. δ, α and β are the constants.
After calculating the TDs of all nodes, Helpers will tell the results to CH by sending AUTHEN. Then, according to these TDs, CH will calculate and update the TV of all nodes in the cluster. The TV, TVi (tk), of MNi in the time slot tk can be expressed as
$${{\mathop{\rm TV}\nolimits} _i}\left({{t_k}} \right) = \frac{1}{3} \times \left({{{{\mathop{\rm Trust}\nolimits} }_{Ci}}\left({{t_k}} \right) + {{{\mathop{\rm Trust}\nolimits} }_{H1i}}\left({{t_k}} \right) + {{{\mathop{\rm Trust}\nolimits} }_{H2i}}\left({{t_k}} \right)} \right)$$ (18) where TrustCi (tk) is the TD of MNi in the time slottk−1 calculated by CH, TrustH1i(tk) is calculated by Helper1, and TrustCi (tk) is calculated by Helper2.
According to the TV of all nodes in the cluster, CH can determine which node is Attacker. When the TV of node X is lower than the threshold of TV, node X will be seemed as Attacker.
3.4 Analysis of performance
PLA is usually considered as a hypothesis testing problem. The performance of PLA can be expressed by the false alarm rate Pfa and the detection rate Pd. Pfa is the probability that one MN is determined as an illegal node when its TV, TVMN, is lower than the threshold. Pd is the probability that Attacker is determined as an illegal node when its TV, TVAttack, is lower than the threshold. Pfa and Pd can be expressed as
$${P_{{\rm{fa}}}}:{\rm{T}}{{\rm{V}}_{{\rm{MN}}}} < {\rm{T}}{{\rm{V}}_{{\rm{th}}}}$$ (19) $${P_d}:{\rm{T}}{{\rm{V}}_{{\rm{Attack }}}} < {\rm{T}}{{\rm{V}}_{{\rm{th }}}}$$ (20) where TVth is the threshold value of TV.
4 Cooperative jamming
In this part, we introduce the scheme of cooperative jamming based on node authentication, including the selection of the node that sends jamming signals and the process of cooperative jamming.
4.1 Node selection
If the TV of all nodes in the cluster is higher than the threshold, which means that there are no illegal nodes, the network will not carry out the cooperative jamming mechanism. As shown in Figure 7, when one node is determined as an illegal node, CH will send the signal NOTICE to inform all MNs and Helpers in the cluster. CH will tell the information of Attacker, including its false ID, false RE and neighbor nodes, which will be used to select the suitable node from the neighbor nodes of Attacker as the jamming source to send jamming signals. After receiving NOTICE, MNs and Helpers will compare the information told by CH with the stored information to check whether they are the neighbor nodes of Attacker. If node X is the neighbor node, then X will send the signal FIND to inform CH. FIND contains the minimum transmitting power required to communicate with Attacker. The minimum transmitting power PAX can be expressed as
$${P_{{\rm{AX}}}} = {P_0} \times \frac{{{\rm{SIN}}{{\rm{R}}_{{\rm{th}}}}}}{{{\rm{SIN}}{{\rm{R}}_0}}}$$ (21) 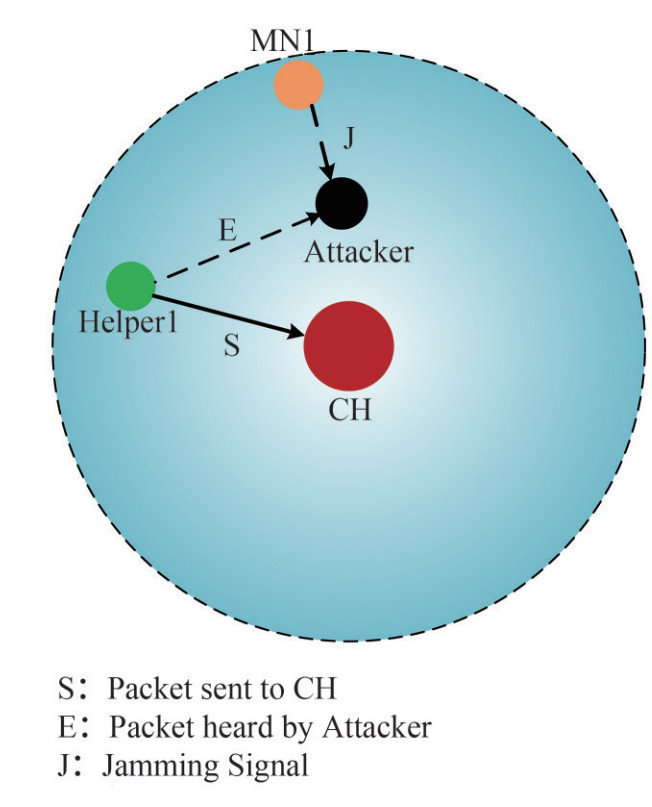 Figure 7 Network of cooperative jamming
where P0 is the maximum transmitting power and SINR0 is the SNR of the IDENTITY sent by Attacker. SINRth is the threshold of the SNR of the received signals.
After receiving FIND, CH will select the node with the minimum transmitting power from the neighbor nodes of Attacker as the jamming source, which node is closest to Attacker. It is assumed that MNX is selected as the jamming source. CH will send the signal CHOOSE to inform all legal nodes in the cluster about the selection results.
4.2 Cooperative jamming
Since MNX is selected as the jamming source, MNX will send the jamming signal to prevent Attacker from hearing packets during the whole process of the communication. In order to protect the transmitting between legal nodes from the jamming signal sent by MNX, MNX will calculate the transmitting power required to successfully communicate with the surrounding legal nodes and select the minimum value as the transmitting power of the jamming signal, which can be expressed as
$${P_X} = \min \left\{ {{P_{X1}}, {P_{X2}}, \cdots, {P_{Xn}}} \right\}$$ (22) where PXi is the transmitting power required to communicate with the node i.
Taking the communication between CH and Helper1 as an example, the proposed cooperative jamming scheme is shown in Figure 8. The time slot length is defined as the maximum transmission delay of the cluster. The jamming signal is designed as fake data to prevent Attacker from hearing the packets. To address the impact of the jamming signal, we add another control signal SEND to jamming scheme. SEND contains the ID of the receiver and the maximum transmission delay of the cluster. As shown in Figure 8, CH sendsSEND at T0 with power P0 to inform Helper1 and MN1 of the beginning of the packet transmission between CH and Helper1. When MN1 receives SEND, it will start sending the jamming signals with power PX. To protect the packets from being heard by Attacker, the length of jamming signal is defined as the sum of the length of packet and the maximum transmission delay. At T1, CH sends signal S1 with power P0. After receiving S1, Helper1 will send SEND to end the transmission between CH1 and Helper1 at T3. The above is cooperative jamming. Since the transmitting power of the jamming signal is limited, the packet transmission will not be affected.
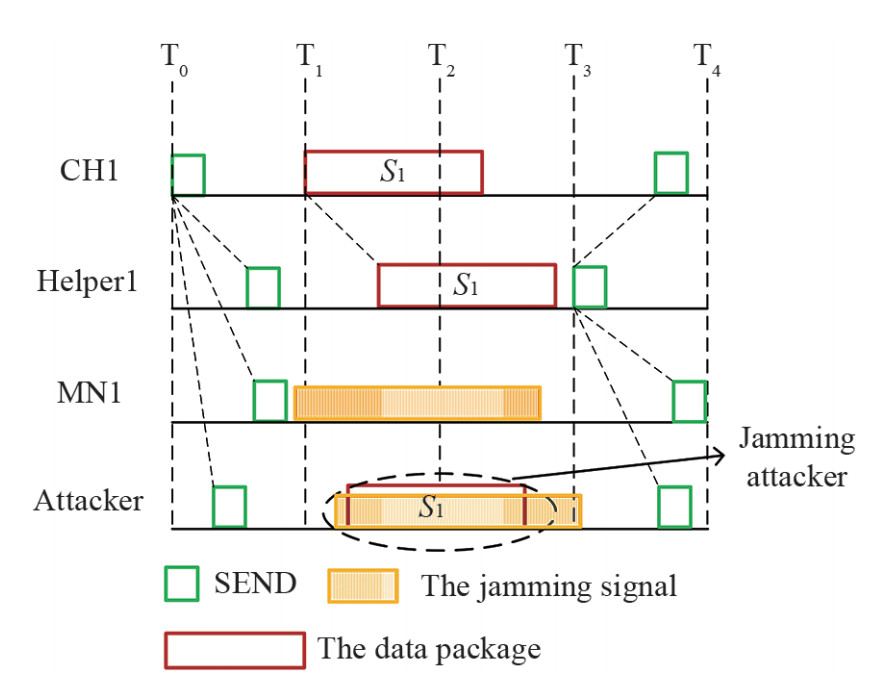 Figure 8 Time slot diagram of cooperative jamming
4.3 Analysis of performance
The secrecy capacity (SC) is developed to evaluate the secrecy performance, which could be defined as the gap between the channel capacity from the source to the destination and the channel capacity from the source to the eavesdropper. Besides, the secrecy outage probability (SOP) is another indicator to measure the security of networks and can be defined as the probability that the secrecy capacity drops below a given threshold rate (Pairs, 2014). In this paper, to evaluate the effectiveness of the cooperative jamming scheme, we take the packet transmission between CH and Helper1 as an example to analyze the secrecy capacity of the cluster and the average SOP of Attacker.
$${y_{{\rm{CH}}}} = \sqrt {{P_0}} {h_{{\rm{CH}}}}S + {n_{{\rm{CH}}}}$$ (23) where PCH is the transmitting power from CH to Helper1, hCH is the channel gain between CH and Helper1, and S is the packet. nCH is the white Gaussian noise, nCH~(0, δCH2).
Based on the Shannon-Harley theorem, the mutual information available at Relay1 is
$${C_{{\rm{CH}}}} = {\log _2}\left({1 + \frac{{{P_0}h_{{\rm{CH}}}^2}}{{\delta _{{\rm{CH}}}^2}}} \right)$$ (24) The signal received at Attacker can be expressed as
$${y_{{\rm{CA}}}} = \sqrt {{P_0}} {h_{{\rm{CA}}}}S + \sqrt {{P_X}} {h_{{\rm{MA}}}}J + {n_{{\rm{CA}}}}$$ (25) where hCA is the channel gain between CH and Attacker, and nCA is the additive noise. J is the jamming signal, and hMA is the channel gain between Helper1 and Attacker.
The mutual information available at Eve is
$${C_{{\rm{CA}}}} = {\log _2}\left({1 + \frac{{{P_0}h_{{\rm{CA}}}^2}}{{{P_X}h_{{\rm{MA}}}^2 + \delta _{{\rm{CH}}}^2}}} \right)$$ (26) The SC is
$${C_S} = {C_{{\rm{CH}}}} - {C_{{\rm{CA}}}}$$ (27) We assume that the underwater channel is k-u shadowed Fading. According to Zhou et al. (2020), the SINR of the signal heard by EVE is SINRCA during the communication between CH and Helper1, and its SOP is
$$\begin{array}{l} {P_{{\rm{outCA}}}} = \Pr \left({{C_{{\rm{CA}}}} \leqslant {C_{{\rm{th}}}}} \right) = \Pr \left({{\rm{SIN}}{{\rm{R}}_{{\rm{CA}}}} \leqslant {\rm{SIN}}{{\rm{R}}_{{\rm{th}}}}} \right)\\ \;\;\;\;\;\;\;\; = \frac{{{\mu ^\mu }{m^m}{{(1 + \kappa)}^\mu }}}{{\Gamma (\mu){{(\mu \kappa + m)}^m}}}{\left({\frac{{{\rm{SIN}}{{\rm{R}}_{{\rm{th}}}}}}{{{\rm{SIN}}{{\rm{R}}_{{\rm{CA}}}}}}} \right)^\mu } \end{array}$$ (28) where κ, μ, m are the parameters and SINRth is the SINR threshold.
5 Simulation and experiment
In this part, we introduce the results of the simulation and the experiment. In the simulation and experiment, an 8 – 16 FSK communication system with center frequency fc=25 kHz, bandwidth B=10 kHz and symbol duration Δt=40 ms is considered. 8–16 FSK is a multi-carrier modulation where each symbol consists of signals on 8 sub-carriers and each signal is created by 16 FSK. In this paper, we choose the LFM as the probe signal of IDENTITY with a duration of 50 ms.
5.1 Simulation
In Figure 9, CH is set at the center of the network. Helpers and MNs are randomly distributed in the cluster. In the simulation, we evaluate our authentication approach using real channel simulations obtained through the Bellhop framework, an established ray-tracing tool for simulating acoustic propagation under water. It is assumed that the bottom sediments are mostly sandy and the sound speed profile decreases almost linearly from 1 520 m/s (sea level) to 1 510 m/s (seabed). Figure 10 shows the sound-ray diagram of the simulation. In order to verify the performance of the proposed scheme in time-varying channel, the movement of nodes and the variation of SNR are considered in the simulation. When the location of nodes changes, the time interval and power of the signals from the different paths will change. When the transmitting power of signals changes, the SNR of the received signals will change. It is assumed that for two adjacent authentications, the location of MNs will change. In one authentication process, the time is short and the positions of nodes are unchanged. Some of the relevant parameter settings are shown in Table 2.
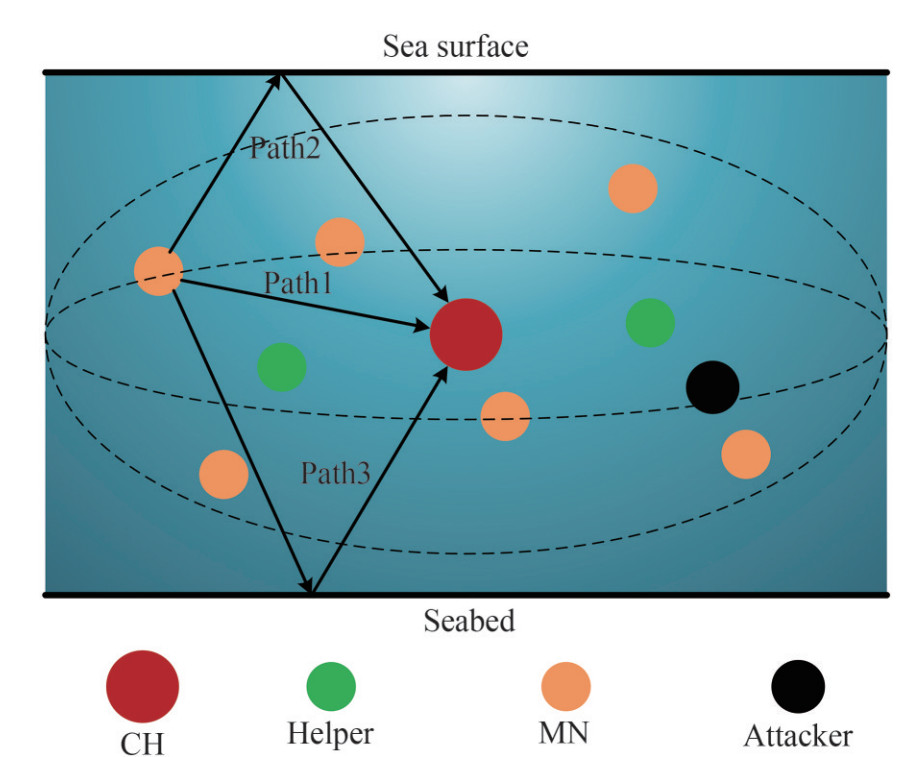 Figure 9 Network model in simulation
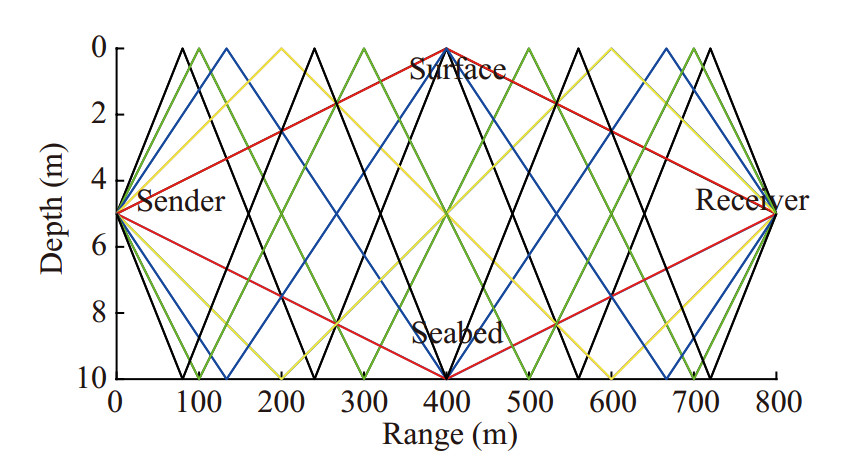 Figure 10 Sound-ray diagramTable 2 Parameter setting
Parameter names Values Scale of monitoring space (km3) 1×1×0.1 Nodes' maximum transmission range (km) 1.0 km Numbers of MNs in a cluster 6 Placement of MNs Random deployed Total bandwidth (kHz) 10 In order to verify the performance of the node authentication proposed in the work (called CA), the false alarm rate Pfa and the detection rate Pd of four methods, CA, ARTMM (Han et al. 2015), ANFIS (Arifeen et al. 2019), and MTRRS (Zhao et al. 2022) are compared in the same environment. ARTMM and ANFIS can judge whether nodes are legal by analyzing the packet forwarding rate, bit error rate, and energy consumption rate. MTRRS identifies nodes by comparing TRRS. To verify the performance of the cooperative jamming proposed in the work (called CA), four schemes, CA, no jamming scheme (NJ), random jamming scheme (RJ) and self-protection jamming scheme (SJ) (Huang et al. 2016) are compared in terms of the SC of network and the SOP of Attacker. In NJ, there is no jammingsource in the network. In RJ, one MN is randomly selected as the jamming source to interfere with Attacker and the transmitting power of jamming signals is P0. In SJ, during the transmission between two nodes, the receiver interferes with Attacker as the jamming source and the transmitting power of jamming signals is P0. Neither RJ nor SJ knows the location of Attacker.
In the simulation, in order to study the influence of SNR on the performance of node authentication, the noise power is assumed to be 70 dB, and the average SNR of all received signals can be controlled by changing the maximum transmission power P0. The SNR of the received signals at 1 km is selected to represent the average SNR of the cluster. To study the performance of node authentication when nodes move with the ocean current, assuming that the position of CH and Helpers is almost unchanged, the change of the MNs' position in two adjacent authentications is used to represent the moving speed of MNs relative to CH. When calculating the TDs of nodes, α and β are set to 1/3 to comprehensively consider the influence of the three trust evidences. In order to comprehensively consider the influence of the historical TD and new TD, δ is set to 0.5.
5.1.1 TRRS, TV versus SNR
Figure 11 shows the TRRS, TV of MNi and Attacker under different SNR. It can be found that compared with MNi, Attacker has less TRRS and TV because of the difference of the channel. Besides, Attacker will destroy the communication by transmitting false packages or refusing to forward the received packages, which will lead to the drop of TV. Therefore, TRRS and TV can be used in node authentication. And by choosing an appropriate threshold TVth, the probability of successful detection can be increased. In the simulation, TVth is set to 0.75. Compared with TRRS, TV changes less when SNR changes due to historical TV and trust redemption. Therefore, the reliability of TV is higher than TRRS.
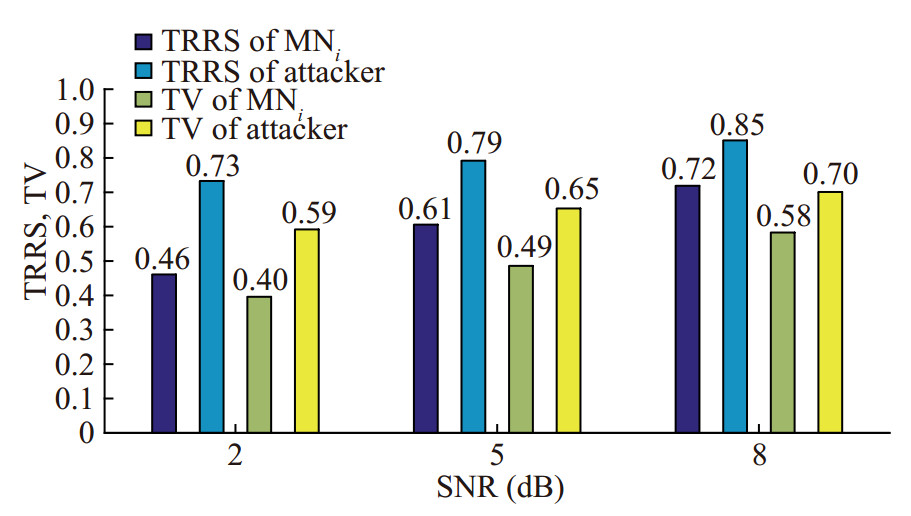 Figure 11 TRRS, TV versus SNR
5.1.2 Pfa versus SNR
Figure 12 shows the relationship between the false alarm rate Pfa and SNR. Nodes move at a speed 0.05 m/s. It can be found that when SNR of the received signals rise, TRRS and the packet forwarding rate will increase, and the bit error rate and energy consumption rate will decrease. Therefore, the TV of nodes will rise and Pfa will decline. It can also be found that when SNR is low, MTRRS, which relies only on TRRS, has a higher Pfa than the other three schemes. This can prove that TRRS is not reliable enough in the time-varying channel, resulting in a higher Pfa of CA than of ARTMM. Compared with ANFIS, both CA and ARTMM consider the historical TV when calculating TV, which can reduce Pfa to some extent.
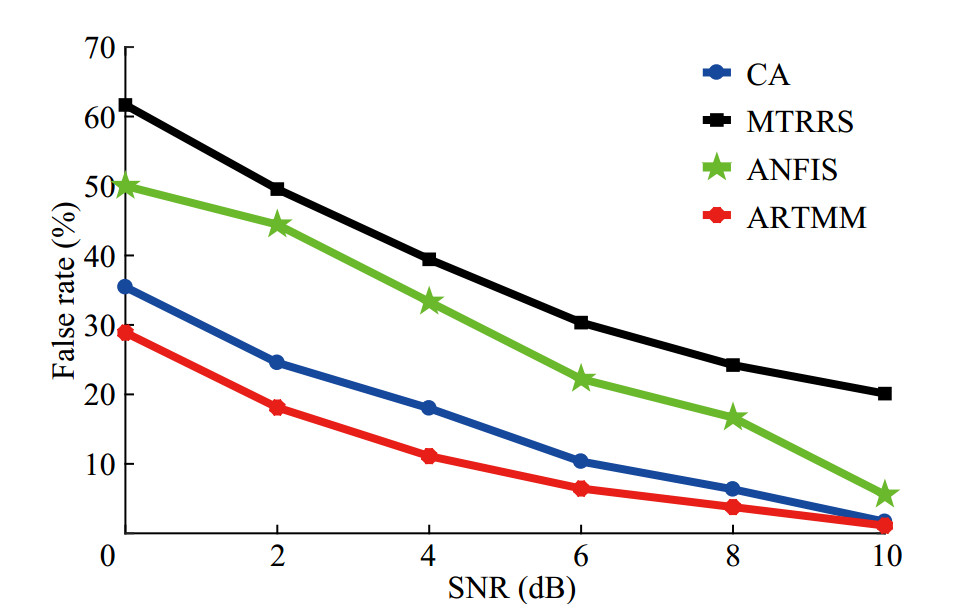 Figure 12 Pfa versus SNR
5.1.3 Pfa versus speed
Figure 13 shows the relationship between the false alarm rate Pfa and the speed of nodes movement. The SNR is 5 dB. The time interval between two adjacent identifications is set to 20 min. It can be found that with the increase of MNs' speed, the distance between MNs and CH will be farther, the SNR of received signal will be smaller, and the similarity of the received probe signal will be lower, which will lead to the decrease of TRRS and packet forwarding rate, and the increase of bit error rate and energy consumption rate. As a result, Pfa will rise. When MNs move faster, the Pfa of CA and MTRRS with TRRS as the index will be higher than that of ANFIS and ARTMM, indicating that the influence of nodes movement on TRRS is larger than that on other indexes. Compared with MTRRS, CA considers bit error rate, packet forwarding rate and energy consumption rate when identifying MNs. So the Pfa of CA will be lower.
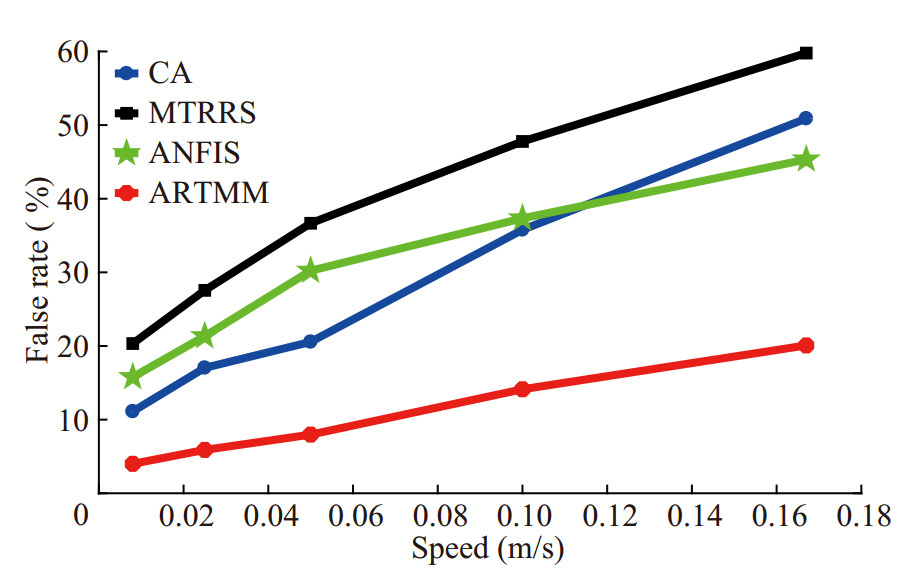 Figure 13 Pfa versus speed
5.1.4 Pd versus SNR
Figure 14 shows the relationship between the detection rate Pd and SNR. The speed is 0.05 m/s. Assuming that the node imitated by Attacker is MNi. It can be found that with the increase of SNR, TRRS and packet forwarding rate will rise andthe bit error rate and energy consumption rate will decrease, thus increasing Attacker's TV and reducing Pd. Since Attacker can choose whether to attack the communication or not, the bit error rate and packet forwarding rate of Attacker will rise only when the attacks are carried out, so the Pd of ANFIS and ARTMM is lower than that of CA and MRTTS. MTRRS uses only the TRRS of CH to calculate TV of Attacker. However, when the distance from Attacker to CH is the same as the distance from MNi to CH, TRRS of Attacker will not decrease significantly. CA considers the TRRS calculated by CH and Helpers, which can increase Pd.
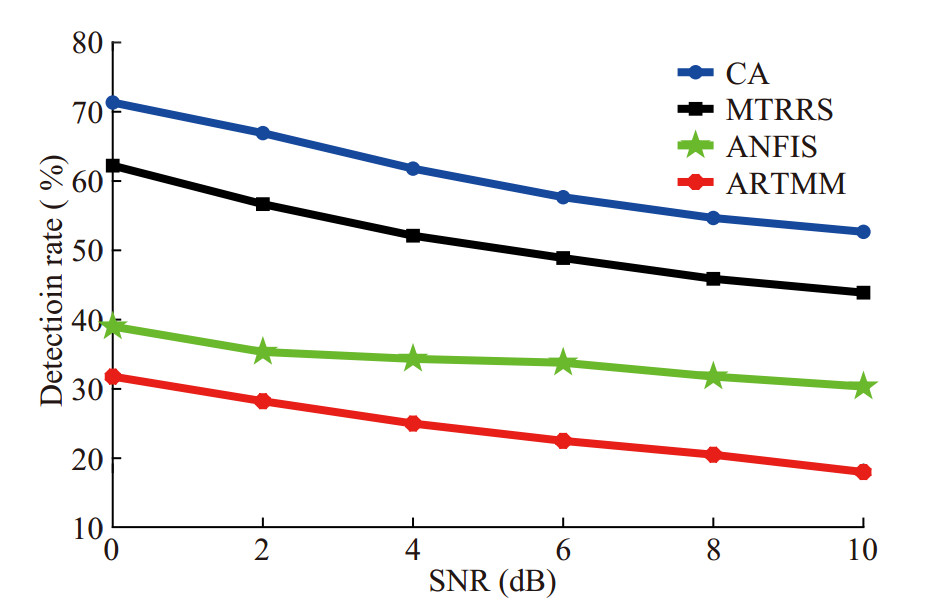 Figure 14 Pd versus SNR
5.1.5 SC versus SNR
Figure 15 shows the relationship between the SC of the cluster and SNR. It can be found that when SNR increases, the secrecy capacity of CA, RJ and SJ to protect packets from being heard by Attacker using jamming signals will rise. However, in NJ, Attacker can easily receive packets of the cluster without jamming signals and the secrecy capacity will decrease. With knowing the transmitting time of packets, SJ can reduce the channel capacity of Attacker by controlling the transmitting time of jamming signals, which makes the secrecy capacity of SJ larger than that of RJ. Without the location of Attacker, in order to ensure the interference to Attacker, RJ and SJ must use P0 as the transmitting power of jamming signals. However, around the jamming source, the communication between legitimate nodes may also be affected. CA selects the node closest to Attacker as the jamming source. Compared RJ and SJ, the transmitting power of the jamming signal is limited, so the packet transmission between legal nodes will not be affected. Therefore, the secrecy capacity of CA is larger than that of RJ and SJ.
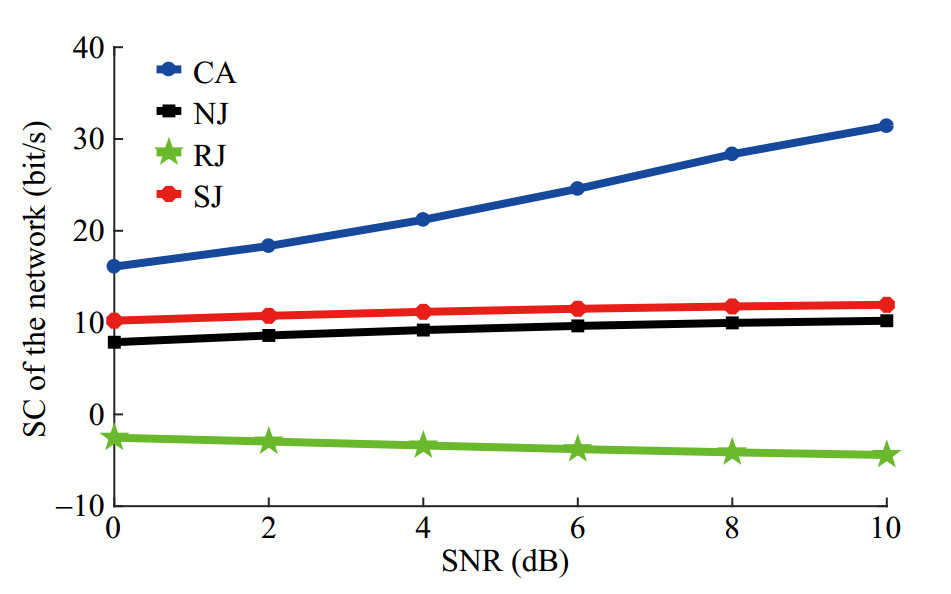 Figure 15 SC versus SNR
5.1.6 SOP versus SNR
Figure 16 shows the relationship between the SOP of Attacker and SNR. It can be found that when SNR increases, the SOP of Attacker in the four schemes will decrease. Compared with NJ, CA, RJ and SJ can reduce the probability of Attacker to obtain packets ofthe network with jamming signals. Compared with RJ, CA selects the node closest to the Attacker as the jamming source, which increases the average power of jamming signals received by Attacker and reduces the SOP of Attacker. SJ selects the receiver to interfere with Attacker. Compared RJ and CA, with knowing the transmitting time of packets, SJ can further reduce the SOP of Attacker by controlling the transmitting time of jamming signals.
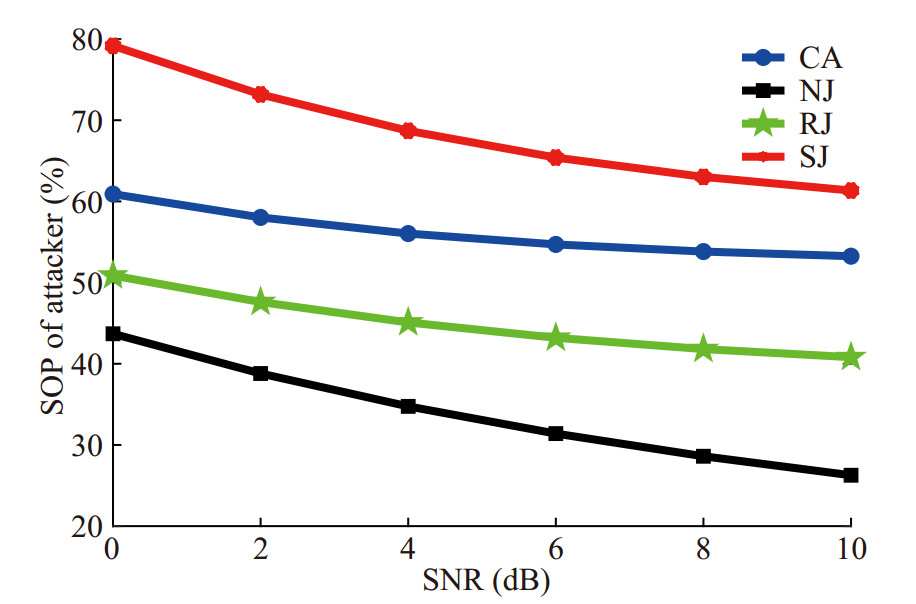 Figure 16 SOP versus SNR
5.2 Experiment
To verify the effectiveness of proposed scheme, the experiment was carried out in May 2022 off the coast of Tianjin, China. The water depth was about 10 m. In the authentication experiment, we collected and analyzed the signals received by CH from Attacker and MN to calculate the TV. In the jamming experiment, we placed four nodes to simulate the situation of jamming Attacker during the communication between CH and MN. Figure 17 shows the locations and the distances of the four nodes. Helper was closer to Attacker than MN. All nodes were deployed at a depth of 3 m. The transmitting power of all signals was around 170 dB. Figure 18 shows the CIR of the experiment. When the distance between the sender and receiver was 1 km, the time interval between the main channel and the second channel was about 4 ms, and the time interval between the main channel and the third channel was about 8 ms.
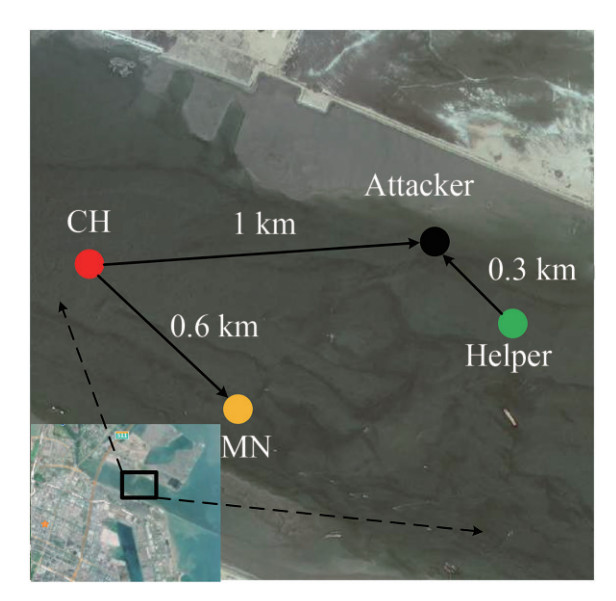 Figure 17 The Deployment of all nodes in the experiment
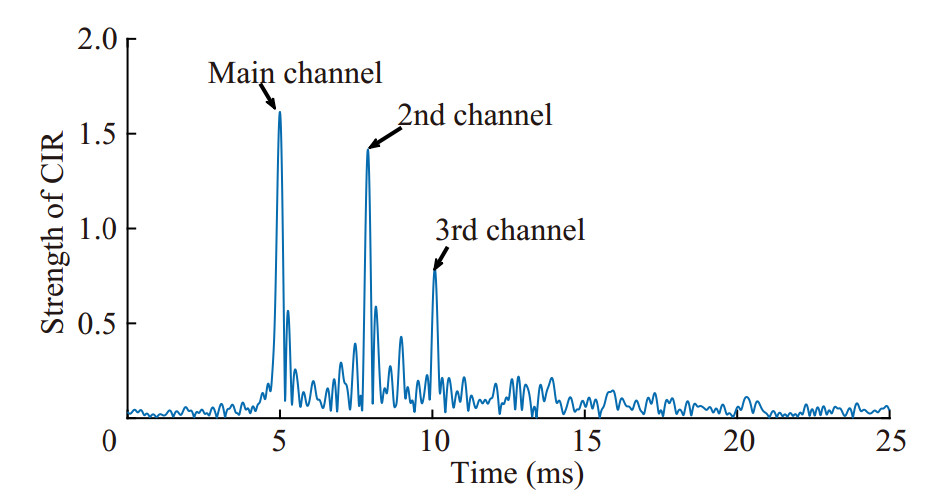 Figure 18 The CIR of experiment
5.2.1 Authentication experiment
Figure 19 shows the TRRS of the two signals transmitted by MN with 20 minutes interval. Figure 20 shows the TRRS of the two signals 20 minutes apart from MN and Attacker. The SNR of these received signals is about 8 dB. It can be found that due to the difference of the channel, the TRRS of the two signals from MN and Attacker is less than the TRRS of the two signals from MN, which can prove the validity of the authentication based on TRRS. Besides, in the experiment, the TV of MN is about 0.83, and the TV of Attacker is about 0.62, which can prove the effectiveness of our scheme.
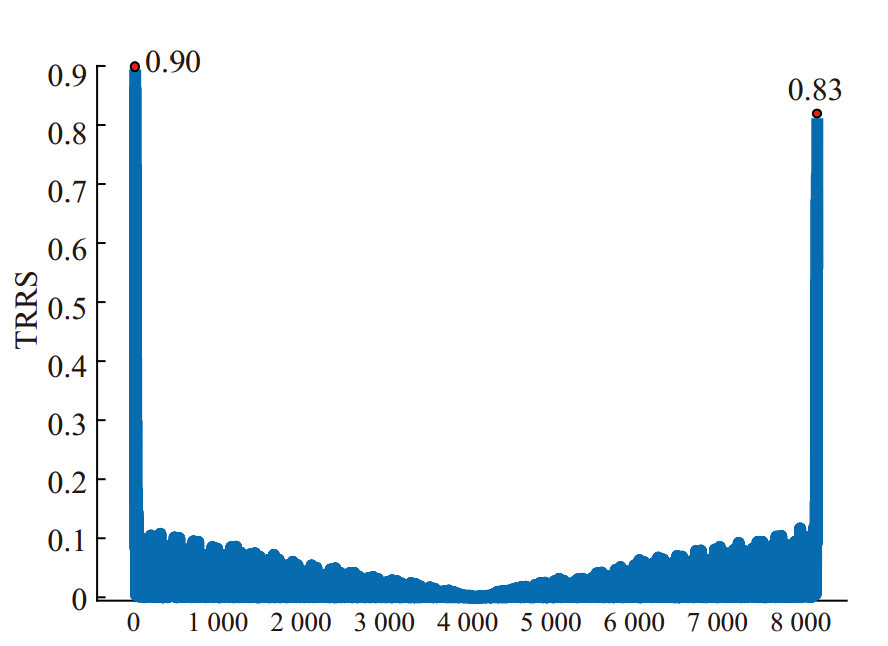 Figure 19 TRRS of MN
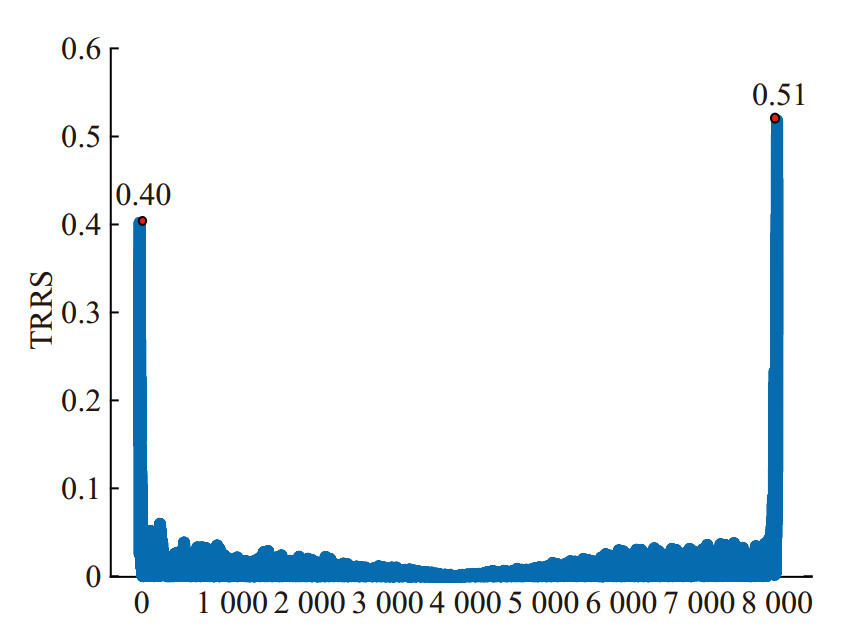 Figure 20 TRRS of Attacker
5.2.2 Jamming experiment
In the jamming experiment, firstly, Helper sent the jamming signal, which is a fake message. Then, CH sent the protected signal S. During this process, we observed the time domain figure and recorded bit error rate of Attacker. Figure 21 below is the time domain figure of the signals received at Attacker. The blue color is the jamming signal. The black color is the symbols of S, which might be decoded by Attacker. It can be found that due to the closer distance between Helper and Attacker, the power of the jamming signal was higher than that of S, which can affect Eve's judgment of some symbols of S and cause Eve to wrongly decode the symbols. In order to visually verify the influence of the jamming scheme, the signal S used in the experiment consists of 20 symbols with the same information, without considering the bit error due to the sequential error of symbols. When there is no jamming signal, the bit error rate is about 7%. In the jamming experiment, the bit error rate is about 45%
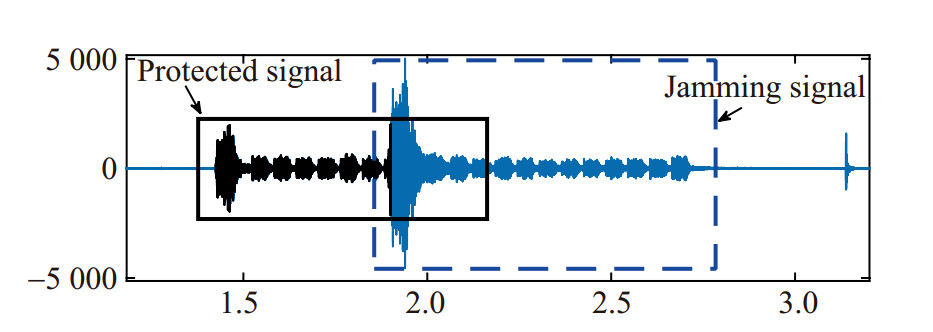 Figure 21 Time domain of the signals received at Attacker
6 Conclusion
We present a Cooperative Jamming Scheme based on Node Authentication for UASNs, aiming to improve the security of the networks. Referring to trust management mechanism and CIR-based authentication, we designed a new authentication method. In a cluster-based UASNs, CH will calculate TV according to three kinds of evidence: channel-based trust evidence, behavior-based trust evidence, and energy-based trust evidence, to identify all nodes of the network. When the TV of a node iswas lower than the threshold, the node will be regarded as an illegal node. For the illegal node, CH will select the nearest node from the neighbor nodes as the jamming source. In the simulation and experiment, by comparing our scheme with other methods of node authentication methods, we proved the effectiveness and stability of our scheme in time-varying channel. By comparing our scheme with other methods of cooperative jamming, we proved that our scheme can improve the secrecy capacity of the network and the average SOP of Attacker.
-
Figure 1 Network model
Figure 2 The Structure of Node Authentication
Figure 3 The Network of Node Authentication
Figure 4 The Structure of IDENTITY Packet
Figure 5 Node communication system
Figure 6 The Model of Behavior-based Trust Evidence Collection
Figure 7 Network of cooperative jamming
Figure 8 Time slot diagram of cooperative jamming
Figure 9 Network model in simulation
Figure 10 Sound-ray diagram
Figure 11 TRRS, TV versus SNR
Figure 12 Pfa versus SNR
Figure 13 Pfa versus speed
Figure 14 Pd versus SNR
Figure 15 SC versus SNR
Figure 16 SOP versus SNR
Figure 17 The Deployment of all nodes in the experiment
Figure 18 The CIR of experiment
Figure 19 TRRS of MN
Figure 20 TRRS of Attacker
Figure 21 Time domain of the signals received at Attacker
Table 1 List of acronyms and abbreviations.
CH Cluster head MN Member node Attacker Illegal node Helper Auxiliary node TD Trust degree TV Trust value IDENTITY The signal containing MNs' information AUTHEN The signal containing TDs of MNs NOTICE The signal when finding Attacker FIND The signal sent by Attacker's neighbor nodes CHOICE The signal after finding the jamming source SEND The signal used in the jamming scheme P0 The maximum transmitting power TRRS Time-reversal resonating strength Table 2 Parameter setting
Parameter names Values Scale of monitoring space (km3) 1×1×0.1 Nodes' maximum transmission range (km) 1.0 km Numbers of MNs in a cluster 6 Placement of MNs Random deployed Total bandwidth (kHz) 10 -
Arifeen MM, Islam AA, Rahman MM, Taher KA, Islam MM, Kaiser MS (2019) ANFIS based trust management model to enhance location privacy in underwater wireless sensor networks. 2019 international conference on electrical, computer and communication engineering (ECCE), Cox's bazar, bangladesh. Doi: 10.1109/ECACE.2019.8679165 Chen Y (2014) Time-Reversal Wireless Paradigm for Green Internet of Things: An Overview. IEEE Internet of Things Journal, 1(1), 81-98. Doi: 10.1109/JIOT.2014.2308838 Diamant R, Casari P, Tomasin S (2019) Cooperative authentication in underwater acoustic sensor networks. IEEE transactions on wireless communications, 18(2), 954-968. Doi: 10.1109/TWC.2018.2886896 Han G, Jiang J, Shu L, Guizani M (2015) An attack-resistant trust model based on multidimensional trust metrics in underwater acoustic sensor network. IEEE Transactions on Mobile Computing, 14(12), 2447-2459. Doi: 10.1109/TMC.2015.2402120 Huang Y, Xiao P, Zhou S, Shi Z (2016) A half-duplex self-protection jamming approach for improving secrecy of block transmissions in underwater acoustic channels. IEEE sensors journal, 16(11), 4100-4109. Doi: 10.1109/JSEN.2015.2446465 Liao RF (2020) Multiuser physical layer authentication in internet of things with data augmentation. IEEE internet of things journal. 73, 2077-2088, Doi: 10.1109/JIOT.2019.2960099 Liu J, Refaey A, Wang X, Tang H (2015) Reliability enhancement for CIR-based physical layer authentication. Secur. Commun. Netw, 8(4), 661-671. https://doi.org/10.1002/sec.1014 Liu J, Wang X (2016) Physical layer authentication enhancement using two-dimensional channel quantization. IEEE transactions on wireless communications, 15(6), 4171-4182. Doi: 10.1109/TWC.2016.2535442 Paris JF (2014) Statistical Characterization of κ-μ Shadowed Fading. IEEE Transactions on Vehicular Technology, 63(2), 518-526. Doi: 10.1109/TVT.2013.2281213 Su Y, Ma S, Zhang H, Jin Z, Fu X (2021) A redeemable SVM-DS fusion-based trust management mechanism for underwater acoustic sensor networks. IEEE sensors journal, 21(22), 26161-26174. Doi: 10.1109/JSEN.2021.3117056 Xiao L, Greenstein LJ, Mandayam NB, Trappe W (2008) Using the physical layer for wireless authentication in time-variant channels. IEEE Transactions on Wireless Communications, 7(7), 2571-2579. https://doi.org/10.1109/TWC.2008.070194 Xie N, Chen J, Huang L (2021) Physical-layer authentication using multiple channel-based features. IEEE transactions on information forensics and security, 16, 2356-2366. Doi: 10.1109/TIFS.2021.3054534 Zeng K, Govindan K, Mohapatra P (2010) Non-cryptographic authentication and identification in wireless networks. IEEE Wireless Communications, 17(5), 56-62. https://doi.org/10.1109/MWC.2010.5601959 Zhao R, Khalid M, Dobre OA, Wang X (2022) Physical Layer Node Authentication in Underwater Acoustic Sensor Networks Using Time-Reversal. IEEE Sensors Journal, 22(4), 3796-3809. Doi: 10.1109/JSEN.2022.3142160 Zhou H, He D, Wang H (2020) Joint relay and jammer selection for secure cooperative networks with a full-duplex active eavesdropper. IET Communications, 14(6), 1043-1055. https://doi.org/10.1049/iet-com.2019.1042