Evaluation of the Safe and Failure Zones of Mooring and Riser Systems in a CALM Oil Terminal
https://doi.org/10.1007/s11804-021-00240-z
-
Abstract
The mooring and riser system is the most critical part of an offshore oil terminal. Traditionally, these two parts are designed separately without considering the nonlinear interaction between them. Thus, the present paper aims to develop an integrated design process for riser systems with a lazy-S configuration and mooring systems in the offshore catenary anchor leg mooring (CALM) oil terminal. One of the important criteria considered in this integrated design is the offset diagram and safe operation zone (SAFOP) related to the mooring system and the riser, respectively. These two diagrams are obtained separately by different analyses; therefore, codes or standards are available separately for two components. In this methodology, the diagrams of both risers and mooring lines are incorporated into a single spiral, thus identifying the safe and failure zones of risers and the mooring lines of the oil terminal. This, in turn, leads to substantial benefits in terms of overall system response, cost reduction, and safety to the offshore oil terminal. To implement this process, three different riser lengths with the lazy-S configuration are considered at three different sea depths at the terminal installation site. For each condition, the integrated design of the mooring system and riser is executed according to the derived procedure. Then, coupled dynamic models, wherein both buoys and hoses are included, are developed using OrcaFlex. Results show that the criteria of the relevant regulations are not satisfied by reducing the length of the riser relative to the designed size. Further, as water depth increases, this type of riser configuration shows good coupled performance while interacting with the mooring system. In the cross offset mode, the maximum margin is created between the offset diagram and the SAFOP diagram, while the most critical dynamic response of the tanker and terminal system occurs in the near and far modes. Therefore, with this method, the best position for the riser direction with the tanker direction is 90° in the best case.-
Keywords:
- Catenary anchor leg mooring ·
- Integrated design ·
- Mooring System ·
- Oil terminal ·
- Riser system
Article Highlights• The proposed integrated design is based on the process of extracting the dynamic response of the offshore terminal under real environmental conditions under the environmental conditions of the Persian Gulf region.• The first order-and second-order wave loads (also known as drift and slow-drift forces) which are the driving external loads in mooring behavior are considered for modeling.• The hydrodynamic simulation using ANSYS AQWA is performed to determine the response amplitude operators (RAOs) of the buoys and tankers. -
1 Introduction
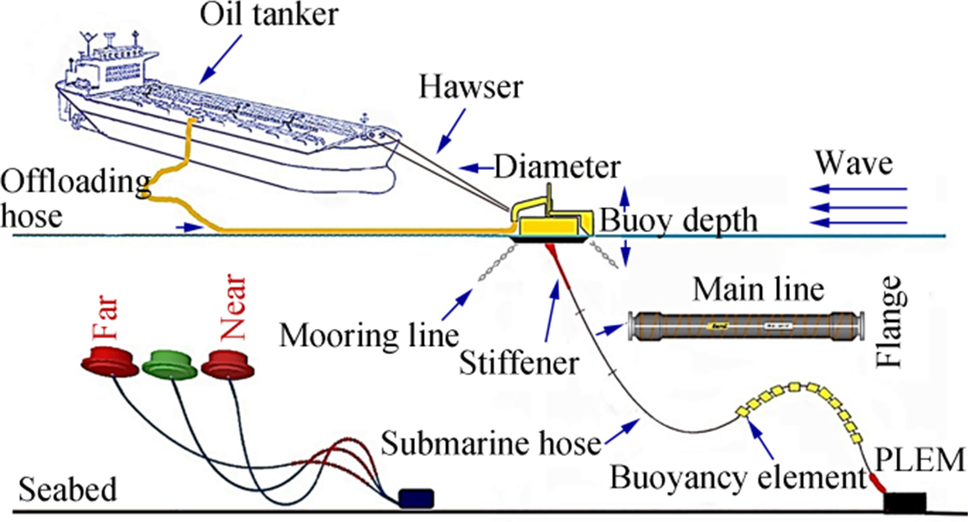
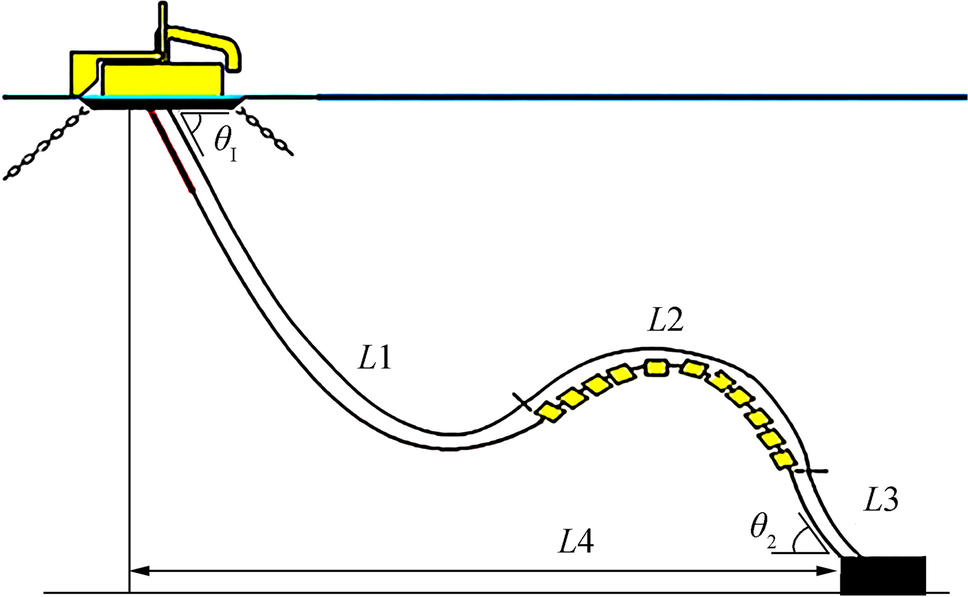
The transport of petroleum products to export destinations is done either through pipeline transport or in oil terminals. Onshore and offshore terminals are the common types of oil terminals. Today, due to the high cost of construction and maintenance, complexity in berthing, dredging issues, and low safety, offshore terminals have received growing interest. The most common type of offshore terminal is the catenary anchored leg mooring (CALM) type. Figure 1 shows a schematic view of the CALM terminal in a lazy-S configuration. A CALM terminal consists of a moored main buoy permanently connected to the seabed via three to six mooring lines. The buoy contains a bearing turntable system that allows the turntable to freely weathervane around the lower part.
The tanker is then connected to the rotating part of the buoy using one or two hawsers. Thus, the tanker can freely rotate around the buoy. This rotating system leads the tanker to orient via the prevailing environmental loads, thus minimizing the loads on the mooring system. The product transfer system is composed of underwater hoses (as risers) that are connected between the mooring part of the terminal buoy and the pipeline end manifolds (PLEM) on the seabed, as well as floating hoses that are located between the tanker and the buoy.
The most important components of a floating CALM terminal are the risers and their mooring system. The riser transports petroleum products from the seabed to the sea surface, while the mooring system is responsible for limiting the horizontal motion of the CALM buoy, thus keeping it within a safe area of operation. It is customary to design the mooring and riser system of these oil terminals separately, using uncoupled analysis tools, without considering the nonlinear interaction between two systems. These components have different design requirements; thus, codes or standards are available separately for riser and mooring systems. It is now widely recognized that the interaction between the hydrodynamic behavior of the tanker and the hydrodynamic/structural behaviors of the mooring lines and risers must be considered using analysis tools based on coupled formulas.
The studies in the current paper are focused on three categories: mooring lines, riser systems, and an investigation into the integrated design of mooring lines and riser systems.
A sensitivity investigation according to quasi-static analysis was conducted, and two different mooring system configurations, namely, single anchor leg mooring (SALM) and catenary anchor leg system (CALM) for wave energy converters (WEC), were compared (Pecher et al. 2014). The analysis aimed to determine what can be expected in terms of requirements for the mooring system size and stiffness. The main influential parameters for design are the horizontal design load, water depth, and mooring design parameter. Results show that the length of the hawser has a significant influence on the maximum motion of the WEC.
A past study has already investigated the comparison of three oil terminals, namely, conventional buoy mooring (CBM), single point mooring (SPM), and single anchor loading (SAL) systems (Rutkowski 2019). This paper aimed to describe the components, compare the three systems, and consider the environmental condition limits for three oil terminals.
Using numerical analysis (Wang et al. 2018), a past study investigated the nonlinear vibrations of a two-dimensional (2D) moored CALM structure under horizontal sinusoidal excitation. Then, the influences of the inclined angle of the mooring cables and different sag-to-span ratios on the responses of the vessels are studied. In their work paper, equations of motions of the mooring lines were developed using the cable elements formulated based on the extended Hamilton principle. Results showed that the inclined angle of the mooring lines and the initial sag-to-span ratio at the static state have a significant influence on the responses of the floating body.
The performance changes of a floating offshore wind turbine (FOWT) with a broken mooring line were investigated by (Bae et al. 2017). One of the three mooring lines was intentionally disconnected from the floating platform at a certain time. After that, mooring line tensions and floating performance were checked. Their result showed that the drift distance with one mooring line broken could be over 700 m, which could be a significant risk to neighboring FOWTs or offshore structures.
The possibility of a mooring system failure was investigated by Olsen (2011). They aimed to evaluate the probability of line failure for a semi-submersible platform as a function of the safety factor. Thus, the probability of failure was evaluated using a model test and the results from the SIMO software. Finally, the two models were compared. Their result that showed the probability of failure for the mooring line, which was evaluated based on the maximum line tensions created by SIMO, was significantly lower than that for the model test results.
Another study proposed a simplified procedure for predicting the global motion of the semi-sub platform (Wang and Xie 2012). This method supposed that the global motion can be divided into three components: the 1st order wave-induced wave frequency (WF) motion, the 2nd order low-frequency wave force-induced low frequency (LF) drifting motion, and the 2nd order mean wave force-induced mean drifting motion and the. Comparisons were conducted among the proposed method, DeepC software, and model test. Their results showed that the proposed simplified method was effective and able to rapidly and accurately predict the global motion of a semi-sub platform.
The first study on hoses was performed by Ziccardi and Robbins (1970), who explored two riser configuration models, namely, the Chinese lantern and lazy-S. Meanwhile, Brady et al. (1974) addressed the forces induced in the hoses using statistical methods. Considering the environmental conditions led to further studies on the hoses connected to the CALM terminal in later years. Eiken (2013) investigated two riser configurations, Lazy wave and Free hanging, with the aim of finding the optimum hose configuration and defining the limiting criteria for this operation.
Qi et al. (2017) investigated the CALM buoy's skirt geometry and its submarine hose system. They built and analyzed three different models to study the skirt dimension and then used the Chinese lantern as a riser configuration. They then performed the hydrodynamic analysis of the CALM buoy using the AQWA software. The resulting RAOs from the previous step were then transferred to the OrcaFlex software. In the OrcaFlex, the oil tanker was connected to the CALM buoy. Results showed that the dimension of the skirt of the CALM buoy has a significant impact on its hydrodynamic properties, such as the heave motion, thus affecting performance in the heave motion control. Results showed that the riser configuration met the requirement according to the rules.
Meanwhile, different types of flexible riser configurations for shallow water were explored by Karegar (2013). Dynamic modeling and analysis were performed using the OrcaFlex software package to obtain the structural responses. Then, they enumerated the main challenges for shallow water with harsh environments for flexible risers, including minimum bend radius (MBR), large vessel offset, clearance, and marine growth.
Amaechi et al. (2020) conducted parametric studies to investigate the effects of flow angles and hose hydrodynamic loads on the structural behavior of the hoses connected to the CALM terminal, including effective tension, MBR, and bending moments. Then, hydrodynamic simulations were conducted with ANSYS AQWA software to determine the RAO of the CALM buoy. The RAOs obtained from the previous step were then imported into the OrcaFlex software. The evaluation showed the least curvature of the hose (riser) at the ends due to the stiffness of the reinforced hose end fitting property. Furthermore, the effective tensions, bending moments, and curvatures in the simulations with inline-direction (0° or 180°) and cross-cross direction (90°) were increased and reduced, respectively, if the hydrodynamic loads were considered for the hose.
The interaction between the hydrodynamic behavior of the vessel and the riser should be based on the coupled formulation Det Norske Veritas (2010a). Several studies have been conducted on the integrated design of the riser and mooring line (Cruces Girón et al. 2012; Girón et al. 2013, 2014).
An integrated design methodology for risers and mooring systems was proposed in a previous study (Girón et al. 2014). In that study, SAFOP (safe operation for riser) and offset diagrams were compared and illustrated by plotting both diagrams in the same graph comprised by the envelope of maximum vessel excursions for the mooring line. This allowed for a visual evaluation of the design criteria for both the riser and the mooring system. Risers should meet their design criteria, which are conditioned and constrained by the mooring system. The proposed methodology showed positive characteristics for mooring lines and risers. This enabled the interaction of the design teams, thereby contributing to gains in efficiency and cost reduction of the final project
Most studies have considered separate design criteria for each component, including riser and mooring systems, in accordance with the regulations. However, this is not a realistic view of design because these two components interact with each other. In this context, few studies have been conducted, and thus far, no study has applied an integrated design in floating oil terminals.
Related to the above, previous studies have shown that the integrated design of risers and mooring lines can be of great importance for oil terminals. This is because the riser is one of the most important parts of CALM oil terminals when loading shuttle tankers.
The riser is responsible for the transport of products from the seabed to the sea surface. If there is a problem with the riser, the operation will stop. As a result, risers must be designed with a high level of safety. In these terminals, the riser is subjected to the maximum force when its top connection with the terminal buoy moves away from the initial position due to the displacement. Therefore, it is important to determine the safe operation zone (SAFOP) and the corresponding operating area of failure for these risers. Then, they are compared with the maximum terminal offset that depends on the design of the mooring system. However, the maximum terminal displacement should not exceed the value specified for the SAFOP. Thus, in this paper, an integrated design method is used for the mooring line system and riser for the oil terminal, and the effect of water depth and riser length on the SAFOP is investigated. This work also specifies which area would be the best position for PLEM to be located and which would create more margin between the SAFOP and maximum terminal displacement during operation if the tanker is connected.
2 Design Methodologies for Integrated Design
Traditionally, the mooring line and riser in oil terminals are designed separately, and the nonlinear interaction between them is not considered. In such an uncoupled design, the visual assessment of the design criteria for both the mooring system and risers in all directions cannot be performed. In comparison, using a coupled design can lead to substantial benefits in terms of overall system response cost reduction and safety to the offshore oil terminal
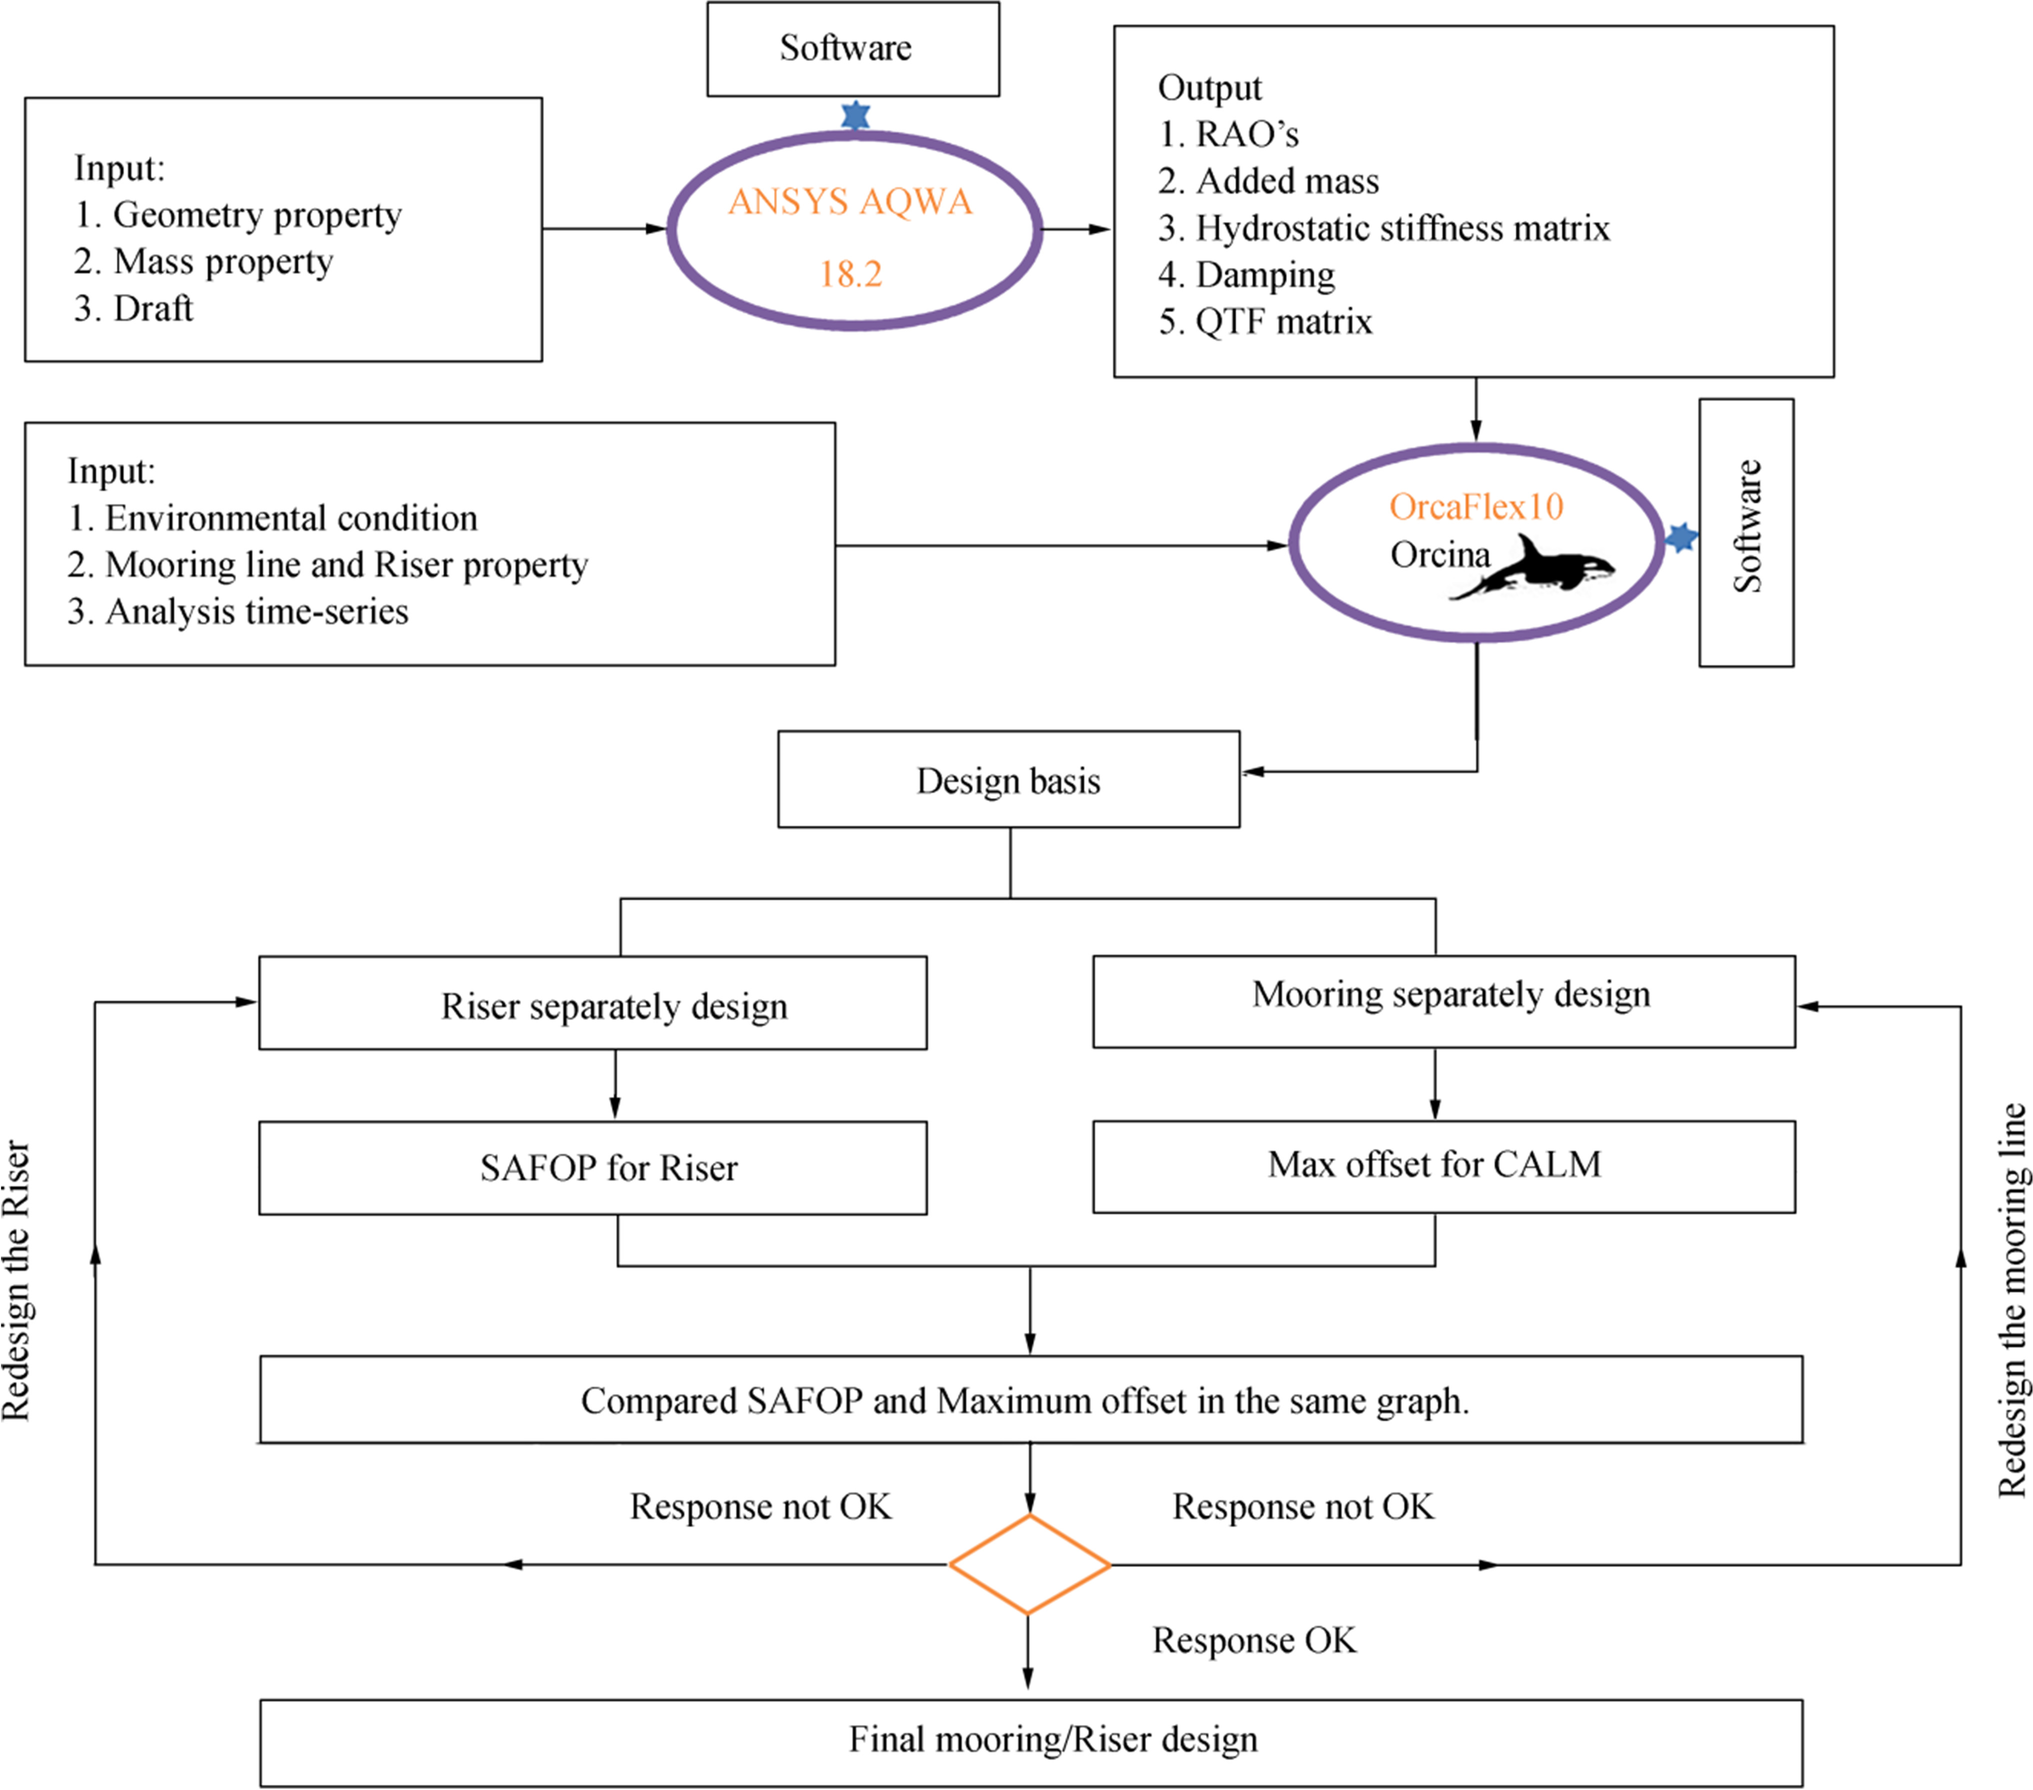
Thus, for a coupled design, in the first step, the riser and mooring system are designed separately using uncoupled models, as described in Figure 2. Then, for the mooring system, an intact and damage offset diagram is created, after which a SAFOP is created for the riser. Therefore, it is necessary to compare the SAFOP with offset diagrams for the mooring system in order to determine the integrity of the riser in all directions and identify the safe and failure zones of risers and mooring lines.
The SAFOP of risers is a diagram that defines the horizontal displacement range in which the connections of the top and bottom of the risers (the most critical points of the risers) are in a safe position so that no riser exceeds its design standard. At this stage, analyses are conducted to simplify and calculate an uncoupled design without a connected mooring line. In this stage, the CALM buoy oscillates harmonically about the primary position so that only the riser is connected, and the mooring line system has no effect on the response DNV-RP-C205 (2010). Studies have been conducted to determine the SAFOP range of risers for use in mooring design (e.g., Girón et al. 2014). Typically, the initial design of a riser includes a cross-sectional configuration, material selection, and general configuration definition. This step includes analysis with numerical models in which all design criteria are considered. The SAFOP diagram can be used as an initial indication of a riser directional involvement in all load cases. The SAFOP chart is evaluated separately for each riser. One curve is obtained for each riser, and all the curves obtained from all the risers are superimposed on top of each other until a single diagram is obtained for all risers. The criteria that indicate a failure in the riser can be defined as high-angle violations, top and bottom effective tension, compression, interference, and other criteria related to the type of risers, such as minimum bending radius (MBR) and torsion for flexible risers or Von Mises for steel risers. An appropriate safety factor must be considered for each criterion used. Other examples of extra criteria for the lazy-S riser would be the contact of the sag-bend region with the seabed. To determine the SAFOP, the analysis strategy begins with a static analysis for each riser. Then, for each direction of the project, a prescribed offset is incrementally applied to the top riser connection.
When the first design criterion for the riser is violated, the simulation for the riser is stopped, and the displacement corresponding to the connection above the riser is determined. In static equations, the riser configuration is specified. After static analysis, the dynamic analysis begins with an incremental reduction applied to the top riser connections. Notably, the criteria that are satisfied in the static analysis for the riser may be violated in the dynamic analysis.
The initial design of the mooring system includes the choice of materials and general configuration specifications. This step involves analysis using numerical models in which all relevant design criteria are considered. The offset diagrams for the mooring line consist of the envelope of maximum horizontal of oil terminal excursions. These offset diagrams are generated for all given directions by performing a coupling model consisting of buoys and mooring lines for which dynamic analyses are performed under non-collinear and collinear combinations of wind and irregular wave loads. Then, the extreme offset values are determined for each combination according to the time history obtained. At this stage, the load cases must be different combinations of the wave, current, and irregular waves according to the design codes recommended. However, for environmental loading, all directions of occurrence (at least eight directions) must be considered. In environmental loading, not only should a collinear combination of the current, wind, and wave be considered, but some non-collinear combinations should also be considered (e.g., wave towards the unit's bow (0°) considering current misaligned at ± 45 relative to wave and wind 30 relative to the waves). Given that the codes suggest that damage conditions be considered for the mooring line analysis, the failure of one or more mooring lines should be taken into account. For these conditions, all load combinations must be evaluated, and an offset diagram should be drawn for it. The trend in this condition is similar to that in the intact condition. In the case of damage, the mooring is removed, thus inducing the maximum force. Eventually, the maximum displacement increases.
Finally, the two graphs (including the SAFOP for the riser and offset diagrams for the mooring system, which were already derived) were compared by plotting in the same graph. This comparison allows us to conduct a visual assessment of the design of the riser and the mooring line. The results obtained from these two graphs are used in the following two cases:
1) Directions where the safe operating area of the riser is inside the floating offset. In this case, the integrity of the risers is not satisfied, and the steps have to be redesigned because the mooring lines cannot place the riser system in a safe area. Thus, the mooring system must be redesigned to reduce compensation.
2) Directions where the offset points are farther away from the SAFOP boundary. This indicates that we should redesign the riser to reach a more economical solution or modify the mooring system to achieve more offset. Of course, if any of the systems are modified, the diagrams for each of them must be modified again.
To simulate the operational scenarios of unloading and loading the tanker and the offshore terminal, two software, including ANSYS AQWA 18.2 and OrcaFlex 10, were used. Furthermore, for analyzing the mooring system and riser, it is necessary to extract the dynamic characteristic of the CALM terminal and tanker, which can be done numerically. The modeling procedure is shown in Figure 2. The ANSYS AQWA 18.2 software was used in the present work to calculate the response amplitude operators (RAO), added mass, stiffness matrix damping, and QTFs, because these parameters cannot be calculated by OrcaFlex. Then, the continuation of modeling is done in OrcaFlex software because the ANSYS AQWA software is not able to model the flexible riser. The dynamic properties derived are used as inputs in the Orca Flex 10.0 software package. In addition, other parameters, including the characteristics of mooring lines and risers, different environmental loads, and performed static and dynamic analysis, can be identified in this software. OrcaFlex calculates the vessel motion in all six-degrees-of-freedom (DOF), based on wave first and second order, along with loads from any lines or other objects that are attached to the vessel.
The value of ocean data, such as wind, wave, and current load in the same direction for the offshore location, should be considered for at least eight directions. Therefore, for this analysis, the environmental conditions of the Persian Gulf region, with a water depth of 50 m (Table 6), was used. For the case study, irregular waves, current, and wind were considered. Some simplifications were also made, e.g., the wind was represented by a constant velocity, and the current was represented by a triangular profile with a given surface velocity. The selection of load cases for analysis and simulation should be based on creating a maximum offset in the buoy, thereby creating maximum effective tension in the mooring system. Table 7 presents the possible load cases in the dynamic analysis.
3 Modeling the Coupled CALM Oil Terminal
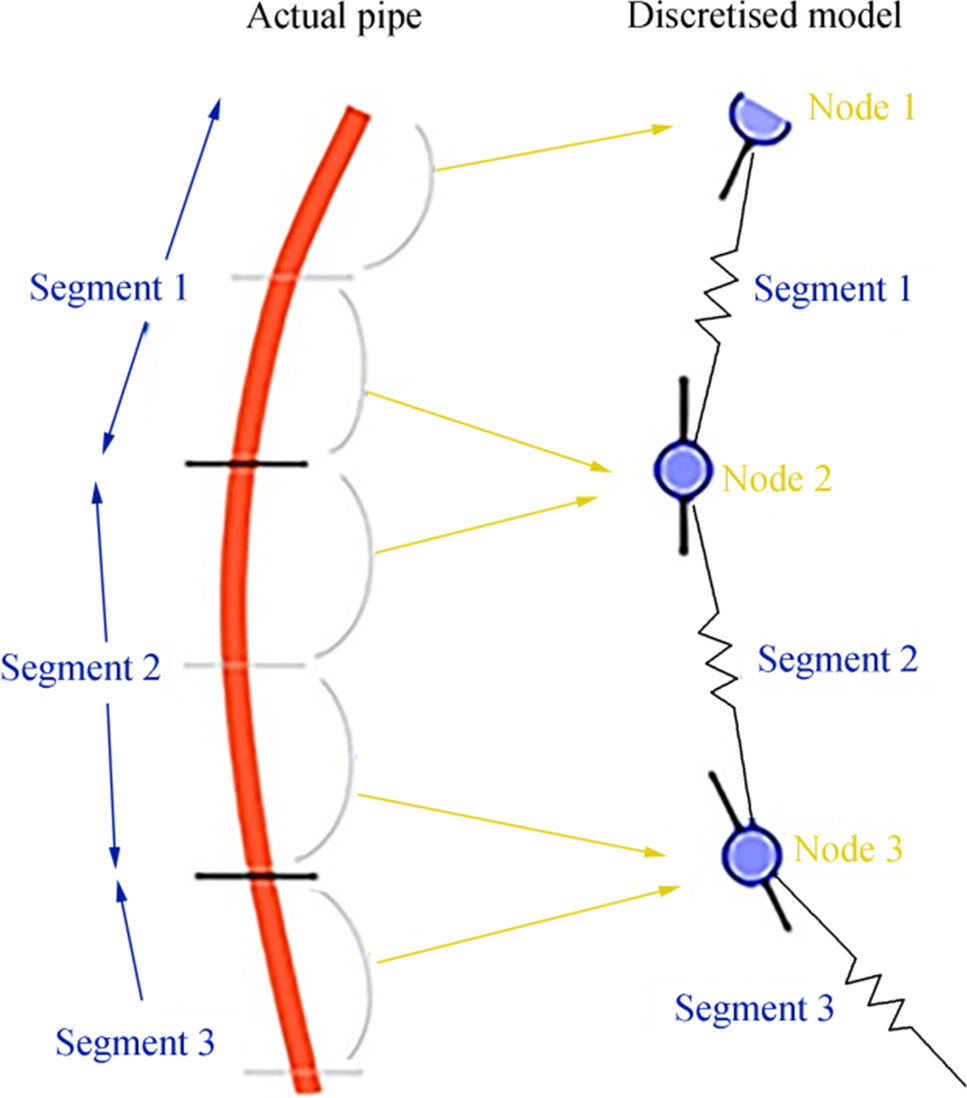
The finite element (FE) model in OrcaFlex includes the modeling of riser parameter, mooring parameter, and vessel. OrcaFlex performs global static and dynamic analyses, including boundary conditions, such as a buoy and some vessels. It also models FE lines in which the mooring lines and risers are defined as lines. OrcaFlex uses an FE model for a line, as shown in Figure 3. Here, the lines are divided into a set of segments by straight massless segments that are placed at both ends of the node. The segment model models only the axial and torsional features of the line. Other properties (mass, weight, buoyancy, etc.) are all concentrated in the nodes, as already stated.
In this context, coupled analyses were performed on the CALM buoy and hoses to investigate the structural efficiency of both loads, including buoy motion and hydrodynamic loads. A parametric study was then conducted to evaluate the strength of submarine hoses. Using ANSYS AQWA, hydrodynamic simulations were performed to obtain RAOs for the CALM vessels and tankers. The RAOs obtained in the previous step were imported into the OrcaFlex software. The floating and tanker hydrodynamic model created in ANSYS AQWA is shown in Figure 5. The diffraction/radiation method was employed to solve the 3D problem AQWA (2014).
The wave loads can be expressed on a buoy/tanker motion as a sum of the first- and second-order terms. The linear first-order terms are the largest. The second-order terms are nonlinear effects that are generally much smaller but could be significant in some cases.
OrcaFlex uses two different types of RAOs, namely, displacement RAOs and waves load RAOs. The displacement RAOs are for when the riser is connected to the buoy, and the goal is to determine the forces created in the riser by moving the vessel in different directions, such as far, near, and cross. In this case, the vessel moves harmonically, in all six DOF, about its primary position. First-order loads are known as load RAOs. They define the first-order wave force and moment on the vessel due to waves of given amplitude and period. The mean wave drift load is induced by the steady component of the second-order wave loads. The determination of mean drift load requires motion analysis, e.g., model testing results or radiation or diffraction theory. These motions are induced by low-frequency components of second-order wave forces. The low-frequency motions of a surge, sway, and yaw can be substantial, particularly at frequencies near the natural frequency of the system.
A mesh convergence study was performed based on the buoy model diffraction analysis in the AQWA software. The maximum mesh size of 0.25 m was selected for the buoy with a tolerance of 0.01 m. A maximum mesh size of 0.32 m was selected for the tanker with a tolerance of 0.04 m. ANSYS AQWA controls the mesh for the ocean environment. Based on the maximum mesh size changes in the vessel and tanker, the deviations are very small (less than 6% for CALM and less than 9% for tanker). This study considered changes in surge RAOs for the tanker and CALM buoy, which is acceptable and saves computation time.
The static analysis is the first step in the analysis of configuration design. The static analysis considers loads, such as gravity, current loads, vessel offsets, buoyancy, and internal fluid. The next step after the static analysis in the design method is to perform a dynamic analysis of the system to obtain the global dynamic response. The dynamic analysis aims to predict the extreme response of the flexible riser system and mooring lines for maximum service life. This software can combine different load items, such as current and wave, riser contents, and floating positions and motion (OrcaFlex 2015). Two values of bending stiffness are defined for risers: connection stiffness and stiffness of the body. At both ends of the riser, infinite bending stiffness is given, but the body value is constant.
The equation of motion for moving ships (ships and CALM buoy) is F = ma, where a is the acceleration of an object, and M is the mass of the vessel. For a body with six DOF, the general equation of motion is as follows:
$$ {F}_j=\sum\limits_{j=1}^6{M}_J\ddot{\boldsymbol{A}} $$ (1) The response of the hull can be calculated using a time response analysis for the equation of motion. The general equation of motion for a body in the horizontal plane can be written as Eq. (2):
$$ {\boldsymbol{F}}_{\boldsymbol{h}}=\boldsymbol{M}\ddot{\boldsymbol{A}}+\boldsymbol{C}\dot{\boldsymbol{A}}+\boldsymbol{KA} $$ (2) where Fh is the hydrodynamic exciting force vector of the system, M is the mass matrix, C is the damping matrix, K is the stiffness matrix, A is the motion vector, $ \dot{\boldsymbol{A}} $ is the velocity vector, and $ \ddot{\boldsymbol{A}} $ is the acceleration vector.
To ensure the validity of the model, the results were compared with those obtained from the Persian Gulf oil terminal project. The comparison was performed in the ANSYS AQWA software, as shown in Figure 4.
In this validation, the results are compared in two tanker positions (empty and full tankers) and under two mooring conditions (intact and damaged conditions). The environmental conditions used included the following: waves with a JONSWAP spectrum having a characteristic wave height of 2.6 and a period of 7.5 s, wind with a constant speed of 22 m per second, and current at sea level of 0.7 m/s. All mooring system features were the same. The results of this section are shown in Table 1.
Table 1 Comparison of tension results created in the mooring line between this study and the Persian Gulf projectMooring condition Loading condition This study Persian Gulf project Difference % Intact Full Loaded 2387.6 2252.5 5.6 Alone, without tanker 1020.5 980.9 3.8 Damage Full Loaded 2042.8 1873.9 8.2 Alone, without tanker 821.72 775.2 5.6 As shown in Table 1, the model has good agreement with the results of the Persian Gulf project obtained for the maximum values of tension created in the mooring line.
4 Case Study and Design Criteria
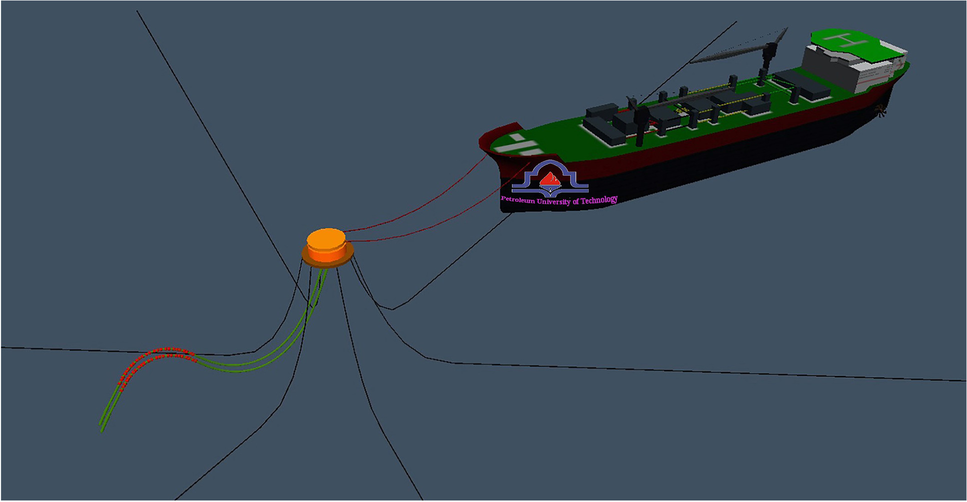
The CALM system consists of one CALM buoy, six mooring lines with piles, two mooring hawsers, and two subsea hoses. The hydrodynamic model created in ANSYS AQWA for the buoy and tanker is presented in Figure 5.
The CALM specifications are considered with the structure created in the Persian Gulf region. The CALM system consists of upper and lower parts, with the lower part attached to the seabed using a mooring line and the upper part connected to the tanker using a hawser. There is a bearing between these two parts to allow the tanker to rotate easily. Table 2 presents the buoy and tanker parameters.
Table 2 Buoy and tanker parametersParameters Tanker CALM Full loading Ballast Draft size (m) 22.6 9.937 3.266 XCOG (m) 170.18 171.04 0 YCOG (m) 0 0 0 ZCOG (m) 17.3 11.62 3.51 Ixx (kg·m2) 8.260E+10 6.564E+10 484E+4 Iyy (kg·m2) 2.35E+12 9.53E+11 484E+4 Izz (kg·m2) 2.35E+12 9.53E+11 935E+4 Main body diameter (m) - - 12.5 Skirt diameter (m) - - 16.63 Buoy mass (t) - - 289980 Height (m) - - 5.3 Length between perpendicular, LBP (m) 320 320 - Breadth molded, B (m) 60 60 - Depth, D (m) 30.5 30.5 - Windage area, AL (longitudinal), surge area (m2) 1155.25 1916.15 29.53 Windage area, AT (Transverse), sway area (m2) 3693.81 7735.04 29.53 Windage area, AT×LBP, yaw area (m3) 1.182E6 2.4752E6 369.12 Displacement (kg) 3.6712E+08 1.4383E+08 - 4.1 Hose
This is a configuration formed by a subsea hose string with distributed floats at the mid and lower sections, called lazy-S in general and some other standards. The parameters for the global design and analysis of riser systems included water depth, rise properties, movement characteristics (offset) of the CALM buoy, and marine environment. The preliminary design of risers (hoses) included a cross-section design and material selection. This material was selected in the current study according to the CALM terminal built in the Persian Gulf region.
The main design parameters were the length of the segment of risers L1, L2, L3, and the horizontal distance from the hang-off point to TDP L4, as shown in Figure 6. The submarine hoses were in the lazy-S configuration (Figure 6). Two submarine hose strings with a length of 118 m were linked to the PLEMs at the bottom and the buoy at the top. The inner and outer diameters of the hoses were 0.500 and 0.620 m, respectively. Their properties are shown in Table 3. The weight and fluid content of the pipeline, the buoyancy, the internal pressure, and the weight of the floats are all considered. The hose was fixed at both ends with a bend stiffener. The density of the fluid (oil) inside the hose was 821 kg/m3, assuming that the conditions inside the hose were fully filled. To model the fluid contents, the uniform content method was used. The drag force coefficient and added mass coefficient of the risers were set at 0.9 and 1.0, respectively.
Table 3 Physical and mechanical properties of the hoseSection length (m) 10.7 Inner diameter (mm) 500 Outside diameter (mm) 620 Bend stiffness (kg·m2) 158 Tension stiffness (kN) 4325.8 Weight in air (empty) (kg/m) 259 Minimum breaking tension (kN) 810 Inner fluid density (kg/m3) 725 Upper catenary length, L1 (m) 72 Buoyancy section length, L2 (m) 28.9 Lower catenary length, L3 13.1 Horizontal distance from hang-off to TDP L4 (m) 81 Total length, L (m) 118 Hang-off angle, θ1 (°) 24 Lower end angle to PLEM, θ2 (°) 67 The possible failure modes and failure mechanisms for the riser included tensile failures, over-bending, compression, interference, and fatigue. The maximum tension should not exceed the allowable tension of the hose, F < Fmax, where F is the maximum tension and Fmax is the maximum allowable tension. MBR can be learned from the hose cross-section design (4 x ID). There must be no axial compression in the flexible pipe in any condition. In this model, between two risers, or risers with a mooring line, no collision should occur in any load cases.
The forces applied to the riser included the buoy motion and hydrodynamic loads. In this case, only first-order waves (displacement RAOs) were used to calculate the vessel motion. Moreover, hydrodynamic loads included the wave, wind, and current.
4.2 Mooring Line
A total of six mooring lines located along the circumferential direction were modeled. The mooring lines were placed 60° apart and had the same property. All mooring lines were built of one section of steel chains in the model. Owing to the permanent type of structure, studless chains were used. Both ends of the six mooring lines were moored to the buoy and the sea bed as catenary moorings. The details of the mooring lines are presented in Table 4. These data were selected according to the CALM terminal built in the Persian Gulf region. The seabed was considered flat, and the hawser was made of fiber rope.
Table 4 Mooring line parametersMooring Nominal diameter (m) 0.095 Mass per unit length (kg/m) 180 EA (kN) 770735 Cm 1 Cd 1.2 Length (m) 436 Hawser Circumference (mm) 128 Length (m) 70 Minimum breaking load (kN) 5883 Hawser quantities 2 The damage condition was considered when the analysis of the response of the structure was required as a result of mooring line failure. Tension limits and equivalent factors of safety for intact and damage conditions are provided in Table 5.
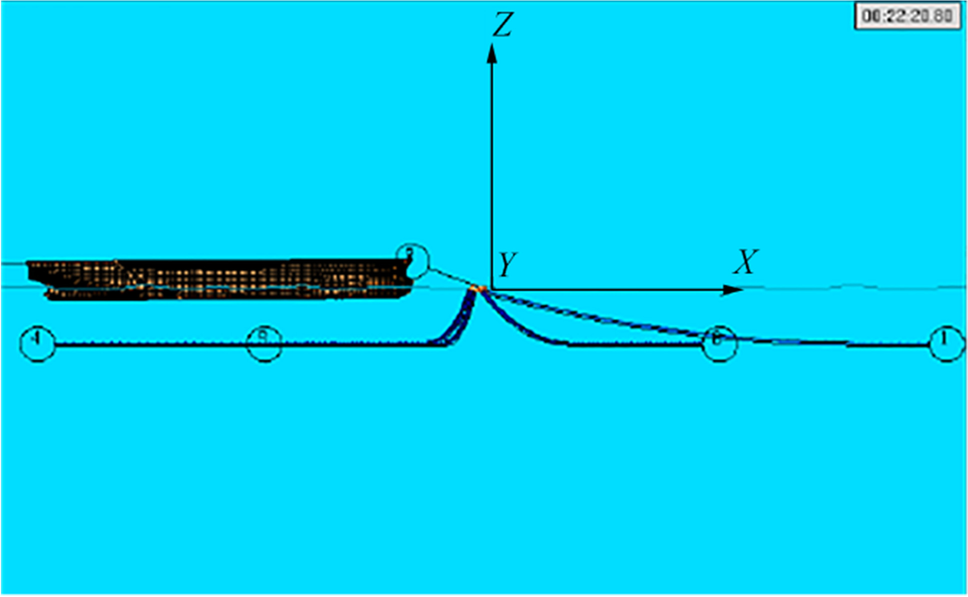
Table 5 Safety factors as stated in APIIntact system Damaged system 1.67 1.25 This model used two hawsers to connect the tanker to the CALM buoy. The total maximum mooring load with a safety factor of 1.5 of the rated static breaking strength should be designed. Figure 7 shows a model of the moored tanker in CALM terminals in the OrcaFlex software.
4.3 Environmental Data
The met-ocean data for the offshore location should be taken for the environmental loading parameters. Thus, for this analysis, the environmental conditions of the Persian Gulf region were used. For the case study, irregular waves (with such parameters as significant height Hs and peak period Tp), current, and wind were considered. Some simplifications were made, e.g., the wind was represented by a constant velocity, and the current was represented by a triangular profile with a given surface velocity. The environmental data were related to the two conditions considered (operation and survival conditions). In the operational condition, the full loading tanker was connected to the terminal, while in the survival condition, the buoy stood alone with no tanker connected.
The current study used the Joint North Sea Wave Project (JONSWAP) spectrum defined by Eq. (3):
$$ S\left(\omega \right)=\frac{\alpha {\mathrm{g}}^2{\gamma}^{\alpha }}{\omega^5}\exp \left(\frac{5{\omega}_p^4}{4{\omega}^4}\right) $$ (3) where g is the gravitational constant and significant wave heights Hs, peak period Tp, and peak enhancement factor γ represent the key parameters to define this spectrum, as shown in Table 6. The other parameters were automatically calculated by OrcaFlex. The simulations were run for irregular waves in fully developed sea conditions for 3 h. The spectrum plot, shown in Figure 8, was studied for this case.
Table 6 Environmental conditionsWave JONSWAP Operation Hs (m) 2.6 Tp (s) 7.5 γ 1.4933 Survival Hs (m) 3.9 Tp (s) 8.5 γ 2.2261 Wind Constant velocity (m/s) Operation 22 Survival 26 Air density (kg/m3) 1.28 Current Triangular profile (m/s) Operation surface 0.7 seabed 0 Survival surface 0.8 seabed 0 Sea Water depth (m) 47.8 Water density (kg/m3) 1025 The wind and current parameters are presented in Table 6. Both the current and wind are always in the same direction. The wind profile is constant, but the current force is presented in a triangular profile. Following the OCIMF (1977), the resultant wind force and moments acting on a moored tanker are calculated by Eqs. (4)–(6):
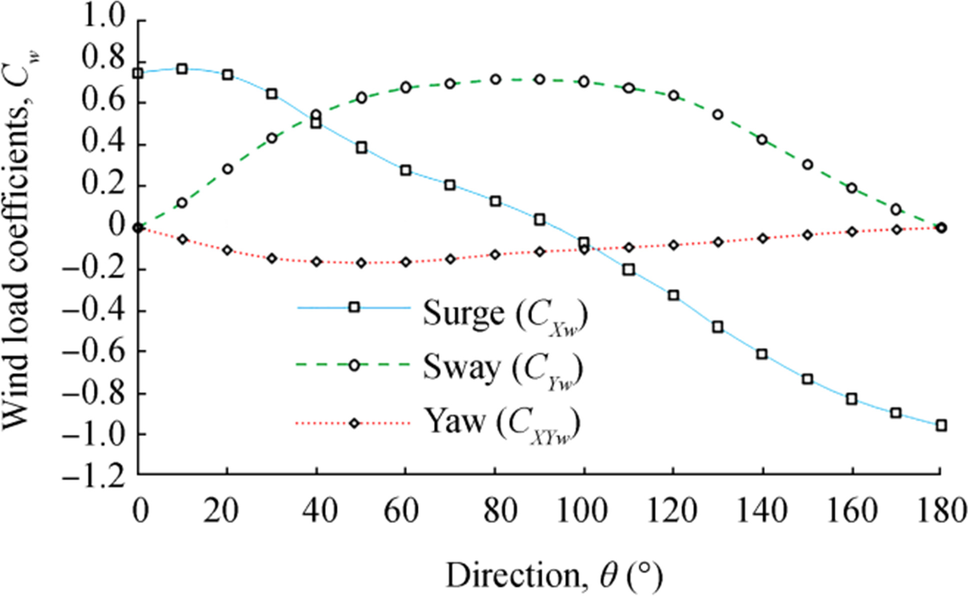
$$ {F}_{Xw}=\frac{1}{2}{C}_{Xw}{\rho}_w{V}_w^2{A}_T $$ (4) $$ {F}_{Yw}=\frac{1}{2}{C}_{Yw}{\rho}_w{V}_w^2{A}_L $$ (5) $$ {F}_{XYw}=\frac{1}{2}{C}_{XYw}{\rho}_w{V}_w^2{A}_T{L}_{\mathrm{BP}} $$ (6) where FXw, FYw, and MXYw are the surge, sway wind force, and yaw wind moment, respectively. The curves of the coefficients CXw, CYw, and CXYw are presented in Figure 9.
In addition, AT and AL are the windage area in the transverse and longitudinal direction of the tanker, and LBP is the length of the tanker, which are presented in Table 2. The sustained wind velocity measured at an elevation of 10 m above the water surface is required for use in the wind load equations (shown in Eq. (7))
$$ {V}_W=v{\left(\frac{10}{h}\right)}^{1/7} $$ (7) where VW is the wind velocity (m/s) at a height of 10 m versus the sea surface, v is the wind velocity at an elevation of h (m/s), and h is the elevation above the water surface (m).
In accordance with the OCIMF (1977), the resultant current force and moments acting on a moored tanker are calculated using Eqs. (8)–(10):
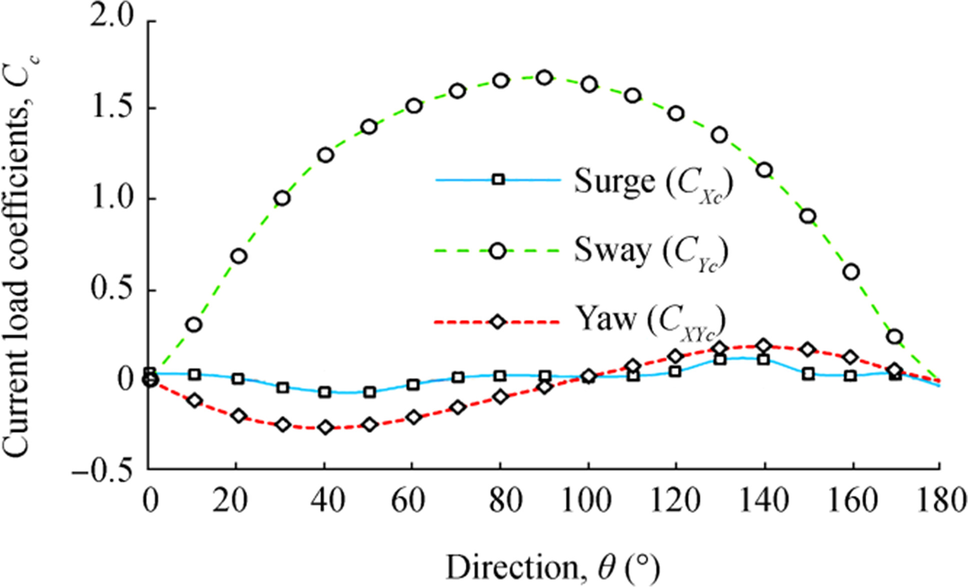
$$ {F}_{Xc}=\frac{1}{2}{C}_{Xc}{\rho}_c{V}_c^2{L}_{\mathrm{BP}}T $$ (8) $$ {F}_{Yc}=\frac{1}{2}{C}_{Yc}{\rho}_c{V}_c^2{L}_{\mathrm{BP}}T $$ (9) $$ {F}_{XYc}=\frac{1}{2}{C}_{XYc}{\rho}_c{V}_c^2{L_{\mathrm{BP}}}^2T $$ (10) where FXc, FYc, and MXYc are the surge, sway current force, and yaw current moment, respectively. The curves of the coefficients CXc, CYc, and CXYc are presented in Figure 10.
4.4 Load Cases
Based on the recommendations of the design code, including API (API, 2008), the flexible risers were designed by considering all load cases by the conditions governing the studied operation (e.g., environmental conditions, internal and external forces, and intact and damaged state of the mooring system).
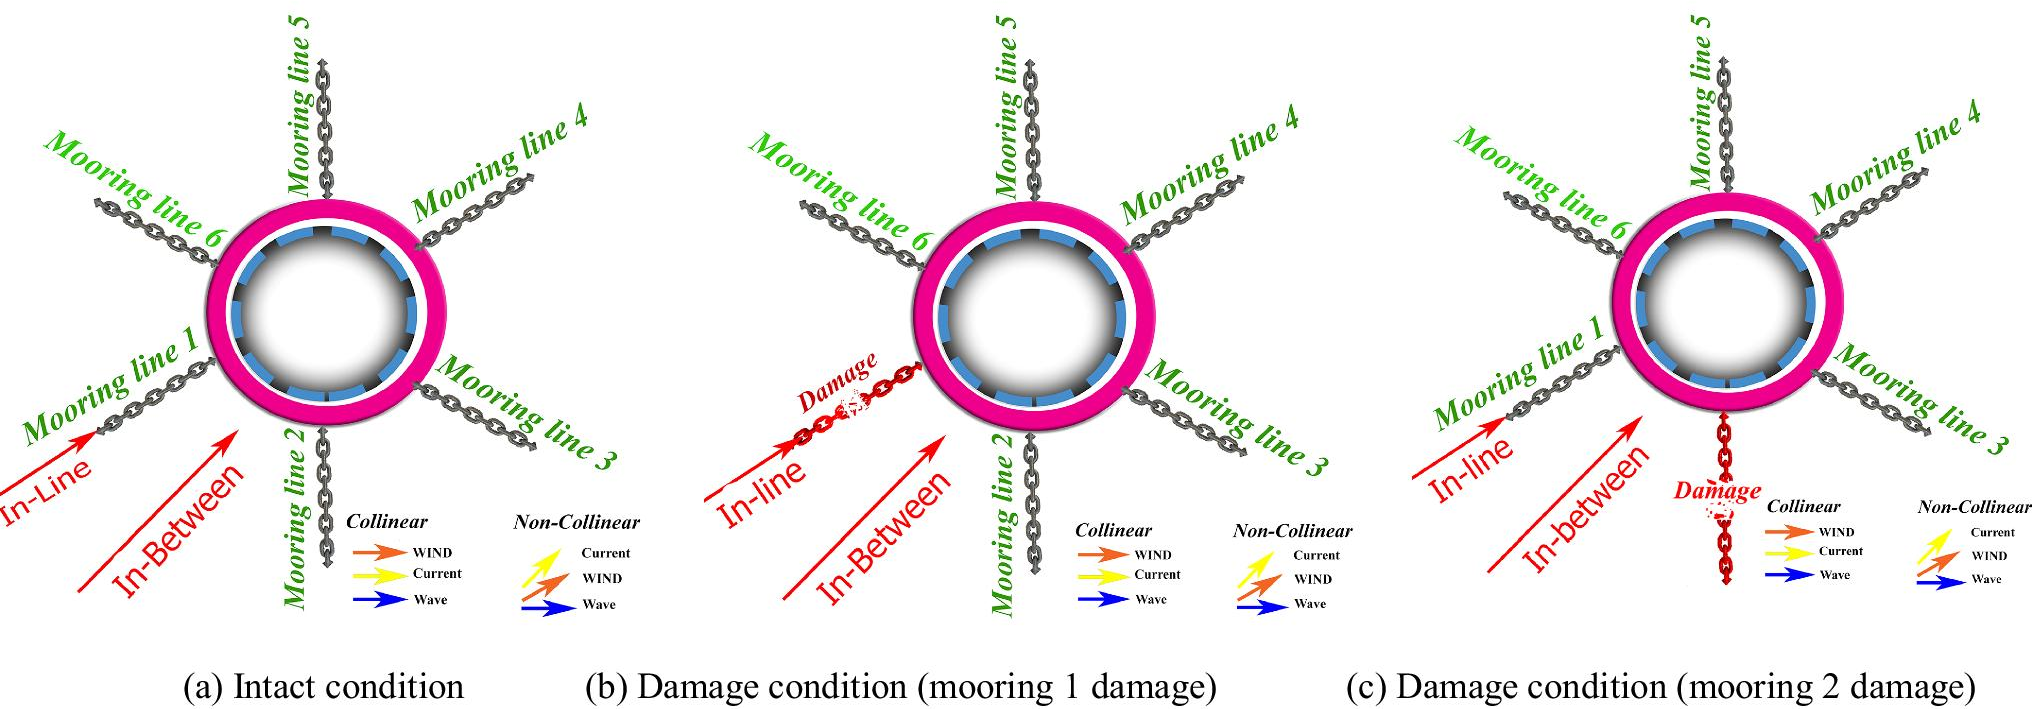
The selection of load cases to analyze and simulate the operating conditions should be based on the maximum displacement in the vessel and, thus, on the maximum internal tension in the mooring system. In turn, this could lead to a proper initial assessment of the capacity of the mooring system. Table 6 presents the possible load cases in the dynamic analysis of the unloading and loading operations of the tanker and the floating terminal. According to Table 6, analyses should be performed for both the intact mooring system and the damaged mooring system, assuming the removal of a mooring line. Two modes were considered for the damaged mooring mode according to Figure 11. In the first case, the mooring was omitted so that its direction would be the same as the direction of the wave. In the second case, the mooring line was omitted so that it would not be in the same direction as the wave.
For the environment loading on the terminal, four limit states were considered in relation to the angle of the wind, current, and wave direction relative to each other, along with the angle of the wave direction relative to one of the mooring lines as shown in Figure 11.
State 1 Collinear-Inline: In this mode, wind, current, and wave are parallel, and the direction of the wave is in the direction of one of the mooring lines.
State 2 Non-collinear-inline: In this case, wind, current, and wave are not aligned, and the direction of the wave is in the direction of one of the mooring lines.
State 3 Collinear-in-between: In this mode, wind, current, and wave are parallel, and the wave direction is between two of the mooring lines.
State 4 Non-collinear-in-between: In this mode, wind, current, and wave are not aligned, and the wave direction is between two of the mooring lines.
State 5 To investigate the dynamic behavior of the CALM terminal under different loading conditions, three modes are considered in accordance with the presence or absence of the tanker, according to Table 7:
Table 7 Dynamic load casesCase No. Mooring condition Direction of the wind and current relative to wave Direction of the wind, Wave, and current relative to the mooring Loading condition 1 Intact Collinear Inline Alone Ballast Full loading 2 Intact Non-collinear Inline Alone Ballast Full loading 3 Intact Collinear In-between Alone Ballast Full loading 4 Intact Non-collinear In-between Alone Ballast Full loading 5 1# Damaged Collinear Inline Alone Ballast Full loading 6 1# Damaged Non-collinear Inline Alone Ballast Full loading 7 1# Damaged Collinear In-between Alone Ballast Full loading 8 1# Damaged Non-collinear In-between Alone Ballast Full loading 9 2# Damaged Collinear Inline Alone Ballast Full loading 10 2# Damaged Non-collinear Inline Alone Ballast Full loading 11 2# Damaged Collinear In-between Alone Ballast Full loading 12 2# Damaged Non-collinear In-between Alone Ballast Full loading Mode 1 Stand-alone: In this mode, the terminal is connected to the tanker under survival conditions.
Mode 2 Ballast: In this case, the terminal buoy is connected to the ballast tanker under operating conditions.
Mode 3 Full loading: In this mode, the terminal buoy is connected to the full loading tanker under operating conditions.
5 Results and Discussions
Offset diagrams show the maximum displacement of the terminal buoy under the influence of all load cases in different directions. In each direction, the maximum environmental conditions vary depending on the probability of occurrence. Thus, the offset diagrams show a good view in terms of maximum floating displacement in each direction based on the maximum environmental conditions of that direction.
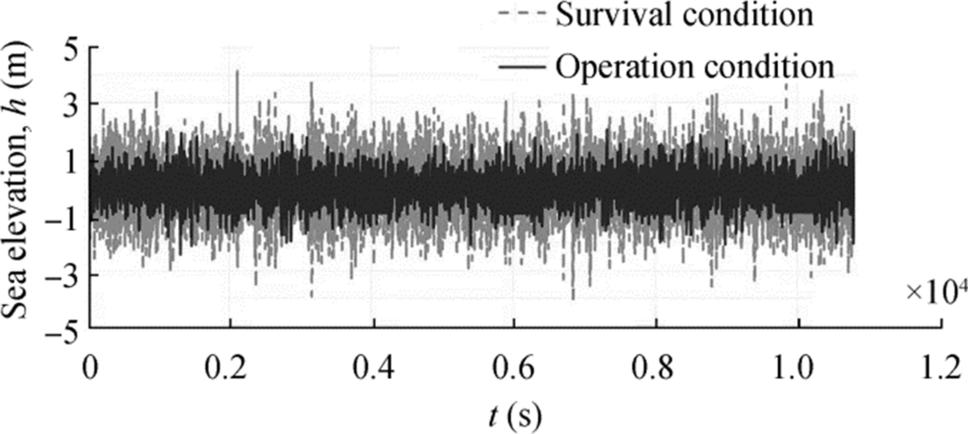
In this paper, the offset diagrams were modeled under environmental conditions with a combination of wind, current, and irregular waves for both the collinear and non-collinear directions for eight coordinate directions. We assumed that the severity of environmental conditions was the same in all directions. In addition, the mooring system was analyzed under two modes, i.e., intact and damaged mooring lines. A total of 36 cases were studied. Each simulation was run as a fully developed wave for 3 h (real time). Taking Figure 12 as an example, the sea elevations under the operation (oil tanker connected) and survival (oil tanker not connected) conditions have been described.
In obtaining the offset diagrams, given that the risers have little effect on terminal displacement, their modeling has been omitted.
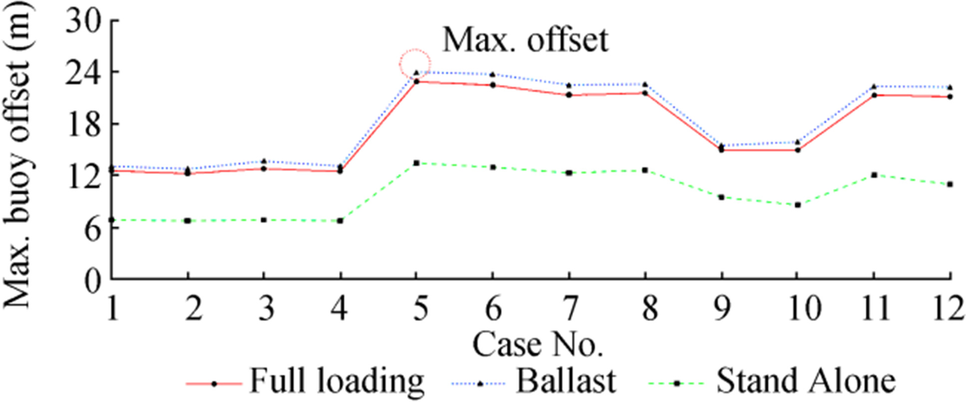
The maximum displacement of the terminal buoy in these models is shown in Figure 13, in which we assumed the connection of the tanker or the condition that the terminal buoy is in the stand-alone mode.
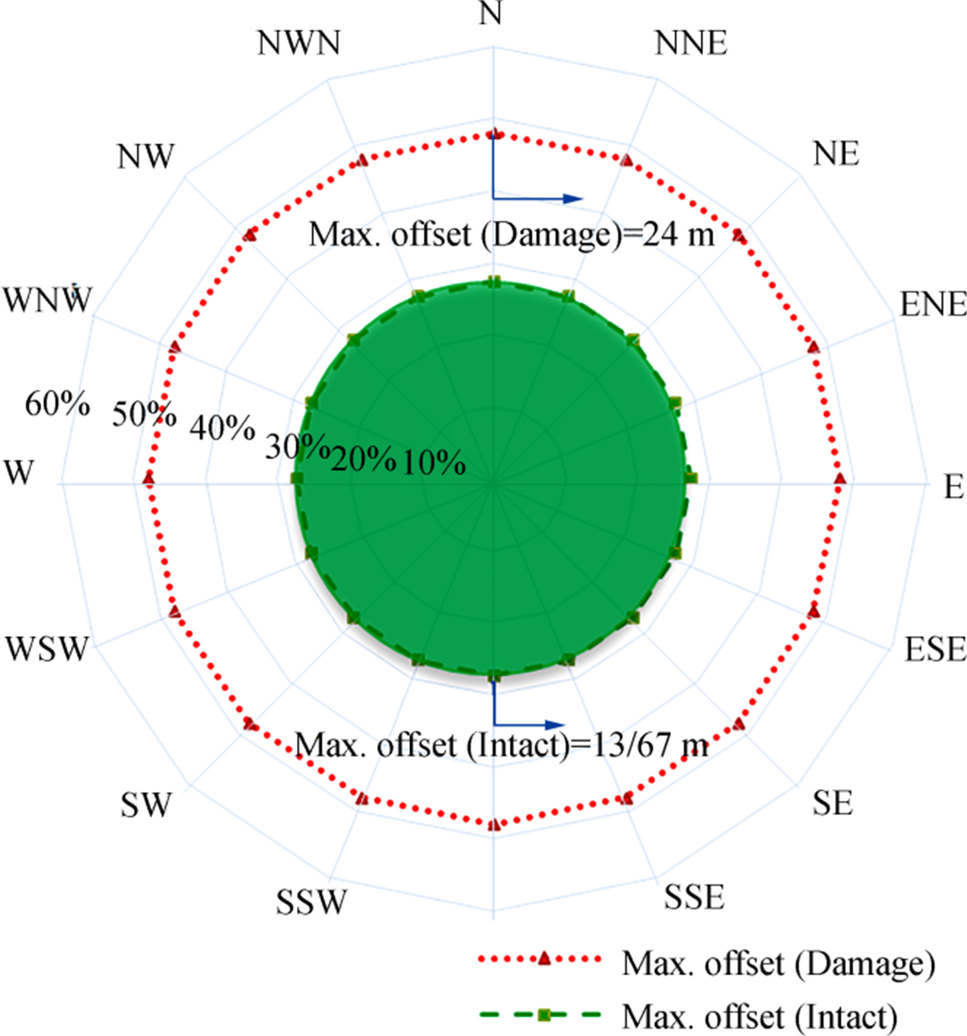
As shown in Figure 13, the results indicate that the maximum terminal offset in case 5 occurred in conditions in which the ballast tanker is connected, and the terminal works with one damaged mooring line. In this case, the maximum offset is 24 m, which is used as the maximum terminal offset for the comparison with the SAFOP boundary. For an intact mooring system, the maximum offset for the buoy is 13.67 m. More details are shown in Figure 14.
Given that this displacement is obtained for a specific direction of environmental conditions and based on the symmetry of the oil terminal mooring system, it can be shown that this maximum offset is the same for all directions. For example, under case 4, if the ballast tanker is connected in any direction, the maximum terminal offset is the same in all directions. This is because the tanker can rotate freely and place in the same direction with the prevailing environmental conditions and because the intensity of environmental conditions is the same in each direction. This gives us a comprehensive view of the maximum terminal displacement in all directions, as shown in Figure 14.
Furthermore, Figure 14 illustrates the maximum offset of the buoy in all directions for intact and damage conditions in terms of percentage of water depth. The center of the offset diagram corresponds to the mass center of the CALM buoy on the XY plane. In all cases, the SAFOP for the riser is compared with these two offset diagrams.
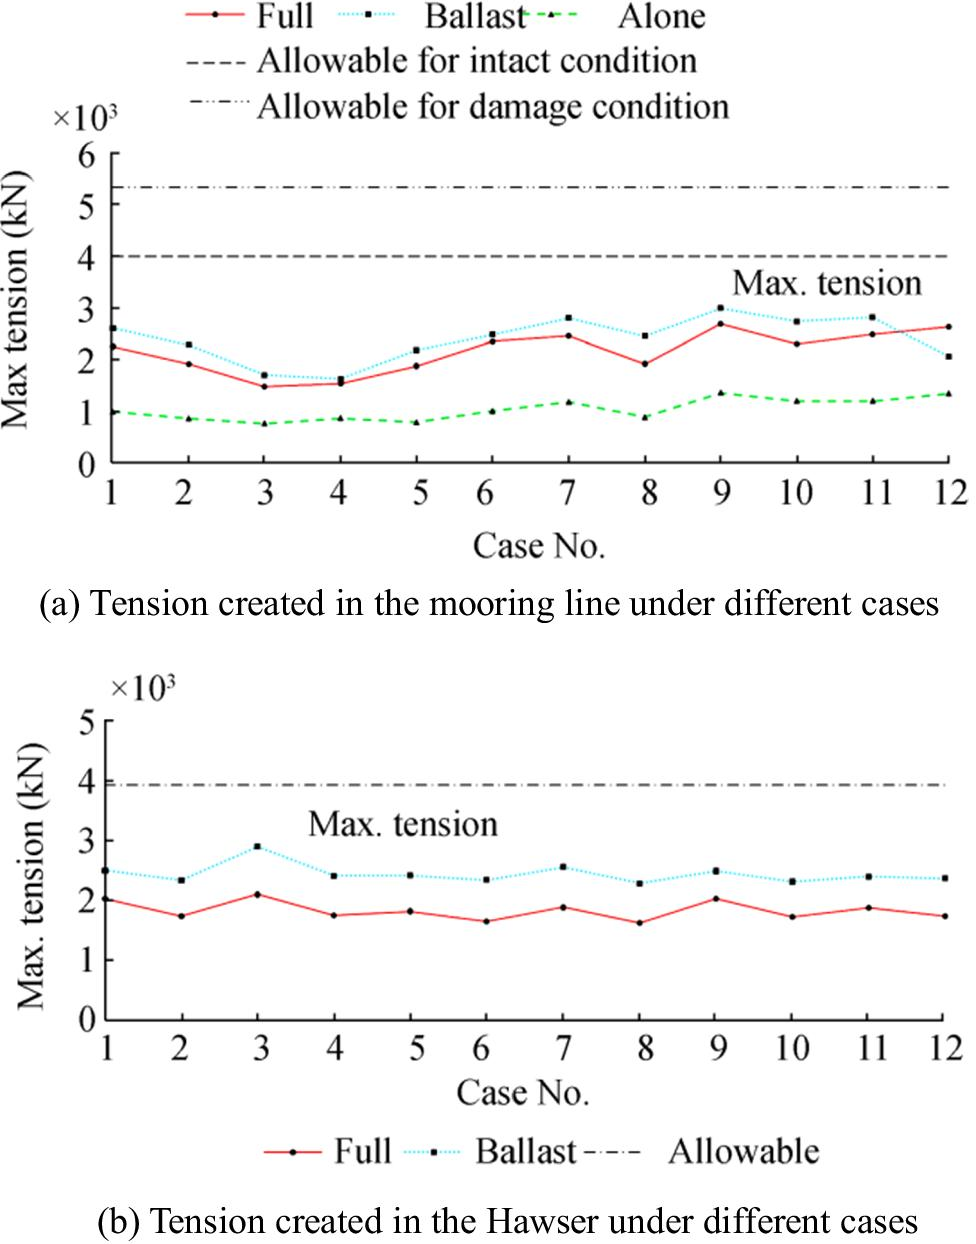
In the initial design, the mooring system must be analyzed separately under the influence of all the load cases governing the problem. This is done in order to check the amount of effective tension obtained in each case with its allowable value. If there is a problem, the mooring system should be redesigned. Another criterion for investigating the mooring behavior in the oil terminal is the amount of tension created in the hawser system under the relevant conditions. The results of this section are shown in Figure 15.
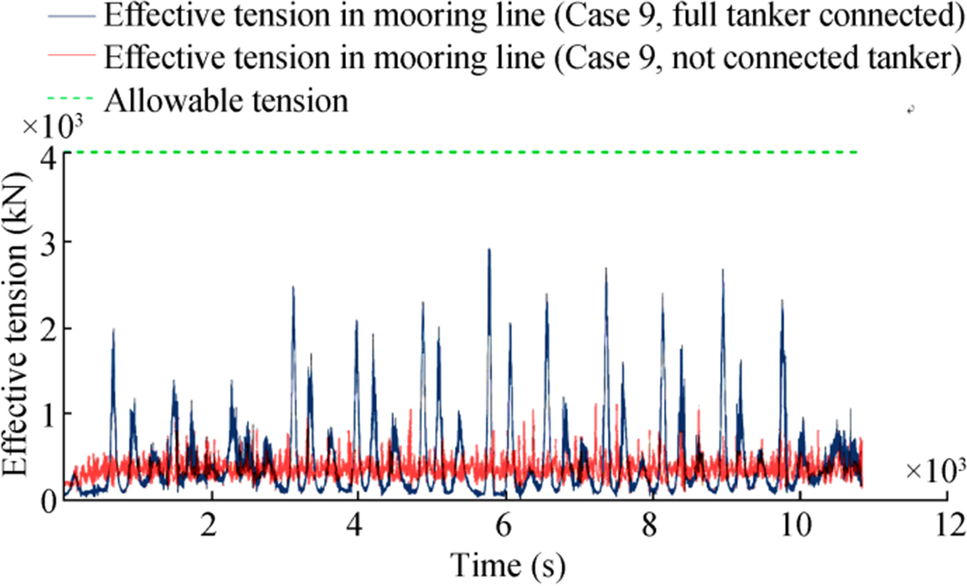
As shown in Figure 15a, the maximum tension created for the mooring system in case 9 occurs when one of the mooring systems fails under the condition in which the terminal is connected to the ballast tanker. The maximum tension created in this case is 3000 kN. However, the allowable tensions in the case of damaged and intact mooring are 5352 and 4000 kN, respectively. According to Figure 15b, the maximum tension created for the Hawser occurs in case 3, which has an intensity of 2800 kN. The allowable tension strength for the hawser is 3922 kN. It can be concluded that the tensions created in the mooring systems meet the criteria provided by the regulations for the intact and damaged conditions. Furthermore, according to the results of Figure 15a, most of the effective tensions created in two cases, including with a tanker (ballast tanker) and without a tanker connection, occur in case 9. The results of the two cases mentioned Figure 16 is presented.
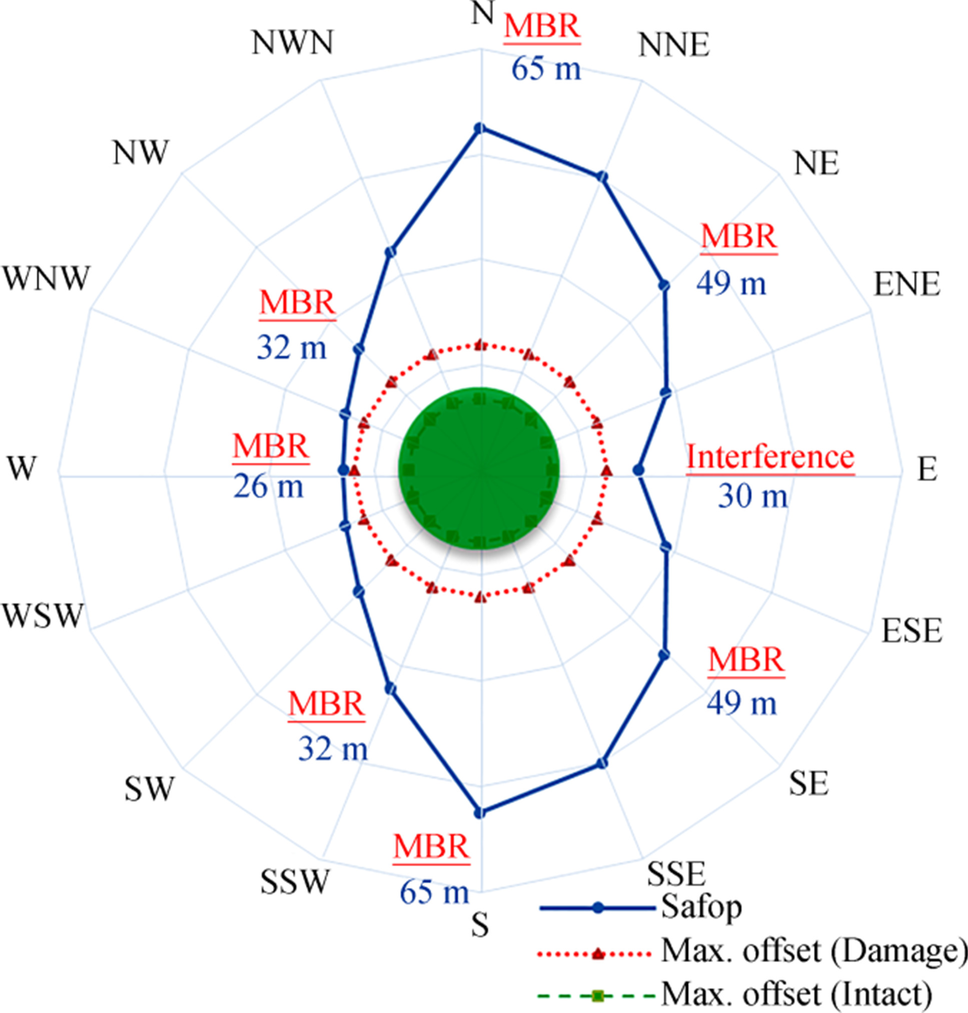
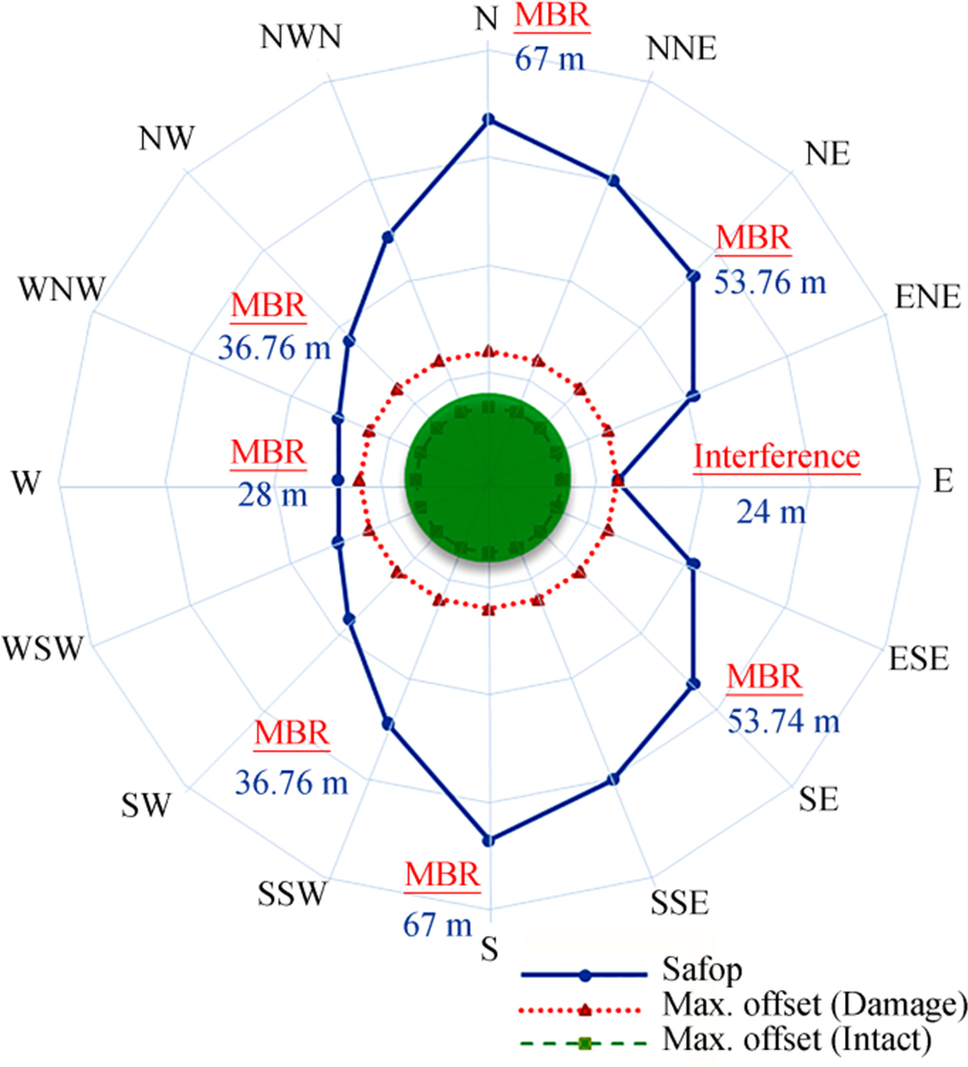
As described in Section 2, the SAFOP area is a diagram that shows the horizontal displacement of the upper end of the riser (connected to the buoy) so that, at that point and in that direction, the risers are in a safe position. Figure 17 shows the SAFOP diagram for a riser operating in the Persian Gulf region with the following characteristics: a length of 118 m and a water depth of 50 m. In addition to showing the SAFOP boundaries, the values for the maximum terminal displacement obtained in the previous step are visible. Furthermore, in each direction, the first criterion that is violated by moving the end of the riser in that direction is shown.
The results show that the SAFOP curve and offset diagram do not overlap at any point. However, in far (west) and near (east) directions, the two curves have the shortest distances at 2 and 6 m, respectively. More detailed results are presented in Table 8.
Table 8 SAFOP resultsDir. no. Dir. SAFOP limit (m) Violation Min. distance between SAFOP and offset diagram (m) 1 N 65 MBR 41 2 NW 32 MBR 8 3 W 26 MBR 2 4 SW 32 MBR 8 5 S 65 MBR 41 6 SE 49 MBR 25 7 E 30 Interference 6 8 NE 49 MBR 25 In the next step, the length of the riser was considered a variable, and the depth of water was assumed to be constant. In this case, the length of the riser decreases from 118 to 115 m. The effect of this length reduction on the SAFOP curve is illustrated in Figure 18.
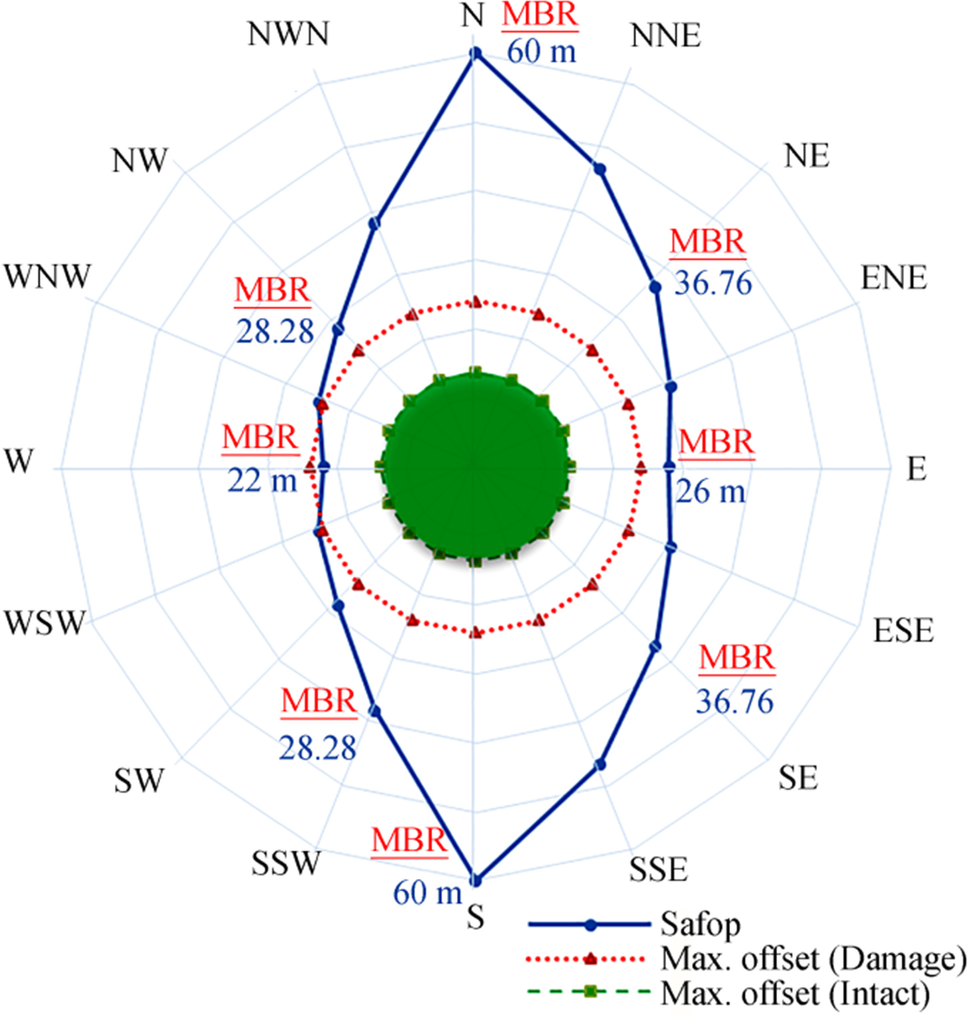
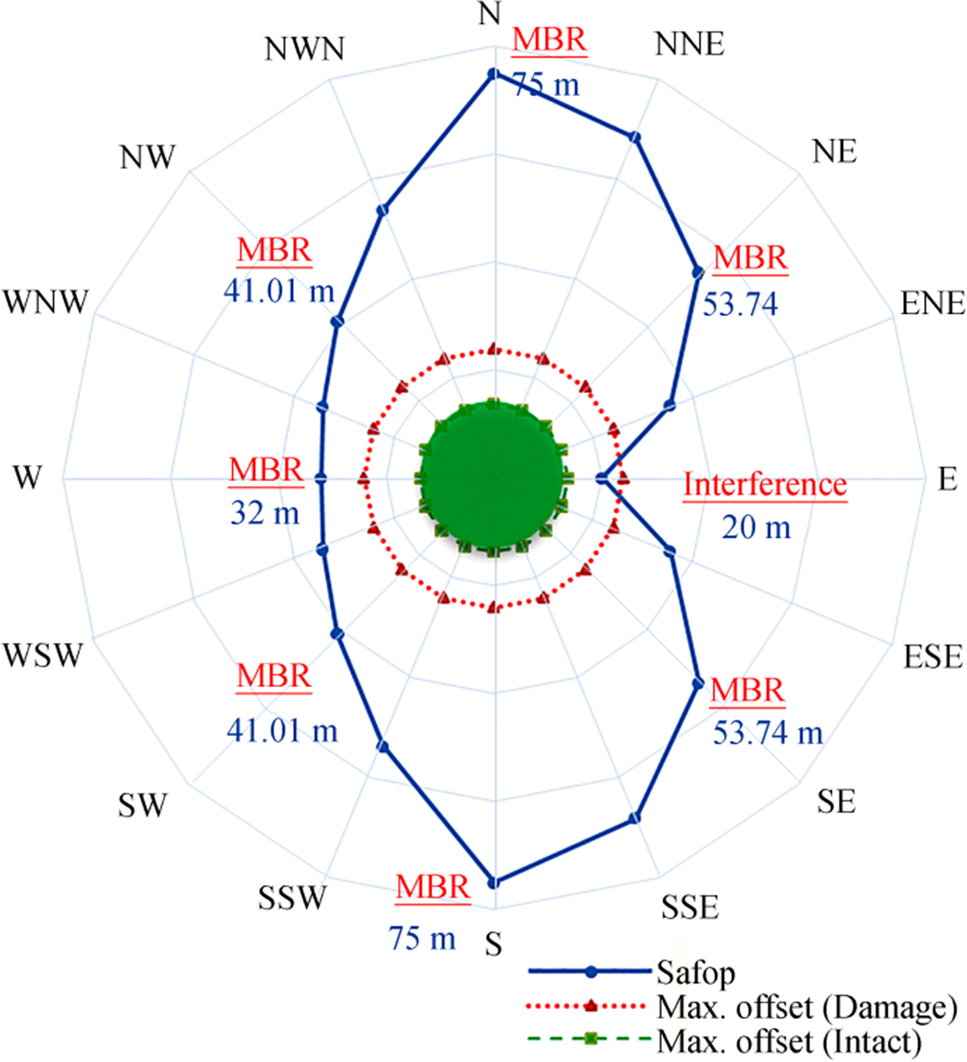
The results show that the SAFOP curve overlaps with the offset diagram. This specific length of the riser is not appropriate; thus, either the length of the riser should be modified or the terminal offset should be further limited so as not to interfere with each other. The results obtained for the SAFOP and offset diagrams if the length of 121 m is selected for the riser are shown in Figure 19. The results are obtained in eight different directions.
According to Figure 19, if the length of 121 m is selected for the riser, the criterion of interference in the east direction for the riser is violated. It is also observed that there is no interaction between the SAFOP and the offset diagram elsewhere. However, the maximum distance between the two curves occurs in the cross offset (north and south direction). In addition to the length of the riser, water depth was also considered a variable. For comparison of the SAFOP and offset diagram, we assume that the water depth drops from 50 to 47 m, and the results are illustrated in Figure 20.
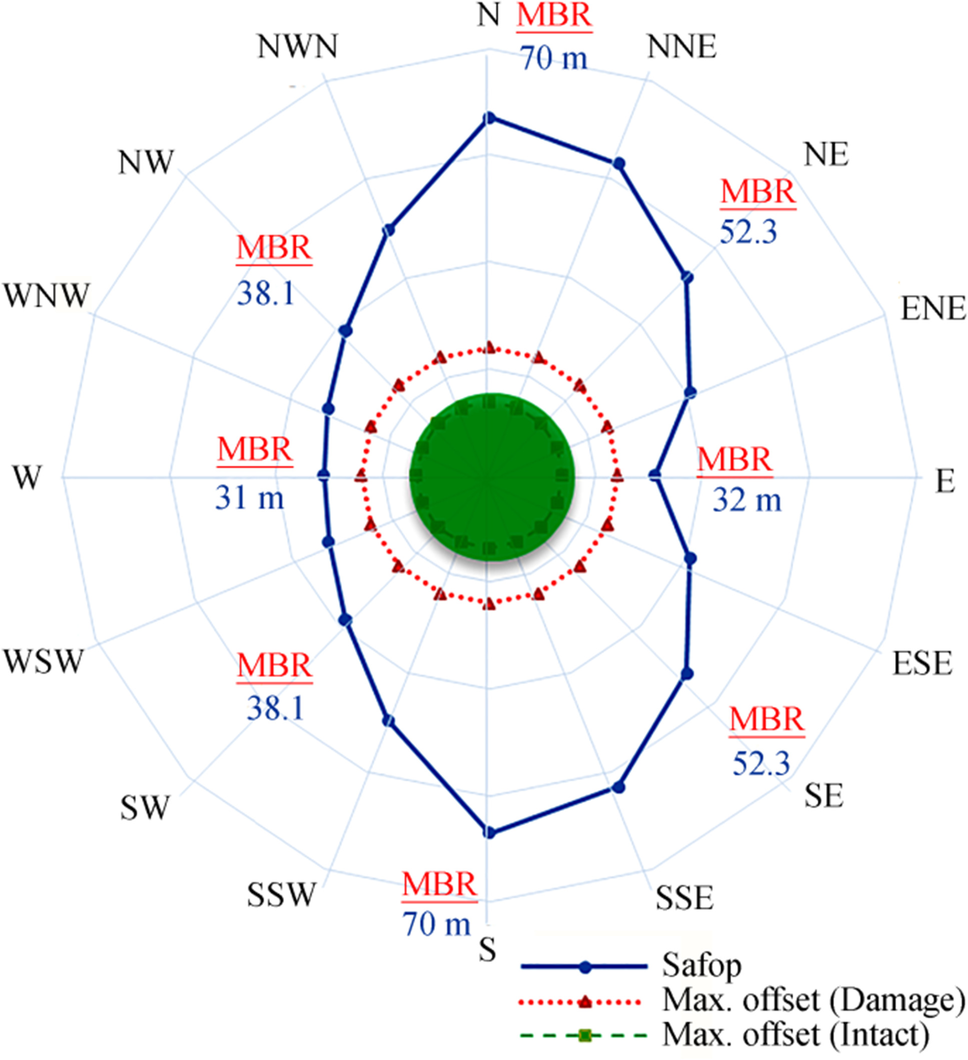
The results show that with decreasing water depth, the interference criterion becomes more dominant and makes the displacement of the top connection of the riser more limited. As such, the SAFOP and offset curves will interfere in the near offset (the east direction). The results obtained after assuming that the water depth is increased to 53 m are illustrated in Figure 21.
The results show that by increasing the water depth to 53 m, not only do the two curves not overlap, but the distance between the two curves is also improved, and a safer state is created. Thus, the shortest distance between the two curves is 7 m (in the west direction).
6 Conclusions
Traditionally, mooring and riser systems in oil terminals are designed separately by employing uncoupled analysis tools. However, the nonlinear interaction between them is not considered. Meanwhile, in an uncoupled design, the visual assessment of the design criteria for both mooring system and risers in all directions cannot be conducted. Due to the disadvantages mentioned, studies have moved toward designs using a coupled analysis.
In coupled analysis, the comparison between the SAFOP zone for riser boundaries and the maximum offset of the vessel gives us a good idea of the optimal design. Furthermore, this method identifies safe and failure zones of risers and mooring lines of oil terminals. However, the design has to change somewhat to determine the most appropriate length for the riser. In this way, it neither violates the code nor becomes impractical. In this paper, the mooring line and riser system with the lazy-S configuration was investigated for the CALM terminal when connected to the tanker and when it has a stand-alone design, and the following results were obtained.
Due to the low weight and type of mooring system of the CALM structure compared to other structures, the displacement of the CALM terminal is significant due to the environmental loads and the presence of a tanker in all directions, and a good view of the response of the structure should be obtained at all directions. Therefore, the integrated design of the mooring and riser system for CALM terminals is of particular importance.
First, the safest position for the placement of a tanker is when there is a cross offset occurring for the riser because in this area, the SAFOP border is far from the maximum terminal displacement. Given that the position of the tanker is proportional to the direction of the prevailing environmental conditions, the PLEM direction should be installed in such a way that the directions of the riser position and the tanker (when positioned in the prevailing environmental conditions) are 90° apart.
Second, the maximum tension created in the mooring and hawser, as well as the maximum displacement created in the terminal buoy, occur when the ballast tanker is connected.
Third, some of the most important criteria for this configuration are MBR and sea bed clearance (interference). In this paper, the effects of two variables, riser length and water depth, were investigated in relation to these criteria. The results showed that an increase in the length of the riser causes a greater risk of the riser impact on the seafloor, while a decrease in the length causes the failed governance of the MBR criterion. Furthermore, as the water depth increases, this type of riser's configuration shows good performance.
Finally, there are two advantages in having new knowledge of integrated design:
1) it helps identify the safe and failure zones of risers and mooring lines of oil terminals, and
2) it helps increase productivity and reduce the final cost of the project.
Open Access This article is licensed under a Creative Commons Attribution 4.0 International License, which permits use, sharing, adaptation, distribution and reproduction in any medium or format, as long as you give appropriate credit to the original author(s) and the source, provide a link to the Creative Commons licence, and indicate if changes were made. The images or other third party material in this article are included in the article's Creative Commons licence, unless indicated otherwise in a credit line to the material. If material is not included in the article's Creative Commons licence and your intended use is not permitted by statutory regulation or exceeds the permitted use, you will need to obtain permission directly from the copyright holder. To view a copy of this licence, visit http://creativecommons.org/licenses/by/4.0/. -
Table 1 Comparison of tension results created in the mooring line between this study and the Persian Gulf project
Mooring condition Loading condition This study Persian Gulf project Difference % Intact Full Loaded 2387.6 2252.5 5.6 Alone, without tanker 1020.5 980.9 3.8 Damage Full Loaded 2042.8 1873.9 8.2 Alone, without tanker 821.72 775.2 5.6 Table 2 Buoy and tanker parameters
Parameters Tanker CALM Full loading Ballast Draft size (m) 22.6 9.937 3.266 XCOG (m) 170.18 171.04 0 YCOG (m) 0 0 0 ZCOG (m) 17.3 11.62 3.51 Ixx (kg·m2) 8.260E+10 6.564E+10 484E+4 Iyy (kg·m2) 2.35E+12 9.53E+11 484E+4 Izz (kg·m2) 2.35E+12 9.53E+11 935E+4 Main body diameter (m) - - 12.5 Skirt diameter (m) - - 16.63 Buoy mass (t) - - 289980 Height (m) - - 5.3 Length between perpendicular, LBP (m) 320 320 - Breadth molded, B (m) 60 60 - Depth, D (m) 30.5 30.5 - Windage area, AL (longitudinal), surge area (m2) 1155.25 1916.15 29.53 Windage area, AT (Transverse), sway area (m2) 3693.81 7735.04 29.53 Windage area, AT×LBP, yaw area (m3) 1.182E6 2.4752E6 369.12 Displacement (kg) 3.6712E+08 1.4383E+08 - Table 3 Physical and mechanical properties of the hose
Section length (m) 10.7 Inner diameter (mm) 500 Outside diameter (mm) 620 Bend stiffness (kg·m2) 158 Tension stiffness (kN) 4325.8 Weight in air (empty) (kg/m) 259 Minimum breaking tension (kN) 810 Inner fluid density (kg/m3) 725 Upper catenary length, L1 (m) 72 Buoyancy section length, L2 (m) 28.9 Lower catenary length, L3 13.1 Horizontal distance from hang-off to TDP L4 (m) 81 Total length, L (m) 118 Hang-off angle, θ1 (°) 24 Lower end angle to PLEM, θ2 (°) 67 Table 4 Mooring line parameters
Mooring Nominal diameter (m) 0.095 Mass per unit length (kg/m) 180 EA (kN) 770735 Cm 1 Cd 1.2 Length (m) 436 Hawser Circumference (mm) 128 Length (m) 70 Minimum breaking load (kN) 5883 Hawser quantities 2 Table 5 Safety factors as stated in API
Intact system Damaged system 1.67 1.25 Table 6 Environmental conditions
Wave JONSWAP Operation Hs (m) 2.6 Tp (s) 7.5 γ 1.4933 Survival Hs (m) 3.9 Tp (s) 8.5 γ 2.2261 Wind Constant velocity (m/s) Operation 22 Survival 26 Air density (kg/m3) 1.28 Current Triangular profile (m/s) Operation surface 0.7 seabed 0 Survival surface 0.8 seabed 0 Sea Water depth (m) 47.8 Water density (kg/m3) 1025 Table 7 Dynamic load cases
Case No. Mooring condition Direction of the wind and current relative to wave Direction of the wind, Wave, and current relative to the mooring Loading condition 1 Intact Collinear Inline Alone Ballast Full loading 2 Intact Non-collinear Inline Alone Ballast Full loading 3 Intact Collinear In-between Alone Ballast Full loading 4 Intact Non-collinear In-between Alone Ballast Full loading 5 1# Damaged Collinear Inline Alone Ballast Full loading 6 1# Damaged Non-collinear Inline Alone Ballast Full loading 7 1# Damaged Collinear In-between Alone Ballast Full loading 8 1# Damaged Non-collinear In-between Alone Ballast Full loading 9 2# Damaged Collinear Inline Alone Ballast Full loading 10 2# Damaged Non-collinear Inline Alone Ballast Full loading 11 2# Damaged Collinear In-between Alone Ballast Full loading 12 2# Damaged Non-collinear In-between Alone Ballast Full loading Table 8 SAFOP results
Dir. no. Dir. SAFOP limit (m) Violation Min. distance between SAFOP and offset diagram (m) 1 N 65 MBR 41 2 NW 32 MBR 8 3 W 26 MBR 2 4 SW 32 MBR 8 5 S 65 MBR 41 6 SE 49 MBR 25 7 E 30 Interference 6 8 NE 49 MBR 25 -
Amaechi CV, Wang F, Hou X, Ye J (2020) Strength of submarine hoses in Chinese-lantern configuration from hydrodynamic loads on CALM buoy. Ocean Eng 171: 429–442. https://doi.org/10.1016/j.oceaneng.2018.11.010 ANSYS (2014). AQWA theory manual version 2014. ANSYS (2018) ANSYS Aqwa Theory Manual, Release 18.2. ANSYS Inc, Canonsburg, pp 38–94 API (2002) Recommended practice for flexible pipe. API RP 17B, 44, 3rd edn. American Petroleum Institute, Washington, pp 71–90 http://mycommittees.api.org/standards/isotc67sc4/ndocs/2003/n246annex.pdf API (2008). API RP-17B. Recommended Practice for Flexible Pipe. American Petroleum Institute, Washington, DC. API (2014) Design and analysis of stationkeeping systems for floating structures. In: API RP 2SK. American Petroleum Institute, Washington, Issue October 2005, pp 14–98 Bae YH, Kim MH, Kim HC (2017) Performance changes of a floating offshore wind turbine with broken mooring line. Renew Energy 101: 364–375. https://doi.org/10.1016/j.renene.2016.08.044 Brady I, Williams S, Golby P (1974) A study of the forces acting on hoses at a monobuoy due to environmental conditions. Proc Ann Offshore Technol Conf 1974: 1051–1057. https://doi.org/10.4043/2136-ms Cruces Girón AR, Corrêa FN, Jacob BP, Senra SF (2012) An integrated methodology for the design of mooring systems and risers of floating production platforms. Int Conf Offshore Mech Arctic Eng 44885: 539–549. https://doi.org/10.1115/OMAE2012-83702 Det Norske Veritas (2010a). DNV-OS-F201 dynamic risers. Issue October, 91. http://rules.dnvgl.com/docs/pdf/DNV/codes/docs/2010-10/Os-F201.pdf Det Norske Veritas (2010b). Environmental conditions and environmental loads, DNV-RP-C205, 68-97. Eiken C (2013) Pre-commissioning hose operations on the Valemon field in the North sea. University of Stavanger, Norway, pp 52–68 http://hdl.handle.net/11250/183174 Girón ARC, Corrêa FN, Jacob BP (2013) Evaluation of safe and failure zones of risers and mooring lines of floating production systems. Proc Int Conf Offshore Mech Arctic Eng - OMAE 1: V001T01A024. https://doi.org/10.1115/OMAE2013-10411 Girón ARC, Corrêa FN, Hernández AOV, Jacob BP (2014) An integrated methodology for the design of mooring systems and risers. Mar Struct 39: 395–423. https://doi.org/10.1016/j.marstruc.2014.10.005 Karegar, S. (2013). Flexible riser global analysis for very shallow water. Master thesis, University of Stavanger, Norway. OCIMF (1977) Prediction of wind and current loads on VLCC's. Oilcompanies International Marine Forum, London, pp 37–51 Olsen MK (2011). Estimation of annual probability of mooring line failure as a function of safety factor. Master's thesis, Norwegian University of Science and Technology. Orcaflex (2015) OrcaFlex Manual, Version 9.8a. In: Ulverton. Orcina Ltd, Cumbria Available at: https://www.orcina.com/SoftwareProducts/OrcaFlex/Documentation/index.php Pecher A, Foglia A, Kofoed JP (2014) Comparison and sensitivity investigations of a CALM and SALM Type mooring system for wave energy converters. J Mar Sci Eng 2(1): 93–122. https://doi.org/10.3390/jmse2010093 Qi X, Chen Y, Yuan Q, Xu G, Huang K (2017). Calm buoy and fluid transfer system study. Proceedings of the International Offshore and Polar Engineering Conference, 932-939. Rutkowski G (2019) A comparison between conventional buoy mooring CBM, single point mooring SPM and single anchor loading sal systems considering the hydro-meteorological condition limits for safe ship's operation offshore. Trans Nav 13(1): 187–195. https://doi.org/10.12716/1001.13.01.19 Wang J, Xie B (2012) A simplified method for predicting global motion of moored semi-submersible platforms. Proceedings of the International Offshore and Polar Engineering Conference, Rhodes, pp 983–988 Wang K, Er GK, Iu VP (2018) Nonlinear dynamical analysis of moored floating structures. Int J Non-Linear Mech 98:189–197. https://doi.org/10.1016/j.ijnonlinmec.2017.10.025 Ziccardi JJ, Robbins HJ (1970) Selection of hose systems for SPM tanker terminals. In: Offshore Technology Conference Proceeding -OTC 1152. OnePetro, Dallas, pp 83–94. https://doi.org/10.4043/1152-ms

