
Caribbean Sea Offshore Wind Energy Assessment and Forecasting
https://doi.org/10.1007/s11804-021-00216-z
-
Abstract
The exploitation of wind energy is rapidly evolving and is manifested in the ever-expanding global network of offshore wind energy farms. For the Small Island Developing States of the Caribbean Sea (CS), harnessing this mature technology is an important first step in the transition away from fossil fuels. This paper uses buoy and satellite observations of surface wind speed in the CS to estimate wind energy resources over the 2009-2019 11-year period and initiates hour-ahead forecasting using the long short-term memory (LSTM) network. Observations of wind power density (WPD) at the 100-m height showed a mean of approximately 1000 W/m2 in the Colombia Basin, though this value decreases radially to 600-800 W/m2 in the central CS to a minimum of approximately 250 W/m2 at its borders in the Venezuela Basin. The Caribbean Low-Level Jet (CLLJ) is also responsible for the waxing and waning of surface wind speed and as such, resource stability, though stable as estimated through monthly and seasonal coefficients of variation, is naturally governed by CLLJ activity. Using a commercially available offshore wind turbine, wind energy generation at four locations in the CS is estimated. Electricity production is greatest and most stable in the central CS than at either its eastern or western borders. Wind speed forecasts are also found to be more accurate at this location, and though technology currently restricts offshore wind turbines to shallow water, outward migration to and colonization of deeper water is an attractive option for energy exploitation.Article Highlights• Buoy observations are also used to estimate energy output for a selected offshore wind turbine;• This article conducts a wind energy assessment in the Caribbean Sea using scatterometer observations of wind speed and direction;• Forecasting of wind energy is implemented using the long short-term memory network (LSTM) to introduce the methodology to the Caribbean Sea. -
1 Introduction
Pressured by anthropogenic climate change, renewable energy has over the past few decades, rapidly advanced, and wind energy stands as one of the most mature alongside solar energy. Having successfully colonized the land, wind turbines are being installed further and further offshore. While offshore wind turbines are more expensive to construct and maintain than their onshore counterparts (Díaz et al., 2016; Satir et al., 2017; Hevia-Koch and Jacobsen, 2019), they are advantaged in that over the ocean, energy availability is significantly larger due to a greater downward transport of kinetic energy from the overlying atmosphere, allowing power generation in some ocean areas to exceed land-based power generation by a factor of three or more (Liu et al., 2016; Possner and Caldeira, 2017). To initiate offshore wind energy projects, a resource assessment is a crucial preliminary step and is carried out in a variety of ways that include but are not limited to numerical weather prediction models, in situ and remotely sensed observations.
Due to the expense of installing and maintaining large buoy networks, in addition to the large spatial distances in between each buoy, literature detailing direct wind resource assessments using buoy observations is sparse. Nonetheless, Leahy et al. (2012) assessed the viability of using offshore meteorological buoys in assessing wind energy resources in the Atlantic Ocean and the Irish Sea and concluded that although due to assumptions and errors related to buoy wind data accuracy the wind energy assessment would be imperfect, buoys can still be used. Bagiorgas et al. (2012) accessed ten buoys throughout the Aegean and Ionian Seas to assess wind speed and wind power characteristics and found that two sites could be classified by wind classes 6 and 7. It was also observed that 15%-16% higher winds were observed at the 10-m height as compared to 3 m. Additionally, it was calculated that wind turbines at these sites could produce energy for more than 70% of the time. Chen et al. (2017) used six buoys located along the Shenzhen coast to assess both wind and wave energy resources and concluded that while wind energy was, for the region, plentiful at 37-94 W/m2, wave energy was negligible. With the advent and validation of several buoys specifically developed for wind resource assessments (García et al., 2018; Gorton et al., 2019; Viselli et al., 2019; Yu et al., 2020), additional studies will undoubtedly be conducted. However, a wide range of other methods are currently available to estimate and forecast wind energy resources and this includes usage of satellite observations.
Guo et al. (2018) assessed the global wind energy resources using a wide array of satellites and compared the results with National Data Buoy Center (NDBC) buoys at 10-m and 100-m heights. Using multiple satellites, the authors found a more reliable estimation of wind energy resources. Wang et al. (2019) assessed the applicability of a variety of surface wind datasets inclusive of satellite-based observations, reanalysis, in addition to regional atmospheric models, and found that the best overall performance came from QuikSCAT and ASCAT in terms of bias when compared with central Californian coast buoys. Remmers et al. (2019) assessed the ASCAT satellite platform's ability to characterize the spatiotemporal offshore wind information for offshore renewable energy infrastructure and found it could reliably represent in situ measurements in Irish waters and assist in the offshore wind farm site selection process. Zaman et al. (2019) assessed the offshore wind energy resources in Malaysia using multi-mission satellite altimetry data and found that the density of wind power increased with increasing distance from the Malaysian shorelines. The authors also suggested that combining satellite altimetry, in situ observations and numerical modeling enhance offshore wind energy resource assessments. Carvalho et al. (2017) combined satellite, a numerical model, and buoys to characterize offshore winds and wind energy production for the Iberian Peninsula Atlantic coast. It was suggested that ASCAT provided the lowest wind speed temporal variability and wind power flux estimation errors, with WRF providing the best alternative to that product. Soukissian et al. (2017) used the Blended Sea Winds product and found that the eastern Mediterranean Sea has a high annual wind speed with moderately low temporal variability. There, the mean annual wind power density was measured at approximately 1600 W/m2 and 1500 W/m2 in the Gulf of Lions and the Aegean Sea, respectively. Pereira and Silva (2020) combined satellite data observations and the Weather Research and Forecasting (WRF) atmospheric model to assess the offshore wind energy resource in Porto Santo Island and found that in comparisons with observations, WRF was shown to be proficient at simulations of wind speed and direction.
With the rise of big data, soft computing and artificial intelligence methods, the forecast of wind energy resources, particularly on short timescales is especially useful for offshore wind power scheduling and operation control. Zheng et al. (2018) used a deep neural network to extract deep data characteristics to improve the forecasting model efficiency. As compared to the back propagation (BP) and wavelet neural networks, the deep neural network outperformed both by more than 40%. Long short-term memory (LSTM) networks were also used to perform wind speed forecasting. Shi et al. (2019) compared LSTM to other conventional BP, extreme learning machines, and support vector machine (SVM) models, and found that LSTM had much lower error values and could be used to forecast wind speed at adjacent turbines. Li et al. used LSTM for ultra-short-term wind power forecasting in a Western China wind farm and found that the model, when Spearman rank correlation was used to identify LSTM hyper-parameters, outperformed traditional artificial neural networks. For short-time wind speed forecasts, Ibrahim et al. (2019) compared four neural network-based algorithms: artificial neural networks, convolutional neural networks, LSTM, and a hybrid convolutional LSTM (convLSTM) network and one SVM model and found that while SVM was most accurate, convLTSM was less computationally expensive and still provided high prediction accuracy.
Within the Caribbean Sea, Rueda-Bayona et al. (2019a) conducted a literature review of international actions geared towards encouraging different countries to establish strategies to reduce CO2 emissions, in addition to advances and challenges in implementing offshore wind technology, and the administrative framework of renewable energy in Colombia. There, it was demonstrated through the usage of satellite data, it was identified that a previously reported wind power density of 1700 W/m2 was significantly higher than the observed values at La Guajira (482 W/m2 at 110.8 m), Barranquilla (857 W/m2 at 323.2 m), and Santa Marta (658 W/m2 at 10 m). A dataset of wind speed and wind power density at four locations in Colombia accompanied the study (Rueda-Bayona et al., 2019b). Chadee and Clarke (2014) characterized the wind energy potential of the Caribbean using 31 years of the near-surface reanalysis dataset and found that the regional area-averaged wind speed attains a primary maximum in January and a secondary maximum in July. Moreover, it was identified that under the influence of the Caribbean Low-Level Jet (CLLJ), wind power density was measured at 300-400 W/m2. Chadee et al. (2017) attempted to find the optimum configuration for WRF to map the near-surface wind energy resources in Trinidad and Tobago. A subsequent technical and economic assessment of wind-generated electricity was conducted by Chadee and Clarke (2018) for the same country found that the usage of large contemporary wind turbines would be cost-competitive for Caribbean small island developing states (SIDS). Rogers et al. (2019), though studying onshore wind energy, predicted a favorable levelized cost of electricity. With the accelerating global transition to renewable energy and at the precipice of the United Nations (UN) Decade of Ocean Science for Sustainable Development (2021-2030), investigating the offshore wind energy in a Caribbean Sea bordered by SIDS is an extremely relevant research topic, especially given the projections of increasing annual wind speeds (Costoya et al., 2019). For the Caribbean Sea that has significant potential to harness ocean renewable energy, understanding the spatiotemporal distribution of wind energy is also essential towards achieving the UN Sustainable Development Goals (SDGs; UN, 2019). Specifically, this paper seeks to contribute to the research that undergirds SDG 7 which concerns affordable, reliable, sustainable, and modern energy for all. Consequently, the rest of the paper is structured as follows: Sect. 2 describes the data and methodology. Section 3 contains the results which are bisected into the wind energy assessment and forecasting subsections. Section 4 presents the conclusion and a discussion.
2 Data and Methodology
2.1 Data
A total of four buoys owned and maintained by the National Buoy Data Center (NDBC) are accessed for their surface wind speed observations in the area enclosed by 8°N-20°N and 60°W-90°W (Figure 1, Table 1). This data ranged from 2009 to 2019 and possesses an hourly resolution. Extensive data curation was done to eliminate invalid entries and characterize the volume of missing data to ensure that analyses were representative of the full 11-year period. Relevant buoy statistics are provided in Tables 1 and 2.
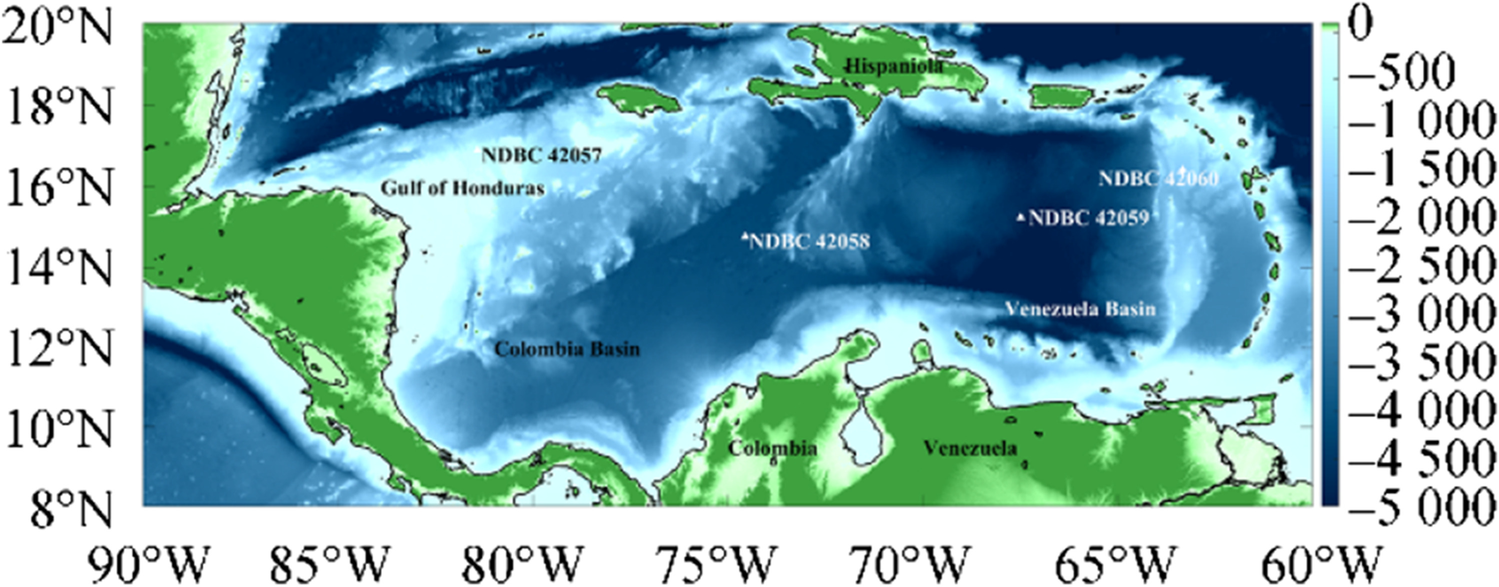 Figure 1 Study area with National Data Buoy Center buoy locations marked. Shading is the water depth (m)Table 1 Accessed National Buoy Data Center buoys and their relevant statistics
NDBC ID Latitude (°N) Longitude (°W) Anemometer height (m) Water depth (m) Number of observations Data availability (%) 42057 16.906 81.422 3.8 377 73, 959 76.71 42058 14.776 74.548 3.8 4158 73, 284 68.23 42059 15.252 67.483 4.1 4784 76, 521 78.78 42060 16.433 63.331 3.8 1469 75, 815 78.64 Table 2 Accessed National Buoy Data Center buoys and their relevant statistics continuedNDBC ID Latitude (°N) Longitude (°W) Max. wind speed (m/s) Min. wind speed (m/s) Standard deviation (m/s) 42057 16.906 81.422 33.18 0.001 3.26 42058 14.776 74.548 51.47 0.001 3.34 42059 15.252 67.483 33.98 0.001 3.34 42060 16.433 63.331 49 0.001 3.36 Using Eq. (1), wind speeds were converted to the 100 m height using the simplified log-law equation:
$$ U\left(z\right)=U\left({z}_{R}\right)\frac{log\left(\frac{z}{{z}_{0}}\right)}{log\left(\frac{{z}_{R}}{{z}_{0}}\right)} $$ (1) where U(z) is the wind speed at height z, z0 is the roughness length (0.01), and zR is a reference height. Although the roughness length for open sea conditions is much smaller (0.0002), early studies by Frank et al. (2000) and Barthelmie (2001) suggest that provided wind speed being vertically extrapolated is greater than 10 m above sea level, any variation in the roughness length of the sea surface is too small to have a significant impact on average wind resources at typical turbine hub heights (Barthelmie et al., 2007). This value is also used widely in other studies (e.g., Ma et al., 2021) and will be used here to maintain consistency.
In addition to in situ buoy observations of wind speed, ASCAT scatterometer-observed wind speed, and direction are also acquired on a spatial resolution of 0.25° × 0.25° and ranges 8°N-20°N and 60°W-90°W. Temporally, the data ranges from January 1, 2009, to December 31, 2019, and is on a daily resolution. Data is downloaded via the OPeNDAP Server maintained by the Asia-Pacific Data-Research Center.
2.2 Methodology
2.2.1 Wind Energy Estimation
Given a sufficiently long time series of wind speed data for a given region, the wind power density P per unit area A is given by:
$$ \frac{P}{A}=\frac{1}{2}{\rho v}^{3} $$ (2) where v is the wind speed (m/s) and ρ is the air density (1.025 kg/m3). Following the estimation of wind energy resources, how the resources vary on interannual scales is also crucial in identifying optimum locations for energy exploitation. Consequently, the dimensionless coefficient of variation index is used to estimate this interannual variability on monthly (3) and seasonal (4) scales (Rusu et al., 2018):
$$ MV=\frac{{P}_{Mmax}-{P}_{Mmin}}{{P}_{Year}} $$ (3) $$ SV=\frac{{P}_{Smax}-{P}_{Smin}}{{P}_{Year}} $$ (4) The capacity factor, which is an indicator of performance, is calculated and is defined as the ratio of the actual electrical produced to its nameplate capacity:
$$ Capacity\;Factor=\frac{Actual\;Energy\;Production\;\left(MWh\right)}{Nameplate\;capacity\;\left(MW\right)\times Time} $$ (5) The corresponding output function for a wind turbine is defined as follows (Sohoni et al., 2016):
$$ {P}_{w}\left(V\right)=\left\{\begin{array}{c}\begin{array}{cc}\frac{1}{\left({V}_{R}^{3}-{V}_{C}^{3}\right)}\left[{V}^{3}-{V}_{C}^{3}\right]{P}_{R},& {V}_{C}\le V\le {V}_{R}\end{array}\\ \begin{array}{cc}{P}_{R},& {V}_{R}\le V\le {V}_{F}\end{array}\\ \begin{array}{cc}0,& elsewhere\end{array}\end{array}\right. $$ (6) To simulate the total theoretical power generation at each buoy location, this paper selects the Swiss Electric YZ150/10.2 offshore wind turbine. Statistics concerning the rated power, cut-in, rated, cut-out, and survival wind speeds are listed in Table 3.
Table 3 Swiss Electric YZ150/10.2 turbine power curve coefficientsRated power (MW) Cut-in speed (m/s) Rated speed (m/s) Cut-out speed (m/s) Survival speed (m/s) 10 3 13 25 70 2.2.2 The Long Short-term Memory Network
Following the wind energy assessment, wind speed forecasts are performed for each location using available buoy observations converted to the 100-m height. For grid stability and reliability considerations, in addition to the optimization of market design, proper maintenance/operations, and power scheduling, frequency response reserves etc., forecasting wind power generation is crucial (Lledó et al., 2019; Al-Dahidi et al., 2020).
Although a variety of methods exist for wind speed forecasts and include numerical weather prediction models such as WRF, statistical methods, spatial correlation models, artificial intelligence, or hybrid methods (Han et al., 2015; Chang, 2014), an artificial intelligence method, the long short-term memory (LSTM) network, is employed due to low computational expense and its high degree of accuracy (Gangwar et al., 2019; Ibrahim et al., 2020; Marndi et al., 2020). The LSTM network (Figure 2) is a type of recurrent neural network that is widely used for complex time series analyses, machine translation, speech recognition and as relevant for this paper, wind speed predictions (Gökgöz and Filiz, 2018; Zhang et al., 2019; Banik et al., 2020) because it overcomes the well-known vanishing gradient problem as it employs a function whose second derivative can persist for a long while before reducing to zero. One of the benefits of using deep learning methods is that though relationships between nonlinear data may be hidden, they can still be extracted, and predictions performed. Through a series of forget (ft), input (it), and output (ot) gates, patterns in long sequences of data can be selectively conserved and this process gives the network an advantage over conventional feed-forward neural networks and other RNNs. Information to be forgotten is identified by passing data ($ {h}_{t-1} $ and $ {x}_{t} $) through a sigmoid function that ranges from 0 to 1, so that if the output is 0, information is forgotten, and if 1, information is retained. Conserved information is saved in the input gate and the sigmoid function is applied to the results before further processing with the tanh function and Hadamard product operator (ʘ; Yu et al., 2019). The strength and direction of current information storage (it) ranges from 0 to 1, and ct ranges from − 1 to 1. Each gate is computed as follows:
 Figure 2 Block diagram of the long short-term memory recurrent neural network cell unit
$$ {f}_{t}=\sigma \left({W}_{xf}{x}_{t}+{W}_{hf}{h}_{t-1}+{b}_{f}\right) $$ (7) $$ {i}_{t}=\sigma \left({W}_{xi}{x}_{t}+{W}_{hi}{h}_{t}+{b}_{i}\right) $$ (8) $$ {o}_{t}=\sigma \left({W}_{xo}{x}_{t}+{W}_{ho}{h}_{t-1}+{b}_{o}\right) $$ (9) $$ g_t=tan\;h\left(W_{xg}x_t+W_{hg}h_{t-1}+b_g\right) $$ (10) $$ {c}_{t}={f}_{t}\odot {c}_{t-1}+{i}_{t}\odot {c}_{t} $$ (11) $$ h_t=o_t\odot\tan\;h\left(c_t\right) $$ (12) where t is the time step, Xt is the input vector, Ct−1 is the memory from the previous block, ht−1 is the output of the previous block, Ct and ht are respectively the memory and output of the current block, $ \sigma $ is the sigmoid, tanh is the hyperbolic tangent, ʘ is the Hadamard operator, W is each layer's assigned weight, $ {x}_{t} $ is the input time step t, b is the bias for each gate. In Figure 2, Xt is the input vector, Ct−1 is the memory from the previous block, ht−1 is the output of the previous block, Ct and ht are respectively the memory and output of the current block, σ is the sigmoid, tanh is the hyperbolic tangent, 0 is the bias, $ \times $ and + are the element-wise multiplication and summation/concatenation, respectively.
2.2.3 Performance Indicators
To quantitatively evaluate the LSTM forecast performance, four commonly used statistical techniques are applied. The root mean square error (RMSE), relative RMSE (RRMSE), mean absolute error (MAE), and correlation coefficient (r2) are given as follows:
$$ \begin{array}{c}RMSE=\sqrt{\frac{\sum_{i=1}^{N_i}\left(y_i-{\dot y}_i\right)^2}{N_i}}\\RRMSE=\frac{100}{\overset-y}\sqrt{\sum\nolimits_{i=1}^{N_i}\left(y_i-{\dot y}_i\right)^2}\\\begin{array}{c}MAE=\frac1N\sum\nolimits_{i=1}^N\left|y_i-\dot{y_i}\right|\\r^2=1-\frac{\sum_i^{N_i}\left(y_i-\dot{y_i}\right)^2}{\sum_{i=}^{N_i}\left(y_i-{\overline y}_i\right)^2}\end{array}\end{array} $$ (13) where yi and ẏi respectively the observed and forecasted wind speed, and $ {\stackrel{-}{y}}_{i} $ is the mean wind speed. Typically, smaller values of each measure indicate better forecasting skill and r2 is the goodness-of-fit measure for LSTM. The larger r2 is, the better the model fit.
3 Results
3.1 Scatterometer Results
Employing daily scatterometer observations of surface wind speed, it can be observed in the 2009-2019, 11-year means plotted in Figure 3a that wind speeds indeed exceed 10 m/s throughout the majority of the CS, peaking at approximately 15 m/s along the Caribbean Colombian coastline. When these wind speeds are processed into wind energy density in Figure 3b, minute spatial deviations in wind speed throughout the region become more pronounced due to the cubed relationship between wind speed and energy density (Eq. 2). The wind power density (WPD) over the study period reached an 11-year maximum mean of 1000 W/m2, though this value is observed only along the Colombian Caribbean coastline. In the central Caribbean, WPD decreased radially from that point to 480-800 W/m2 in the eastern and western Caribbean Sea, before reaching a minimum of approximately 200 W/m2 in the Colombian Basin, Gulf of Honduras, Gulf of Gonâve, and along the northern Venezuelan coastline. The Lesser Antilles in the eastern Caribbean Sea also feature relatively a relatively high wind power density of 400-600 W/m2.
 Figure 3 Eleven-year (2009-2019) mean wind speed (a) and wind power density (b) derived from scatterometer observations converted the 100 m height
On a monthly scale, plotted in Figure 4, it can be observed that the highest wind speeds, i.e., those exceeding 8 m/s, and over the widest surface area are found over 8 months ranging from January to April and July, August, October, and November. This pattern, and the general pattern of surface wind speed, is caused by the presence and activity of the CLLJ, which is the one of the main regional climatic features (Whyte et al., 2008; Durán-Quesada, et al., 2020). For the remaining months, mean wind speeds dip below 8 m/s, and its area of effect is significantly reduced as compared to the more active months. June, in particular, has very low wind speeds and only the eastern CS has wind speeds ranging from 6-7 m/s, though this pattern is eliminated during July. Additionally, and most relevant for this study, while the highest wind speeds are observed in the Colombian CS, the largest area of intense winds are in the central Caribbean Sea, far offshore. It should also be noted that under direct CLLJ forcing, the highest mean wave heights and winds (inclusive of extremes) would also be found in this area (Appendini et al., 2014, 2015: Devis-Morales et al., 2017), thus encumbering offshore operations.
 Figure 4 Mean monthly scatterometer-derived surface wind speeds over the 11-year, 2009-2019 period
Using Eq. 2, wind speeds converted to the 100 m height were processed into WPD, with results plotted in Figure 5. There, it can be observed that maximum WPD occurs temporally in January, July, and October and can reach approximately 1500 W/m2, though the spatial distribution of these values is constricted to a very small area just off the Colombian CS. A WPD of 750 W/m2 is observed in the central CS that lasts from January-May, July, August, October, and November, a 9-month period. At this juncture, it is worth noting that results observed from scatterometer measurements are in strong agreement with those as derived from reanalysis (Chadee and Clarke, 2014; Soares et al., 2020), thereby demonstrating the interchangeability of datasets for wind energy resource assessments.
 Figure 5 Mean monthly scatterometer-derived surface wind power density over the 11-year, 2009-2019 period
To investigate the stability of wind energy, nondimensional monthly and seasonal coefficients of variation were computed (Eqs. 3 and 4, respectively) with the results plotted in Figure 6. On monthly scales (Figure 6a), it is easily observed that WPD in the southern Colombian Basin in the Mosquito and Darien Gulfs is very unstable, though stability increases gradually towards the north and reaches comparable levels of stability as compared to the Venezuelan Basin at the 16°N line of latitude. Similar patterns can be observed on seasonal scales (Figure 6b), though to a significantly reduced degree. Consequently, in terms of resource availability (Figure 3) and stability, the central CS is suggested to be the optimum location for offshore wind turbine installations. To confirm this hypothesis, buoys located throughout the CS are accessed and their data used in the subsequent section to calculate wind turbine electricity output.
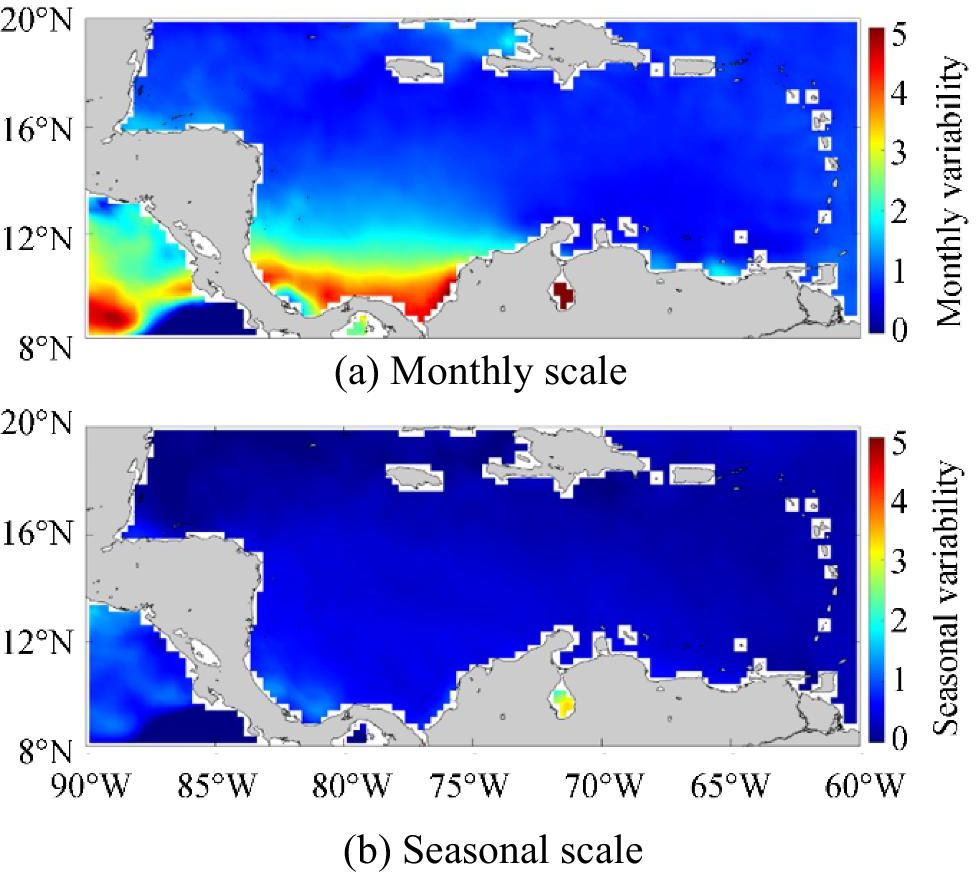 Figure 6 Coefficient of variation. a Monthly scale. b Seasonal scale
3.2 Buoy Results
Using the available records, wind roses were plotted for each of the NDBC buoys and are displayed in Figure 7. The most prominent feature is that regardless of buoy, winds primarily blow from the east, though more directional spread can be observed at buoy 42, 057 (Figure 7a), than any other. Additionally, wind speed in no case was observed to exceed 14 m/s, but this is naturally deceptive as it is relatively unlikely for hurricanes that enter the region to pass close enough to any buoy to have its data recorded without instrumentation damage. Consequently, and based on this observation, in the future selection of offshore wind turbines, class 1 turbines should be chosen as these are designed to endure the tough operating conditions experienced at sites with average wind speeds above 8.5 m/s. Turbine selection should also consider hurricane activity.
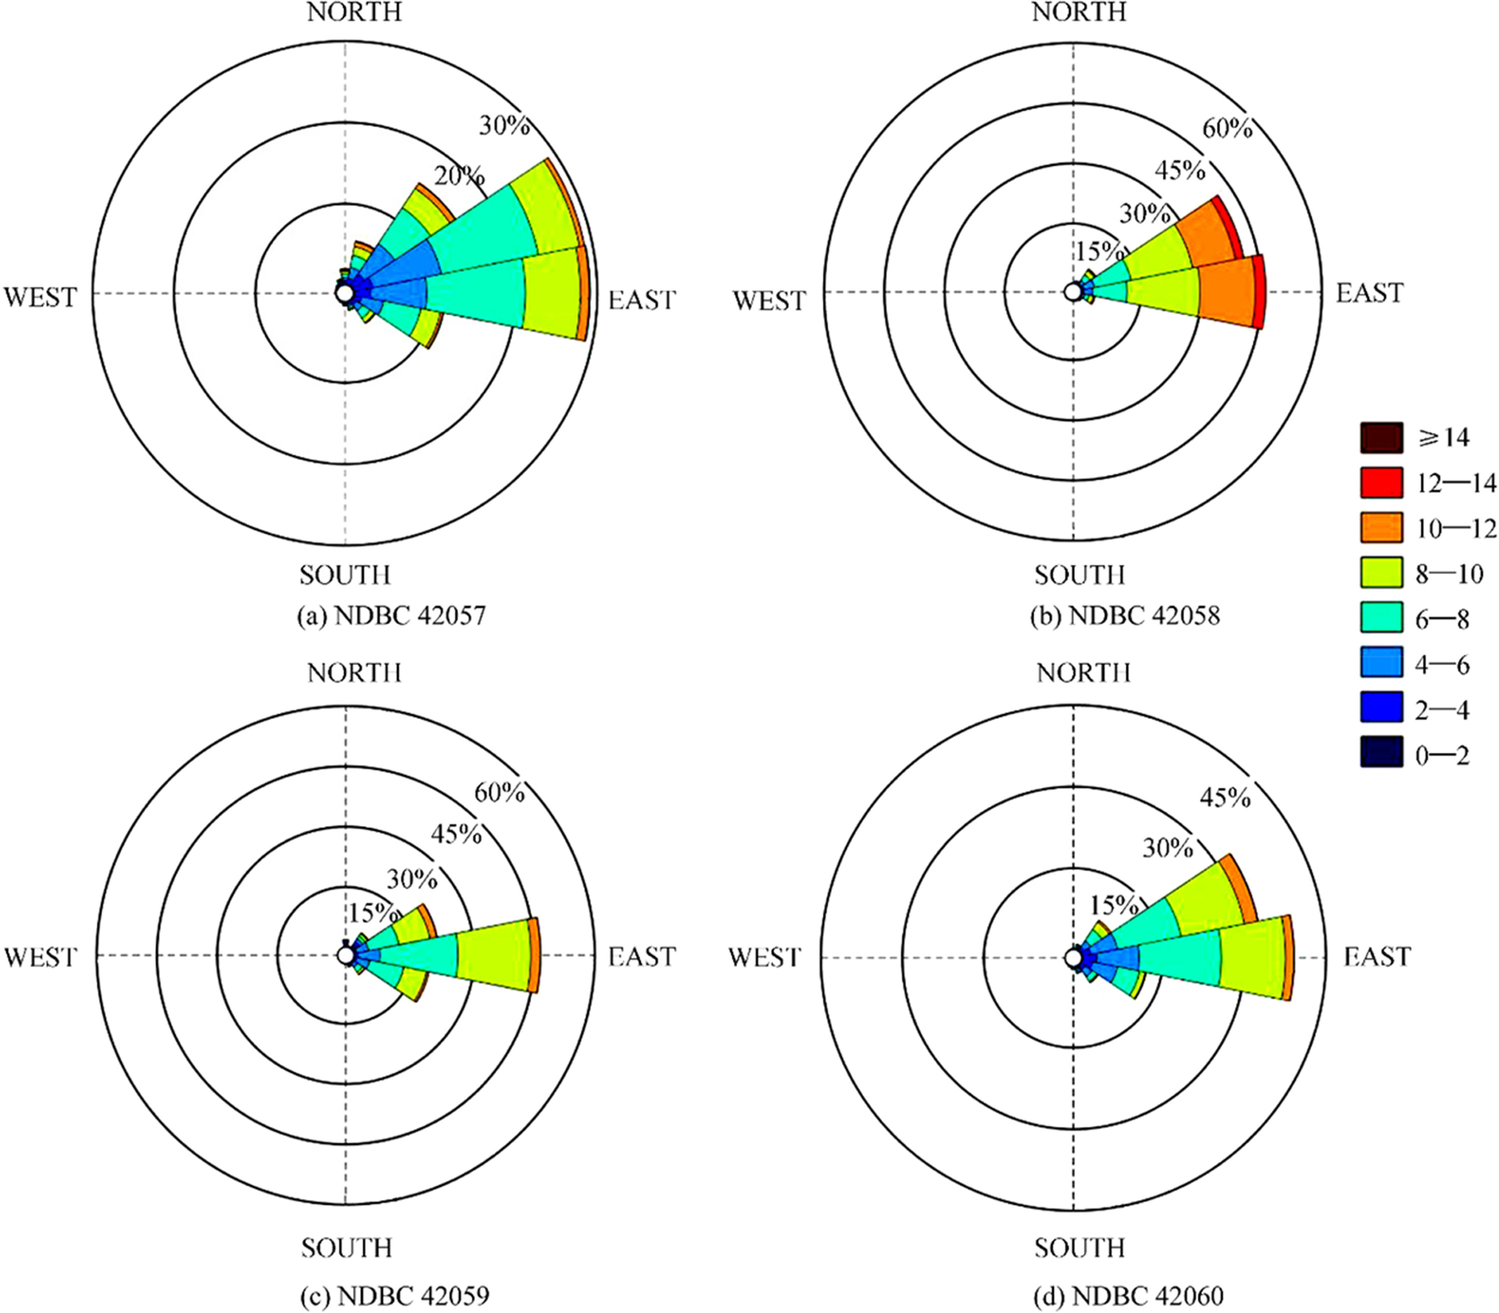 Figure 7 a-d Wind roses for National Data Buoy Center buoys. Wind speed is given in m/s and was discretized into 8 equally spaced, 45° wide bins
To estimate candidate site suitability, Eq. 4 is used to compute the theoretical energy output for the Swiss Electric YZ150/10.2 turbine based on the wind power curves which, in Figure 8, graphically display the relationship between the rated wind turbine hub height and wind speed (Lydia et al., 2014; 2015). In each case, it can be observed that wind speeds observed by the buoys exceeded the cut-out speed of the turbine, necessitating a shutdown. This can be attributed easily to either hurricane or in the case of buoy 42, 058 that lies in the central CS, strong CLLJ activity.
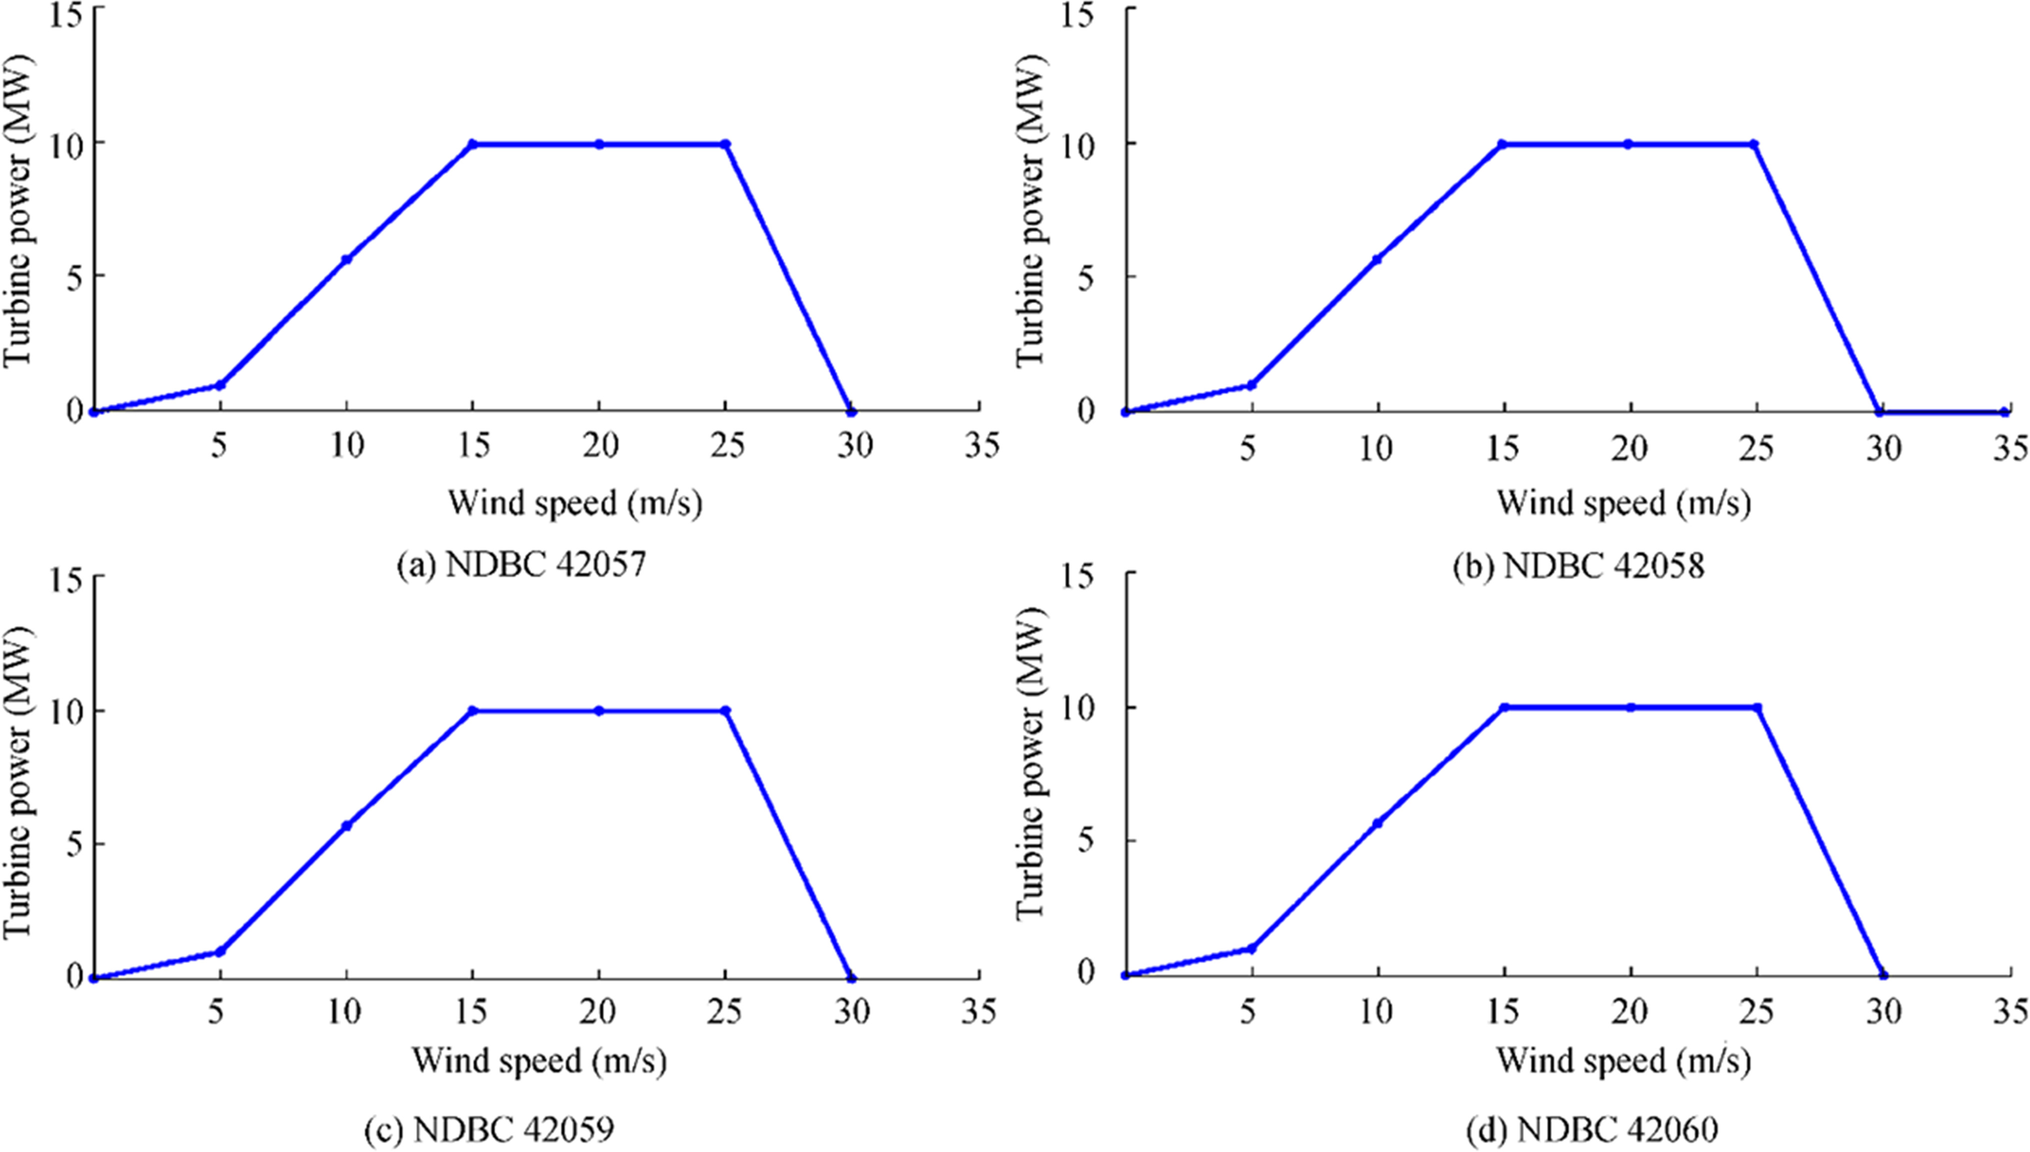 Figure 8 a-d Swiss Electric YZ150/10.2 turbine power curves for NDBC buoys
Using the power curves of Figure 5, the theoretical average turbine power for each buoy location is given in Table 4, unsurprisingly, buoy 42, 058, with 8.2 MW electricity output approached closest to the turbine's maximum of 10 MW, followed by 42, 059 at 6.5 MW, 42, 060 at 6 MW, and 42, 057 at 5.6 MW, thus illustrating that with increasing distance away from the central CS and CLLJ, energy output correspondingly decreases. Consequently, purely in terms of electrical output potential, placing turbines further offshore would be ideal. However, additional considerations such as anchoring and mooring design which are dependent on water depth, seabed characteristics and environmental impact complicate the identification of optimal installation sites (Jiang, 2021).
Table 4 Capacity factor and average power at each NDBC buoy location at the 100-m hub height for the Swiss Electric YZ150/10.2 offshore wind turbineBuoy ID Capacity factor (%) Average turbine power (kW) 42057 51.56 5672.27 42058 74.60 8206.06 42059 59.46 6541.52 42060 55.20 6072.33 With reference to the water depths of each buoy listed in Table 2, it can be suggested that neither gravity base foundation, monopile, nor jacket-supported bottom-fixed offshore wind turbines would be suitable as they are considered economic for water depths of less than 10 m, 20-40 m, and 50-70 m, respectively (Dong et al., 2011; Hermans and Peeringa, 2016; Wu et al., 2019). Consequently, floating wind turbines are perhaps the best choice as they can access depths of up to 700-1300 m (Musial et al., 2016), but this range excludes all locations but buoy 42, 057 that possesses the lowest theoretical output. It is natural to consider that offshore wind turbine installations should therefore happen within significantly shallower water. For the Caribbean Sea that is comprised of SIDS and Central and South American coastal communities, this option is perhaps not feasible as their tourist-based economies rely heavily on unspoiled natural landscapes (Maslov et al., 2017; Jensen et al., 2018; WTTC, 2019; Peterson, 2020). In addition to installing wind turbines further offshore, another strategy to increase total electrical output of a possible wind farm could be to increase the rated wind power for a given turbine so more electricity can be produced at a given site. Generally, while these and past results have argued for the development of larger and taller wind turbines to harness more energy in the same geographical space, thereby increasing overall efficiency, it can be equivalently suggested that developing small but powerful and efficient (i.e., high power ratings) turbines would achieve similar results. Research into the optimization of wind turbine hub heights is thus essential for a given region (IEC, 2005; Sieros et al., 2012; Lee et al., 2019).
Forecasting of energy resources is crucial for optimum grid control and design in power plants, power allocation, in addition to economic scheduling, dispatching, among other operations (Nazir et al., 2020; Santhosh, et al., 2020). In this section, the forecasting of wind speed is performed using the LSTM neural network to demonstrate applicability on regional NDBC buoy observations. For each buoy case, 70% of the data was used to train the model, with the remaining 30% forecasted. In each buoy case, preliminary experiments showed that a time step of 3 h was optimum and was used to conduct hour-ahead forecasting. As shown in Figure 9 with results listed in Table 5, regardless of buoy location, LSTM forecasting accuracy exceeds 0.90, demonstrating its strong ability to forecast surface wind speed. With reference to Figure 1, it can also be observed that central CS buoys (42, 058 and 42, 059) had the highest r2 and lowest RMSE, RRMSE, and MAE values, with border CS buoys (42, 057 and 42, 060) having comparatively lower forecast skill. As the main axis of the CLLJ lies at the 15°N, central CS buoys recorded winds direct from the jet, while border CS buoys recorded the weak winds at either the head of the CLLJ (buoy 42, 060), or its tail (buoy 42, 057), rather than its body (buoys 42, 058 and 42, 059).
 Figure 9 a-d Forecast (3 h) of buoy-observed wind speed extrapolated to the 100-m height results. Data points refer to the number of wind speed observationsTable 5 Three-hour 100-m wind speed forecast results
NDBC ID Performance Indicators r2 RMSE (m/s) RRMSE (m/s) MAE (m/s) 42057 0.90 1.42 0.13 0.98 42058 0.94 1.16 0.13 0.84 42059 0.93 0.78 0.10 0.55 42060 0.91 1.48 0.14 1.09 Though this preliminary study restricted the forecast lag to 3 h, both increasing and decreasing the forecast horizon are the subjects of intensive study for short-term (inclusive of the ultra-short-term) and long-term predictions (Lu et al., 2018; He and Xu, 2019; Akhtar et al., 2021) and as such, future studies should include additional variables such as air temperature and pressure that would make such forecasts feasible. Different forecast horizons are required for different applications, and thus, this research is of primary importance for a nascent offshore wind energy industry in the CS and should be conducted in subsequent research.
4 Conclusion and Discussion
Global island and coastal communities are inextricably linked to the sea and for the small island developing states (SIDS) bordering the Caribbean Sea (CS), their economic health is especially coupled. At the precipice of the UN Decade of Ocean Science for Sustainable Development (2021-2030) and under the continued context of the global transition to renewables, conducting natural resource assessments is crucial. Based on analyses of both in situ and satellite-observed surface wind speed, it was determined that purely in terms of resource availability, the central CS was the optimum location, and this is due primarily to Caribbean Low-Level Jet (CLLJ) activity that delivered intense winds exceeding 8 m/s for 7 months of the year, and over a wide geographical area. This resulted in the observation that in a very narrow area off the Colombian CS coast, mean wind power density (WPD) values peaked at 1000 W/m2 at the 100 m height. In January, July, and October, it was observed that WPD could increase even further to 1500 W/m2. For the majority of the CS, although the CLLJ does vary on both spatial and temporal scales, as determined by the coefficient of variation, WPD was also very stable, thus increasing its attractiveness to energy exploitation. Wind speed forecasting is also crucial to this energy exploitation and through application of the LSTM neural network, it was found that wind speed was best predicted in the central CS under the direct influence of the CLLJ as represented by buoy 42, 058. This was assessed using four common performance indicators: the correlation coefficient (r2), root mean square error (RMSE), relative root mean square error (RRMSE), and mean absolute error (MAE). Specifically, buoy 42, 058 reached a maximum r2 of 0.94 with a RMSE of 1.14, a RRMSE of 0.13, and a MAE of 0.84. Further away from the CLLJ's main area of effect, buoy 42, 059 had a lower forecasting accuracy with r2, RMSE, RRMSE, and MAE being measured at 0.93, 1.16, 0.13, and 0.84, respectively. The lowest forecasting skill was observed at buoy 42, 057 that lies furthest away from the CLLJ main axis at the CS western border and possessed r2, RMSE, RRMSE, and MAE values of 0.90, 1.42, 0.13, and 0.98, respectively. Similarly, forecast accuracy for buoy 42, 060 on the CS eastern boundary was low with r2, RMSE, RRMSE, and MAE values being measured at 0.91, 1.48, 0.14, and 1.09, respectively. In subsequent studies, higher resolution data (e.g., 10 min, rather than hourly) can be used to develop and optimize a LSTM-based ultra-short-term wind speed forecasting model. Identically, to lengthen the forecast range, additional variables such as air temperature and pressure can be included in the model for greater robustness for extended forecasts.
This study limited its investigation to the theoretical and technical wind resource potentials leaving a great deal of additional research to be conducted. Based on these preliminary results, however, it is strongly thought that offshore wind energy resources are sufficient that could, if turbines are arranged in wind farms and issues concerning their mooring/anchoring in deep water, and electricity transmissions can be mitigated, if not eliminated through technological advancements or clever strategy. For example, the issue of transmission can be dealt with, if only partially, but offshore wind farms producing energy carriers such as hydrogen and this is transported to the mainland during operation and maintenance activities. This hydrogen can also be supplied to a new generation of hydrogen-powered shipping vessels in the maritime industry. Additionally, multipurpose platforms, such as those that co-locate wind and wave energy projects or merge offshore wind and a mariculture facility could be built. This allows the disadvantages of placing such facilities so far offshore to be offset. Extreme waves and hurricane activity remain considerable hurdles to wind energy development in the CS and should be intensely studied in future research if the project is to be made not only economically viable, but one that SIDS and coastal communities Scan rely on for reducing carbon dioxide emissions, triggering economic growth, and providing employment opportunities.
Acknowledgements: The author thanks Ali Sichone for his assistance in using the LSTM network and visualization. -
Figure 1 Study area with National Data Buoy Center buoy locations marked. Shading is the water depth (m)
Figure 2 Block diagram of the long short-term memory recurrent neural network cell unit
Figure 3 Eleven-year (2009-2019) mean wind speed (a) and wind power density (b) derived from scatterometer observations converted the 100 m height
Figure 4 Mean monthly scatterometer-derived surface wind speeds over the 11-year, 2009-2019 period
Figure 5 Mean monthly scatterometer-derived surface wind power density over the 11-year, 2009-2019 period
Figure 6 Coefficient of variation. a Monthly scale. b Seasonal scale
Figure 7 a-d Wind roses for National Data Buoy Center buoys. Wind speed is given in m/s and was discretized into 8 equally spaced, 45° wide bins
Figure 8 a-d Swiss Electric YZ150/10.2 turbine power curves for NDBC buoys
Figure 9 a-d Forecast (3 h) of buoy-observed wind speed extrapolated to the 100-m height results. Data points refer to the number of wind speed observations
Table 1 Accessed National Buoy Data Center buoys and their relevant statistics
NDBC ID Latitude (°N) Longitude (°W) Anemometer height (m) Water depth (m) Number of observations Data availability (%) 42057 16.906 81.422 3.8 377 73, 959 76.71 42058 14.776 74.548 3.8 4158 73, 284 68.23 42059 15.252 67.483 4.1 4784 76, 521 78.78 42060 16.433 63.331 3.8 1469 75, 815 78.64 Table 2 Accessed National Buoy Data Center buoys and their relevant statistics continued
NDBC ID Latitude (°N) Longitude (°W) Max. wind speed (m/s) Min. wind speed (m/s) Standard deviation (m/s) 42057 16.906 81.422 33.18 0.001 3.26 42058 14.776 74.548 51.47 0.001 3.34 42059 15.252 67.483 33.98 0.001 3.34 42060 16.433 63.331 49 0.001 3.36 Table 3 Swiss Electric YZ150/10.2 turbine power curve coefficients
Rated power (MW) Cut-in speed (m/s) Rated speed (m/s) Cut-out speed (m/s) Survival speed (m/s) 10 3 13 25 70 Table 4 Capacity factor and average power at each NDBC buoy location at the 100-m hub height for the Swiss Electric YZ150/10.2 offshore wind turbine
Buoy ID Capacity factor (%) Average turbine power (kW) 42057 51.56 5672.27 42058 74.60 8206.06 42059 59.46 6541.52 42060 55.20 6072.33 Table 5 Three-hour 100-m wind speed forecast results
NDBC ID Performance Indicators r2 RMSE (m/s) RRMSE (m/s) MAE (m/s) 42057 0.90 1.42 0.13 0.98 42058 0.94 1.16 0.13 0.84 42059 0.93 0.78 0.10 0.55 42060 0.91 1.48 0.14 1.09 -
Akhtar I, Kirmani S, Ahmad M, Ahmad S (2021) Average monthly wind power forecasting using fuzzy approach. IEEE Access 9: 20426-30440 Al-Dahidi S, Baraldi P, Nigro E, Zio E, Lorenzo M (2020) An ensemble of echo state networks for predicting the energy production of wind plants. The 30th European Safety and Reliability Conference and the 15th Probabilistic Safety Assessment and Management Conference. 1-5 November 2020, Venice, Italy. 965-972. doi: 10.3850/978-981-14-8593-0_5701-cd Appendini CM, Urbano-Latorre CP, Figueroa B, Dagua-Paz CJ, Torres-Freyermuth A, Salles P (2015) Wave energy potential assessment in the Caribbean low level jet using wave hindcast information. Appl Energ 137: 375-384 https://doi.org/10.1016/j.apenergy.2014.10.038 Appendini CM, Torres-Freyermuth A, Salles P, López-González L, Mendoza ET (2014) Wave climate and trends for the Gulf of Mexico: a 30-yr wave hindcast. J Clim 27: 1619-1632. https://doi.org/10.1175/JCLI-D-13-00206.1. Bagiorgas HS, Mihalakakou G, Rehman S, Al-Hadhrami LM (2012) Offshore wind speed and wind power characteristics for ten locations in Aegean and Ionian Seas. J Earth Syst Sci 121(4): 975-987 https://doi.org/10.1007/s12040-012-0203-9 Banik A, Behera C, Sarathkumar TV, Goswami AK (2020) Uncertain wind power forecasting using LSTM-based prediction interval. IET Renew Power Gen 14(14): 2657-2667 https://doi.org/10.1049/iet-rpg.2019.1238 Barthelmie RJ (2001) Evaluating the impact of wind induced roughness change and tidal range on extrapolation of offshore vertical wind speed profiles. Wind Energy 4: 99-105 https://doi.org/10.1002/we.45 Barthelmie JB, Pryor SC, Hasager CB, Christiansen MB, Jørgensen BH (2007) Offshore coastal wind speed gradients: issues for the design and development of large offshore windfarms. Wind Eng 31(6): 369-382 https://doi.org/10.1260/030952407784079762 Carvalho D, Rocha A, Gómez-Gesteira M, Silva Santos C (2017) Offshore winds and wind energy production estimates derived from ASCAT, OSCAT, numerical weather prediction models and buoys - A comparative study for the Iberian Peninsula Atlantic coast. Renew Energy 102: 433-444. https://doi.org/10.1016/j.renene.2016.10.063. Chadee X, Seegobin NR, Clarke RM (2017) Optimizing the weather research and forecasting model for mapping the near-surface wind resources over the southernmost Caribbean Islands of Trinidad and Tobago. Energies 10(7): 931 https://doi.org/10.3390/en10070931 Chadee X, Clarke RM (2014) Large-scale wind energy potential of the Caribbean region using near-surface reanalysis data. Renew Sust Energy Reviews 20: 45-58 Chang WY (2014) A literature review on wind forecasting methods. JPEE 2: 161-168. . Chang WY (2014) A literature review on wind forecasting methods. JPEE 2: 161-168. https://doi.org/10.4236/jpee.2014.24023. Chen X, Wang K, Zhang Z, Zeng Y, Zhang Y, O'Driscoll K (2017) An assessment of wind and wave climate as potential sources of renewable energy in the nearshore Shenzhen coastal zone of the South China Sea. Energy 134: 789-801. https://doi.org/10.1016/j.energy.2017.06.043 Costoya X, deCastro M, Sousa MC, Gómez-Gesteira M (2019) Projections of wind energy resources in the Caribbean for the 21st century. Energy 178: 356-367. https://doi.org/10.1015/j.energy.2019.04.121. Devis-Morales A, Montoya-Sánchez RA, Bernal G, Osorio AF (2017) Assessment of extreme wind and waves in the Colombian Caribbean Sea for offshore applications. Appl Ocean Res 69: 10-26 https://doi.org/10.1016/j.apor.2017.09.012 Díaz H, Rodrigues JM, Guedes Soares C (2016) Preliminary cost assessment of an offshore floating wind farm installation on the Galician coast. Progress in Renewable Energies Offshore. Progress in Renewable Energies Offshore: Proceedings of the 2nd International Conference on Renewable Energies, 2016 (RENEW2016); Leiden, (2016). 843-850 Dong W, Moan T, Gao Z (2011) Long-term fatigue analysis of multi-planar tubular joints for jacket-type offshore wind turbine in time domain. Eng Struct 33(6): 2002-2014 https://doi.org/10.1016/j.engstruct.2011.02.037 Durán-Quesada AM, Sorí R, Ordoñez P, Gimeno L (2020) Climate Perspectives in the Intra-American Seas. Atmosphere 11(9): 959. https://doi.org/10.3390/atmos11090959. Frank HP, Larsen S, Højstrup J (2000) Simulated wind power offshore using different parameterizations for the sea surface roughness. Wind Energy 3: 67-79 https://doi.org/10.1002/1099-1824(200004/06)3:2<67::AID-WE29>3.0.CO;2-2 Gangwar S, Bali V, Kumar A (2019) Comparative analysis of wind speed forecasting using LSTM and SVM. ICST Transactions on Scalable Information Systems 7(25): 159407. https://doi.org/10.4108/eai.13-7-2018.159407. García E, Quiles E, Correcher A, Morant F (2018) Sensor buoy systems for monitoring renewable marine energy resources. Sensors 18(4): 945. https://doi.org/10.3390/s18040945. Golbazi M, Archer CL (2020) Sea surface roughness for offshore wind energy. Phys Conf Ser 1452: 012024. https://doi.org/10.1088/1742-6596/1452/1/012024. Gorton AM, Newsom RK, Shaw WJ, Draher J (2019) Contributing to long-term wind resource characterization through buoy-based observations of meteorological and oceanographic conditions. OCEANS 2019 MTS/IEEE SEATTLE, Seattle, WA, USA, 2019: 1-6. https://doi.org/10.23919/OCEANS40490.2019.8962727 Gökgöz F, Filiz F (2018) Deep learning for renewable power forecasting: an approach using LSTM neural networks. Int J Energy Eng 12(6): 412-416 Gualtieri G, Secci S (2012) Methods to extrapolate wind resource to turbine hub height based on power law: A 1-h wind speed vs Weibull distribution extrapolation comparison. Renew Energy 43: 183-200 https://doi.org/10.1016/j.renene.2011.12.022 Guo Q, Xu X, Zhang K, Li Z, Huang W, Mansaray LR, Liu W, Wang X, Guo J, Huang J (2018) Assessing global ocean wind energy resources using multiple satellite data. Remote Sens 10(1): 100. https://doi.org/10.3390/rs10010100. Han L, Romero CE, Yao Z (2015) Wind power forecasting based on principle component phase space reconstruction. Renew Energy 81: 737-744 https://doi.org/10.1016/j.renene.2015.03.037 He J, Xu J (2019) Ultra-short-term wind speed forecasting based on support vector machine with combined kernel function and similar data. J Wireless Com Network 248 https://doi.org/10.1186/s13638-019-1559-1. Hermans K, Peeringa J (2016) Future XL monopile foundation design for a 10 MW wind turbine in deep water. Technical Report, ECN-E-16-069. The Netherlands: ECN Hevia-Koch P, Jacobsen HK (2019) Comparing offshore and onshore wind development considering acceptance costs. Energy Policy 125: 9-19. https://doi.org/10.1016/j.enpol.2018.10.019. Ibrahim M, Alsheikh A, Al-Hindawi Q, Al-Dahidi S, ElMoaqet H (2020) Short-time wind speed forecast using artificial learning-based algorithms. Comput Intell Neurosci 2020(12): 15 Jensen CU, Panduro TE, Lundhede TH, Nielsen ASE, Dalsgaard M, Thorsen BJ (2018) The impact of on-shore and off-shore wind turbine farms on property prices. Energy Policy 116: 50-59 https://doi.org/10.1016/j.enpol.2018.01.046 Leahy PG, Kerlin C, Foley AM (2012) Characteristics of offshore wind speeds using buoy measurements. Proceedings of SEEP2012, 05-08 June 2012, DCU, Dublin, Ireland Lee J, Kim H, Kang Y, Kim J (2019) Determining the optimized hub height of wind turbine using the wind resource map of South Korea. Energies 12: 2949. https://doi.org/10.3390/en12152949. Li J, Geng D, Zhang P, Meng X, Liang Z, Fan G (2019) Ultra-short term wind power forecasting based on LSTM neural network. 2019 IEEE 3rd International Electrical and Energy Conference (CIEEC), 7-9 Sept. 2019, 1815-1818. https://doi.org/10.1109/CIEEC47146.2019.CIEEC-2019625. Liu Y, Li S, Yi Q, Chen D (2016) Developments in semi-submersible floating foundations supporting wind turbines: a comprehensive review. Renew Sustain Energy Rev 60: 433-449 https://doi.org/10.1016/j.rser.2016.01.109 Li L, Torralba C, Soret A, Ramon J, Doblas-Reyes FJ (2019) Seasonal forecasts of wind power generation. Renew Energy 143: 91-100 https://doi.org/10.1016/j.renene.2019.04.135 Lu P, Ye L, Sun B, Zhang C, Zhao Y, Teng J (2018) A new hybrid prediction method of ultra-short-term wind power forecasting based on EEMD-PE and LSSVM optimized by the GSA. Energies 11(4): 647. https://doi.org/10.3390/en11040697. Lydia M, Kumar SS, Selvakumar AI, Kumar GEP (2014) A comprehensive review on wind turbine curve modeling techniques. Renew Sust Energy Reviews 30: 452-460 https://doi.org/10.1016/j.rser.2013.10.030 Lydia M, Kumar SS, Selvakumar AI, Kumar GEP (2015) Wind resource estimation using wind speed and power curve models. Renew Energy 83: 425-434 https://doi.org/10.1016/j.renene.2015.04.045 Ma X, Chen Y, Yi W, Wang Z (2021) Prediction of extreme wind speed for offshore wind farms considering parametrization of surface roughness. Energies 14: 1033. https://doi.org/10.3390/en14041033. Marndi A, Patra GK, Gouda KC (2020) Short-term forecasting of wind speed usin time division ensemble of hierarchical deep neural networks. Bull of Atmos Sci & Technol 1: 91-10. https://doi.org/10.1007/s42865-020-00009-2. https://doi.org/10.https://doi.org/10.1007/s42865-020-00009-2 Maslov N, Claramunt C, Wang T, Tang T (2017) Evaluating the visual impact of an offshore wind farm. Energy Procedia 105: 3095-3100 https://doi.org/10.1016/j.egypro.2017.03.649 Musial W, Heimiller D, Beiter P, Scott G, Draxl C (2016) Offshore wind energy resource assessment for the United States. NREL/TP-5000-66599 Nazir MS, Alturise F, Alshmrany S, Nazir HMJ, Bilal M, Abdalla AN, Sanjeevikumar P, Ali ZM (2020) Wind generation forecasting methods and proliferation of artificial neural network: a review of five years research trend. Sustainability 12: 3778. https://doi.org/10.3390/su12093778. Peterson RR (2020) Over the Caribbean top: community well-being and over-tourism in small island tourism economies. Int Journal of Com WB. https://doi.org/10.1007/s42413-020-00094-3 Pereira FS, Silva CS (2020) Offshore wind energy resource assessment from satellite data observations and WRF in Porto Santo Island. Wind Energ Sci Discuss. https://doi.org/10.5194/wes-2020-7 Possner A, Caldeira K (2017) Geophysical potential for wind energy over the open oceans. Proc Natl Acad Sci 114(43): 11338-11343. https://doi.org/10.1073/pnas/1705710114. Rueda-Bayona JG, Guzmán A, Eras JJC, Silva-Casarín R, Bastidas-Arteaga E, Horrillo-Caraballo J (2019a) Renewable energies in Colombia and the opportunity for the offshore wind technology. J Clean Prod 220: 529-543. https://doi.org/10.1016/j.jclepro.2019.02.174. Rueda-Bayona JG, Guzmán A, Eras JJC (2019) Wind and power density data of strategic offshore locations in the Colombian Caribbean coast. Data Brief 27: 104720. https://doi.org/10.1016/j.dib.2019.104720 (0-3). Rusu L, Ganea D, Mereuta E (2018) A joint evaluation of wave and wind energy resources in the Black Sea based on 20-year hindcast information. Energ Explor Exploit 36(2): 335-351. https://doi.org/10.1177/0144598717736389. Remmers T, Cawkwell F, Desmond C, Murphy J, Politi E (2019) The potential of advanced scatterometer (ASCAT) 12.5 km coastal observations for offshore wind farm site selection in Irish waters. Energies 12(2): 206. https://doi.org/10.3390/en12020206. Rogers T, Ashtine MI, Koon Koon R, Atherley-Ikechi M (2019) Onshore wind energy potential for small island developing states: findings and recommendations from Barbados. Energy Sustain Dev 52: 116-127. https://doi.org/10.1016/j.esd.2019.08.002. Santhosh M, Venkaiah C, Kumar DMV (2020) Current advances and approaches in wind speed and wind power forecasting for improved renewable energy integration: a review. Engin Reports 2(6): e12178 Satir M, Murphy F, Mcdonnell K (2017) Feasibility study of an offshore wind farm in the Aegean Sea Turkey. Renew Sust Energ Rev 81(2): 2552-2562 Sieros G, Chaviaropolos PK, Sørensen JD, Jamieson P (2012) Upscaling wind turbines: theoretical and practical aspects and their impact on the cost of energy. Wind Energy 15(1): 3-17. https://doi.org/10.1002/we.527. Shi X, Huang S, Huang Q, Lei X, Li J, Li P, Yang M (2019) Deep-learning-based wind speed forecasting considering spatial-temporal correlations with adjacent wind turbines. J Coast Res Special Issue No. 93: Advances in Water Resources and Exploration (FALL 2019), 623-632 Soares PMM, Lima DCA, Nogueira M (2020) Global Offshore wind energy resources using the new ERA-5 reanalysis. Environ Res Lett 15(10): 1040a2 https://doi.org/10.1088/1748-9326/abb10d Sohoni V, Gupta SC, Nema R (2016) A critical review on wind turbine power curve modelling techniques and their applications in wind based energy systems. J Energy 10: 1-18 Soukissian T, Karathanasi F, Axaopoulos P (2017) Satellite-based offshore wind resource assessment in the Mediterranean Sea. IEEE J Ocean Engin 42(1): 73-86 https://doi.org/10.1109/JOE.2016.2565018 United Nations (UN) (2019) Accelerating SDG 7 achievement. SDG 7 Policy Briefs in Support of the High-Level Political Forum 2019. Available at https://www.uncclearn.org/wp-content/uploads/library/22877un_final_online_20190523.pdf. Accessed on Mar 26 2021 Viselli A, Filippelli M, Pettigrew N, Dagher H, Faessler N (2019) Validation of the first LiDAR wind resource assessment buoy system offshore the Northeast United States. Wind Energy 22(2): 1548-1562. https://doi.org/10.1002/we.2387. Wang Y, Walter RK, White C, Farr H, Ruttenberg BI (2019) Assessment of surface wind datasets for estimating offshore wind energy along the Central California Coast. Renew Energy 133: 343-353 https://doi.org/10.1016/j.renene.2018.10.008 Whyte FS, Taylor MA, Stephenson TS, Campbell JD (2008) Features of the Caribbean low-level jet. Int J Climat 28(1): 199-128 World Travel and Tourism Council (WTTC) (2019) Economic impact research report 2019. Available at https://www.wttc.org/economic-impact/country-analysis/. Accessed 25 Mar 2021 Yu J, Zhang S, Yang W, Xin Y, Gao H (2020) Design and application of buoy single point mooring system with electro-optical-mechanical (EOM) cable. J Mar Sci Eng 8: 672 https://doi.org/10.3390/jmse8090672 Yu Y, Si X, Hu C, Zhang J (2019) A review of recurrent neural networks: LSTM cells and network architectures. Neural Comput 31: 1235-1270 https://doi.org/10.1162/neco_a_01199 Zaman AAA, Hashim FE, Yaakob O (2019) Satellite-based offshore wind energy resource mapping in Malaysia. JMSA 18: 114-121 https://doi.org/10.1007/s11804-019-00066-w Zhang J, Jiang X, Chen X, Li X, Guo D, Cui L (2019) Wind power generation prediction based on LSTM. ICMAI 2019: Proceedings of the 2019 4th International Conference on Mathematics and Artificial Intelligence, April 2019, 85-89 Zheng X, Qi X, Liu H, Liu X, Li Y (2018) Deep neural network for short-term offshore wind power forecasting. OCEANS-MTS/IEEE Kobe Techno-Oceans (OTO) https://doi.org/10.1109/oceanskobe.2018.8559431 Chadee XT, Clarke RM, (2018) Wind resources and the levelized cost of wind generated electricity in the Caribbean islands of Trinidad and Tobago. Renew Sust Energ Rev 81: 2526-2540 https://doi.org/10.1016/j.rser.2017.06.059 Jiang Z, (2021) Installation of offshore wind turbines: A technical review. Renewable and Sustainable Energy Reviews 139: 110576 https://doi.org/10.1016/j.rser.2020.110576 Xiaoni Wu, Yu Hu, Ye Li, Jian Yang, Lei Duan, Tongguang Wang, Thomas Adcock, Zhiyu Jiang, Zhen Gao, Zhiliang Lin, Alistair Borthwick, Shijun Liao, (2019) Foundations of offshore wind turbines: A review. Renewable and Sustainable Energy Reviews 104: 379-393 https://doi.org/10.1016/j.rser.2019.01.012
