Multi-Crack Interaction and Influence on the Spherical Pressure Hull for a Deep-Sea Manned Submersible
https://doi.org/10.1007/s11804-021-00223-0
-
Abstract
This study investigates the interaction and influence of surface cracks on the spherical pressure hull of a deep-sea manned submersible. The finite element model of the spherical hull is established, and a semi-elliptical surface crack is inserted in the welding toe of the spherical hull as the main crack. Considering the combined effect of external uniform pressure and welding residual stress at the weld toe, the stress intensity factor (SIF) is obtained based on the M-integral method. Inserting disturbing cracks at different positions on the spherical hull surface, the interaction and influence between multi-cracks are revealed by numerical calculation. The results show that the existence of the disturbing crack has a great influence on the stress intensity factor of the main crack, and the influence is different with the different location of disturbing crack. The study of the interaction of multiple cracks under different interference factors and the influence of disturbing cracks on the main crack can provide some reference for future engineering applications. -
1 Introduction
A spherical pressure hull with a medium thickness is adopted for the deep-sea manned submersible. It is welded by a hemisphere or several spherical parts (Figure 1). Surface cracks at the weld toes are the most common defects in welded structures. When the manned submersible is under the combined action of the seawater external pressure load and the welding residual stress at the welding seam, fatigue cracks are prone to initiate and propagate at the welding toes, resulting in structural failure. In practical structures, multi-cracks often exist at the same time, and their size, direction, and distribution are arbitrary. Moreover, there will be a shielding or intensification effect on the crack growth trend because of the cracks' different locations and directions (Fan et al. 2015; Lam and Phua 1991). It is necessary to study the interaction of multi-cracks and its influence law. Currently, the fracture problem with a multi-cracks structure is a key issue in structural integrity research. The stress intensity factor (SIF), as an important parameter to describe the stress field intensity of crack tip, is the primary problem to be solved in the research.
 Figure 1 Spherical pressure hull of manned submersible, adopted by Li WY (Li et al. 2016)
At present, the calculation methods of SIF include analytical methods, numerical methods, and experimental methods. Numerical methods are the most commonly used method for solving the SIF of complex three-dimensional fractures. With the improvement of computer technology, the finite element method (FEM) has the advantages of not being restricted by the geometric form of the cracked body and load, wide application range, and high accuracy. Commonly used finite element methods include the M-integral method (Freund 1978), displacement correlation method (Gerstle and Abdalla 1990), and the virtual crack closure technique (VCCT) (Rybicki and Kanninen 1977). Several scholars have focused on the SIF of two-dimensional and three-dimensional cracks under a complex stress field (Li and Wang 2000; Ayhan and Yücel 2011; Stepanova and Roslyakov 2016; Pasca et al. 2013; Xiao and Yan 2007). For example, Lv et al. (2018) evaluated the SIFs for parallel surface cracks on the plate as a function of crack front position, relative position, aspect ratio, and relative size by numerical analysis based on the M-integral method. Perl et al. (Perl et al. 2016; Perl and Steiner 2015, 2018) calculated the 3-D SIFs of internal surface multiple cracks of spherical pressure vessels by FEM. Jie et al. (2017) used the M-integral method to analyze the surface crack at a cruciform welded joint, verifying that this method is correct and efficient to calculate the SIFs. Ai et al. (2018) calculated the SIF distribution at the front edge of a semi-ellipse surface crack on a flat specimen based on the interaction integral method. The relative error between the result and the theoretical solution was within 4%. Wang and Gao (2019) calculated the SIFs for sliding fatigue-wear with the FEM and carried out the crack propagation and wear analysis well. Xiong et al. (2020) took the finite element numerical solution of the SIF at the midpoint of the crack front edge as the input value and used the ABAQUS and FRANC3D joint simulation to calculate the crack growth step size and the fatigue life of the flat specimen. Most studies on 3-D cracks are concentrated on simple components with a single crack, while less attention has been paid to the interaction and influence of multi-cracks on the spherical pressure hull surface. The spherical pressure hull has several large openings and is welded by the hemisphere equatorial. Moreover, the welding residual tensile stress makes it more susceptible to multiple radial cracking near the welds.
In the present study, the finite element models of the spherical hull are established, and the semi-elliptical surface cracks are inserted at the weld toes of the spherical hull. The SIFs of the surface cracks are studied numerically under external uniform pressure and welding residual stress. By inserting the disturbing cracks at different locations, the influence on the main cracks is analyzed and the interaction of multi-surface cracks under different SIFs is revealed in detail. This paper aims to provide a rational approach to predict the crack growth behavior and fatigue life of spherical pressure hulls.
2 The Analytical and Numerical Results of SIF
Newman and Raju (1981) proposed an empirical formula for calculating the SIF of a surface crack on a flat plate under a tensile force (Eq. (1)). The accuracy of the SIF calculated by this formula is high, but it is only applicable to flat plate structures under a tensile bending load.
$$ {K}_{I}=\left({\sigma }_{t}+{H\sigma }_{b}\right)\frac{\sqrt{\pi a}}{\varphi }F\left(\frac{a}{c},\frac{a}{t},\frac{2c}{w},\varphi \right) $$ (1) where KI refers to the mode Ⅰ SIF, σt refers to the tensile (compression) stress, σb refers to the bending stress, a refers to the crack depth, c refers to the half-length of the crack, t refers to the thickness of the plate, and w refers to the width of the plate.
This study uses a flat plate model (Figure 2) with a central semi-elliptical surface crack to validate the accuracy of the numerical approach. The length, width, and thickness of the plate are 800, 400, and 20 mm, respectively. The surface crack is located at the center of the plate. The crack depth a is 0.3, 0.5, 1, 2, and 4 mm, and the ratio of the crack depth and half-length a/c is 0.6. The material selected is the 20MnMoNb alloy steel. The parameters are set as follows: yield stress of 490 MPa, Young's modulus of 210 GPa, and Poisson's ratio of 0.3. During the calculation, a fully constrained boundary condition is applied at one end of the plate model, and a tensile force of 100 MPa is applied at the other end (Zhu et al. 2020). Surface cracks are introduced and the mesh will then be re-divided as shown in Figure 2b. The mesh of the plate's finite element model is divided freely and uniformly. The total number of elements is approximately 800, and the number of nodes is approximately 1700. In addition, the 20-node singular elements are divided around the crack front with an element length of 0.01 mm.
 Figure 2 Flat plate model with a central surface crack (Zhu et al. 2020)
The SIFs of the crack front are solved by the M-integral method (Budiansky and Rice 1973; Knowles and Sternberg 1972; Rice 1964; Wawrzynek et al. 2005) in FRANC3D (Fracture Analysis Consultants Inc. 2016). The finite element numerical solutions are compared with the theoretical solution of the Newman–Raju formula. Tables 1 and 2 show the results of the SIF at the crack surface point KIc and the deepest point KIa, respectively.
Table 1 Analytical and numerical solutions of the SIF of the surface point KIca (mm) KIc (MPa·mm1/2) Differences (%) Newman–Raju M-Integral 0.3 69.72 71.628 − 2.74 0.5 90.04 92.031 − 2.21 1 127.4 128.23 − 0.65 2 181.52 184.57 − 1.68 4 263.19 261.07 0.81 Table 2 Analytical and numerical solutions of the SIF of the deepest point KIaa (mm) KIa (MPa·mm1/2) Differences (%) Newman–Raju M-Integral 0.3 81.82 80.704 1.36 0.5 105.66 103.424 2.12 1 149.57 146.49 2.06 2 212.36 207.82 2.14 4 305.01 298.42 2.16 The error between the M-integral and the Newman–Raju solution is within 3%. Therefore, the results obtained by the M-integral method for calculating the SIF are accurate and reliable, which is consistent with Ai's finding (Ai et al. 2018). Thus, the M-integral method is used to calculate the SIF of the surface crack of the spherical pressure hull, and the FRANC3D can be used to do the following analysis.
3 Solutions of SIF
3.1 Finite Element Model
This study introduces a semi-elliptical surface crack near the equator of the spherical pressure hull as a model for finite element analysis. Figure 3 shows the modeling process. First, a finite element model of the spherical pressure hull is established through the ABAQUS, which is then divided into two parts: the sub-model and the remaining model. The sub-model is used to introduce the initial crack. The combination of the sub-model and the remaining model is the global model, which reflects the boundary conditions and load distribution. The established crack node data file is imported into FRANC3D, and each node of the crack front edge is selected as a set, which is convenient to divide the singular element around the crack tip. After the cracks are imported, the sub-model elements are re-divided, preparing for the next step of the finite element calculation process.
 Figure 3 Numerical model for the spherical pressure hull with cracks
3.1.1 Spherical Pressure Hull
This study concerns the surface cracks at the equatorial weld toe of a 7000-m manned spherical pressure hull. The spherical hull is made of high-strength titanium alloy. Table 3 lists the geometric parameters and material properties of the model, and Figure 4 shows the simplified numerical model used in the study. For a medium-thickness spherical hull, numerical solutions tend to converge when the ratio of the volume element size to the radius is 0.06–0.07 (Zhang et al. 2015). Considering the calculation accuracy and efficiency, the elements are divided into the shape of a tennis ball and the element type is a three-dimensional 8-node reduced integral volume element. The average size of the circumferential element is 0.06 R, which is 67.5 mm, and the thickness direction is four layers. The volume element numerical scheme of the model is established with 15, 392 elements and 19, 250 nodes (Figure 4b).
Table 3 Geometric and material properties of the modelProperties Values External diameter D (mm) 2250 Spherical hull thickness t (mm) 78 Thickness to radius ratio t/R 0.069 Sphericity f 1.004 Yield strength σs (MPa) 830 Young's modulus E (MPa) 1.08 × 10⁵ Poisson ratio v 0.3  Figure 4 Numerical model of the spherical hull
In addition to the uniform seawater pressure load, the spherical pressure shell is not subjected to any other restrictions when working underwater. The rigid displacement of the structure needs to be eliminated when the finite element model is calculated. Therefore, it is necessary to add corresponding boundary constraints to the model. In this study, six displacement components are constrained by three-point constraints. As shown in Figure 4b, nodes 1 and 2 are taken on the X-axis to limit the displacement along the Y- and Z-axis (Uy = Uz = 0). Node 3 is taken at the position 90° apart from the two points in the same longitude to limit the displacement along the X- and Y-axis (Ux = Uy = 0) (Yu et al. 2005).
3.1.2 Insert Initial Surface Crack
This study describes the surface crack by a semi-elliptic crack and the finite element model of a spherical hull with a single crack is established as shown in Figure 5. The size of the semi-elliptical surface cracks are as follows: depth and half-length ratio a/c = 1 and crack depth a = 4 mm. In this study, the cracks are inserted into the hemispherical welds of the spherical hull.
 Figure 5 Finite element model of the spherical hull with a single crack
Because of the r−1/2 singularity of the stress field at the crack tip, the crack tip elements need to be divided into singularity elements. Since the SIF of the crack tip that is calculated by the 20-node singular element model is independent of the meshing near the crack tip and the numerical analysis results are stable and reliable (Chen et al. 2010), the 20-node singular elements were divided around the crack front as shown in Figure 6a. In addition, the crack tip element angle α = 45° and the number of layers around the crack tip element ntip = 3 (see Figure 6a) reduce the discretization errors by symmetrical distribution. Figure 6b shows the crack surface mesh where a is the crack depth and c is the crack half length. By encrypting the crack front mesh to ensure the accuracy of SIFs, the remaining part is coarser to reduce the number of elements, thereby reducing the computational cost.
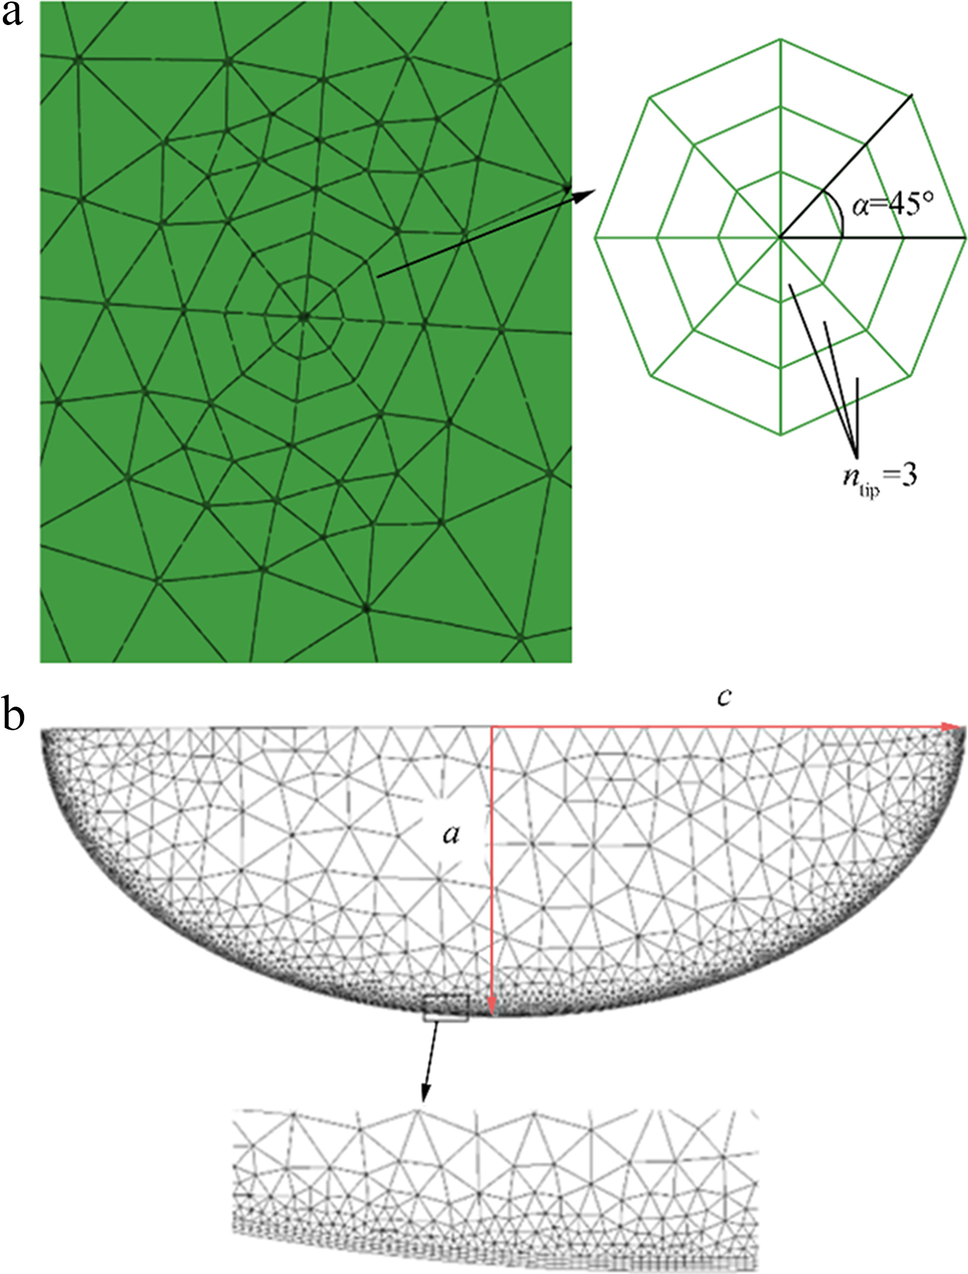 Figure 6 Crack surface mesh
3.2 Load Analysis
3.2.1 External Pressure
The working depth of the deep-sea manned submersible studied in this study is 7000 m. The outer surface of the spherical hull is subjected to a uniformly distributed pressure. According to Eq. (2):
$$ p={k\rho }_{w}gH/0.9 $$ (2) where k is the safety factor, ρw is the density of seawater, g is the acceleration of gravity, and H is the working depth of the sea. Since the pressure hull runs smoothly in operation, k is set as 1.35, ρw is 1.025 g/cm3, g is 9.8 m/s2, and H is 7000 m. The calculated load is 105.47 MPa.
Therefore, a load of 105.47 MPa is applied to the finite element model as shown in Figure 4a.
3.2.2 Welding Residual Stress
As a welding structure, the spherical pressure hull will inevitably have welding residual stress at the weld seam. Surface cracks easily occur at the weld toe of the opening, most of which are parallel to the weld direction and are subjected to welding residual stress perpendicular to the crack surface (Al-Mukhtar 2013). For the surface cracks parallel to the weld fusion line, the maximum welding residual stress on the surface of the weld toe is 0.3 σs (Huang et al. 2011). The distribution of the welding residual stress on the weld is inhomogeneous. Based on the research results of Ikushima and Shibahara (2015), it is assumed that the welding residual stress perpendicular to the circumferential weld direction is linearly distributed along the plate thickness direction. Moreover, the distribution of the welding residual stress at the weld toe of the spherical hull along the thickness direction can be simplified to a linear distribution. Therefore, if the thickness of the plate is t, the distribution of residual stress along the thickness of the plate can be expressed as the following linear distribution (x = 0 is the outer surface of the weld toe):
$$ \left\{\begin{array}{c}{\sigma }^{R}\left(x\right)={\sigma }^{R}\left(1-4x/t\right)\left(0\le x\le t/2\right)\\ {\sigma }^{R}\left(x\right)={\sigma }^{R}\left(4x/t-3\right)\left(t/2\le x\le t\right)\end{array}\right. $$ (3) where σR is the maximum welding residual stress, which is 0.3 σs.
According to Eq. (3), the weld residual stress in the outer surface of the weld toe is tensile residual stress, and the maximum value is 0.3 σs. It gradually reduces along the thickness direction (the value at 1/4 thickness is 0), and the compressive residual stress gradually increases, reaching a maximum of 0.3 σs at 1/2 thickness. The weld residual stress is symmetrically distributed in the mid-surface of the spherical hull (see Figure 7). Figure 7a shows the residual stress distribution, which is applied to the crack surface. As shown in Figure 7b, a local coordinate system is established at the center of the outer surface of the crack. The crack surface is located in the X–Y plane, and the x-axis points to the deepest point of the crack. Based on the local coordinate system, the residual stress that is linearly distributed along the x-axis is established by FRANC3D. After the FEM analysis is finished, three modes of SIFs (KⅠ, KⅡ, KⅢ) along the crack front are computed by FRANC3D based on the M-integral.
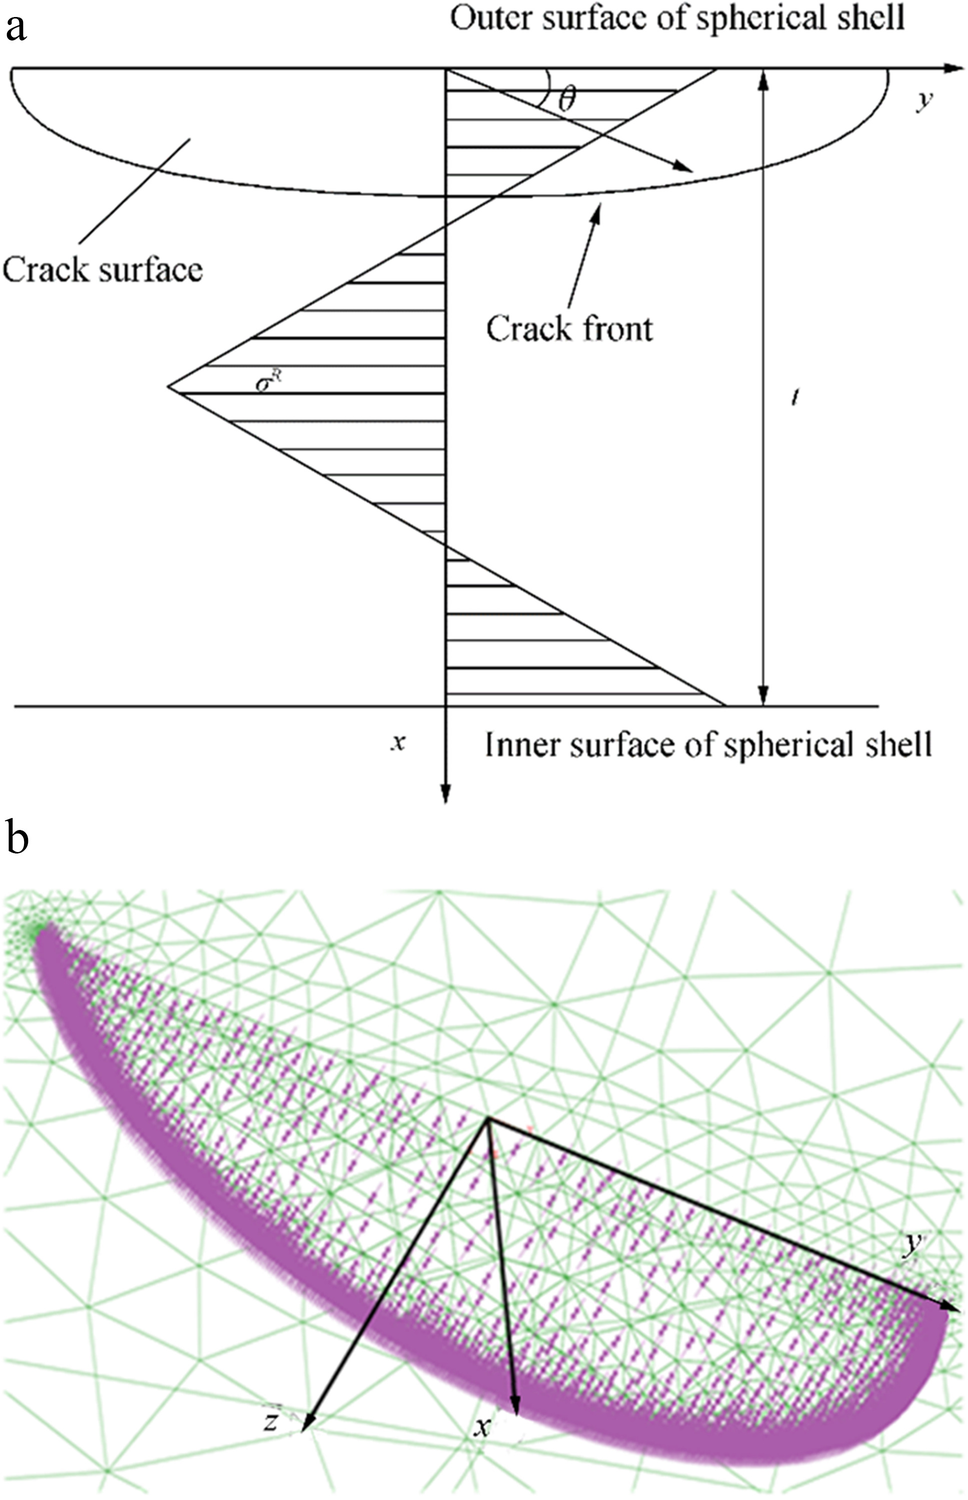 Figure 7 Distribution of the residual stress on the crack surface
3.3 Results and Discussion
Figure 8 presents the distribution of the SIF (KⅠ, KⅡ, and KⅢ) values along the crack front, where θ is the angle between the crack front and the crack outer surface (see Figure 7a). It can be seen from Figure 8 that the KⅠ value of the crack front is much larger than the values of KⅡ and KⅢ. KⅠ was 662.54 MPa·mm1/2 at point A (θ = 0°), 665.87 MPa·mm1/2 at point B (θ = 180°), and 550.99 MPa·mm1/2 at the deepest point (θ = 90°), while the maximum values of KⅡ and KⅢ are only 4.22 MPa·mm1/2 and 1.71 MPa·mm1/2, respectively. Therefore, the surface cracks of the spherical hull are mainly characterized by mode Ⅰ fractures. Compared with KⅠ, the variation of KⅡ and KⅢ values are very small with θ, i.e., the influence of mode Ⅱ and Ⅲ SIF on the crack growth is very small. Mode Ⅰ fracture is the most dangerous; therefore, the SIF KⅠ values along the surface cracks are discussed below.
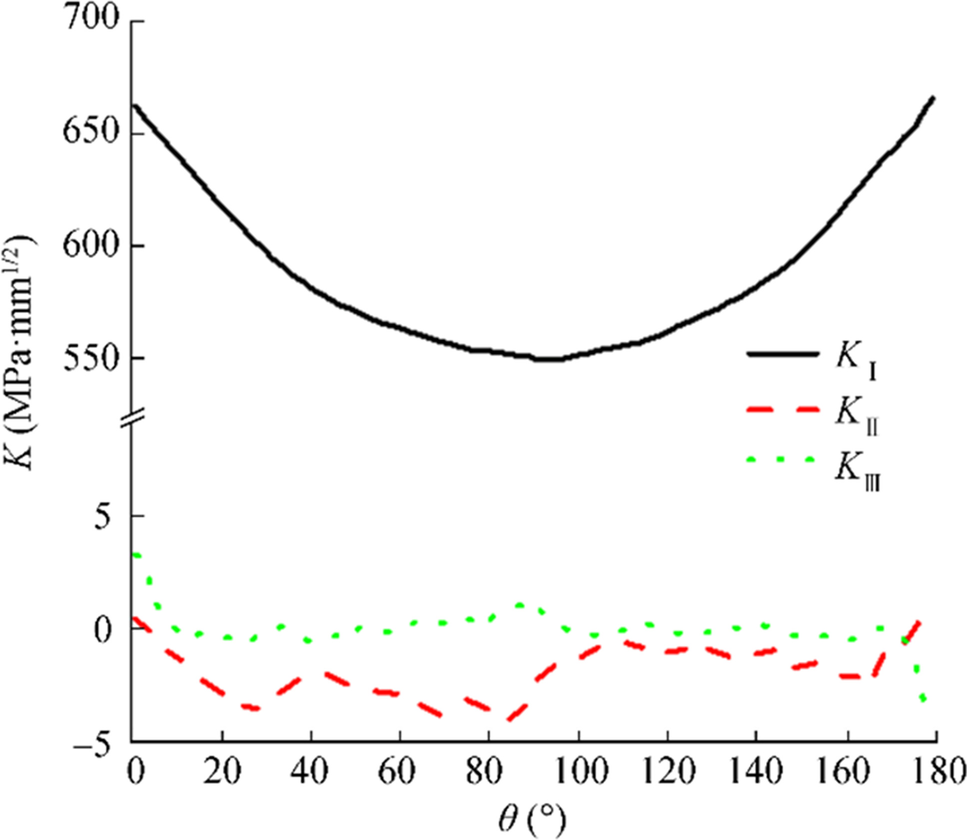 Figure 8 Distribution of KⅠ, KⅡ, and KⅢ along the crack front
Figure 9 shows the variation of KI_SUM, which is the maximum KⅠ under the combined action of external pressure and welding residual stress and KI_RS, which is the maximum KⅠ under the action of welding residual stress. It is evident in Figure 9 that the curves of the two conditions are very close and the maximum difference is only 2.2%. Thus, for mode Ⅰ SIF, the effect of external pressure on the SIF of the crack front is relatively small, and the main influencing factor is the welding residual stress at the welding toe.
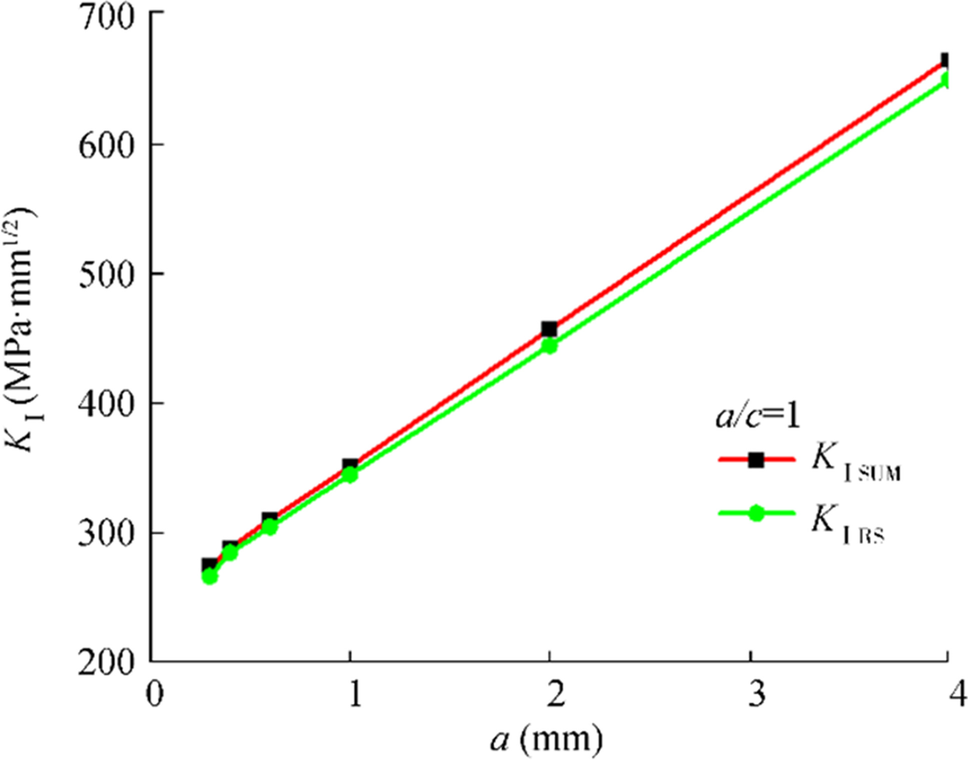 Figure 9 Variation of the maximum KI with crack depth
4 Multi-Crack Interaction Analysis
4.1 Finite Element Model
This work focuses on the interaction between two surface cracks. For convenience, the disturbing crack inserted is the same as the main crack. Figure 10 shows the finite element model of a spherical hull with multiple surface cracks.
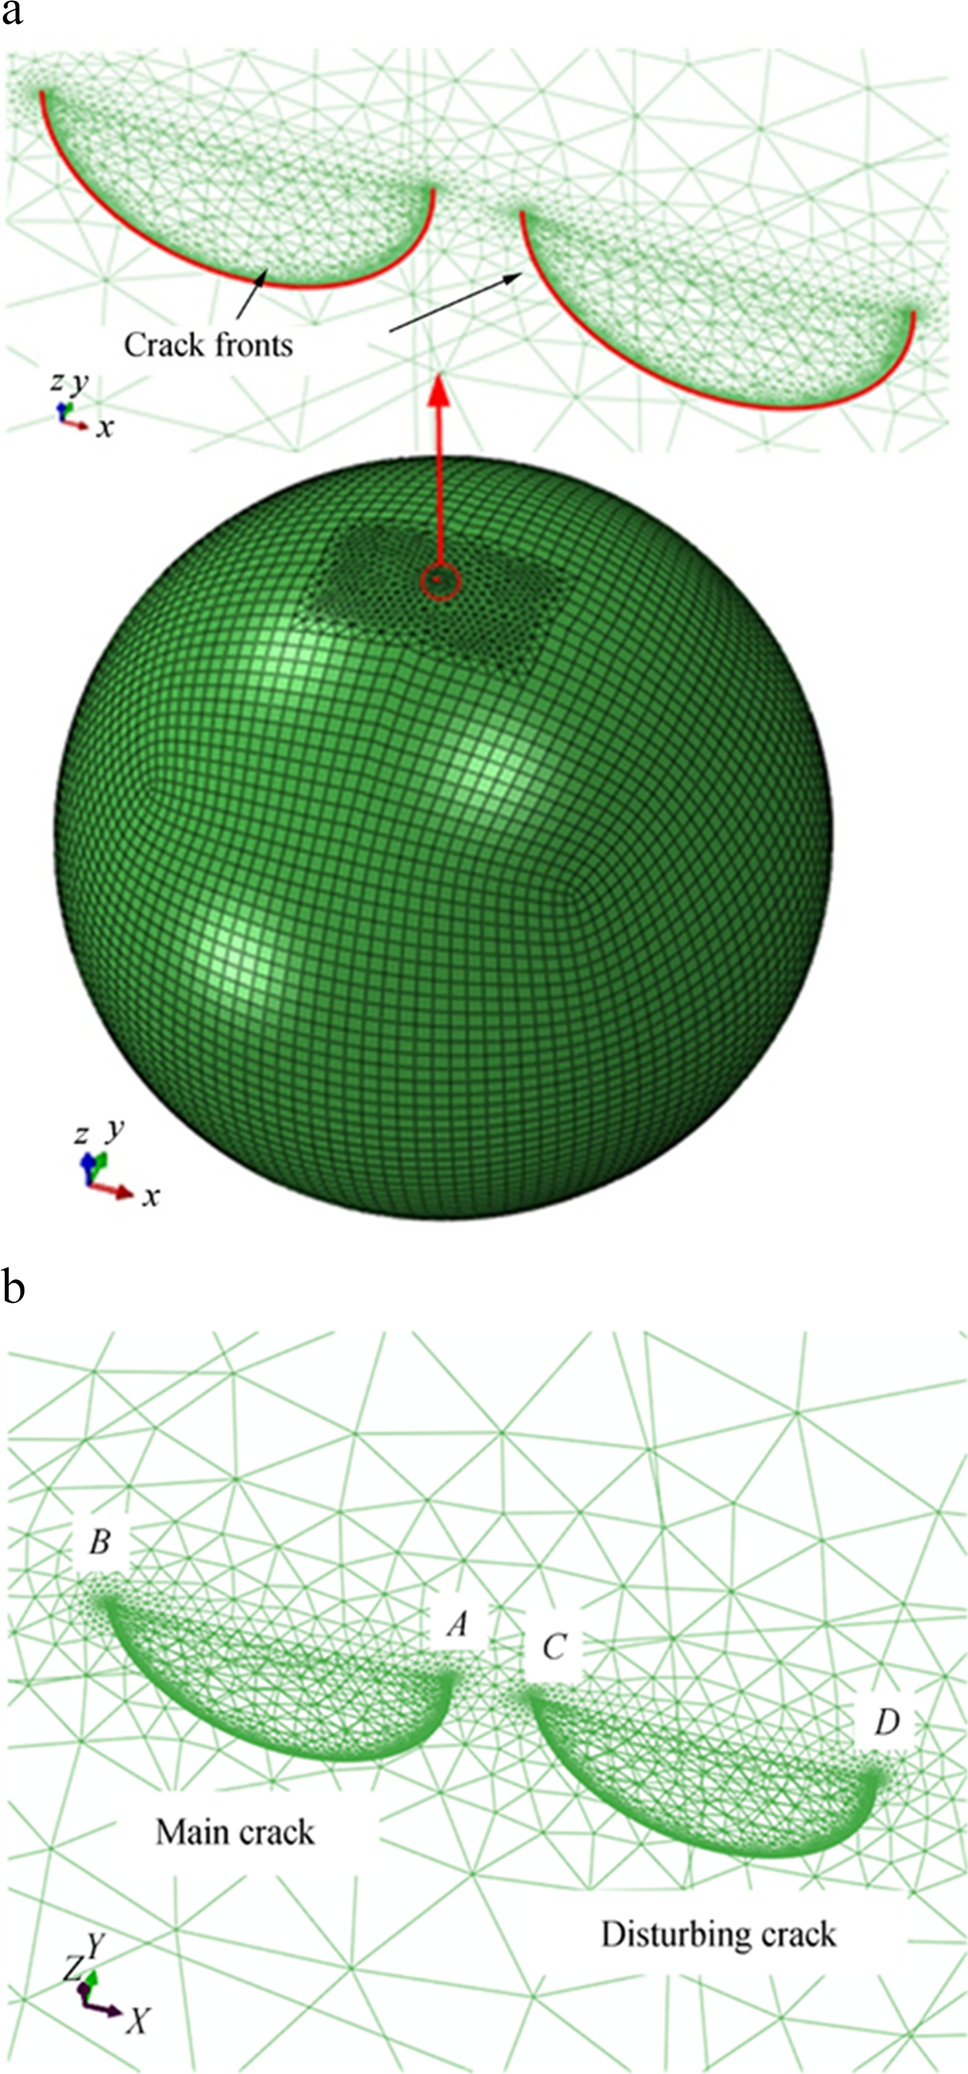 Figure 10 Finite element model of a spherical hull with multi-surface cracks
In this study, some examples of multi-cracks are analyzed. The variation of mode Ⅰ SIFs along the main crack fronts and the interaction effect on the crack tips A, B, and the deepest point (see Figure 10b) of the main crack are discussed after inserting the disturbing crack.
4.2 Disturbing Parameter Definition
The relative positions of the disturbing crack and the main crack on the surface of the spherical hull can be expressed by the position parameters α and β where α is the angle in the X–Y plane formed by the line connecting the center of the main crack to the center of the sphere and the other line connecting the center of the disturbing crack to the center of the sphere, and β is the angle in the Y–Z plane formed by the line connecting the center of the main crack to the center of the sphere and the other line connecting the center of the disturbing crack to the center of the sphere (Figure 11).
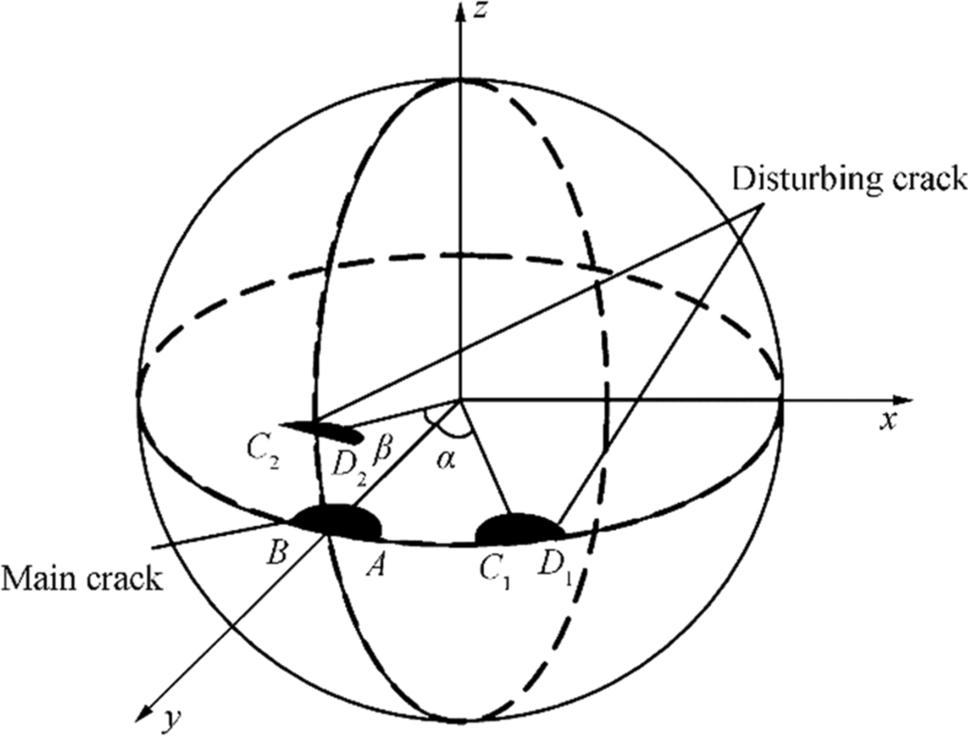 Figure 11 Position parameter definition
The variation of SIF at the right end point A of the main crack was observed by adding the disturbing cracks at different positions on the surface of the spherical hull. To analyze the effect of the disturbing crack on the main crack, the SIF reduction λ is defined as:
$$ \lambda =\frac{K-{K}_{0}}{{K}_{0}} $$ (4) where K0 is the SIF of the main crack without the disturbing crack and K is the SIF of the main crack with the disturbing crack.
4.3 Results and Discussion
Example 1 The disturbing crack is inserted when β = 0°, i.e., the disturbing crack and the main crack are on the equatorial plane. Since the diameter of the spherical hull is 2250 mm, α is 0.45° when the distance between the two cracks is 9 mm. Thus, the influence of the change of α on KI along the main crack fronts is analyzed when α is 0.45°, 0.5°, 0.6°, 0.8°, and 1°. Figure 12 presents the variation of KI along the main crack fronts with different α. It can be seen from Figure 12 that the KI values along the main crack fronts near point A increase in varying degrees with the decrease of α, while the KI values near point B hardly change. The increase of KI is the largest at point A. Table 4 lists the KI and λ values of point A. When α is 0.45°, KI is 776.06 MPa·mm1/2, which is 15.6% larger than the KI value of the single crack. It can be seen that when α is greater than or equal to 0.8°, the SIF reduction λ is less than 0.007, which means that the disturbing crack has little influence on the main crack. Figure 13 presents the influence curves λ-α on points A and B and the deepest point of the main crack. It can be seen that λ increases with the decrease of α, and the increase of range becomes larger at point A. The SIF intensification of point B and the deepest point by the disturbing crack is very weak. The influence on points A, B, and the deepest point with the variation of α is fully evaluated by the λ-α curves.
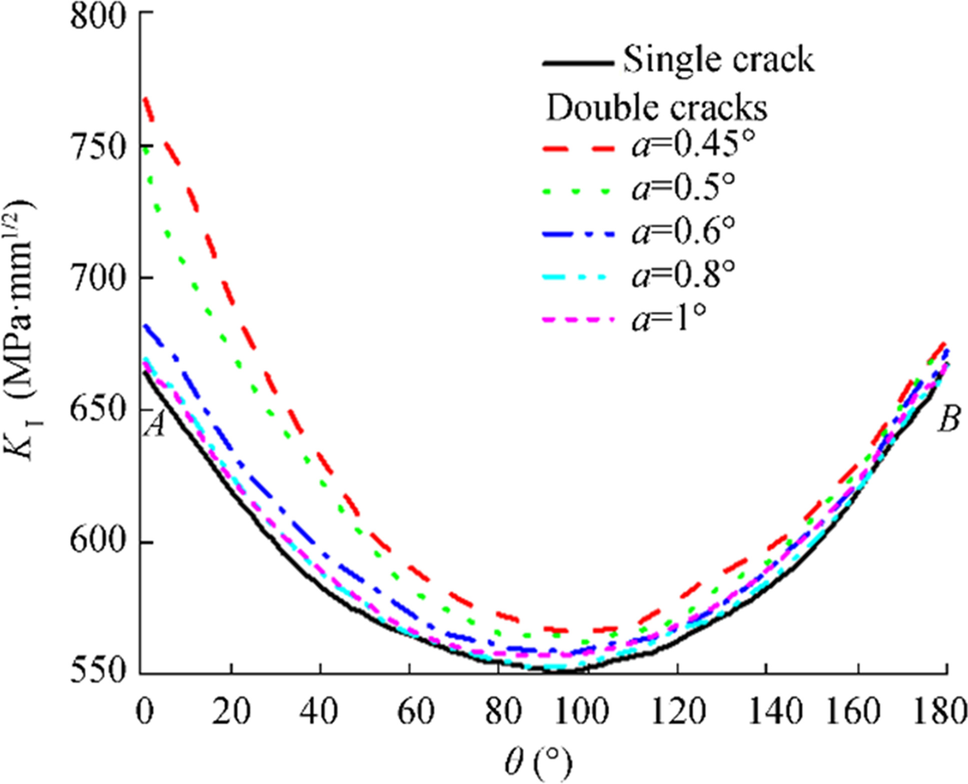 Figure 12 Variation of KI along the main crack fronts with different αTable 4 KI and λ of point A
Single crack α (°) (Double cracks) 0.45 0.5 0.6 0.8 1 KI (MPa·mm1/2) 662.54 766.06 747.39 680.28 667.77 666.22 λ - 0.156 0.128 0.026 0.007 0.005 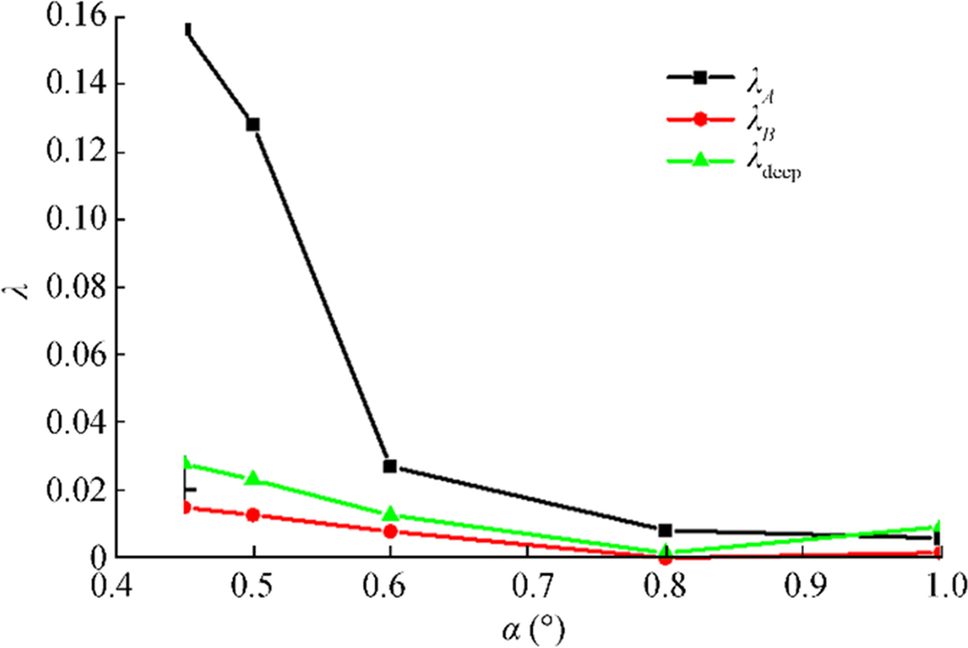 Figure 13 λ-α curves of points A, B, and the deepest point affected by the disturbing crack
Example 2 The disturbing crack is inserted when α = 0° and is located directly above the main crack. The influence of the disturbing crack on KI along the main crack fronts is analyzed when β is 0.02°, 0.05°, 0.1°, 0.3°, 0.5°, and 1°. Figure 14 presents the variation of KI along the main crack fronts with different β values. It is evident in Figure 14 that with a decrease in β, the KI values become smaller along the main crack fronts and the shielding effect becomes greater on the two cracks. This means that when the disturbing crack is in this position, crack initiation will be shielded. Moreover, the closer the distance is, the greater is the shielding effect. Table 5 lists the KI and λ values of point A. KI is 403.12 MPa·mm1/2 when β is 0.02°, which is 39.2% less than the KI value of the single crack. Figure 15 shows the influence curves λ-β on points A, B, and the deepest point of the main crack. As shown in Figure 15, the curves λA, λB, and λdeep have the same trend. When β is greater than 1, λ gradually tends to 0, i.e., the disturbing crack has little influence on the main crack. Therefore, the influence of the disturbing crack at this position can be ignored in the engineering process, and such cracks can even be prefabricated to reduce the SIFs.
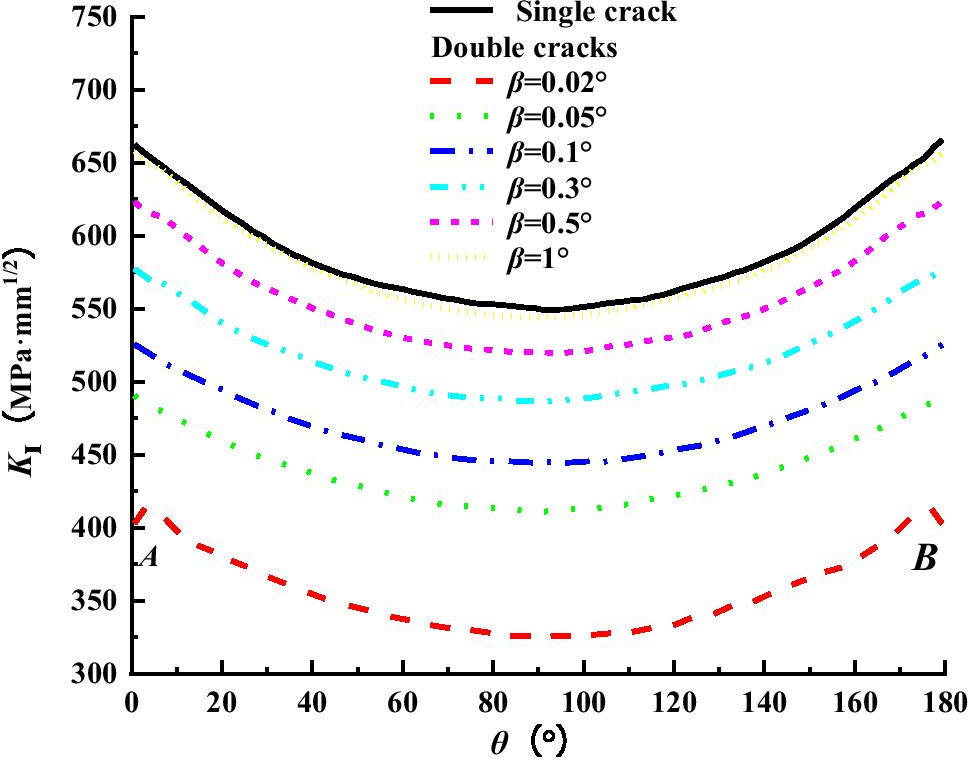 Figure 14 Variation of KI along the main crack fronts with different βTable 5 KI and λ values of point A
Single crack β (°) (Double cracks) 0.02 0.05 0.1 0.3 0.5 1 KI (MPa·mm1/2) 662.54 403.12 490.75 511.97 577.39 623.26 657.53 λ - − 0.392 − 0.259 − 0.227 − 0.129 − 0.059 − 0.008 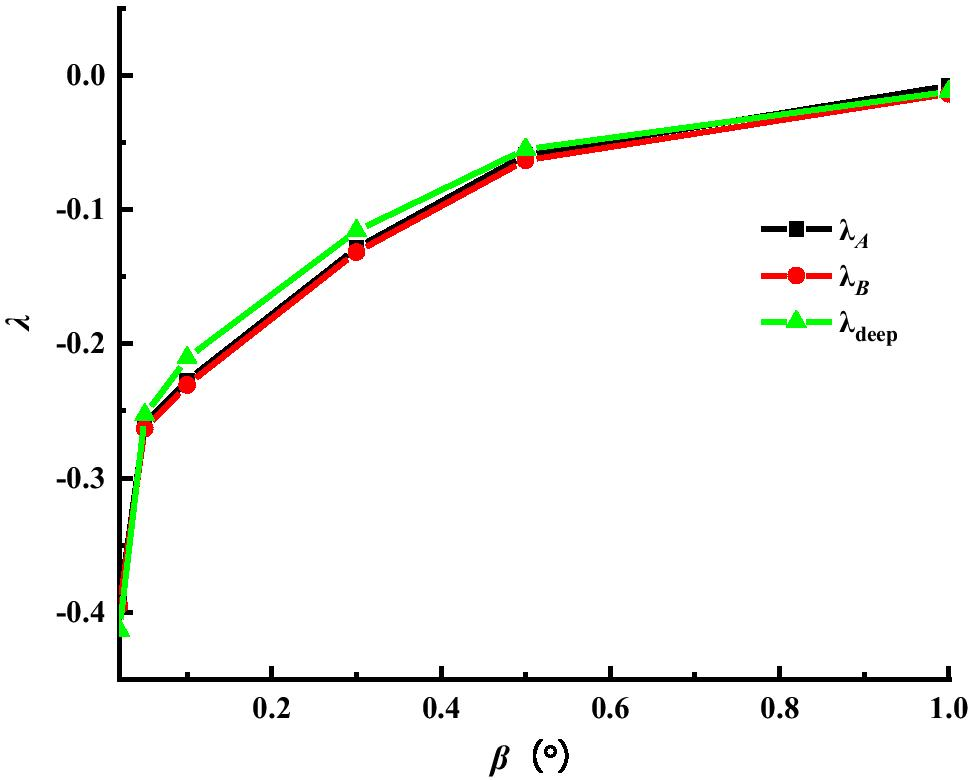 Figure 15 λ-β curves of points A, B, and the deepest point affected by the disturbing crack
Example 3 To further analyze the inhibitory action of the disturbing crack on the main crack, the influence of the disturbing crack on KI along the main crack fronts was analyzed when β = 0.1° and α was 0, 0.05°, 0.1°, 0.2°, 0.3°, 0.4°, 0.5°, and 0.8°. Figure 16 presents the variation of KI along the main crack fronts with different α values and Table 6 lists the KI and λ of point A. It can be seen that when α is less than 0.4°, namely, the distance between points B and C is less than 8 mm (i.e., 2c, where c is the half-length of the main crack), the SIFs of the main crack are less than that of the single crack. This indicates that the growth of the main crack is shielded by the disturbing crack. When α is equal to 0.2° (the distance between B and C is approximately equal to c), the shielding effect on point A is the greatest. KI is 203.06 MPa·mm1/2, which is 69.3% smaller than the KI value of the single crack. When α is larger than 0.4°, i.e., the distance between points B and C is larger than 2c, the SIFs of the main crack are intensified by the disturbing crack. With the continuous increase of α, the intensification of the disturbing crack on the main crack becomes weaker because of the long distance between the two cracks. From the λ-α curves in Figure 17, it can be seen that the influence trend of the disturbing crack on the main crack is basically the same at point B and the deepest point, and the influence range is much smaller than that of point A. According to the conclusion in Example 1, with the increase of α, the values of λA, λB, and λdeep will all tend to 0.
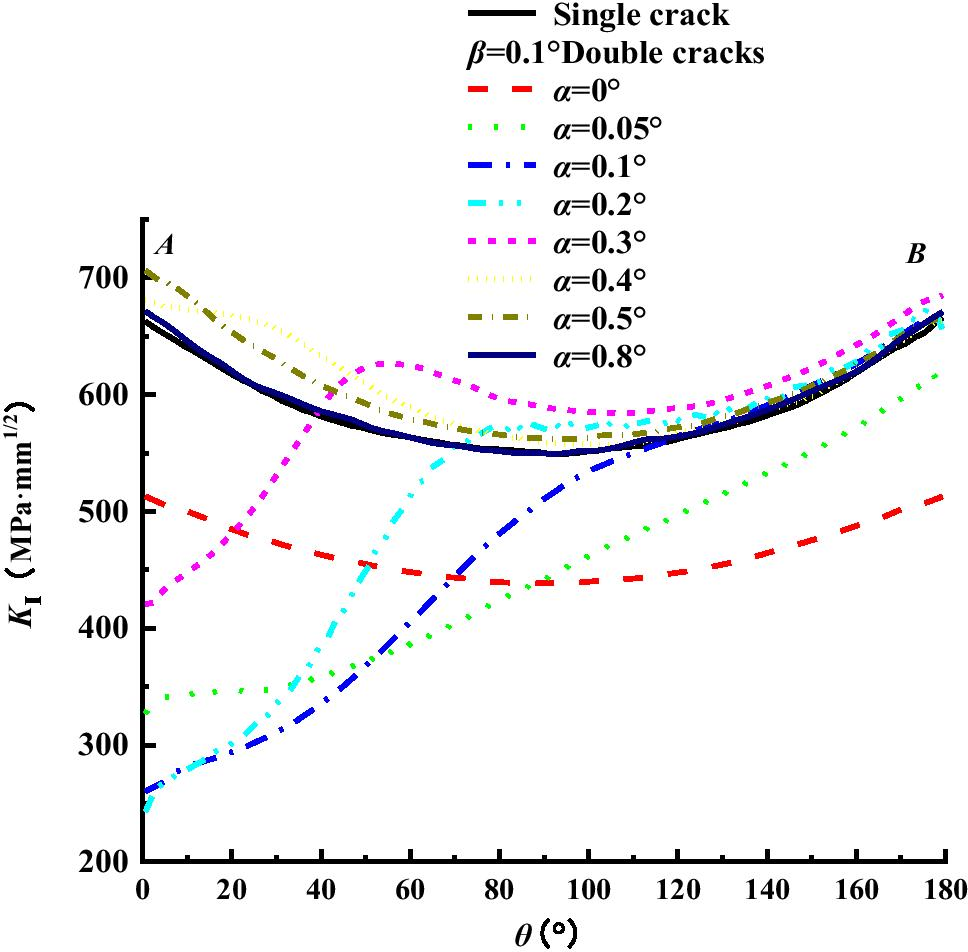 Figure 16 Variation of KI along the main crack fronts with different α (β = 0.1°)Table 6 KI and λ of point A
Single crack α (°) (Double cracks) 0 0.05 0.1 0.2 0.3 0.4 0.5 0.8 KI(MPa·mm1/2) 662.54 512.86 327.13 260.45 203.06 420.68 681.07 706.17 671.18 λ - − 0.226 − 0.506 − 0.607 − 0.693 − 0.365 0.027 0.066 0.012 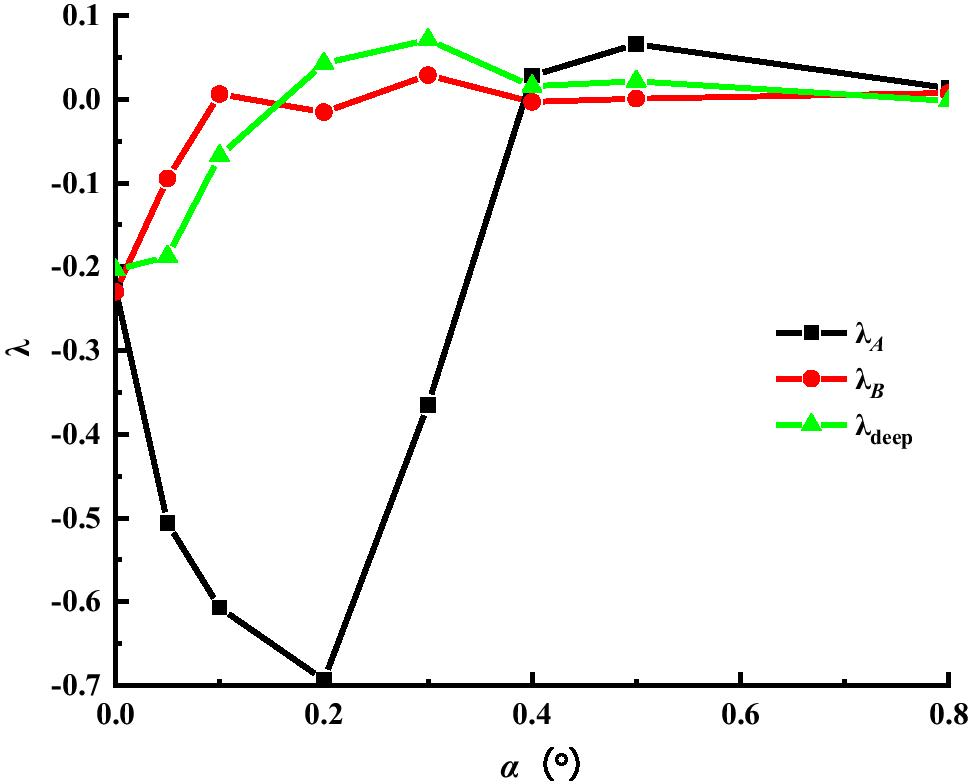 Figure 17 λ-α curves of points A, B and the deepest point affected by the disturbing crack (β = 0.1°)
Example 4 In Examples 1 to 3, the main crack and the disturbing crack were parallel. In example 4, the influence of the disturbing crack on the main crack is investigated when the two cracks are non-parallel with a certain angle. A parameter φ (Figure 18) is defined as the angle between two crack surfaces. Here, α is 0.5° and β is 0°. The influence of the disturbing crack on the main crack is analyzed with different φ. Figure 18 presents the variation of KI along the main crack fronts with different φ and Table 7 lists the KI and λ of point A. As shown in Figure 18, the KI value of point A (704.18 MPa·mm1/2) is the largest when φ is 0°, which is 6.4% larger than that of the single crack. Therefore, the disturbing crack has the strongest enhancement effect on the main crack when the two cracks are coplanar. Figure 19 shows the influence curves λ-φ on points A, B, and the deepest point of the main crack. As can be seen, λB and λdeep values are less than 0.01 with different φ, indicating that they are insensitive to the variation of φ. The curves λA decreases with the increase of φ, but it still shows a weak intensification effect in the middle range of φ between 0° and 90°.
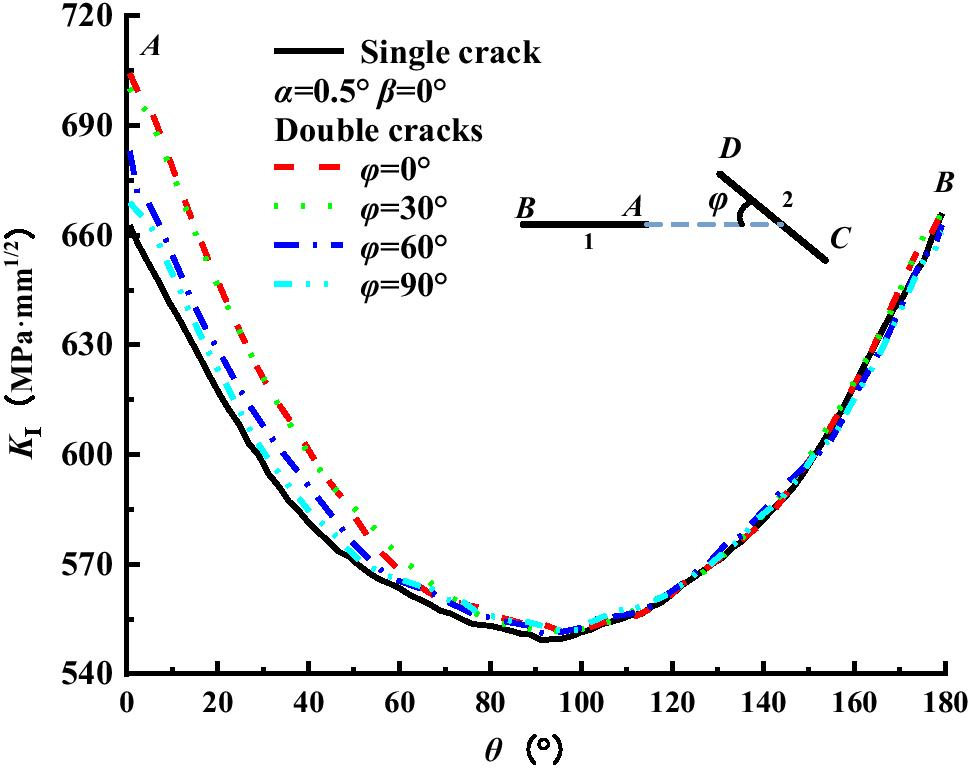 Figure 18 Variation of KI along the main crack fronts with different φ (α = 0.5°, β = 0°)Table 7 KI values and λ of point A
Single crack φ (°) (Double cracks) 0 30 60 90 KI (MPa·mm1/2) 662.54 704.18 700.1 682.91 668.82 λ - 0.063 0.057 0.031 0.009 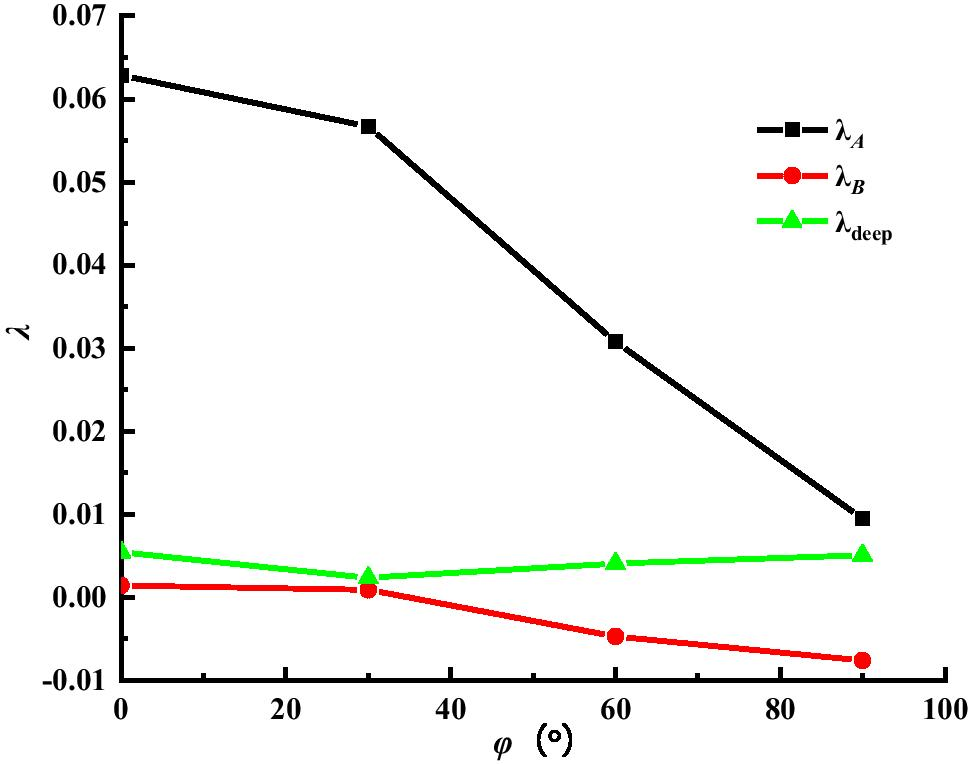 Figure 19 λ-φ curves of points A, B, and the deepest point affected by the disturbing crack
Moreover, when α is 0° and β is 0.3°, the influence of the disturbing crack on the main crack is analyzed with different φ. Figure 20 presents the variation of KI along the main crack fronts with different φ, and Table 8 lists The KI and λ values of point A. As shown in Figure 20, the KI of the main crack is less than that of the single crack when φ is 0° and 30°. This suggests that the disturbing crack shields the main crack initiation. The effect is the strongest when φ is 0°. The disturbing crack enhances at point A and shields at point B when φ is 60°. The KI value of point A increases by 6% when φ is 60°. The disturbing crack shields the two crack tips (A and B) of the main crack and intensifies the deepest point when φ is 90°. The KI value of the deepest point increases by 3.5% when φ is 90°. Figure 21 shows the influence curves λ-φ on points A, B, and the deepest point of the main crack. As shown in Figure 21, the λdeep value increases with the increase of φ, i.e., from − 0.22 (KI = 429.76 MPa·mm1/2, φ = 0°) to 0.036 (KI = 570.56 MPa·mm1/2, φ = 90°).
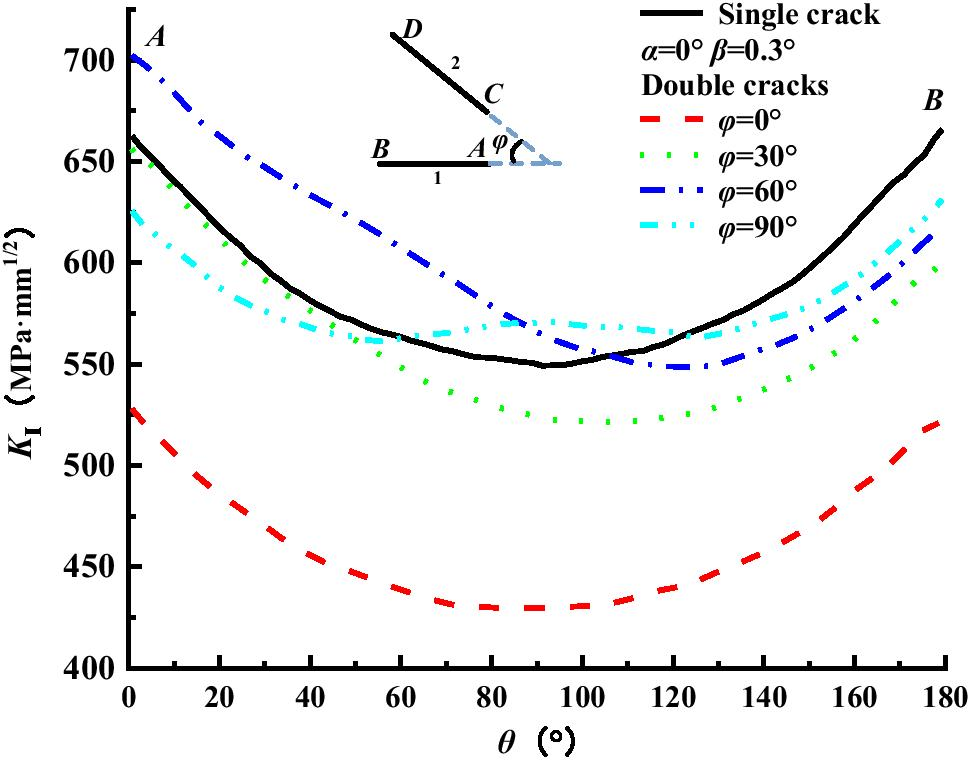 Figure 20 Variation of KI along the main crack fronts with different φ (α = 0°, β = 0.3°)Table 8 KI values and λ of point A
Single crack φ (°) (Double cracks) 0 30 60 90 KI (MPa·mm1/2) 662.54 527.9 656.1 702.27 625.51 λ – 0.203 0.009 0.060 − 0.056 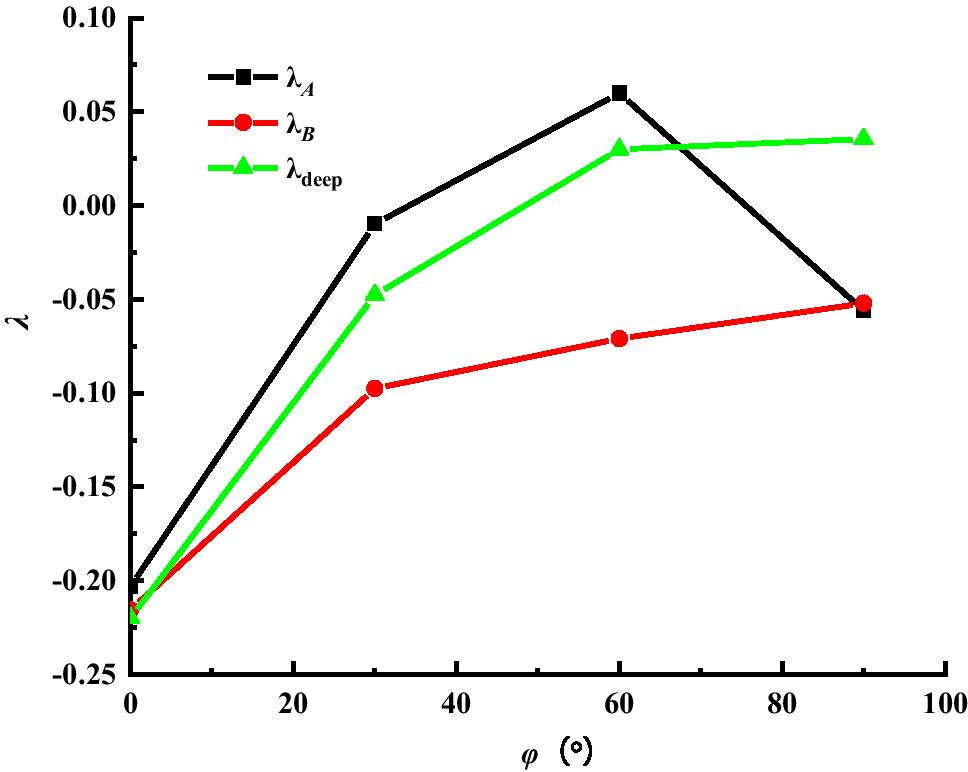 Figure 21 λ-φ curves of points A, B, and the deepest point affected by the disturbing crack
5 Conclusions
(1) The surface cracks of the spherical hull are mainly characterized by mode Ⅰ cracks under the combined action of seawater pressure and welding residual stress. Compared with mode Ⅰ SIF, modes Ⅱ and Ⅲ SIFs have little effect on the cracks. Moreover, the existence of the disturbing crack has a great influence on the SIFs of the main crack. The different locations of the disturbing crack have a great different influence, which is consistent with practical engineering.
(2) When β is 0° and φ is approximately 0°, which means that the disturbing crack is coplanar with the main crack, the closer is the distance between the multi-crack tips, the higher is the fracture enhancement. When α is 0.5° and the two crack faces have an angle φ, the effect of the enhancement changes with the change of φ. When φ is 0°, the disturbing crack has the strongest enhancement effect on the main crack. Thus, the SIF intensification is largest when the two cracks are coplanar, which will greatly accelerate the propagation speed between the cracks before they merge into a larger crack.
(3) When α is 0° and φ is approximately 0°, the disturbing crack shields the crack tips and the deepest points of the main crack. The closer is the distance between the multicracks, the greater is the shielding effect. When β is 0.1° and α changes, the distance between the ipsilateral tips of two cracks is less than 2c (the length of the main crack) and the shielding effect occurs. The shielding effect on point A is the greatest when the distance between the ipsilateral tips of the two cracks is approximately c, and its KI decreases by 69.3% than that of the single crack. Therefore, the influence of the disturbing crack at these positions can be ignored in practical engineering, and the SIFs can be reduced by prefabricating such cracks. When the distance between the ipsilateral tips of two cracks is larger than 2c, the enhancement effect occurs. When φ is less than 30°, the shielding effect occurs. Otherwise, the enhancement effect occurs.
(4) The influence of the disturbing crack on the main crack can guide the crack in engineering practice. The interaction of double cracks is discussed in this study, which awaits further investigation in view of three or more cracks.
-
Figure 1 Spherical pressure hull of manned submersible, adopted by Li WY (Li et al. 2016)
Figure 2 Flat plate model with a central surface crack (Zhu et al. 2020)
Figure 3 Numerical model for the spherical pressure hull with cracks
Figure 4 Numerical model of the spherical hull
Figure 5 Finite element model of the spherical hull with a single crack
Figure 6 Crack surface mesh
Figure 7 Distribution of the residual stress on the crack surface
Figure 8 Distribution of KⅠ, KⅡ, and KⅢ along the crack front
Figure 9 Variation of the maximum KI with crack depth
Figure 10 Finite element model of a spherical hull with multi-surface cracks
Figure 11 Position parameter definition
Figure 12 Variation of KI along the main crack fronts with different α
Figure 13 λ-α curves of points A, B, and the deepest point affected by the disturbing crack
Figure 14 Variation of KI along the main crack fronts with different β
Figure 15 λ-β curves of points A, B, and the deepest point affected by the disturbing crack
Figure 16 Variation of KI along the main crack fronts with different α (β = 0.1°)
Figure 17 λ-α curves of points A, B and the deepest point affected by the disturbing crack (β = 0.1°)
Figure 18 Variation of KI along the main crack fronts with different φ (α = 0.5°, β = 0°)
Figure 19 λ-φ curves of points A, B, and the deepest point affected by the disturbing crack
Figure 20 Variation of KI along the main crack fronts with different φ (α = 0°, β = 0.3°)
Figure 21 λ-φ curves of points A, B, and the deepest point affected by the disturbing crack
Table 1 Analytical and numerical solutions of the SIF of the surface point KIc
a (mm) KIc (MPa·mm1/2) Differences (%) Newman–Raju M-Integral 0.3 69.72 71.628 − 2.74 0.5 90.04 92.031 − 2.21 1 127.4 128.23 − 0.65 2 181.52 184.57 − 1.68 4 263.19 261.07 0.81 Table 2 Analytical and numerical solutions of the SIF of the deepest point KIa
a (mm) KIa (MPa·mm1/2) Differences (%) Newman–Raju M-Integral 0.3 81.82 80.704 1.36 0.5 105.66 103.424 2.12 1 149.57 146.49 2.06 2 212.36 207.82 2.14 4 305.01 298.42 2.16 Table 3 Geometric and material properties of the model
Properties Values External diameter D (mm) 2250 Spherical hull thickness t (mm) 78 Thickness to radius ratio t/R 0.069 Sphericity f 1.004 Yield strength σs (MPa) 830 Young's modulus E (MPa) 1.08 × 10⁵ Poisson ratio v 0.3 Table 4 KI and λ of point A
Single crack α (°) (Double cracks) 0.45 0.5 0.6 0.8 1 KI (MPa·mm1/2) 662.54 766.06 747.39 680.28 667.77 666.22 λ - 0.156 0.128 0.026 0.007 0.005 Table 5 KI and λ values of point A
Single crack β (°) (Double cracks) 0.02 0.05 0.1 0.3 0.5 1 KI (MPa·mm1/2) 662.54 403.12 490.75 511.97 577.39 623.26 657.53 λ - − 0.392 − 0.259 − 0.227 − 0.129 − 0.059 − 0.008 Table 6 KI and λ of point A
Single crack α (°) (Double cracks) 0 0.05 0.1 0.2 0.3 0.4 0.5 0.8 KI(MPa·mm1/2) 662.54 512.86 327.13 260.45 203.06 420.68 681.07 706.17 671.18 λ - − 0.226 − 0.506 − 0.607 − 0.693 − 0.365 0.027 0.066 0.012 Table 7 KI values and λ of point A
Single crack φ (°) (Double cracks) 0 30 60 90 KI (MPa·mm1/2) 662.54 704.18 700.1 682.91 668.82 λ - 0.063 0.057 0.031 0.009 Table 8 KI values and λ of point A
Single crack φ (°) (Double cracks) 0 30 60 90 KI (MPa·mm1/2) 662.54 527.9 656.1 702.27 625.51 λ – 0.203 0.009 0.060 − 0.056 -
Ai SM, Yu M, Cheng XM, Wang JF (2018) Analysis and application of three-dimensional crack growth based on FRANC3D. Journal Mech Strength 40(1): 251–254. https://doi.org/10.16579/j.issn.1001.9669.2018.01.044 Al-Mukhtar AM (2013) Consideration of the residual stress distributions in fatigue crack growth calculations for assessing welded steel joints. Fatigue Fract Eng Mater Struct 36(12): 1352–1361. https://doi.org/10.1111/ffe.12060 Ayhan AO, Yücel U (2011) Stress intensity factor equations for mixed-mode surface and corner cracks in finite-thickness plates subjected to tension loads. Int J Press Vessel Pip 88(5–7): 181–188. https://doi.org/10.1016/j.ijpvp.2011.05.009 Budiansky B, Rice JR (1973) Conservation laws and energy-release rates. J Appl Mech Trans ASME 40(1): 201–203. https://doi.org/10.1115/1.3422926 Chen JJ, Huang Y, Liu G (2010) Analysis of Finite Element Model for Calculating Stress Intensity Factor Based on Crack-tip Singular Element. Sh Build China 51(3): 56–64. https://doi.org/10.3969/j.issn.1000-4882.2010.03.007 Fan X, Kulatilake PHSW, Chen X, Cao P (2015) Crack initiation stress and strain of jointed rock containing multi-cracks under uniaxial compressive loading: A particle flow code approach. J Cent South Univ 22(2): 638–645. https://doi.org/10.1007/s11771-015-2565-z Fracture Analysis Consultants Inc. (2016). FRANC3D reference manual version 7.1. USA Freund LB (1978) Stress intensity factor calculations based on a conservation integral. Int J Solids Struct 14(3): 241–250. https://doi.org/10.1016/0020-7683(78)90028-8 Gerstle WH, Abdalla JE (1990) Finite element meshing criteria for crack problems ASTM Spec Tech Publ https://doi.org/10.1520/stp19011s Huang XP, Jia GL, Cui WC, Qi ER (2011) Unique crack growth rate curve model for fatigue life prediction of marine steel structures. Chuan Bo Li Xue/journal Sh Mech 15(1–2): 118–125. https://doi.org/10.3969/j.issn.1007-7294.2011.01.016 Ikushima K, Shibahara M (2015) Large-scale non-linear analysis of residual stresses in multi-pass pipe welds by idealized explicit FEM. Weld World 59(6): 839–850. https://doi.org/10.1007/s40194-015-0263-y Jie ZY, Li YD, Wei X, Yang G, Luo PJ (2017) Numerical study of mixed-mode stress intensity factor of surface crack of welded joint. Journal of the China Railway Society 39(2): 127–133 Knowles JK, Sternberg E (1972) On a class of conservation laws in linearized and finite elastostatics. Arch Ration Mech Anal 44(3): 187–211. https://doi.org/10.1007/BF00250778 Lam KY, Phua SP (1991) Multiple crack interaction and its effect on stress intensity factor. Eng Fract Mech 40(3): 585–592. https://doi.org/10.1016/0013-7944(91)90152-Q Li Q, Wang B (2000) 3D BE analysis on stress intensity factor of a fatigue crack in a welded T-joint. Journal Chongqing Jianzhu Univ 22(6): 29–33. https://doi.org/10.3969/j.issn.1674-4764.2000.06.008 Li WY, Wang S, Liu T, Shen YS, Ye C (2016) Current status and progress on pressure hull structure of manned deep submersible. Sh Build China 57(1): 210–221. https://doi.org/10.3969/j.issn.1000-4882.2016.01.023 Lv F, Zhou CY, Cheng RJ, Miao XT, He XH (2018) A numerical analysis based on M-integral about the interaction of parallel surface cracks in an infinite plate. Theor Appl Fract Mech 96(May): 370–379. https://doi.org/10.1016/j.tafmec.2018.05.012 Newman JC, Raju IS (1981) An empirical stress-intensity factor equation for the surface crack. Eng Fract Mech 15(1–2): 185–192. https://doi.org/10.1016/0013-7944(81)90116-8 Pasca N, Marsavina L, Negru R (2013) Estimation of the stress intensity factor for 3D cracked T-Joint Des Fabr Econ Met Struct 573–280 https://doi.org/10.1007/978-3-642-36691-8 Perl M, Steiner M (2015) 3-D stress intensity factors due to full autofrettage for inner radial or coplanar crack arrays and ring cracks in a spherical pressure vessel. Eng Fract Mech 138: 233–249. https://doi.org/10.1016/j.prostr.2016.06.452 Perl M, Steiner M (2018) The beneficial effect of full or partial autofrettage on the combined 3-D stress intensity factors for inner coplanar crack arrays and ring cracks in a spherical pressure vessel. Eng Fract Mech 191: 426–440. https://doi.org/10.1016/j.engfracmech.2017.12.009 Perl M, Steiner M, Perry J (2016) 3-D stress intensity factors due to autofrettage for an inner radial lunular or crescentic crack in a spherical pressure vessel. Procedia Struct Integr 138(2): 3625–3646. https://doi.org/10.1016/j.prostr.2016.06.452 Rice JR (1964) A path independent integral and the approximate analysis of strain concentration by notches and cracks. J Appl Mech Trans ASME 35(2): 379–388. https://doi.org/10.1115/1.3601206 Rybicki EF, Kanninen MF (1977) A finite element calculation of stress intensity factors by a modified crack closure integral. Eng Fract Mech 9(4): 931–938. https://doi.org/10.1016/0013-7944(77)90013-3 Stepanova L, Roslyakov P (2016) Complete williams asymptotic expansion near the crack tips of collinear cracks of equal lengths in an infinite plane medium. Procedia Struct Integr 2: 1789–1796. https://doi.org/10.1016/j.prostr.2016.06.225 Wang JC, Gao YK (2019) The stress intensity factor calculation for combined sliding wear and fatigue of GH4169 superalloy based on three-dimensional simulation. Wear 2019: 436–437. https://doi.org/10.1016/j.wear.2019.203012 Wawrzynek PA, Carter BJ, Banks-Sills L (2005) The M-integral for computing stress intensity factors in generally anisotropic materials. Nasa/Cr- 2005–214006, July, 1 online resource (v, 81 p. ). Xiao X, Yan X (2007) A new numerical analysis for a semi-circular surface crack. Eng Fract Mech 74(16): 2639–2641. https://doi.org/10.1016/j.engfracmech.2006.12.020 Xiong X, Yang Y, Wang Z, Gan J, Wang XL, Gai WY, Li Y (2020) Three-dimensional fatigue crack propagation analysis and life prediction based on co-simulation of FRANC3D and ABAQUS. Journal of Wuhan University of Technology (Transportation Science & Engineering) 3: 506–512 Yu MH, Wang RH, Wang ZL, Li LB (2005) Research on the ultimate strength of pressure spherical shell with openings in manned deep-sea submersible. Sh Build China 46(4): 92–96. https://doi.org/10.3969/j.issn.1000-4882.2005.04.015 Zhang J, Gao J, Wang WB, Tang WX, Zhou T (2015) Investigation on mechanical properties of deep sea spherical pressure hull. Sh Build China 56(4): 129–140. https://doi.org/10.3969/j.issn.1000-4882.2015.04.014 Zhu YM, Li RJ, Fang WJ, Zhao XL, Tang WX, Yin BJ, Zhang J (2020) Interaction of surface cracks on an egg-shaped pressure shell. Arch Appl Mech 90(12): 2589–2596. https://doi.org/10.1007/s00419-020-01738-8