Incidence of Pitting Corrosion Wastage on the Hull Girder Ultimate Strength
https://doi.org/10.1007/s11804-021-00218-x
-
Abstract
The paper focuses on the assessment of the hull girder ultimate strength, combined with random pitting corrosion wastage, by the incremental-iterative method. After a brief review about the state of art, the local ultimate strength of pitted platings under uniaxial compression is preliminarily outlined and subsequently a closed-form design formula is endorsed in the Rule incremental-iterative method, to account for pitting corrosion wastage in the hull girder ultimate strength check. The ISSC bulk carrier is assumed as reference ship in a benchmark study, devoted to test the effectiveness of the incremental-iterative method, by a comparative analysis with a set of FE simulations, performed by Ansys Mechanical APDL. Four reference cases, with different locations of pitting corrosion wastage, are investigated focusing on nine combinations of pitting and corrosion intensity degrees. Finally, a comparative analysis between the hull girder ultimate strength, combined with pitting corrosion wastage, and the relevant values, complying with the Rule net scantling approach, is performed. Based on current results, the modified incremental-iterative method allows efficiently assessing the hull girder ultimate strength, combined with pitting corrosion wastage, so revealing useful both in the design process of new vessels and in the structural health monitoring of aged ships.Article Highlights• A comparative analysis with the net scantling approach is carried out to provide some guidance useful for the structural health assessment of aged structures.• A benchmark study, based on the ISSC bulk carrier, is performed to investigate the effectiveness of the modified incremental-iterative method;• An approximate formulation is embodied to assess the ultimate strength of pitted platings under compression;• The assessment of the hull girder ultimate strength in presence of pitting corrosion wastage is investigated by FE analysis and the incremental-iterative method; -
1 Introduction
Corrosion wastage is one of the key factors to be accounted in the design process of new ships and in the structural health assessment of aged structures, in order to keep both local and global strength check criteria satisfied over time and ensure safety of navigation. Really, age-related effects were not explicitly accounted in the ship design up to the 1980s, as both local and global scantlings were mainly based on Rule formulas, implicitly accounting for corrosion wastage, thanks to the experience gained on in service ships (Campanile et al. 2014). Nevertheless, in the last decades, the interest in developing a more rational approach, devoted to assessing the structural degradation of ships over time, grew fast as proved by the variety of research activities, experimental campaigns and corrosion measurements carried out throughout the world (Herring and Titcomb 1981; Thayamballi et al. 1987; Guedes Soares and Garbatov 1999; Paik et al. 2003a, b; Saad-Eldeen et al. 2013).
Based on the main outcomes of past research activities, in June 2003, the International Association of Classification Societies (IACS) agreed to endorse the net scantling approach in the first harmonized standards for the structural design of bulk carriers and oil tankers (IACS 2006a, b), in order to account for age-related effects in the ship design. The net scantling approach is mainly based on two corrosion additions, each one for one side exposure of all structural elements that, in turn, are deducted from the gross scantling values. In this respect, both local and global strength check criteria need to be fulfilled based on the net scantlings, so accounting for the structural degradation due to corrosion wastage, expected to occur up to the end of the ship design lifetime. This approach, which covers the effect of uniform corrosion wastage, is currently endorsed in the Harmonized Common Structural Rules for Bulk Carriers and Oil Tankers (IACS 2020).
Anyway, additional types of structural degradations, such as pitting, grooving or edge corrosion (DnV 2014), are commonly experienced by ships. In this respect, pitting corrosion wastage is generally located on platings and stiffener webs and it mainly consists of a localized non-uniform distribution of corroded areas, with different extent and corrosion intensity. In the last years, several attempts were undertaken to assess the ultimate strength of pitted platings under uniaxial compression, as proved by the design equations recently proposed by Rahbar-Ranji et al. (2015), Zhang et al. (2016 2017), Piscopo and Scamardella (2018, 2020), among others. Based on the main outcomes of past research activities, pitting corrosion wastage significantly affects the local strength of platings under compression, so as it needs to be included in current design procedures. Nevertheless, the incidence of such localized random corrosion on the hull girder ultimate strength has not been systematically investigated until now, at least to the best of the authors' knowledge. Hence, current research investigates this matter, focusing on the following key topics:
1. After a brief review about the ultimate strength of pitted platings under uniaxial compression, the Rule incremental-iterative method (IACS, 2020) is modified to include random pitting corrosion wastage;
2. The effectiveness of the modified incremental-iterative method is checked in a benchmark study, by a comparative analysis with a set of FE simulations, carried out by Ansys Mechanical APDL. Four reference cases, with different location and extent of random pitting corrosion wastage, are investigated focusing on nine corrosion wastage scenarios, characterized by different combinations of pitting ($ \mathrm{D}\mathrm{O}\mathrm{P}) $ and corrosion ($ \mathrm{D}\mathrm{O}\mathrm{C}) $ intensity degrees;
3. The dependence of the hull girder ultimate strength on both the location and extent of pitting corrosion wastage is further discussed, in order to investigate the impact of localized corrosion on the global strength of aged ships. In this respect, a comparative study between current results and the sagging/hogging hull girder ultimate strength values, based on the net scantling approach, is performed in order to verify the impact of localized corrosion on current design procedures.
All calculations are performed with reference to the well-known ISSC bulk carrier, recently taken as reference ship in a wide benchmark study on the hull girder ultimate strength (ISSC 2012). Before performing the numerical simulations, additional details about the FE modelling and the selection of the mesh size, required to ensure the convergence of solution, are also provided.
2 Theoretical Background
2.1 Ultimate Strength of Pitted Platings
The ultimate strength of platings under uniaxial compression has been a widely investigated topic since the 40 s, when a wide series of collapse tests was carried out at the David Taylor Model Basin of the US Navy. Following the results of this experimental campaign, the well-known Frankland (1940) formula, currently endorsed in the Rule incremental-iterative method (IACS 2020), was derived:
$$ \phi_u=\left\{\begin{array}{l}1\;\text{if }\beta\leq1.25\\\frac{2.25}\beta-\frac{1.25}{\beta^2}\;\text{if }\beta \gt 1.25\end{array}\right. $$ (1) In Eq. (1) $ {\phi }_{u}={\sigma }_{u}/{\sigma }_{y} $ denotes the ultimate $ \left({\sigma }_{u}\right) $ to yield $ \left({\sigma }_{y}\right) $ strength ratio, while $ \beta =\left(b/t\right)\sqrt{{\sigma }_{y}/E} $ is the plating slenderness, having denoted by $ b\left(t\right) $, the plate width (thickness), and $ E $, the material Young modulus.
The first pioneering works, dealing with the ultimate strength of pitted platings, were carried out slightly later in the mid-1960s by Chapkis (1967), even if most of current research activities started in the last two decades only (Paik et al. 2003a, b). More recently, several attempts have been performed to evaluate the ultimate strength of pitted platings by FE analysis and develop practical design formulas useful for the design of new vessels and the structural health assessment of aged ships (Khedmati et al. 2012; Jiang and Guedes Soares 2012; Zhang et al. 2017; Piscopo and Scamardella 2018 and 2020). Following the main outcomes of past research activities (Nouri et al. 2012; Khedmati et al. 2012; Rahbar-Ranji et al. 2015; Piscopo and Scamardella 2018), the ultimate strength of pitted platings mainly depends on the pitting ($ \mathrm{D}\mathrm{O}\mathrm{P} $) and corrosion ($ \mathrm{D}\mathrm{O}\mathrm{C} $) intensity degrees. The former is the percentage area of the plate panel affected by localised random corrosion, as it can be gathered by Figure 1, which provides the pitting intensity diagrams corresponding to 5%, 10%, 20% and 50% pitting intensity degrees (DnV 2014). The latter, instead, measures the corrosion loss in the pitted area region.
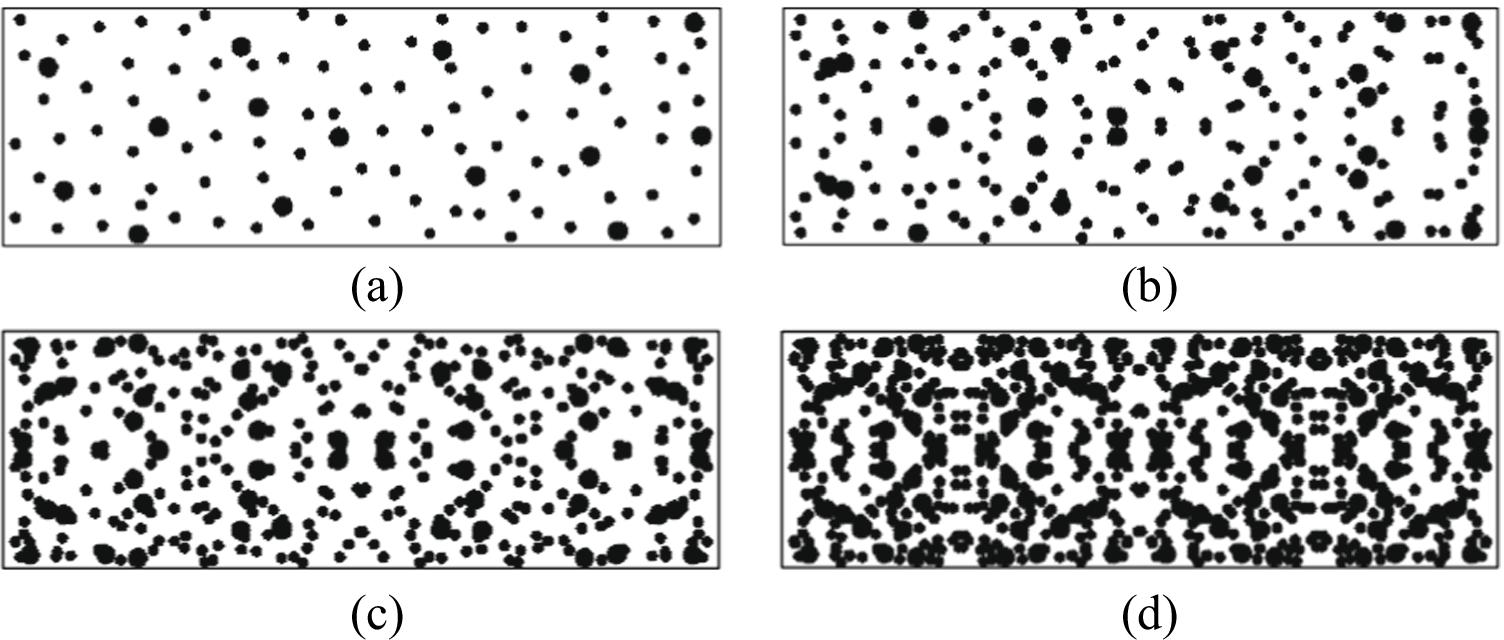 Figure 1 Pitting intensity diagrams. a 5% scattered. b 10% scattered. c 20% scattered. d 50% scattered
Nevertheless, current Rules and guidelines do not provide any explicit strength check criterion for the ultimate strength assessment of pitted platings, so as the design formula, recently provided by Piscopo and Scamardella (2018), is embodied. The design equation was derived for isolated plate panels, whose ultimate strength capacity is generally assessed by the well-known Faulkner (1975) formula. Anyway, it is currently extended to plate panels being part of grillage structures, whose ultimate capacity is generally provided by the Frankland formula that allows accounting for a certain rotational restraint degree along the longitudinal edges of the plate panels. The validity of this assumption will be checked in the benchmark study carried out in Section 4. Hence, the ultimate capacity of pitted platings under uniaxial compression is assessed as follows:
$$ \phi_{u,\mathrm{pit}}=\phi_{u\;}\left(\beta_{\mathrm{eq}}\right)\;\left[1-1.5\;\text{DOP}\cdot\text{DOC}\right] $$ (2) In Eq. (2) $ {\phi }_{u} $ is determined by Eq. (1), after replacing the plating slenderness $ \beta $ by the equivalent slenderness parameter:
$$ \beta_{\mathrm{eq}}=\left(b/t_{\mathrm{eq}}\right)\sqrt{\sigma_y/E} $$ (3) which, in turn, depends on the equivalent thickness of the pitted plate panel:
$$ t_{\mathrm{eq}}=t\cdot\left(1-\mathrm D\mathrm O\mathrm P\cdot\mathrm D\mathrm O\mathrm C\right) $$ (4) By Eqs. (2) and (4), it is gathered that platings with different pitting and corrosion intensity degrees, but with the same volume loss $ \Delta V=\mathrm D\mathrm O\mathrm P\cdot\mathrm D\mathrm O\mathrm C $ in the pitted area region, exhibit the same ultimate strength capacity. Hence, the ultimate strength format is mainly based on two main features: (i) the as-built thickness of pitted platings is replaced by the equivalent thickness according to Eq. (4), depending on the total volume loss; (ii) the ultimate strength of the pitted plating is assessed by Eq. (2), so considering a further drop-off of the plating ultimate capacity, in order to account for the stress concentrations around the pitted areas.
2.2 Modified Incremental-Iterative Method
The Rule incremental-iterative method (IACS 2020) is based on the following assumptions: (i) the ultimate strength is calculated at any transverse section between adjacent transverse webs; (ii) the hull girder cross-section remains plane; (iii) the material has an elasto-plastic behaviour; (iv) the hull girder cross-section is subdivided into a set of independent elements, namely hard corners, stiffeners and transversely stiffened platings. The hull girder curvature is progressively increased, and at each step, the vertical position of the cross-section neutral axis is iteratively varied until global equilibrium of axial forces occurs, depending on the stress–strain curves and failure modes of each structural element. Pitting corrosion wastage can be addressed in the Rule method by the following two steps, mainly based on the design equation for pitted platings under uniaxial compression, discussed in Section 2.1:
(i) The as-built thickness $ t $ of each structural element, affected by pitting corrosion wastage, is replaced by the equivalent thickness $ {t}_{eq} $, according to Eq. (4). In this way, the plating slenderness $ \beta $ is implicitly replaced by the equivalent slenderness $ {\beta }_{eq} $ by Eq. (3);
(ii) The beam-column buckling mode of shortened stiffeners (IACS 2020) is updated to account for the ultimate strength drop-off of the attached plating, affected by pitting corrosion wastage. In this respect, the Frankland formula, provided by Eq. (1), is replaced by Eq. (2), when the Euler column buckling stress is assessed;
(iii) The plate buckling mode of transversely stiffened platings (IACS 2020) is similarly updated, after replacing the Frankland formula with the design equation for pitted platings provided by Eq. (2).
Finally, the torsional and web local buckling modes of longitudinal stiffeners are assessed according to the formulas provided by the Rules (IACS 2020), after replacing the as-built thickness of stiffener webs by the equivalent thickness according to Eq. (4), in order to account for random pitting corrosion wastage.
3 Main Data
3.1 The ISSC Bulk Carrier
The vessel, selected as a reference ship in the benchmark study carried out in Sect. 4, is the Capesize single side skin bulk carrier, analysed in two past reports by the International Ship Structure Committee (ISSC 2000, 2012). The ship was also taken as reference vessel in several research studies, carried out in the last years by Amlashi and Moan (2008, 2009), Shu and Moan (2012), Campanile et al. (2014, 2015), Gordo (2017), Kefal et al. (2018), Piscopo and Scamardella (2019), among others. The hull girder section scheme is reported in Figure 2, while the ship main data are listed in Table 1. In this respect, it must be pointed out that the scantlings of the transverse web section are not provided in the ISSC benchmark studies, but they are reported in the work by Kefal et al. (2018). Besides, tripping brackets are not included in the FE model. Anyway, this assumption is expected to not particularly affect the FE simulations, at least for the ISSC bulk carrier, as it will be verified in Section 3.3, where a set of preliminary FE simulations is performed.
 Figure 2 Section scheme of the ISSC bulk carrierTable 1 Main data of the ISSC bulk carrier
Length between perpendiculars (m) 285.00 Rule length (m) 281.30 Moulded breadth (m) 50.00 Moulded depth (m) 26.70 Block coefficient 0.83 3.2 FE Modelling
The FE analysis, devoted to investigate the effectiveness of the modified incremental-iterative method outlined in Section 2.2, is performed by a dedicated code developed in Ansys Mechanical APDL. A ${}^{1}\!\!\diagup\!\!{}_{2}\;\text{-}1\text{-}{}^{1}\!\!\diagup\!\!{}_{2}\;$ bay model of the hull girder (Paik et al. 2008) is modelled by the 4-node SHELL181 element, which is suitable for linear, large rotation and large strain non-linear applications, involving thin to moderately thick shell structures (Ansys 2020). Besides, the elastic perfectly plastic material model is embodied in the analysis, with no strain hardening effects. Before applying the hull girder global loads, several initial deflection modes are also superimposed to the FE model, in order to enhance the various buckling modes of platings and stiffeners:
(i) Plate buckling: the deflection mode of each plate panel is modelled by a double sine trigonometric function, with one-half wave in the transverse direction and a number $ m $ of half waves in the longitudinal direction, equal to the minimum integer number satisfying the inequality $ \alpha \le \sqrt{m\left(m+1\right)} $ (Timoshenko and Gere 1982), having denoted by $ \alpha $ the panel aspect ratio. The maximum deflection is assumed to be equal to $ 0.1{\beta }^{2}t $ (Yoshikawa et al. 2015), corresponding to an average level of geometrical imperfections (Smith et al. 1988);
(ii) Beam-column buckling of longitudinal stiffeners: the deflection mode of each stiffened panel, comprised between adjacent primary supporting members, is modelled by a double sine trigonometric function, with one-half waves in both transverse and longitudinal directions. The maximum deflection is taken equal to $ \updownarrow /1000 $, having denoted by $ \updownarrow $ the spacing between transverse primary supporting members;
(iii) Lateral-torsional buckling of longitudinal stiffeners: the sideway deflection is assumed to follow a sine trigonometric function, with a wave number in the longitudinal direction corresponding to the predominant tripping deflection mode of the stiffener between transverse beams (Paik and Thayamballi 2006). The maximum lateral deflection is taken equal to $ \updownarrow /1000 $;
(iv) Local web buckling of longitudinal stiffeners: the deflection mode of the stiffener web is modelled by a double sine trigonometric function, with a wave number in the longitudinal direction corresponding to the elastic buckling mode of the stiffener web (Paik and Thayamballi 2006). The maximum deflection is taken equal to $ {h}_{w}/200 $, having denoted by $ {h}_{w} $ the height of the stiffener web.
As concerns the boundary conditions, the afterward cross-section of the FE model is clamped, while all nodes belonging to the forward section are each other coupled. Besides, the symmetry condition of the hull girder cross-section about the longitudinal plane is embodied to speed up the calculations. The bending moment, applied on a master node on the hull girder forward section, is progressively increased until convergence of the solution is achieved.
3.3 Preliminary FE Analysis
Before investigating the incidence of pitting corrosion wastage on the hull girder ultimate strength, a set of FE simulations is preliminarily performed, based on the gross scantlings of all structural members. In this respect, Table 2 provides the sagging/hogging ultimate strength capacities, corresponding to four mesh sizes, ranging from 870 to 300 mm, while Figure 3a and b plot the hull girder ultimate strength versus the total element number.
Table 2 Convergence of FE analysisMesh Element size (mm) and number Sagging (GNm) Hogging (GNm) Very coarse 870 4682 19.120 20.760 Coarse 800 7784 17.480 19.960 Fine 400 15, 144 15.800 18.920 Very fine 300 18, 785 15.640 18.720 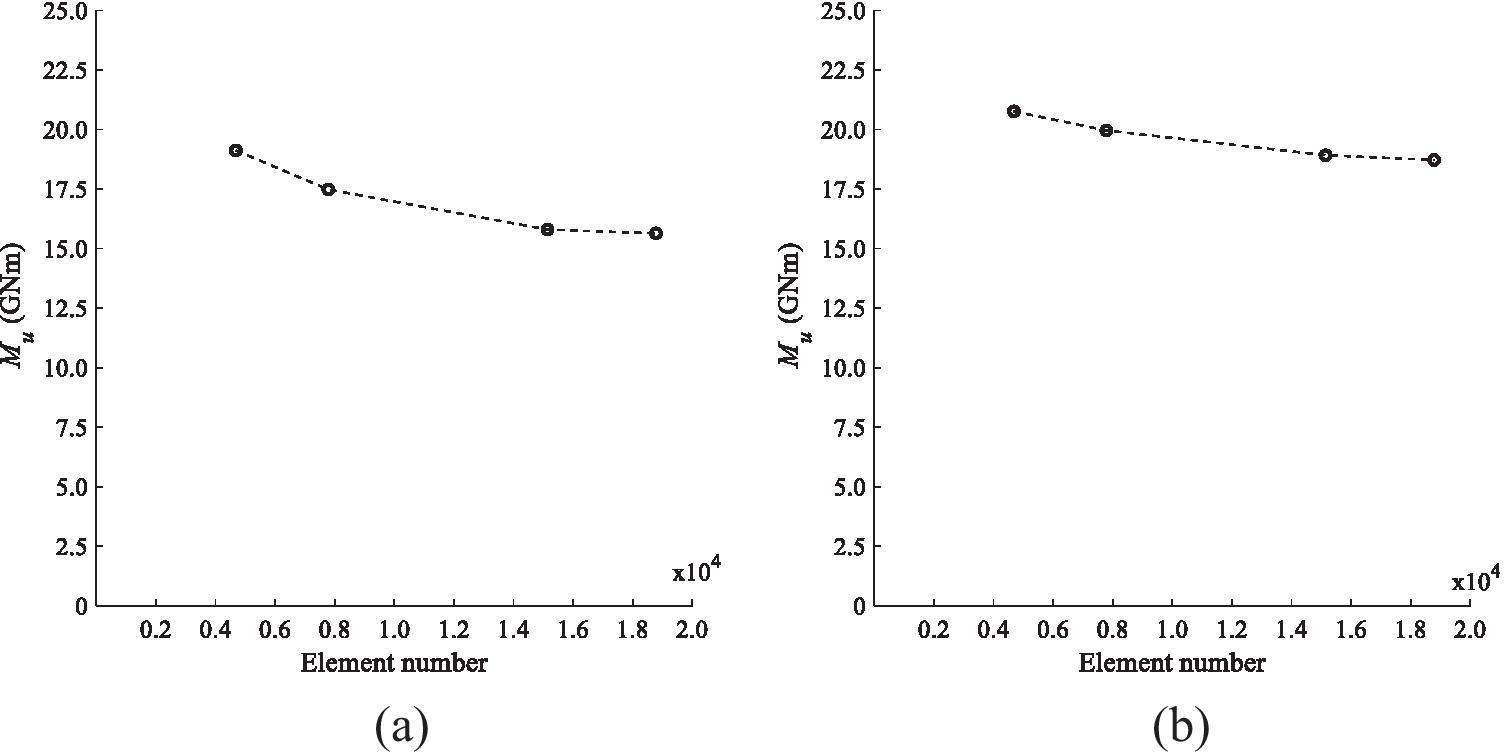 Figure 3 Incidence of mesh size on the hull girder ultimate strength. a Convergence of ultimate strength capacity—sag condition. b Convergence of ultimate strength capacity—hog condition
Based on current results, the very fine mesh, corresponding to a 300 mm mean element size, ensures the convergence of solution, so as it is selected in the FE simulations. In this respect, Table 3 also provides the number of shell elements of the main structures modelled in the FE analysis:
Table 3 Number of shell elementsStructural element Number of shell elements Plate width between longitudinal stiffeners 3 Plate width between transverse frames 3 Height of stiffener webs 2 Width of stiffener flanges 2 Height of girders and beams 10 After selecting the mesh size, the gross ultimate strength capacities, assessed by the incremental-iterative method (IACS, 2020), are compared with the FE values, in order to verify that effectiveness of the Rule procedure. By the comparative analysis reported in Table 4, the Rule method (IACS, 2020) underestimates the hull girder ultimate strength by less than 1%, as regards the FE results.
Table 4 Comparative analysis between the gross ultimate strength (GNm) obtained by FE simulation and the Rule methodMesh FE simulation Rule method Δ (%) Sagging 15.640 15.552 − 0.705 Hogging 18.720 18.588 − 0.563 Figure 4a and b plot the sagging/hogging ultimate strength capacities versus the hull girder curvature, obtained by the incremental-iterative method and the FE simulations, in the latter case up to the ultimate strength only, as the assessment of the post-ultimate regime is not required to evaluate the hull girder ultimate strength. Besides, Figure 4c and d provide the longitudinal stress distribution, obtained by FE analysis, at the hull girder ultimate strength. In this respect, it is also pointed out that the maximum values of longitudinal stresses are slightly higher than the yield ones. This outcome is widely predictable, as the von-Mises criterion is endorsed in the FE model, so as the positive-defined von-Mises stress field needs to fulfil the yielding condition. Current results confirm that the Rule method is effective for practical design purposes.
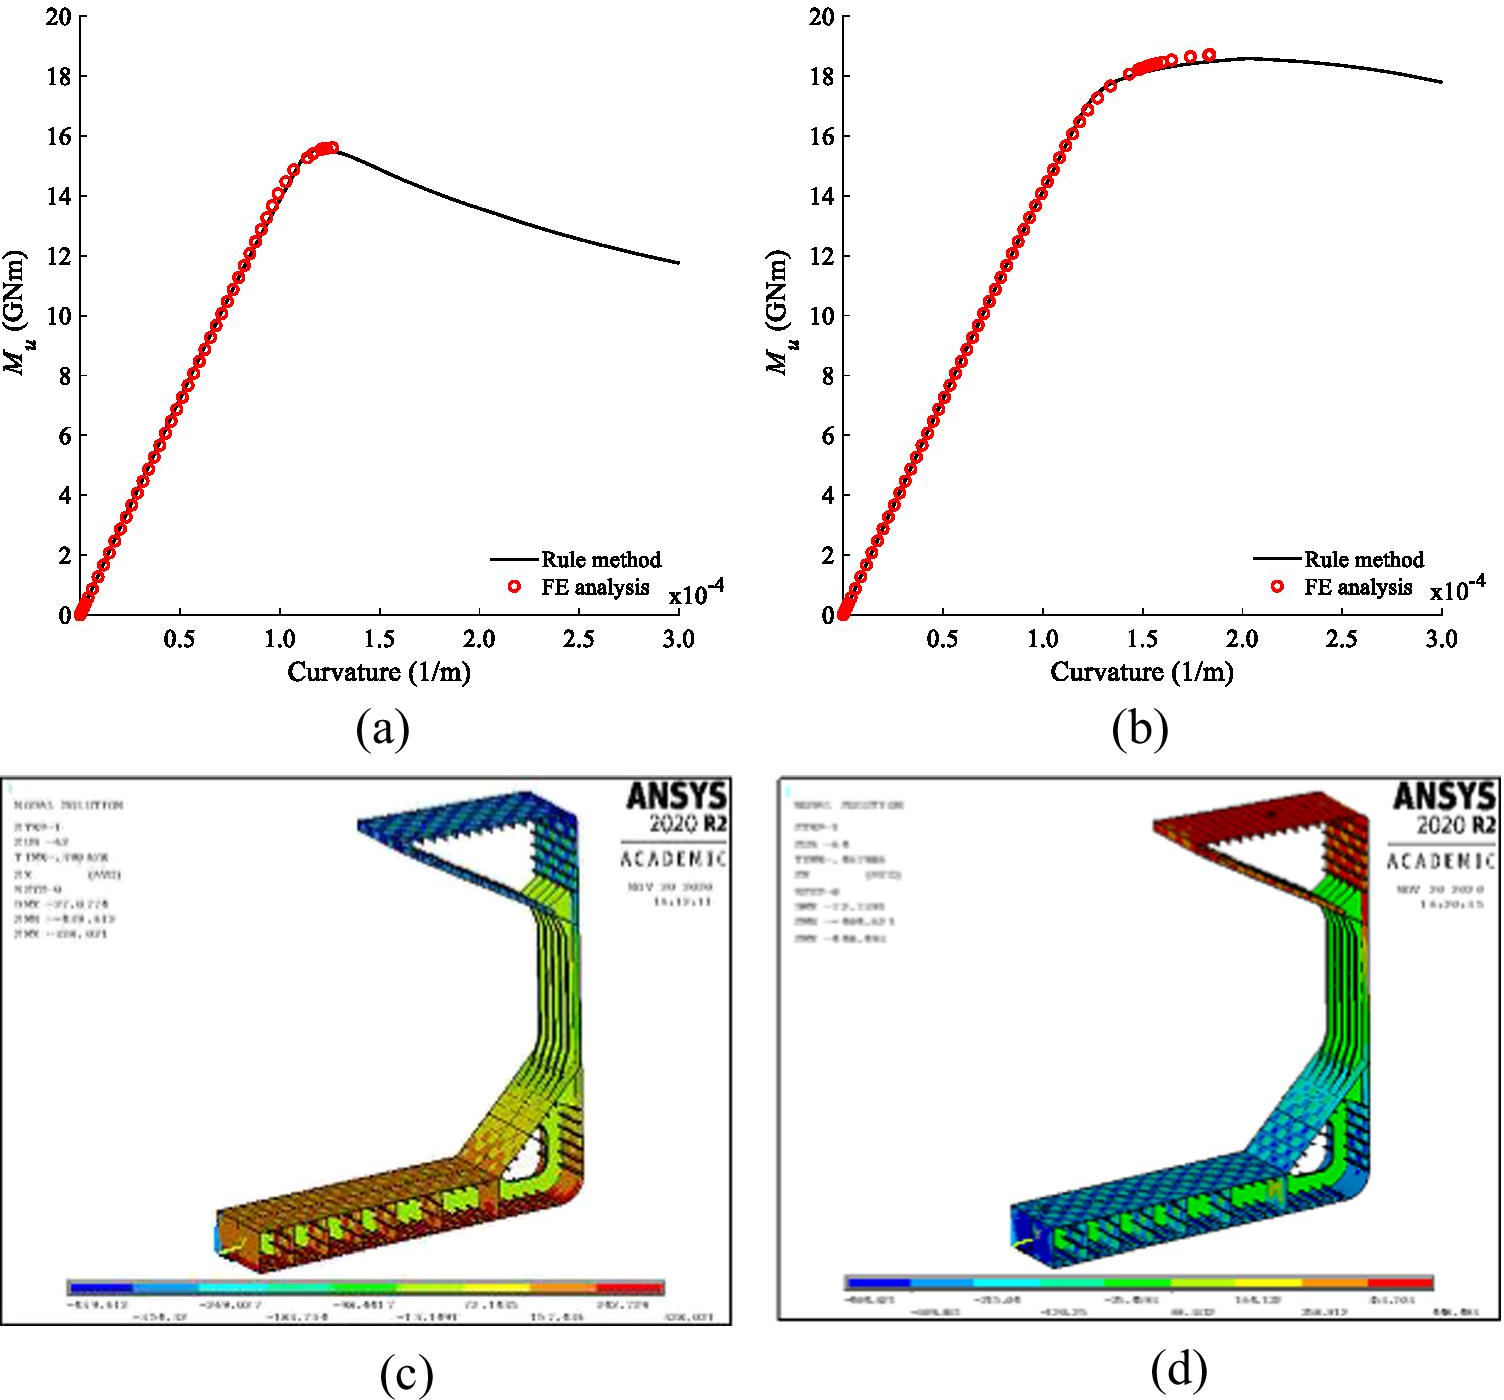 Figure 4 Comparative analysis between the FE simulation and the Rule method. a Moment/curvature diagram—sag condition. b Moment/curvature diagram—hog condition. c Longitudinal stress distribution at the ultimate strength—sag condition. d Longitudinal stress distribution at the ultimate strength—hog condition
4 Benchmark Study
The main aim of the benchmark study is to investigate the effectiveness of the modified incremental-iterative method, in presence of pitting corrosion wastage. In this respect, four reference scenarios, characterized by different locations and extent of pitting corrosion wastage, are selected as follows: (i) all platings and girders; (ii) all platings of double bottom, hopper side tank and girders; (iii) all platings of main deck and top side tank; and (iv) all platings, girders and longitudinal stiffener webs. Besides, nine combinations of pitting ($ \mathrm{D}\mathrm{O}\mathrm{P} $) and corrosion ($ \mathrm{D}\mathrm{O}\mathrm{C} $) intensity degrees are selected for each reference case. The $ \mathrm{D}\mathrm{O}\mathrm{P} $ degree ranges from 5% up to 20%, while the $ \mathrm{D}\mathrm{O}\mathrm{C} $ degree lies between 10 and 40%. All combinations do not require any structural replacement, according to the commonly embodied renewal criteria for structural elements affected by pitting corrosion wastage (DnV 2014).
Localized corrosion is included in the FE model by properly reducing the thickness of a random subset of shell elements, belonging to the structural members affected by pitting corrosion wastage, based on the assigned $ \mathrm{D}\mathrm{O}\mathrm{P} $ and $ \mathrm{D}\mathrm{O}\mathrm{C} $ degrees. In this respect, the thickness of a selected number of shell elements, belonging to each pitted plating, is properly reduced depending on the $ \mathrm{D}\mathrm{O}\mathrm{C} $ degree, so as stress concentrations are implicitly included in the FE model. The number of shell elements, belonging to the same plate panel and affected by localized corrosion, is assessed in compliance with the $ \mathrm{D}\mathrm{O}\mathrm{P} $ degree, while the relevant pattern over the pitted plate panel is randomly selected. This modelling solution reveals to be suitable for practical purposes, provided that the distribution of pitting corrosion wastage and the size of each pitted area play an almost negligible role on the ultimate strength drop-off of pitted platings under uniaxial compression, as stressed by Zhang et al. (2017), who investigated the incidence of different pitting distribution models on the plating ultimate capacity. Really, an alternative solution to account for random pitting corrosion wastage would be based on the endorsement of 3D elements, but this modelling technique, which reveals to be generally suitable when the ultimate strength of isolated pitted platings needs to be assessed, reveals to be almost unfeasible when the entire hull girder cross-section needs to be modelled.
Before performing the benchmark study, it was also verified that the hull girder ultimate strength, in presence of pitting corrosion wastage, is almost independent of the random distribution of pitted areas, so confirming one of the main outcomes stressed by Piscopo and Scamardella (2018, 2020) with reference to the local ultimate strength of pitted platings under uniaxial and biaxial compression. Indeed, the hull girder ultimate strength depends on the pitting and corrosion intensity degrees, independently of the random corrosion wastage pattern generated on each structural element.
4.1 Case I: Pitting Corrosion Wastage on All Platings and 4.1.1. Girders
Pitting corrosion wastage is located on all platings and girders. Table 5 provides the sagging/hogging ultimate capacities, assessed by the FE simulation and the incremental-iterative method. The same results are plotted in Figure 5a and b, where the dashed, pointed and pointed-dashed lines refer to the modified incremental-iterative method, while the point values to the FE analysis. Based on current results, the ultimate strength capacities, determined by the modified incremental-iterative method, comply with the FE values, with a maximum error equal to about 1%. Besides, the hull girder ultimate strength, based on different $ \mathrm{D}\mathrm{O}\mathrm{P} $ and $ \mathrm{D}\mathrm{O}\mathrm{C} $ degrees, but with the same $ \mathrm{D}\mathrm{O}\mathrm{P}\bullet \mathrm{D}\mathrm{O}\mathrm{C} $ product, is almost comparable, so proving that the drop-off of the hull girder ultimate capacity mainly depends on the total volume loss due to the corroded pitted areas, no matter which combination of $ \mathrm{D}\mathrm{O}\mathrm{P} $ and $ \mathrm{D}\mathrm{O}\mathrm{C} $ degrees is recognized on each plate panel. This outcome can be stressed also for the other cases analysed in the following.
Table 5 (a) Ultimate strength assessment—case I: sag condition (%). (b) Ultimate strength assessment—case I: hog condition (%).a. DOC DOP 5 10 20 FE Rule FE Rule FE Rule 10 15.520 15.453 15.400 15.328 15.240 15.067 20 15.440 15.328 15.200 15.067 14.720 14.537 40 15.160 15.067 14.600 14.537 13.600 13.476 b. DOC DOP 5 10 20 FE Rule FE Rule FE Rule 10 18.600 18.499 18.520 18.408 18.360 18.196 20 18.480 18.408 18.240 18.196 17.760 17.719 40 18.080 18.196 17.560 17.719 16.520 16.691  Figure 5 Drop-off of the hull girder ultimate strength—case I. a Sag condition. b Hog condition
4.2 Case II: Pitting Corrosion Wastage on Platings of Double Bottom, Hopper Side Tank and Girders
Pitting corrosion wastage is located on all platings of the double bottom, hopper side tank and longitudinal girders. Table 6 provides the ultimate strength capacities, while the comparative analysis between the incremental-iterative method and the FE simulations is performed in Figure 6a and b. Almost the same outcomes, already stressed in Section 4.1, can be highlighted. In fact, a very good agreement between the FE results and the incremental-iterative method is recognized, with a maximum percentage error equal to about 1%. Finally, the sagging ultimate strength is almost independent of pitting corrosion wastage, as discussed in Section 5.
Table 6 (a) Ultimate strength assessment—case II: sag condition (%). (b) Ultimate strength assessment—case II: hog condition (%).a. DOC DOP 5 10 20 FE Rule FE Rule FE Rule 10 15.640 15.549 15.638 15.545 15.636 15.540 20 15.638 15.545 15.620 15.540 15.600 15.533 40 15.636 15.540 15.600 15.533 15.560 15.509 b. DOC DOP 5 10 20 FE Rule FE Rule FE Rule 10 18.680 18.538 18.640 18.484 18.440 18.344 20 18.600 18.484 18.440 18.344 18.120 17.950 40 18.360 18.344 17.920 17.950 17.200 16.998 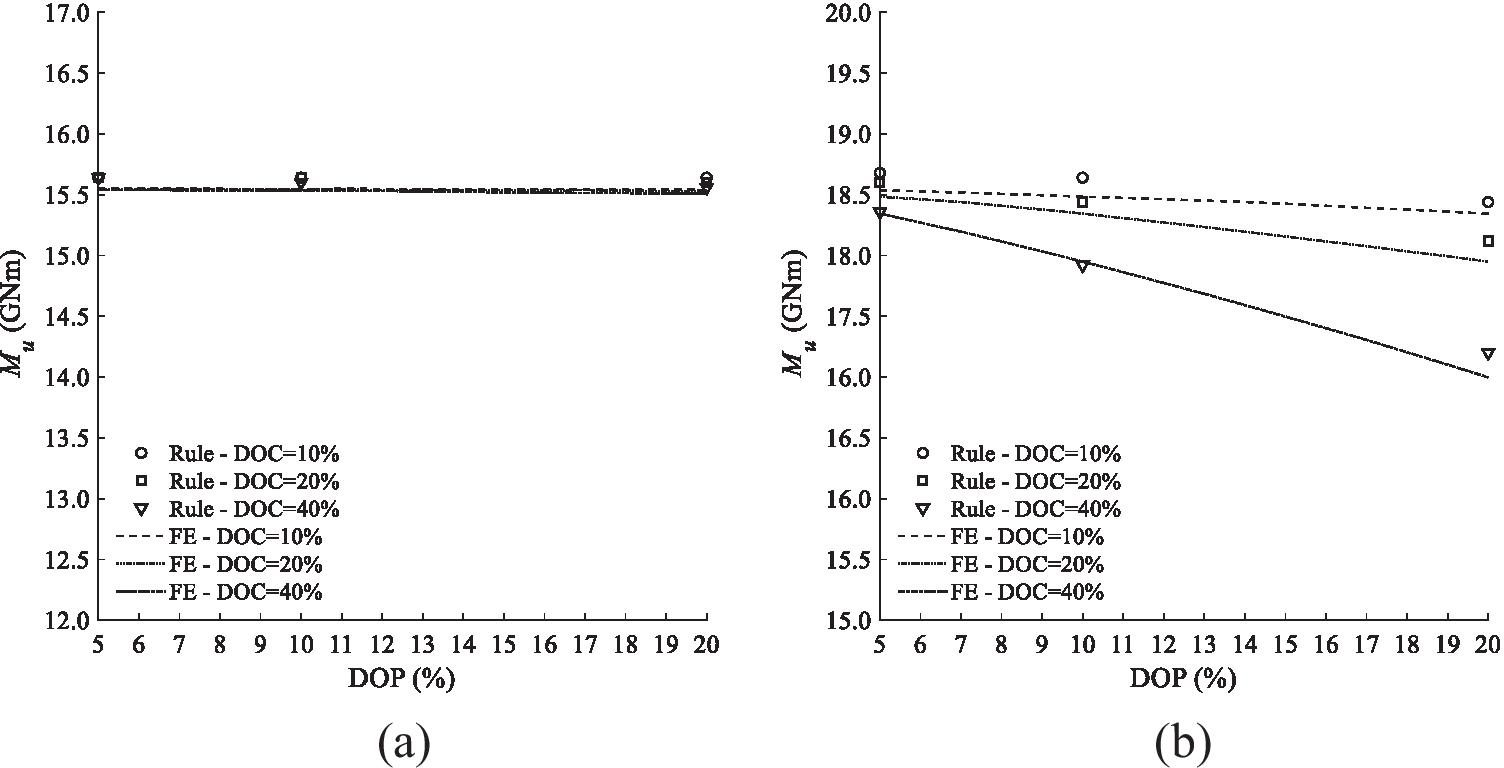 Figure 6 Drop-off of the hull girder ultimate strength—case II. a Sag condition. b Hog condition
4.3 Case III: Pitting Corrosion Wastage on Platings of Main Deck and Top Side Tank
Pitting corrosion wastage is located on all platings of the main deck and topside tank. The ultimate strength capacities are listed in Table 7 for the sagging and hogging conditions respectively and they are further plotted in Figure 7a and b. A very good agreement is recognized again between the iterative method and the FE analysis, with extremely low errors.
Table 7 (a) Ultimate strength assessment—case III: sag condition (%). (b) Ultimate strength assessment—case III: hog condition (%).a. DOC DOP 5 10 20 FE Rule FE Rule FE Rule 10 15.520 15.457 15.400 15.337 15.200 15.086 20 15.400 15.337 15.080 15.086 14.760 14.577 40 15.120 15.086 14.520 14.577 13.640 13.551 b. DOC DOP 5 10 20 FE Rule FE Rule FE Rule 10 18.680 18.550 18.640 18.510 18.600 18.431 20 18.600 18.510 18.520 18.431 18.240 18.271 40 18.440 18.431 18.240 18.271 17.880 17.956  Figure 7 Drop-off of the hull girder ultimate strength—case III. a Sag condition. b Hog condition
4.4 Case IV: Pitting Corrosion Wastage on All Platings and Webs of Longitudinal Stiffeners
Pitting corrosion wastage is located on all platings and stiffener webs. This case, even if only theoretical, allows further testing of the effectiveness of the modified incremental-iterative method outlined in Section 2.2. The results, listed in Table 8 and further plotted in Figure 8a and b, confirm the main outcomes already stressed with reference to the previously analysed reference cases. In fact, a very good agreement with the FE simulations is always recognized, with errors generally less than 1% for both sagging and hogging conditions.
Table 8 (a) Ultimate strength assessment—case IV: sag condition (%). (b) Ultimate strength assessment—case IV: hog condition (%).a. DOC DOP 5 10 20 FE Rule FE Rule FE Rule 10 15.440 15.434 15.360 15.288 15.080 14.982 20 15.360 15.288 14.920 14.982 14.520 14.361 40 14.880 14.982 14.280 14.361 13.120 13.125 b. DOC DOP 5 10 20 FE Rule FE Rule FE Rule 10 18.600 18.481 18.520 18.373 18.280 18.120 20 18.480 18.373 18.200 18.120 17.640 17.570 40 18.000 18.120 17.440 17.570 16.320 16.407 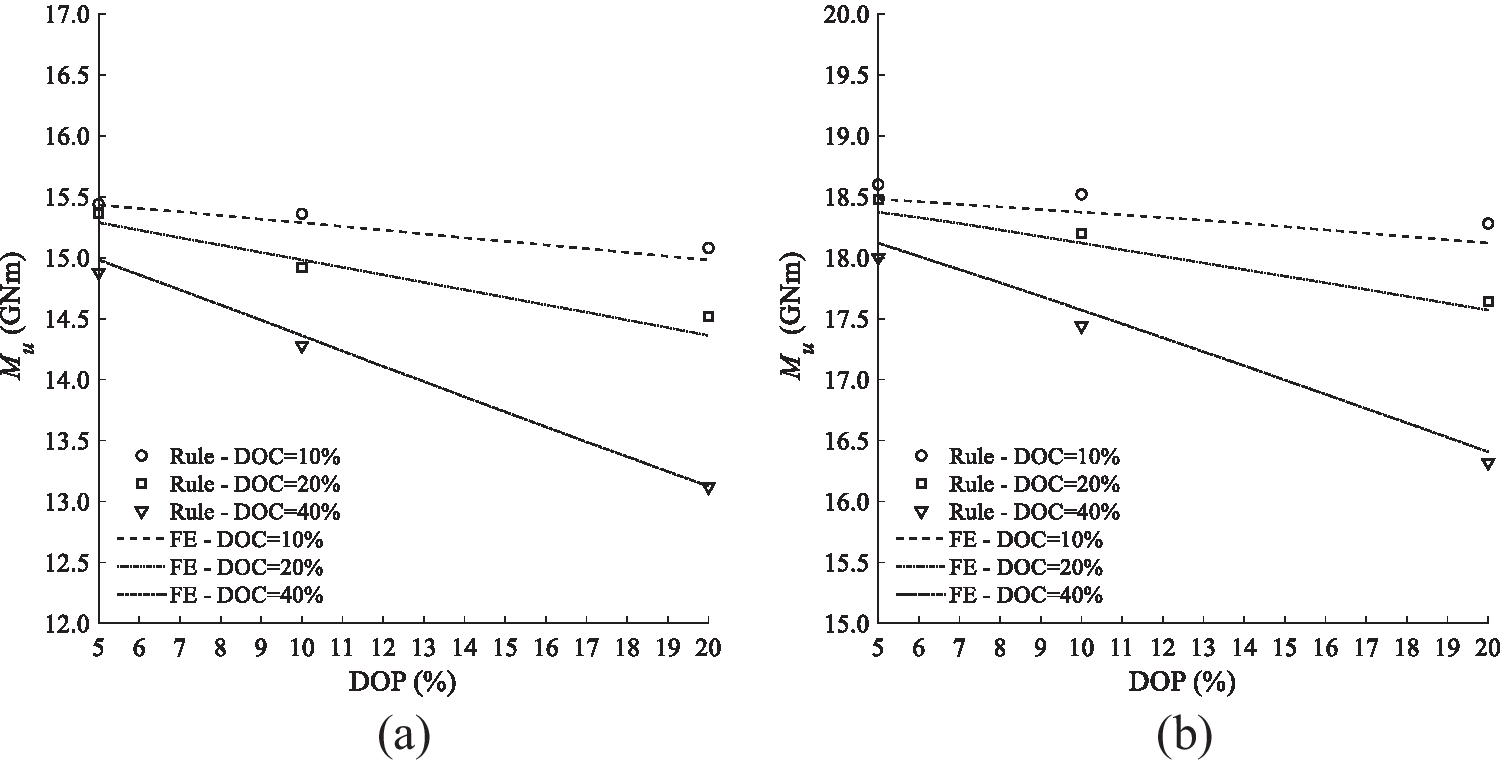 Figure 8 Drop-off of the hull girder ultimate strength—case IV. a Sag condition. b Hog condition
5 Discussion
As stressed in Section 1, the local and global strength check criteria, endorsed in the Rules (IACS 2020), do not explicitly account for pitting corrosion wastage, while the net scantling approach is embodied to account for the uniform corrosion the ship is expected to suffer up to the end of its design lifetime. In this respect, it is useful to compare the hull girder ultimate strength capacities, combined with pitting corrosion wastage, with the net scantling values, in order to provide some guidelines and suggestions useful for the design of new vessels and the structural health assessment of aged ships. In this respect, Figures 9, 10, 11 and 12 provide a comparative analysis between the ultimate strength capacities, based on the pitting corrosion wastage scenarios investigated in Section 4, and the sagging/hogging hull girder net scantling values, equal to 12.941 and 16.452 GNm, respectively. The following main outcomes are achieved:
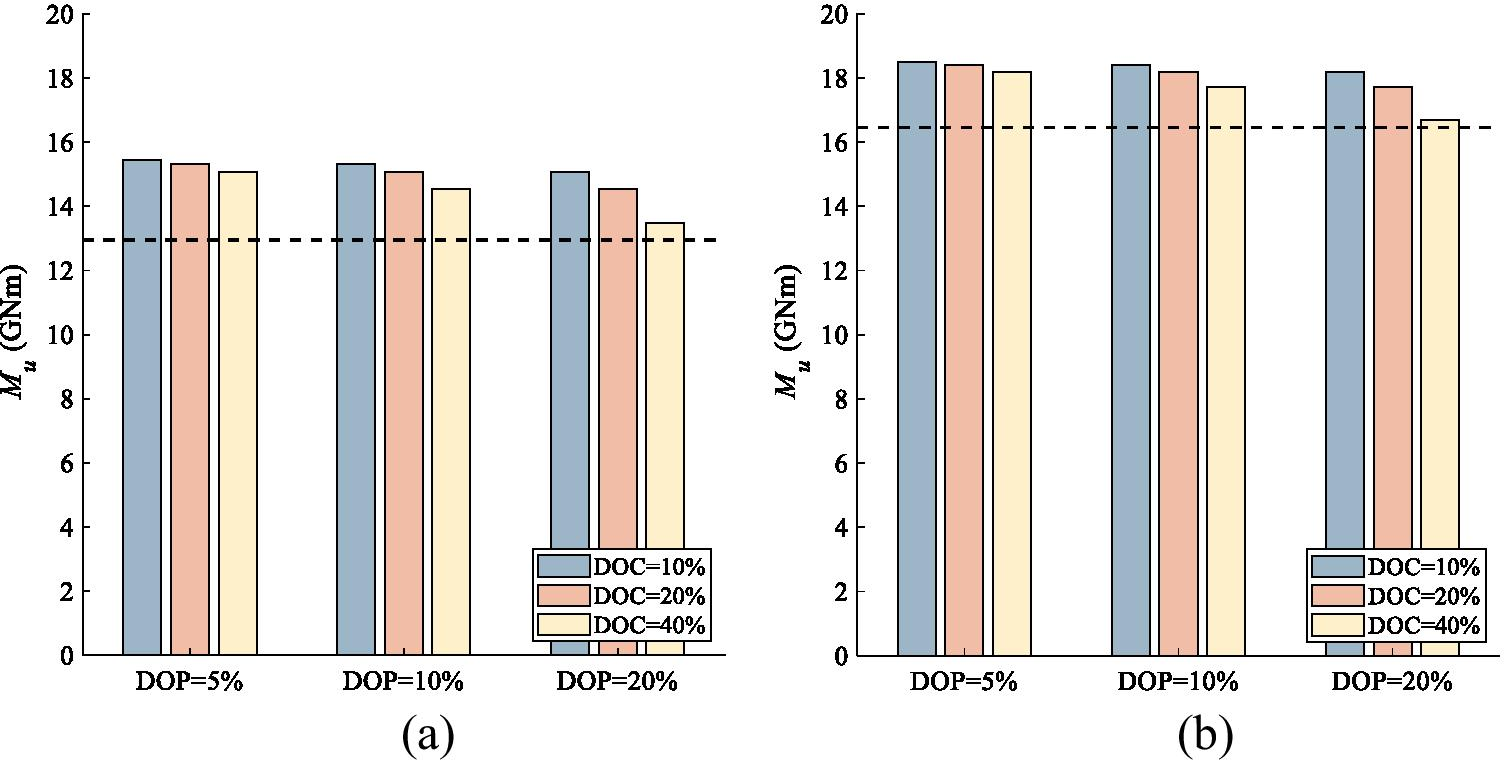 Figure 9 Comparative analysis between pitting corrosion wastage and the net scantling approach—case I. a Sag condition. b Hog condition
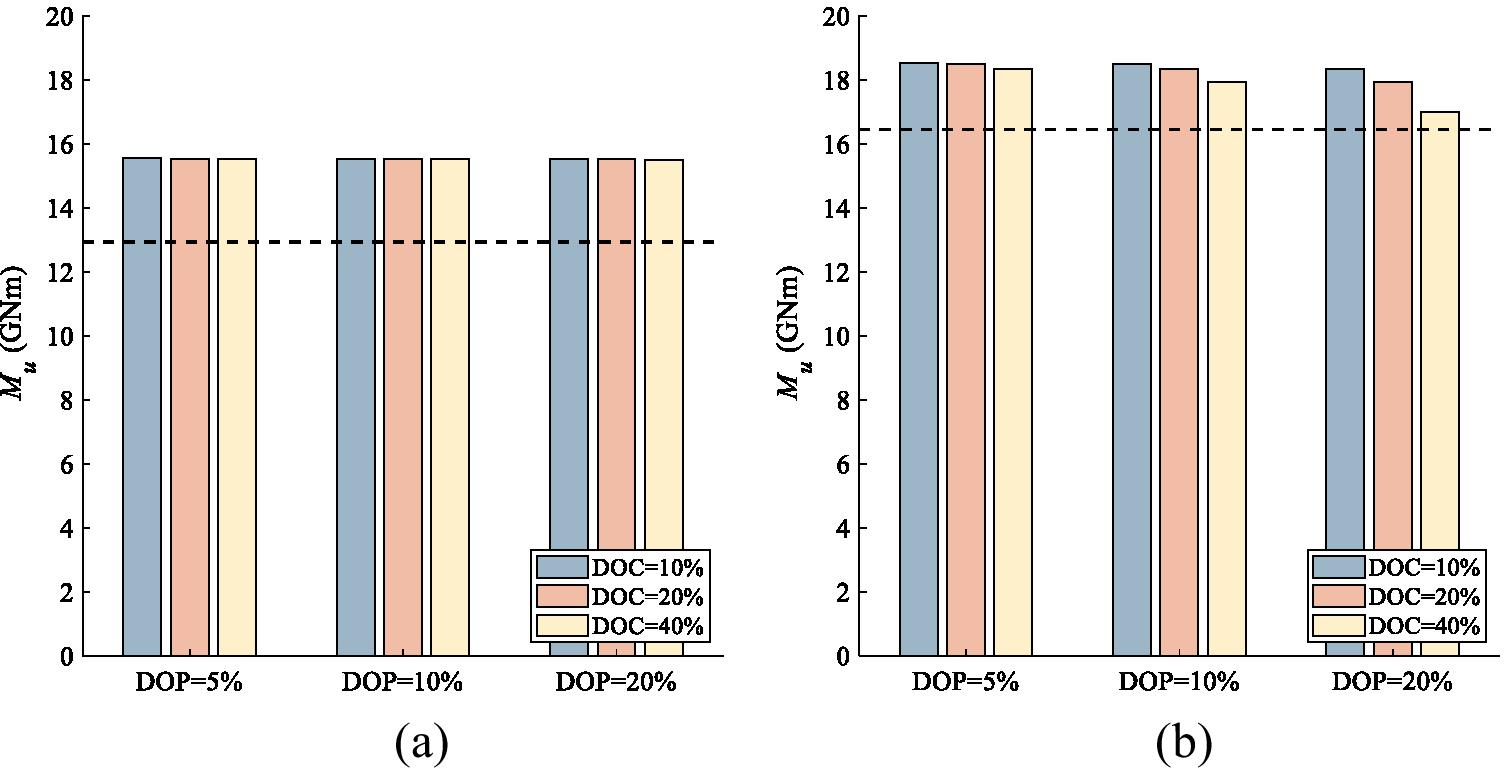 Figure 10 Comparative analysis between pitting corrosion wastage and the net scantling approach—case II. a Sag condition. b Hog condition
 Figure 11 Comparative analysis between pitting corrosion wastage and the net scantling approach—case III. a Sag condition. b Hog condition
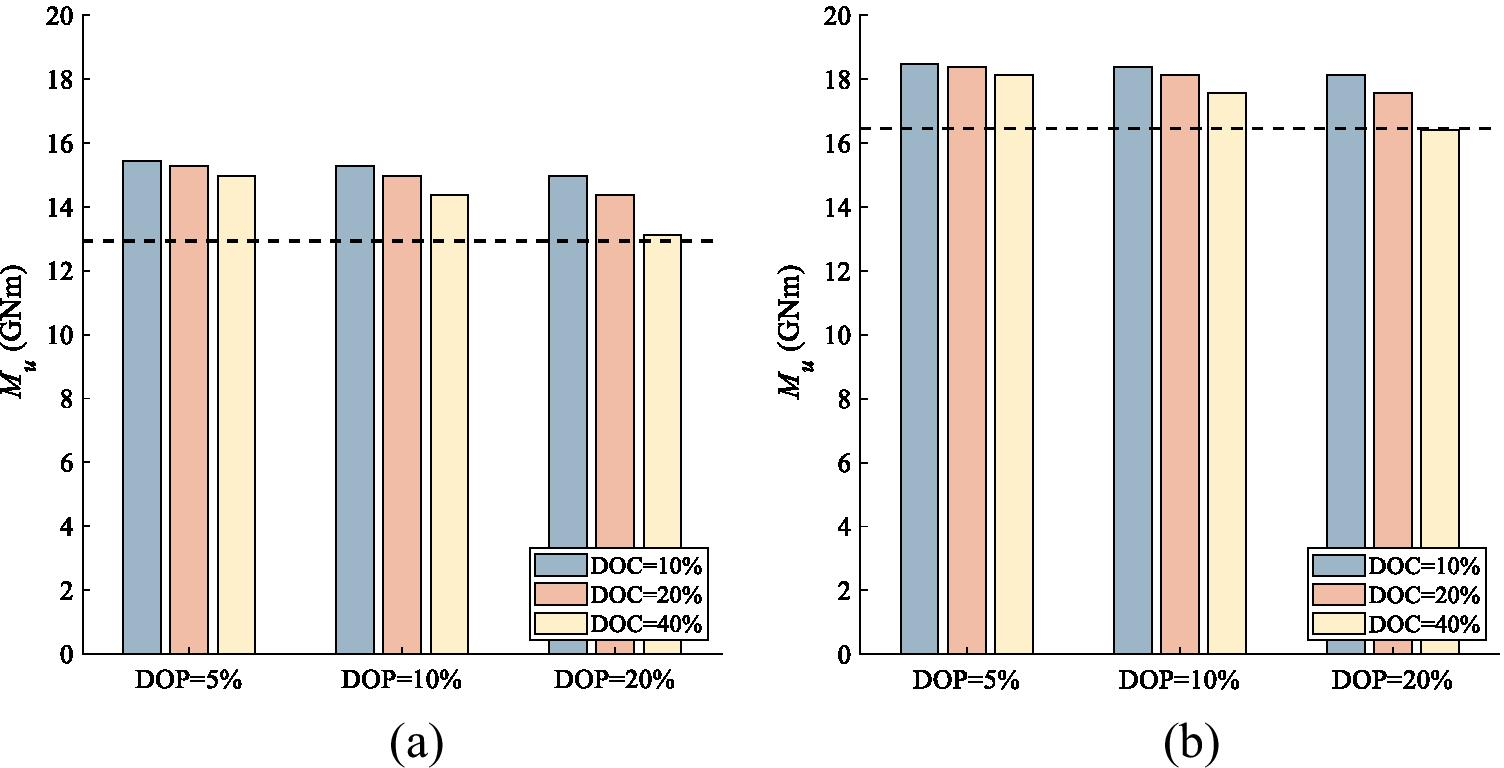 Figure 12 Comparative analysis between pitting corrosion wastage and the net scantling approach—case IV. a Sag condition. b Hog condition
(i) If pitting corrosion wastage is located on all platings, the hull girder ultimate strength drop-off of the ISSC bulk carrier, combined with 20% $ \mathrm{D}\mathrm{O}\mathrm{P} $ and 40% $ \mathrm{D}\mathrm{O}\mathrm{C} $ degrees, is comparable with the net scantling values, as depicted in Figure 9a and b for the sagging and hogging conditions;
(ii) If pitting corrosion wastage is located on all platings of the double bottom and hopper side tank, the sagging ultimate strength is almost independent of pitting corrosion wastage, as depicted in Figure 10a, while the hull girder hogging capacity is comparable with the values gained in the previous corrosion wastage scenario, as it can be gathered by Figure 10b;
(iii) If pitting corrosion wastage is located on all platings of the main deck and topside tank, the hogging ultimate strength is slightly dependent of pitting corrosion wastage, as depicted in Figure 11a, while the hull girder sagging capacity is comparable with the values gained in the first reference scenario, as it can be gathered by Figure 11b;
(iv) If pitting corrosion wastage is located on all platings and stiffener webs, no substantial variations, as regards the first reference scenario, are recognized, as it can be gathered by Figure 12a and b, so proving that localized corrosion of stiffener webs has a moderate impact on the drop-off of the hull girder ultimate strength.
Based on previous remarks, pitting corrosion wastage, with 20% $ \mathrm{D}\mathrm{O}\mathrm{P} $ and 40% $ \mathrm{D}\mathrm{O}\mathrm{C} $ degrees, corresponding to a mean volume loss equal to 8%, leads to a drop-off of the hull girder ultimate strength that is comparable with the net scantling values. This outcome suggests that localized corrosion wastage should be included in the Rule strength check criteria for the design of new vessels and for the structural health assessment of aged ships. Obviously, these outcomes can be stressed with reference to the ISSC bulk carrier and need to be further verified. Anyway, current results confirm that random pitting corrosion wastage needs to be included in the Rule strength check criteria.
6 Conclusion
The paper focused on the hull girder ultimate strength assessment of a bulk carrier, in presence of random pitting corrosion wastage, by the incremental-iterative method and the FE analysis. After a brief review about the ultimate strength assessment of pitted platings under uniaxial compression, the design equation, recently proposed by Piscopo and Scamardella (2018), was outlined and endorsed in the incremental-iterative method, in order to account for pitting corrosion wastage. The ISSC bulk carrier was taken as reference ship in a benchmark study devoted to investigate the effectiveness of the modified incremental-iterative method by a comparative analysis with a set of FE simulations, performed by a code purposely developed in Ansys Mechanical APDL. Four reference cases, with different locations of pitting corrosion wastage, were selected and combined with nine corrosion wastage scenarios, characterized by different combinations of pitting and corrosion intensity degrees.
The following main outcomes have been achieved:
(i) A modified form of the incremental-iterative method was outlined in Section 2.2, in order to account for pitting corrosion wastage on platings and stiffener webs;
(ii) The effectiveness of the modified incremental-iterative method was investigated in Section 4, where the benchmark study, based on the ISSC bulk carrier, was carried out. In this respect, the maximum error on the hull girder ultimate strength, as regards the FE values, was equal to about 1% independently of the location and intensity of pitting corrosion wastage;
(iii) The dependence of the hull girder ultimate strength on the location and extent of pitting corrosion wastage was further investigated in Section 5, where a comparative analysis with the net scantling approach was performed.
Based on current results, the modified incremental-iterative method seems to be effective for the reliable assessment of the hull girder ultimate strength in presence pitting corrosion wastage. Indeed, localized corrosion plays a fundamental role and it can yield a consistent drop-off of the hull girder ultimate strength. In this respect, it was verified that the hull girder ultimate strength of the ISSC bulk carrier, in presence of random pitting corrosion wastage, is comparable with the net scantling values, if the total volume loss due to the pitted areas is equal to 8%. The encouraging outcomes of current research cannot be obviously generalized and they should be further checked, focusing on different ship types. The investigation of localized corrosion patches, characterized by different combinations of $ \mathrm{D}\mathrm{O}\mathrm{P} $ and $ \mathrm{D}\mathrm{O}\mathrm{C} $ degrees, on the hull girder ultimate strength drop-off of additional reference ships will be the subject of future works.
Open Access This article is licensed under a Creative Commons Attribution 4.0 International License, which permits use, sharing, adaptation, distribution and reproduction in any medium or format, as long as you give appropriate credit to the original author(s) and the source, provide a link to the Creative Commons licence, and indicate if changes were made. The images or other third party material in this article are included in the article's Creative Commons licence, unless indicated otherwise in a credit line to the material. If material is not included in the article's Creative Commons licence and your intended use is not permitted by statutory regulation or exceeds the permitted use, you will need to obtain permission directly from the copyright holder. To view a copy of this licence, visit http://creativecommons.org/licenses/by/4.0/. -
Figure 1 Pitting intensity diagrams. a 5% scattered. b 10% scattered. c 20% scattered. d 50% scattered
Figure 2 Section scheme of the ISSC bulk carrier
Figure 3 Incidence of mesh size on the hull girder ultimate strength. a Convergence of ultimate strength capacity—sag condition. b Convergence of ultimate strength capacity—hog condition
Figure 4 Comparative analysis between the FE simulation and the Rule method. a Moment/curvature diagram—sag condition. b Moment/curvature diagram—hog condition. c Longitudinal stress distribution at the ultimate strength—sag condition. d Longitudinal stress distribution at the ultimate strength—hog condition
Figure 5 Drop-off of the hull girder ultimate strength—case I. a Sag condition. b Hog condition
Figure 6 Drop-off of the hull girder ultimate strength—case II. a Sag condition. b Hog condition
Figure 7 Drop-off of the hull girder ultimate strength—case III. a Sag condition. b Hog condition
Figure 8 Drop-off of the hull girder ultimate strength—case IV. a Sag condition. b Hog condition
Figure 9 Comparative analysis between pitting corrosion wastage and the net scantling approach—case I. a Sag condition. b Hog condition
Figure 10 Comparative analysis between pitting corrosion wastage and the net scantling approach—case II. a Sag condition. b Hog condition
Figure 11 Comparative analysis between pitting corrosion wastage and the net scantling approach—case III. a Sag condition. b Hog condition
Figure 12 Comparative analysis between pitting corrosion wastage and the net scantling approach—case IV. a Sag condition. b Hog condition
Table 1 Main data of the ISSC bulk carrier
Length between perpendiculars (m) 285.00 Rule length (m) 281.30 Moulded breadth (m) 50.00 Moulded depth (m) 26.70 Block coefficient 0.83 Table 2 Convergence of FE analysis
Mesh Element size (mm) and number Sagging (GNm) Hogging (GNm) Very coarse 870 4682 19.120 20.760 Coarse 800 7784 17.480 19.960 Fine 400 15, 144 15.800 18.920 Very fine 300 18, 785 15.640 18.720 Table 3 Number of shell elements
Structural element Number of shell elements Plate width between longitudinal stiffeners 3 Plate width between transverse frames 3 Height of stiffener webs 2 Width of stiffener flanges 2 Height of girders and beams 10 Table 4 Comparative analysis between the gross ultimate strength (GNm) obtained by FE simulation and the Rule method
Mesh FE simulation Rule method Δ (%) Sagging 15.640 15.552 − 0.705 Hogging 18.720 18.588 − 0.563 Table 5 (a) Ultimate strength assessment—case I: sag condition (%). (b) Ultimate strength assessment—case I: hog condition (%).
a. DOC DOP 5 10 20 FE Rule FE Rule FE Rule 10 15.520 15.453 15.400 15.328 15.240 15.067 20 15.440 15.328 15.200 15.067 14.720 14.537 40 15.160 15.067 14.600 14.537 13.600 13.476 b. DOC DOP 5 10 20 FE Rule FE Rule FE Rule 10 18.600 18.499 18.520 18.408 18.360 18.196 20 18.480 18.408 18.240 18.196 17.760 17.719 40 18.080 18.196 17.560 17.719 16.520 16.691 Table 6 (a) Ultimate strength assessment—case II: sag condition (%). (b) Ultimate strength assessment—case II: hog condition (%).
a. DOC DOP 5 10 20 FE Rule FE Rule FE Rule 10 15.640 15.549 15.638 15.545 15.636 15.540 20 15.638 15.545 15.620 15.540 15.600 15.533 40 15.636 15.540 15.600 15.533 15.560 15.509 b. DOC DOP 5 10 20 FE Rule FE Rule FE Rule 10 18.680 18.538 18.640 18.484 18.440 18.344 20 18.600 18.484 18.440 18.344 18.120 17.950 40 18.360 18.344 17.920 17.950 17.200 16.998 Table 7 (a) Ultimate strength assessment—case III: sag condition (%). (b) Ultimate strength assessment—case III: hog condition (%).
a. DOC DOP 5 10 20 FE Rule FE Rule FE Rule 10 15.520 15.457 15.400 15.337 15.200 15.086 20 15.400 15.337 15.080 15.086 14.760 14.577 40 15.120 15.086 14.520 14.577 13.640 13.551 b. DOC DOP 5 10 20 FE Rule FE Rule FE Rule 10 18.680 18.550 18.640 18.510 18.600 18.431 20 18.600 18.510 18.520 18.431 18.240 18.271 40 18.440 18.431 18.240 18.271 17.880 17.956 Table 8 (a) Ultimate strength assessment—case IV: sag condition (%). (b) Ultimate strength assessment—case IV: hog condition (%).
a. DOC DOP 5 10 20 FE Rule FE Rule FE Rule 10 15.440 15.434 15.360 15.288 15.080 14.982 20 15.360 15.288 14.920 14.982 14.520 14.361 40 14.880 14.982 14.280 14.361 13.120 13.125 b. DOC DOP 5 10 20 FE Rule FE Rule FE Rule 10 18.600 18.481 18.520 18.373 18.280 18.120 20 18.480 18.373 18.200 18.120 17.640 17.570 40 18.000 18.120 17.440 17.570 16.320 16.407 -
Amlashi HKK, Moan T (2008) Ultimate strength analysis of a bulk carrier hull girder under alternate hold loading condition – a case study Part 1: nonlinear finite element modelling and ultimate hull girder capacity. Mar Struct 21: 327–352. https://doi.org/10.1016/j.marstruc.2007.12.006 Amlashi HKK, Moan T (2009) Ultimate strength analysis of a bulk carrier hull girder under alternate hold loading condition, Part 2: stress distribution in the double bottom and simplified approaches. Mar Struct 22: 522–544. https://doi.org/10.1016/j.marstruc.2008.12.005 Ansys (2020) User manual of Ansys Mechanical APDL, Release 2020 R2 Campanile A, Piscopo V, Scamardella A (2014) Statistical properties of bulk carrier longitudinal strength. Mar Struct 39: 438–462. https://doi.org/10.1016/j.marstruc.2014.10.007 Campanile A, Piscopo V, Scamardella A (2015) Statistical properties of bulk carrier residual strength. Ocean Eng 106: 46–67. https://doi.org/10.1016/j.oceaneng.2015.06.060 Chapkis DT (1967) Simulation of pitting corrosion of hull plating under static loading. Trudy TSNIIMF 82: 34–50 doi: 10.1007/1-4020-5370-3_665 DnV (2014) Allowable thickness diminution for hull structure. Classification Note 72.1 Faulkner D (1975) A review of effective plating for use in the analysis of stiffened plating in bending and compression. J Ship Res 19(1): 1–17 https://doi.org/10.5957/jsr.1975.19.1.1 Frankland JM (1940) The strength of ship plating under edge compression. David Taylor Model Basin Report 469 Gordo JM (2017) Compressive strength of double-bottom under alternate hold loading condition. Guedes Soares and Garbatov (Eds). Progress in the Analysis and Design of Marine Structures: 253–261 Guedes Soares C, Garbatov Y (1999) Reliability of maintained corrosion protected plates subjected to non-linear corrosion and compressive loads. Mar Struct 12: 425–445. https://doi.org/10.1016/S0951-8339(99)00028-3 Herring LC, Titcomb AN (1981) Investigation of internal corrosion and corrosion-control alternatives in commercial tankships. Ship Structure Committee Report SSC-312 IACS (2006a) Common Structural Rules for Bulk Carriers. International Association of Classification Societies. London, UK IACS (2006b) Common structural rules for oil tankers. International Association of Classification Societies. London, UK IACS (2020) Common structural rules for bulk carriers and oil tankers. International Association of Classification Societies. London, UK ISSC (2000) Ultimate hull girder strength. Report of the Special Task Committee VI. 2. Proceedings of the 14th International Ship and Offshore Structures Congress, Nagasaki, Japan ISSC (2012) Ultimate hull girder strength. Report of the Special Task Committee III. 1. Proceedings of the 18th International Ship and Offshore Structures Congress, Rostock, Germany Jiang X, Guedes Soares C (2012) Ultimate capacity of rectangular plates with partial depth pits under uniaxial loads. Mar Struct 26: 27–41. https://doi.org/10.1016/j.marstruc.2011.12.005 Kefal A, Mayang JB, Oterkus E, Yildiz M (2018) Three-dimensional shape and stress monitoring of bulk carriers based on iFEM methodology. Ocean Eng 147: 256–267. https://doi.org/10.1016/j.oceaneng.2017.10.040 Khedmati MR, Nouri ZHM, Roshanal MM (2012) A comparative computational investigation on the effects of randomly distributed general corrosion on the post-buckling behaviour of uniaxially loaded plates. J Mech Sci Technol 26(3): 767–783. https://doi.org/10.1007/s12206-011-1222-1 Nouri ZHM, Khedmati MR, Sadeghifard S (2012) An effective thickness proposal for strength evaluation of one side pitted steel plates under uniaxial compression. Lat Am J Solids Struct 9: 475–496. https://doi.org/10.1590/S1679-78252012000400004 Paik JK, Wang G, Thayamballi AK, Lee JM, Park Y (2003a) Time-variant ultimate longitudinal strength of corroded bulk carriers. Mar Struct 16: 567–600. https://doi.org/10.1016/j.marstruc.2004.01.003 Paik JK, Wang G, Thayamballi AK, Lee JM, Park Y (2003b) Time-dependent risk assessment of ageing ships accounting for general/pit corrosion, fatigue cracking and local dent damage. Proceedings of the Annual SNAME Meeting, San Francisco (USA) Paik JK, Thayamballi AK (2006) Ultimate Limit State Design of Steel-Plated Structures. John Wiley & Sons, Chichester, UK Paik JK, Kim BJ, Seo JK (2008) Methods for ultimate limit state assessment of ships and ship-shaped offshore structures: Part III hull girders. Ocean Eng 35: 281–286. https://doi.org/10.1016/j.oceaneng.2007.08.008 Piscopo V, Scamardella A (2018) Towards a unified formulation for the ultimate strength assessment of uncorroded and pitted platings under uniaxial compression. Ocean Eng 169: 70–86. https://doi.org/10.1016/j.oceaneng.2018.08.042 Piscopo V, Scamardella A (2019) Sensitivity analysis of hull girder reliability in intact condition based on different load combination methods. Mar Struct 64: 18–34. https://doi.org/10.1016/j.marstruc.2018.10.009 Piscopo V, Scamardella A (2020) Ultimate strength assessment of intact and pitted platings under biaxial compression. Eng Struct 204(11079): 1–17. https://doi.org/10.1016/j.engstruct.2019.110079 Rahbar-Ranji A, Niamir N, Zarookian A (2015) Ultimate strength of stiffened plates with pitting corrosion. Int J Nav Archit Ocean Eng 7: 509–525. https://doi.org/10.1515/ijnaoe-2015-0037 Saad-Eldeen S, Garbatov Y, Guedes Soares C (2013) Effect of corrosion severity on the ultimate strength of a steel box girder. Mar Struct 49: 560–571. https://doi.org/10.1016/j.engstruct.2012.11.017 Shu Z, Moan T (2012) Ultimate hull girder strength of a bulk carrier under combined global and local loads in the hogging and alternate hold loading condition using nonlinear finite element analysis. J Mar Sci Technol 18(1): 94–113. https://doi.org/10.1007/s00773-011-0147-9 Smith CS, Davidson PC, Chapman JC, Dowling PJ (1988) Strength and stiffness of ships' plating under in-plane compression and tension. Trans R Inst Nav Archit 130: 277–296 https://trid.trb.org/view.aspx?id=403900 Thayamballi AK, Chen YK, Chen HH (1987) Deterministic and reliability based retrospective strength assessment of oceangoing vessels. SNAME Transactions 95: 159–187 Timoshenko SP, Gere JM (1982) Theory of elastic stability, 2nd edn. McGraw-Hill, London, UK Yoshikawa T, Bayatfar A, Kim BJ, Chen CP, Wang D, Boulares J, Gordo JM, Josefson L, Smith M, Kaeding P, Jensen P, Ojeda R, Benson S, Vhanmane S, Zhang S, Jiang X, Qian X (2015) Committee III. 1 Ultimate strength. Proceedings of the 19th International Ship and Offshore Structures Congress, Cascais, Portugal Zhang Y, Huang Y, Zhang Q, Liu G (2016) Ultimate strength of hull structural plate with pitting corrosion damnification under combined loading. Ocean Eng 116:273–285. https://doi.org/10.1016/j.oceaneng.2016.02.039 Zhang Y, Huang Y, Meng F (2017) Ultimate strength of hull structural stiffened plate with pitting corrosion damage under uniaxial compression. Mar Struct 56:117–136. https://doi.org/10.1016/j.marstruc.2017.07.006