Measurements of Emissions to Air from a Marine Engine Fueled by Methanol
https://doi.org/10.1007/s11804-020-00150-6
-
Abstract
Emissions of exhaust gases and particulate matter from a dual fuel marine engine using methanol as fuel with marine gasoil as pilot fuel have been examined for a ferry during operation. The emission factor for nitrogen oxides is lower than what is typically found for marine gasoil but does not reach the tier III limit. The emissions of particulate matter are significantly lower than for fuel oils and similar to what is found for LNG engines. The main part of the particles can be found in the ultrafine range with the peak being at around 18 nm. About 93% of the particles are evaporated and absorbed when using a thermodenuder, and thus a large majority of the particles are volatile. Methanol is a potential future marine fuel that will reduce emissions of air pollutants and can be made as a biofuel to meet emission targets for greenhouse gases.-
Keywords:
- Marine engine ·
- Methanol ·
- Shipping ·
- Marine fuels ·
- Emissions ·
- Nitrogen oxides ·
- Particulate matter
Article Highlights• Measured emissions from a ship using methanol as fuel are reported.• PM emission factor is low and NO x emissions decreased relative fuel oil. -
1 Introduction
Emissions of air pollutants from shipping have been the focus of a number of studies in recent years, and emission factors have been reported for engines using heavy fuel oil (HFO) and marine gasoil (MGO) (Winnes et al. 2016, Anderson et al. 2015, Bengtsson et al. 2014) as well as liquefied natural gas (LNG) (Anderson et al. 2015, Ushakov et al. 2019). As other fuels are put forward and being demonstrated in view of legislation for air pollutants (IMO 2018) and the need to reduce the emissions of greenhouse gases (GHG) (MEPC 2018), there is a need to characterize emissions when using these fuels in order to assess impact on health, environment and climate. The use of high sulphur HFO in combination with weak regulations led to a situation with high emissions of sulphur and nitrogen oxides as well as particulate matter leading to health risks and problems with, e.g. acidification and eutrophication (Andersson et al., 2016). In response to this, emission regulations have been imposed by the International Maritime Organization (IMO 2018). Thus, the maximum allowed sulphur content in marine fuels is 0.5% from 2020, and in Sulphur Emission Control Areas (SECA), it is 0.1% from 2015. These limits will reduce the emissions of SO2 but are also intended to reduce the emissions of particulate matter (PM) since there is a dependence of fuel sulphur content for the PM emission factors (Winnes and Fridell, 2009). The nitrogen oxides (NOx) emission limits are sharpened in a tiered system with tier III being applied in NOx emission control areas for new engines from 2016 (North American NECA) or 2021 (Baltic and North Seas). Further, the emissions of greenhouse gases from shipping are growing, and there is an urgent need for measures to break this trend. IMO has recently set a goal for greenhouse gas emissions from shipping to be reduced by 50% by 2050, compared with 2008 levels. IMO has also introduced the Energy Efficiency Design Index (EEDI) regulations in order to make new ships more fuel efficient. However, with an expected growth in maritime transport, further measures are called for.
The sulphur regulations can be met either by using low-sulphur fuel oils, such as MGO, or by using exhaust scrubbers, or by turning to other low-sulphur fuels such as LNG or methanol. To meet the tier III NOx requirements, abetment methods such as Selective Catalytic Reduction (SCR) can be used, but engines using LNG can reach tier III without exhaust abatement systems (Anderson et al., 2015).
Methanol as a marine fuel is potentially attractive for a number of reasons. It is a large commodity that is liquid at room temperature making it possible to use existing fuel infrastructure after modifications. The challenges with methanol include low flash point, corrosivity, low specific heat, but also toxicity and price in relation to fossil fuel oil (Yao et al., 2017). Most of the methanol available today is produced from natural gas, but it can also be produced from renewable resources which makes it an interesting option as energy carrier in the transition to non-fossil fuels. A lifecycle assessment of methanol as a marine fuel has been presented by Brynolf et al. (2014) showing climate and environmental impact in the same range as for LNG when the fuels are produced from the same primary energy carrier.
This paper reports in-stack emission measurements of exhaust from a dual fuel diesel engine converted to run on methanol with MGO as pilot fuel on the 241 m long, 10 670 dwt and 51 837 GT RoPax ship Stena Germanica, originally built in 2001. The ship was rebuilt and has been in traffic between Gothenburg, Sweden and Kiel, Germany since 2010. The engines are converted to be able to use methanol as the main fuel in a dual fuel arrangement. The conversion of the four medium-speed Wärtsilä diesel engines (model 8ZAL40S), each at 6 MW rated power, to dual fuel operation took place during 2014–1017. The conversion includes new high-pressure common rails for the engines and high-pressure fuel tank/supply systems. The measurements were conducted during a journey from Gothenburg to Kiel on the exhaust of main engine No 2.
The exhaust measurements performed included gaseous components as well as particulate matter including number and size distribution. The purpose is to provide data for the environmental assessment of methanol as a marine fuel.
2 Methods and Emission Measurements
The measurements were performed onboard at three different engine loads during 80%, 50% and 25% loads, i.e. 4800 kW, 3000 kW and 1500 kW. A load of 80% means that the engine is running on cruising load. Due to factors like wind and waves, other ships, etc. the load can be varying between 85% and 75%. It was not possible to perform measurements at all load points in the E2 test cycle. The engine power and fuel flow were taken from the ship's instrumentation. The exhaust flow was calculated using the carbon balance method (IMO 2009).
Three sampling holes close to the engine (6 m) were used for extraction of exhaust. The first one was used for gaseous species, the second one for sampling of aldehydes and to the third a dilution system with a heated sampling line was connected and used for particulate matter instruments. An overview of the instrument setup can be found in Figure 1.
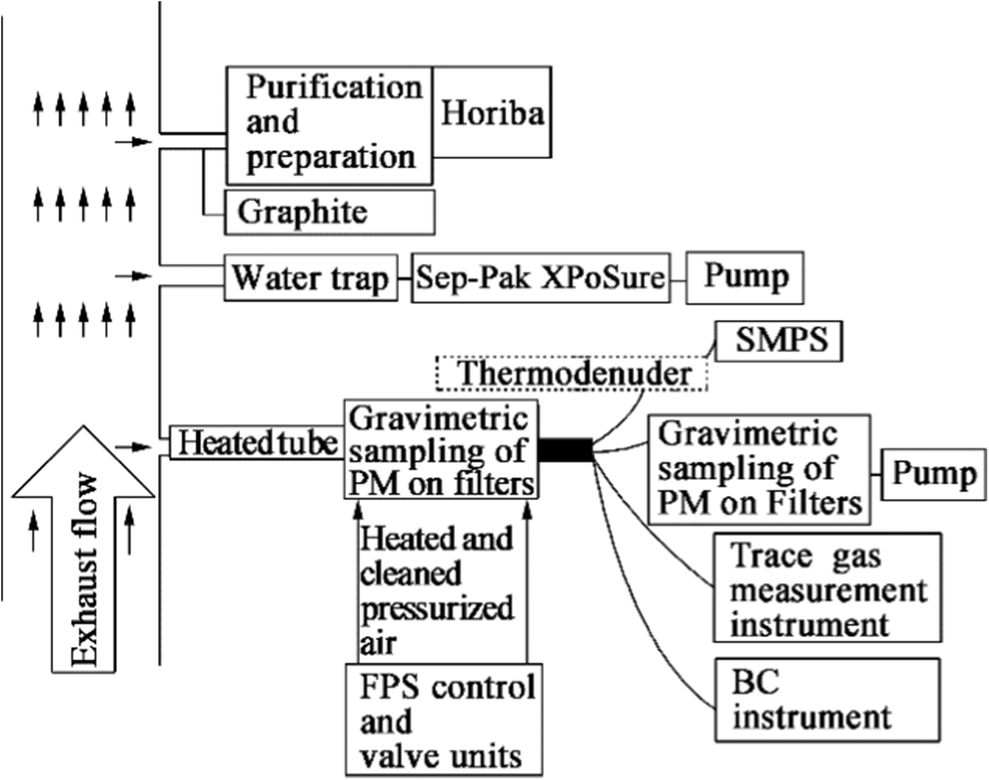 Figure 1 Schematic view of the instrument setup
Continuous measurements were made of carbon mono- and dioxide (CO and CO2) (Horiba 350E, non-dispersive infrared (NDIR)), sulphur dioxide (SO2) (Horiba 350E, NDIR), nitrogen oxides (NOx) (Horiba 350E, chemiluminescence), oxygen (O2) (Horiba 350E paramagnetic), as well as total hydrocarbons (THC), non-methane hydrocarbons (NMHC) and methane (CH4) (Graphite 52 M-D instrument, flame ionization detector (FID) technique). The raw gas was sampled through a heated Teflon tube (190 ℃) via a ceramic filter and a preparation unit (Ankersmid APS303) that lowers the dewpoint to 4 ℃ and removes particles by filtration. The gas analysers were calibrated, interference checked, zero and span checked and operated as per the NOx technical code (IMO 2009). Zero and span gases were used before and after sampling on board.
Since the concentration of particles and water in the exhaust is normally too high for particle counters, the exhaust was diluted with ambient air with a dilution factor between 10 and 77 depending on the particle concentration in the raw exhaust gas. This dilution was done using a Dekati FPS-4000 system. The fine particle sampler (FPS) dilutes and conditions the exhausts for the measurement instruments. A raw sample was extracted from the exhaust by using a heated (180 ℃) stainless steel probe. The sample was subsequently diluted in two stages employing a perforated tube and ejector dilution, respectively (Dekati 2010).
To quantify the dilution factor, the CO2 (Licor 840-a) and NOx (Thermo Scientific 42i) concentrations were measured after the dilution. The calculated dilution factor during the measurements varied between 23 and 27 at 80% engine load, stayed steady on 35 at 50% engine load and varied between 71 and 77 at 25% engine load. In order to calculate the aerosol concentration, the dilution mean value for each load was used. The main reason for the observed variation between the engine loads and within an engine load is the different air pressure delivered to the dilution system and that the exhaust flow varies between the loads.
To characterize the particle number and size distribution, a Scanning Mobility Particle Sizer (SMPS) (TSI 3938) was used. The SMPS system consists of an electrostatic classifier (DMA) combined with a condensation particle counter (CPC) where the DMA sizes and the CPC counts the particles ranging from 9 to 340 nm.
A thermodenuder (TD) (Dekati ELA 423) was used in combination with the SMPS during parts of the measurements in order to probe the solid fraction of the particles. The thermodenuder is designed to remove volatile organic compounds (VOC) from the sample particle stream. The sample is first heated up to 250 ℃ to evaporate the hydrocarbons. After heating, the sample is lead through an absorber where the hydrocarbons are adsorbed on an activated charcoal denuder. The values for number of particles when using the thermodenuder are compensated due to particle losses within the thermodenuder following manufacturer instructions.
Soot as black and brown carbons was measured with an Aethalometer (AE33). Total suspended particle mass was sampled on preconditioned Teflon filters (Mitex) which are weighted in the laboratory at IVL.
Aldehydes were sampled on a Sep-Pak XPoSure Aldehyde Sampler directly from the exhaust flow. Two samplers were used in a row, one main and one backup sampler. The first one sampled the main amount of aldehydes and the second the slip of aldehydes. Aldehydes thus react with acidified 2, 4-dinitrophenylhydrazine (DNPH) forming stable derivatives. The derivatives were analysed in a high-performance liquid chromatography instrument (HPLC).
The engine exhaust flow was measured with a pitot tube and the pressure difference monitored with a Schiltknecht Manoair 100. The flow was between 21 000 and 41 000 m3/h depending on engine load.
The methanol fuel was analysed by an accredited lab (Exova, Linköping Sweden). Some data can be found in Table 1.
Table 1 Characteristics of the methanol fuelWater content (mg/kg) 220 Density at 15 ℃ (kg/m3) 795.8 Lower heating value (MJ/kg) 19.76 Kinematic viscosity at 20 ℃ (mm2/s) 0.752 Hydrogen content (mass-%) 12.4 The uncertainties for particle number are the 95% confidence interval from the fluctuations in the signal during stable conditions. The uncertainties for gas concentrations are 95% confidence interval as given in the documentation for the accreditation of the analysis methods. For black and brown carbon, the uncertainty is taken from Zanatta et al. (2016).
3 Results
The resulting specific emissions per engine work (kWh) to the atmosphere are summarized in Table 2. The measured emissions of THC and NMHC both were 1.6 g/kWh which is somewhat higher than what has been reported as emission factors (about 0.2 g/kWh) when using fuel oil in a medium speed engine (Cooper and Gustafsson, 2004). This is also the case for the emissions of CH4 that was found to be 0.020 g/kWh in this study and 0.004 for fuel oil (Cooper and Gustafsson, 2004). However, the CH4 emission factor found here is low when comparing with the 6.9 g/kWh reported for dual fuel LNG engines of similar type (Stenersen and Thonstad, 2017). Emissions of aldehydes are a concern for alcohol fuels, but the emission factor measured here, 4.9 × 10⁻⁴ g/kWh, is well below the US HD limit of 0.013 g/kWh (Delphi 2016). The engine out NOx emission factors cannot be directly compared with the IMO tier limits since sampling was not done at all load points. For this engine (at 500 r/min), the tier II and tier III limits are 10.5 and 2.6 g/kWh, respectively. Thus, after treatment would be required to reach tier III. The ship is equipped with SCR, and according to the ship, the resulting NOx emissions after treatment are around 0.53 g/kWh (not measured in this campaign).
Table 2 Measured emissions to air for three engine loadsEngine load (%) Brake power during test (kW) Methanol specific fuel consumption (g/kWh) Fuel oil specific fuel consumption (g/kWh) Exhaust gas flow (Nm3/h) CO2 (g/kWh) O2 (g/kWh) CO (g/kWh) THC (g/kWh) 80 4800 441 30 33 000 695 (35) 1113 (100) 3.7 (0.5) 1.6 (0.5) 50 3000 565 37 27 000 884 (44) 1628 (147) 5.2 (0.8) 2.1 (0.6) 25 1500 620 67 16 000 1059 (53) 1902 (171) 6.6 (1.0) – CH4 (g/kWh) NMHC (g/kWh) NOx
(corr) (g/kWh)Filter TSP (g/kWh) Black Carbon Brown Carbon Formaldehyde EFPN (1015 # kg−1fuel) EFPN (1013 #kg−1 fuel) with thermodenuder 0.020 (0.006) 1.6 (0.5) 6.5 (1.0) 0.093 (0.026) 0.016 (0.006) 0.016 (0.006) 0.00049 (0.002) 1.61 (0.09) 2.85 (0.35) 0.024 (0.007) 2.1 (0.6) 9.0 (1.3) – 0.018 (0.006) 0.016 (0.006) – 2.46 (0.36) – – – 12.3 (1.8) – 0.033 (0.01) 0.030 (0.01) – 2.58 (0.13) – Uncertainties represent 2 s.d. in brackets; − indicates that no data are available The PM emission as mass (TSP) of particles measured here of around 0.1 g/kWh is lower than what is normally reported when using MGO as fuel although there is a significant range in results reported in the literature, from 0.1 to 0.4 g/kWh (Winnes et al., 2016). The BC represents about 17% of the PM mass in the data reported here. The BC emissions are also lower than what is expected from MGO (Fridell and Salo, 2016). The number of particles (9–340 nm) emitted per kWh varied between 1.61 and 2.58 × 10¹⁵ #/kWh depending on load. This number of particles emitted per kWh is lower than what is commonly found for engines using MGO or HFO reported in Winnes et al. (2016) or in an extended literature review by Anderson et al. (2015), comparing different diesel fuels complying with SECA, which reported particle number emissions ranging from 1015 to 1016 #/kWh. In the same way, the emissions reported in this study are higher than what is reported for LNG engines (2.3 × 10¹²–5.7 × 10¹² #/kWh) (Anderson et al., 2015). The data can also be compared with what is reported after scrubbers, since this is one alternative method to comply with the sulphur regulations. Fridell and Salo (2016) reported around 8 × 10¹⁴ #/gWh of particles between 5–560 nm. The number of non-volatile particles measured in this study using the thermodenuder at 80% engine load was 2.85 × 10¹³ #/kWh (Table 2). This is somewhat lower than what Fridell and Salo (2016) found after a sea water scrubber (7 × 10¹⁴ #/kWh).
Figure 2 a and b show the size distribution of the emitted particle concentration as measured with the SMPS for different engine loads. The main part of the particles is found in the ultrafine range with the peak being at around 18 nm, which is smaller than what is earlier reported for marine fuel oils (Zetterdahl et al., 2017). In Figure 2b, the effect of using the thermodenuder is shown, and as can be seen, about 93% of the particles are evaporated and absorbed in the thermodenuder, and thus a large majority of the particles are volatile.
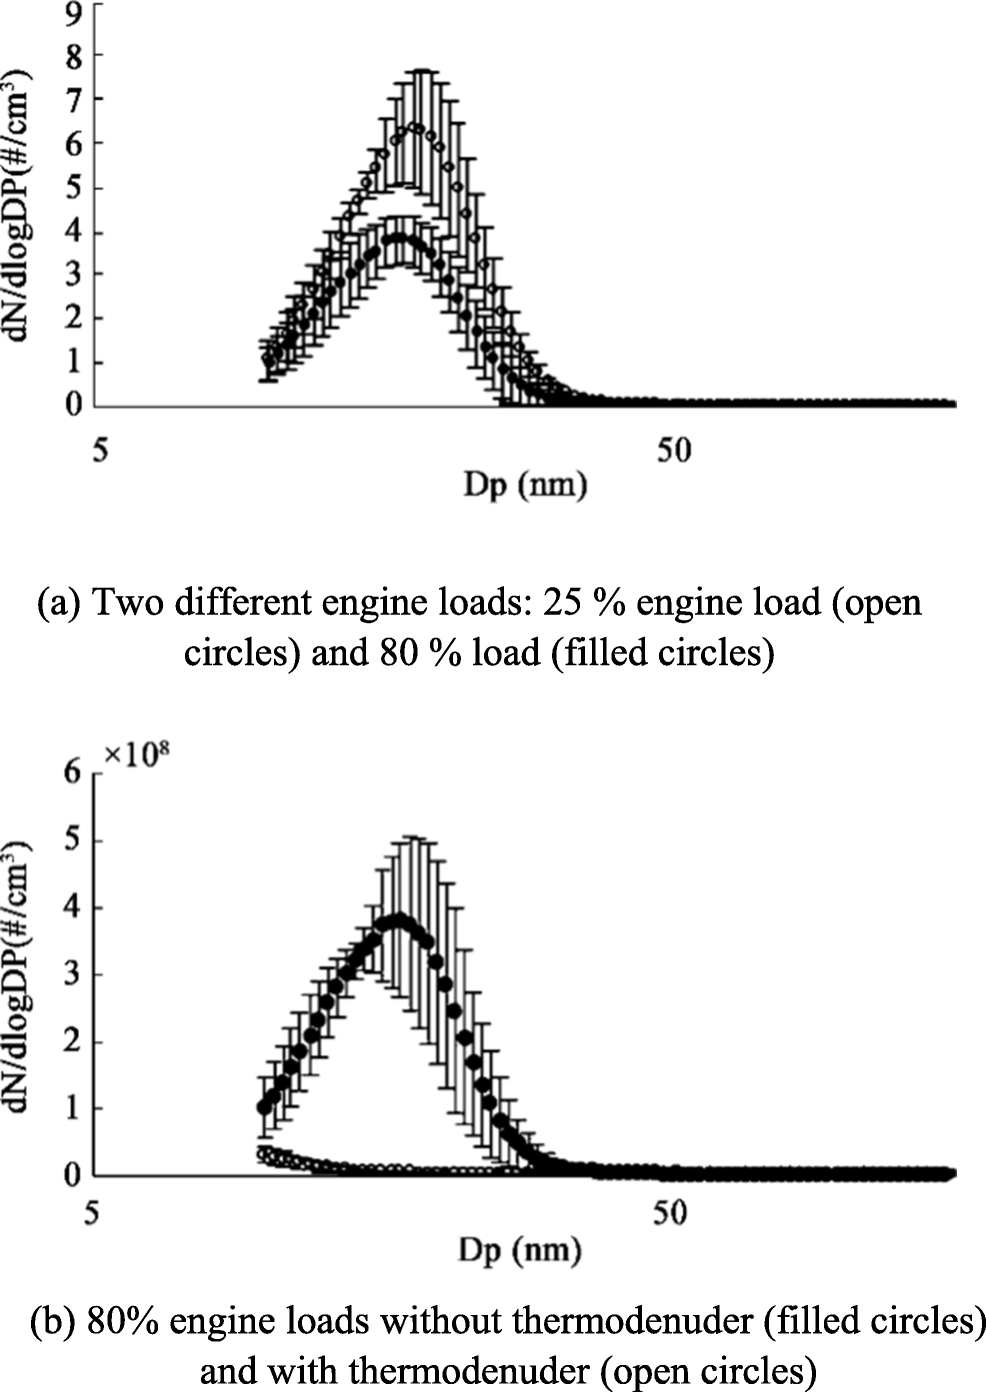 Figure 2 Particle size distributions
4 Discussion
The studied ship clearly complies with the SECA regulations since the methanol contains little sulphur and the gasoil used is also compliant. It is thus a feasible alternative both to MGO and to the use of HFO in combination with SO2-scrubbers. One important background to the sulphur regulations for international shipping is to reduce the emissions of PM and thus limit the associated health risks. The lower emission factor for PM using methanol than when using MGO shows that if methanol would be a dominant fuel, the contribution from shipping to PM-air quality problems would be lowered. As there are no direct regulation for PM emissions for international shipping, the use of fuels such as LNG and methanol is a possible route towards lowering the contribution from shipping to air quality problems regarding PM. The measurements performed with the thermodenuder clearly show that most of the formed particles are volatile. This is somewhat expected since soot formation is connected to the presence of carbon–carbon bonds in the fuel. The low amount of soot found in the particles also supports this. Thus, the use of methanol may be a way to reduce the emissions of BC from shipping. This is an emission where there have been discussions on regulation also for international shipping due to the impact on climate and health risks (Brewer 2019). When it comes to non-volatile particles, the number emissions presented here were measured in the size range 9–340 nm using an SMPS system in combination with thermodenuder and for 80% engine load. As stated by Lehtoranta et al. (2019), it is important to consider the size range when comparing with results in earlier publications using other size ranges and methods. In upcoming regional regulations for inland waterways for particle number emissions in the EU, it is only the number of non-volatile particle larger than 23 nm that is regulated (EU 2016).
When it comes to NOx, the present ship engine without after treatment would not comply with tier III as is demanded for new engines in the North American NECA from 2016 and in the North and Baltic Seas NECAs from 2021. Since this is one of the first demonstrations of marine engines using methanol, it is possible that the NOx emissions can be lowered by optimizing fuel injection strategies and other engine parameters. However, to reach tier III, it would be necessary to also use additional abatement methods, and as this ship has demonstrated, it is feasible through using SCR.
For organic compounds, no emission limits are set by IMO for marine engines. The measurements here show some emissions of hydrocarbons, among those formaldehyde, that may contribute to the formation of secondary particles in the atmosphere (Rodriguez et al., 2017). Further studies would be needed to establish this contribution.
The IMO has set out a roadmap to reduce the emissions of greenhouse gases by 50% by 2050 compared with 2008 emissions and to phase out fossil fuel by the end of the century (MEPC 2018). Most methanol used today are produced from fossil gas, and thus a switch to methanol would not contribute to reaching these objectives. However, methanol is also produced from biogenic feedstocks such as willow or forest residues (Brynolf et al. 2014) or electrofuels (Brynolf et al. 2018), and since both the fuel supply and the power trains exist, bio-methanol may be a fuel contributing to reducing the use of fossil fuels in shipping if there is enough supply to a reasonable price.
For LNG, the emissions of CO2 are lower than for marine fuel oils, but the rather high slip of methane observed makes the total GHG emissions (as CO2 equivalents) similar as in the fuel oil case (Stenersen and Thonstad 2017). The present data for the methanol engine shows that the methane slip contributes less than 0.01% to the CO2 equivalents (in a 100-year perspective), the rest coming from CO2.
Brynolf et al. (2014) found in a life-cycle analysis of methanol as a marine fuel that the energy intensity and global warming potential are somewhat higher compared with LNG and HFO. The emissions of particulate matter and the effect on eutrophication, ozone formation and acidification were found to be significantly lower than for HFO but higher than for LNG. In that study, the emission factors for the methanol fueled ships were uncertain. The emission factor for NOx (0.28 g/MJ corresponding to 2.5 g/kWh) was taken from engine bench studies, and the emission factor for PM (4.3 mg/MJ corresponding to 38 mg/kWh) was set to the same as for LNG. The emission factor for NOx reported here (about 6.5 g/kWh at cruising speed) is thus significantly higher than the one used by Brynolf et al. (2014) meaning that the contribution to eutrophication and acidification would be higher unless the NOx is abated. Also, for PM, the value reported here is higher. For both cases, the emissions are still significantly lower than what is expected with fuel oil. The total energy intensity for methanol as a marine fuel was not investigated in this study.
This study is a first presentation of emission factors from a marine methanol dual fuel engine showing promise in many aspects. Further, the engine is a modified marine engine, and there is a strong potential for further development, e.g. to reduce the emissions of NOx and organic compounds further as has been seen in the development of LNG engines (Stenersen and Thonstad, 2017). The use of methanol produced from fossil gas is one step towards decreased impact on air quality from shipping; the transition to bio-methanol would mean also a step towards fossil-free shipping. To get there, policy measures need to be in place to make bio-methanol have a price that is competitive to the price of fossil fuels.
5 Conclusions
Emissions of exhaust gases and particulate matter from a dual fuel marine engine using methanol as fuel with marine gasoil as pilot fuel have been examined. The emission factor for NOx is between 12.3 and 6.5 g/kWh which is lower than what is typically found for MGO but does not reach the tier III limit. The emissions of particulate matter were found to be 0.1 g/kWh and between 1.6 and 2.6 × 10¹⁵ #/kWh with the main part of the particles in the ultrafine range. This is lower than what is found for fuel oils and similar to what is found for LNG engines. From an emissions point of view, methanol gives in general lower values than when using traditional marine fuel oils, but after treatment is needed to reach low NOx emissions.
-
Figure 1 Schematic view of the instrument setup
Figure 2 Particle size distributions
Table 1 Characteristics of the methanol fuel
Water content (mg/kg) 220 Density at 15 ℃ (kg/m3) 795.8 Lower heating value (MJ/kg) 19.76 Kinematic viscosity at 20 ℃ (mm2/s) 0.752 Hydrogen content (mass-%) 12.4 Table 2 Measured emissions to air for three engine loads
Engine load (%) Brake power during test (kW) Methanol specific fuel consumption (g/kWh) Fuel oil specific fuel consumption (g/kWh) Exhaust gas flow (Nm3/h) CO2 (g/kWh) O2 (g/kWh) CO (g/kWh) THC (g/kWh) 80 4800 441 30 33 000 695 (35) 1113 (100) 3.7 (0.5) 1.6 (0.5) 50 3000 565 37 27 000 884 (44) 1628 (147) 5.2 (0.8) 2.1 (0.6) 25 1500 620 67 16 000 1059 (53) 1902 (171) 6.6 (1.0) – CH4 (g/kWh) NMHC (g/kWh) NOx
(corr) (g/kWh)Filter TSP (g/kWh) Black Carbon Brown Carbon Formaldehyde EFPN (1015 # kg−1fuel) EFPN (1013 #kg−1 fuel) with thermodenuder 0.020 (0.006) 1.6 (0.5) 6.5 (1.0) 0.093 (0.026) 0.016 (0.006) 0.016 (0.006) 0.00049 (0.002) 1.61 (0.09) 2.85 (0.35) 0.024 (0.007) 2.1 (0.6) 9.0 (1.3) – 0.018 (0.006) 0.016 (0.006) – 2.46 (0.36) – – – 12.3 (1.8) – 0.033 (0.01) 0.030 (0.01) – 2.58 (0.13) – Uncertainties represent 2 s.d. in brackets; − indicates that no data are available -
Anderson M, Salo K, Fridell E (2015) Particle- and gaseous emissions from an LNG powered ship. Environ Sci Technol 49(20): 12568–12575. https://doi.org/10.1021/acs.est.5b02678 Andersson K, Lindgren F, Brynolf S, Wilewska-Bien M (2016) Shipping and the environment. Springer, Berlin Bengtsson S, Magnusson M, Fridell E, Andersson K (2014) Review of the possibilities to comply with the coming ECA regulations through the use of abatement technologies or change of fuels. Transportation Research D 28: 6 https://doi.org/10.1016/j.trd.2013.12.001 Brewer TL (2019) Black carbon emissions and regulatory policies in transportation. Energy Policy 129: 1047–1055 https://doi.org/10.1016/j.enpol.2019.02.073 Brynolf S, Fridell E, Andersson K (2014) Environmental assessment of marine fuels: LNG, LBG, methanol and bio-methanol. J Clean Prod 74: 86–95 https://doi.org/10.1016/j.jclepro.2014.03.052 Brynolf S, Taljegård M, Grahn M, Hansson J (2018) Electrofuels for the transport sector: a review of production costs. Renew Sust Energ Rev 81: 1887–1905 https://doi.org/10.1016/j.rser.2017.05.288 Cooper D, Gustafsson T (2004) Methodology for calculating emissions from ships: 1. Update of emission factors. Available at https://www.diva-portal.org/smash/get/diva2:1117198/FULLTEXT01.pdf Dekati (2010) Dekati FPS-4000, Fine Particle Sampler. https://www.dekati.com/products/Aerosol%20Sample%20Conditioning/Dekati%C2%AE%20FPS Delphi (2016) Worldwide emissions standards; heavy duty and off-highway vehicles. https://www.delphi.com/sites/default/files/inline-files/booklet%20emission%20heavy%20duty.pdf EU (2016) Regulation (EU) 2016/1628 of the European parliament and of the Council on requirements relating to gaseous and particulate pollutant emission limits and type-approval for internal combustion engines for non-road mobile machinery Fridell E, Salo K (2016) Measurements of abatement of particles and exhaust gases in a marine gas scrubber. Proceedings of the Institution of Mechanical Engineers, Part M: Journal of Engineering for the Maritime Environment 230: 154 https://doi.org/10.1177/1475090214543716 IMO (2009). Revised Marpol Annex VI and NOx Technical Code 2008: Regulations for the Prevention of Air Pollution from Ships IMO (2018). Energy efficiency measures. http://www.imo.org/en/OurWork/Environment/PollutionPrevention/AirPollution/Pages/Technical-and-Operational-Measures.aspx Lehtoranta K, Aakko-Saksa P, Murtonen T, Vesala H, Ntiachristos L, Rönkkö T, Karjalainen P, Kuittinen N, Timonen H (2019) Particulate mass and nonvolatile particle number emissions from marine engines using low-sulfur fuels, natural gas, or scrubbers. Environ Sci Technol 53: 3315–3322 https://doi.org/10.1021/acs.est.8b05555 MEPC (2018). Resolution MEPC304(72). Available at http://www.imo.org/en/OurWork/Environment/PollutionPrevention/AirPollution/Pages/GHG-Emissions.aspx Rodriguez AA, de Loera A, Powelson MH, Galloway MM, De Haan DO (2017) Formaldehyde and acetaldehyde increase aqueous-phase production of imidazoles in methylglyoxal/amine mixtures: quantifying a secondary organic aerosol formation mechanism. Environmental Science & Technology Letters 4: 234–239 Stenersen D, Thonstad O (2017) GHG and NOX emissions from gas fuelled engines. SINTEF report OC2017 F-108 Ushakov S, Stenersen D, Einang EM (2019) Methane slip from gas fuelled ships: a comprehensive summary based on measurement data. J Marine Science and Technnology 24: 1308–1325 https://doi.org/10.1007/s00773-018-00622-z Winnes H, Fridell E (2009) Particle emissions from ships: dependence on fuel type. J Air Waste Manage Assoc 59: 1391–1398 https://doi.org/10.3155/1047-3289.59.12.1391 Winnes H, Moldanova J, Anderson M, Fridell E (2016) On-board measurements of particle emissions from marine engines using fuels with different sulphur content. Proc IMechE Part M: J Engineering for the Maritime Environment 230(1): 45–54 Yao C, Pan W, Yao A (2017) Methanol fumigation in compression-ignition engines: a critical review of recent academic and technological developments. Fuel 209: 713–732 https://doi.org/10.1016/j.fuel.2017.08.038 Zanatta M, Gysel M, Bukowiecki N, Müller T, Weingartner E, Areskoug H, Fiebig M, Yttri KE, Mihalopoulos N, Kouvarakis GN, Beddows D, Harrison RM, Cavalli F, Putaud JP, Spindler G, Wiedensohler A, Alastuey A, Pandolfi M, Sellegri K, Swietlicki E, Jaffrezo JL, Baltensperger U, Laj P (2016) A European aerosol phenomenology- 5: climatology of black carbon optical properties at 9 regional background sites across Europe. Atmos Environ 145: 46–364 Zetterdahl M, Salo K, Fridell E, Sjöblom J (2017) Impact of aromatic concentration in marine fuels on particle emissions. J Mar Sci Appl 16: 352–361 https://doi.org/10.1007/s11804-017-1417-7