Temporal Evolution of Scour at Submerged Circular Cylinders
https://doi.org/10.1007/s11804-021-00193-3
-
Abstract
Temporal evolutions of scour at submerged circular cylinders were investigated. Flow visualization was carried out around the cylinders over plane, under developed and equilibrium scour holes. Video analysis technique was used to formulate the equations for determining the diameter of the horseshoe vortex around the submerged cylinders, which is also verified from the vector diagrams drawn using the velocity measurements. The scour process similar to live bed scour was noticed around the downstream cylinder. The diameter of the horseshoe vortex is found to depend on the diameter of respective cylinder, submergence ratio, spacing between the cylinders and skew angle. This formulation along with the dislodgement and transportation of a single sediment particle is further incorporated in the proposed model for determining the time variation of scour around the submerged cylinders. It is evident from the results that the upstream cylinder shelters the downstream cylinder and thereby reduces the scour at the downstream cylinder. Proposed model is further extended to incorporate the effect of non-uniformity of the sediment particles on the time variation of scour depth. The results indicate significant reduction of scour depth of around 6% and 35% for upstream and downstream cylinders respectively due to the formation of the armor layer. The model is also compared with the local scour component of field data around cylindrical bridge piers to establish the differences in the scour process around a partially submerged cylinder and fully submerged tandem and skewed cylinders.-
Keywords:
- Scour ·
- Tandem ·
- Skewed ·
- Submerged cylinder ·
- Sediment ·
- Time variation
Article Highlights• The proposed model results match well with the field data as it reaches equilibrium stage.• Time variation of scour around fully submerged tandem and skewed cylinders were investigated;• Video analysis technique was used to formulate the equations for determining the diameter of the horseshoe vortex around the submerged cylinders; -
1 Introduction
Scour is a natural process caused by the erosive action of flow on the sediment bed around the hydraulic structures. The scour around the fully submerged structures (pipelines, vanes, fish habitat structures, supports of marine structures) is a topic of continued interest for the researchers due to its requirement for the design of the foundations of these structures. The structures like under construction bridge pier foundations, river restoration structures, and offshore platforms behave as fully submerged structures and induce heavy scour during high floods and cyclones, which even undermine the foundations of these structures. The process of scour depends grossly on the duration of flow. A continuous scour process will ultimately excavate the sediment bed from its base resulting in the undermining of the foundations and their failure. Fortunately, within a predictable period of time and under a steady condition, equilibrium can be achieved between the erosive and the restrictive forces around these structures. Interestingly enough, the concept of equilibrium is controversial exclusively regarding the time taken to achieve it. Thus, the study of temporal variation of scour around these structures gathered its due importance for the secure, efficient, and inexpensive designing for the stability of these structures.
Numerous studies were carried out for the investigations of scour around fully submerged structures of different shape and sizes such as, hemisphere (Albers 1997; Shamloo et al. 2001), sphere (Truelsen et al. 2005; Dixen et al. 2013) pipelines (Azamathulla et al. 2011; Azamathulla et al. 2014; Yusoff et al. 2016) submerged weirs (Abad et al. 2008), submerged vanes (Tan et al. 2005; Tajari et al. 2020), and submerged vertical cylinders (Dey et al. 2008; Sadeque et al. 2008; Zhao et al. 2010; Sarkar 2014; Bauri and Sarkar 2016). The researchers have reported that the basic mechanism of local scour is due to a system of vortices developed around the submerged structures. The flow and scour investigations around simple hemispherical fish habitat structures under shallow submergence provided evidence of the existence of the different regimes of flow, which depend on the relative submergence ratio of the submerged body, and for all these cases, equilibrium scour depth was achieved in front of the submerged body (Albers 1997; Shamloo et al. 2001). However, the deflected flow around the hemispheres was reported for different flow regimes.
The flow and sediment transport around a submerged vane experimentally investigated by Tan et al. (2005). They reported that the diversion of sediments depends on the dimensions and alignment of the submerged vanes with the flow. Furthermore, in a recent study, Tajari et al. (2020) used submerged vanes to control the movement of sediments toward the upstream of weirs. The prediction of equilibrium scour depth around submerged pipeline using a soft computing approach was studied by Azamathulla et al. (2014). The model predicts relatively accurate scour depth than the regression equation of scour depth around submerged pipeline. Furthermore, the temporal evolutions of scour around submerged pipelines with different skew angles were carried out by Azamathulla et al. (2014) and Azamathulla et al. (2011). They found that the flow depth is a principal parameter for the process of scour around the submerged pipelines. However, the sediment sizes and diameter of pipes were not varied. The time variations of scour around submerged sphere under steady currents were studied by Truelsen et al. (2005). The study revealed that time variations of scour depth depend on the Shields parameter. Furthermore, the temporal evolutions of scour depth around half-buried sphere exposed to steady currents were investigated experimentally and numerically by Dixen et al. (2013). An inversely proportional relationship between scour depth and time scale with the incorporation of turbulence parameter was reported.
The scour around fully submerged cylinder under steady flow experimentally investigated by Dey et al. (2008) and introduced submergence factor to derive the scour depth for submerged condition from the results of non-submerged condition. The submerged cylinders suppress the alternate vortex shedding (Sadeque et al. 2008) and generate a strong three-dimensional downstream wake, which results in very high bed shear stress at the lateral face of the submerged cylinder. However, time evolutions of scour depth around the submerged cylinder were not considered in the study. The experimental and numerical investigations on temporal evolutions of scour depth around submerged vertical circular cylinder were carried out by Zhao et al. (2010). It was reported that height of cylinder plays an important role with the scour depth around the submerged cylinder. The rate of scour depth decreases with the decrease of cylinder height due to formation of weak horseshoe vortex and vortex shedding. The investigations were observed without varying the sediment sizes. The experiments were carried out to investigate the scour with uniform and non-uniform sediment beds around fully submerged circular and square shaped cylinders (Sarkar 2014). The temporal evolutions of scour depth were scaled by an exponential law which decreases with increase of densimetric Froude number and the scour depth was reduced significantly for non-uniform sediments compared with uniform sediments. However, the information regarding bed shear stress and scour prone zones was not reported.
It is noteworthy that the majority of these studies were carried out with a single submerged structure, and hence, there is a dearth of information regarding the temporal evolution of scour around tandem and skewed submerged vertical circular cylinders. The scour and its temporal variations were extensively investigated around tandem and skewed cylinders on partially submerged conditions in the past. Few researchers studied the flow and scour around pile groups in shallow water flow (Salim and Jones 1996; Amini et al. 2012), two in-line bridge piers under high flood conditions (Narayana et al. 2020). Furthermore, several researchers also reported that the upstream cylinder can be used as a scour protection device for the downstream cylinder (Melville and Hadfield 1999; Chiew and Lim 2003; Haque et al. 2007; Khaple et al. 2017; Rout and Sarkar 2019). The efficiency of this countermeasure depends on the cylinder and flow characteristics. In a recent study, Pandey et al. (2020) used different diameter collars to reduce the temporal evolution of scour around piers at different elevations. It was reported that the temporal evolution of scour depth increases with increasing collar elevations.
A semi-empirical method was developed based on sediment continuity equation to express scour depth as a function of time around a single cylindrical bridge pier in clear water conditions over uniform sediment bed (Yanmaz and Altinbilek 1991). Non-dimensional scour prediction curves were proposed for the expected flood duration. Also considering the fact that the prototypical sediment bed is always non-uniform or stratified, an expression was developed for primary vortex, incorporating the movement of a single sediment particle to predict the temporal variation of scour depth for steady flow (Kothyari et al. 1992b). Later on, the method was also modified and applied for the prediction of temporal variation of scour during unsteady flow with non-uniform sediments. For non-uniform sediments, the sediment size was replaced with an effective sediment size. However, this consideration of effective sediment size for non-uniform sediment was contradicted with the plea of significant over prediction of the equilibrium scour depth (Pournazeri et al. 2014). They proposed a morphodynamic model to predict equilibrium pier scour depth with non-uniform sediments taking into account the selective transport and hiding factor of different particle sizes.
Using the equation, Kothyari et al. (1992b) and Mia and Nago (2003) later modified the bed load sediment transport formula (Yalin 1977) to incorporate the time varied shear velocity at pier nose for computation of scour depth versus time at cylindrical bridge pier over uniform sediment bed. The scour process for live bed conditions was investigated and developed a model for predicting the temporal scour at live bed condition for steady flow over uniform sediment bed (Kothyari et al. 1992a). Similar investigations were carried out by many researchers (Shen et al. 1965; Muzzammil and Gangadharaiah 2003; Chang et al. 2004; Oliveto and Hager 2005; Unger and Hager 2007). However, a semi-empirical model was proposed to determine the variation of scour versus time at cylindrical piers for both uniform and non-uniform piers under steady and unsteady flow (Lu et al. 2011). For all feasible conditions of footing location of a compound pier with respect to bed level, a model to predict the temporal variation of scour was developed (Kothyari and Kumar 2012). They also compared the experimental data with the results (Melville and Raudkivi 1996; Lu et al. 2011).
Investigations were also carried out to determine the time variation of scour depth around partially submerged tandem bridge piers. Semi-empirical models were also developed to predict the time variation of clear water scour around tandem piers using sediment continuity approach and design charts were proposed for the estimation of dimensionless scour depth (Selamoglu 2015; Yilmaz et al. 2017). However, the model results were not verified with field scour data. The local scour around twin bridge piers were investigated experimentally in open channel flow conditions (Wang et al. 2016). Only the scour evolution characteristics were studied and compared with that around the single pier. Hence, to the best of the authors' knowledge, the time variation of scour around submerged tandem and skewed cylinders has not been reported. The field measurements on scour around bridge piers during floods were carried out by Lu et al. (2008) and observed that the total scour consists of three scour components: local, global, and general scour. The field measurements of scour depth were observed using a sliding magnetic collar, a steel rod, and a numbered brick column. Furthermore, a semi-empirical method was proposed to separate the local scour components under unsteady flow conditions and validated the scour around a bridge pier. However, in this context, it is important to mention that the novelty of the present study is not to report the effect of various parameters on the scour depth, rather to model the variation of scour versus time at submerged cylinders.
In view of inadequate available data and literature about scour characteristics and variation of scour versus time at tandem and skewed arrangement of circular cylinders, this study attempts to formulate a model for predicting the time variation of scour at fully submerged cylinders taking into account the spacing between the cylinders, skew angles, and the submergence ratio over uniform and non-uniform sediments. Analysis of the flow visualization videos at the submerged cylinders was carried out to formulate the equations for determining the vortex diameter, which is further, validated using velocity measurements with acoustic Doppler velocimeter (ADV). The results from the developed model are also compared with available field data for establishing the dissimilarities that exists with the temporal evolution of the scour hole around the partially submerged cylinders.
2 Experimentation
The experiments were performed in two parts: the first part of experiments include measuring of time variations of scour depth using uniform and non-uniform sediments around submerged tandem and skewed circular cylinders; second part of experiments consists of flow visualization using KMnO4 and instantaneous velocity measurement using ADV to find out the size of the horseshoe vortex and bed shear stress in the stabilized scour bed. The experiments were carried out in a recirculating flume of length 10 m, width 0.8 m, and height 0.8 m located in the Hydraulics and Water Resources Engineering Laboratory of the Indian Institute of Technology Bhubaneswar, India. A test section of length 2 m, height 0.15 m, and width 0.8 m was located at a distance of 5 m from the inlet of the flume. Drainage paths were provided at the bottom of the test section to release water from the scour hole. Sediment trap was prepared at the downstream of the test section to retain the transported sediments. The test section was filled with the sediment of relative density 2.65 to a depth of 0.15 m. Circular cylinders, made of Perspex, with diameters of 30–75 mm, were arranged in tandem and skewed configurations in the test section. The schematic representation of plan view of test section with the tandem and skewed circular cylinder configurations is shown in Figure 1. The cylinder sizes were kept within 10 % of the channel width in order to avoid wall effect on the scour during experiments (Chiew and Melville 1987). The smaller diameter cylinder was positioned at the upstream side of the configurations behaves as a scour reduction device for downstream cylinder. The upstream cylinders (D1) were placed with a spacing of 2.5 times the diameter of the bigger downstream cylinder (D2) to determine the interaction of the tandem cylinders with the flow field and scour of sediment bed. The spacing (L=2.5D2) between the cylinders was changed as the diameter of the downstream cylinder varies for different runs. However, the flow field investigations of Gao et al. (2014) around two unequal diameter of circular cylinders show maximum flow field interactions with the spacing ratio of L/D2= 2.4. Flow field experiments around two identical cylinders by Keshavarzi et al. (2017) also reported about the maximum flow field interactions with the spacing range of 2 ≤ L/D2 ≤ 3, as a result maximum scour depth can be expected around upstream cylinder. Furthermore, the scour depths were reported to be maximum for a spacing ratio of 2.5 (Keshavarzi et al. 2018).
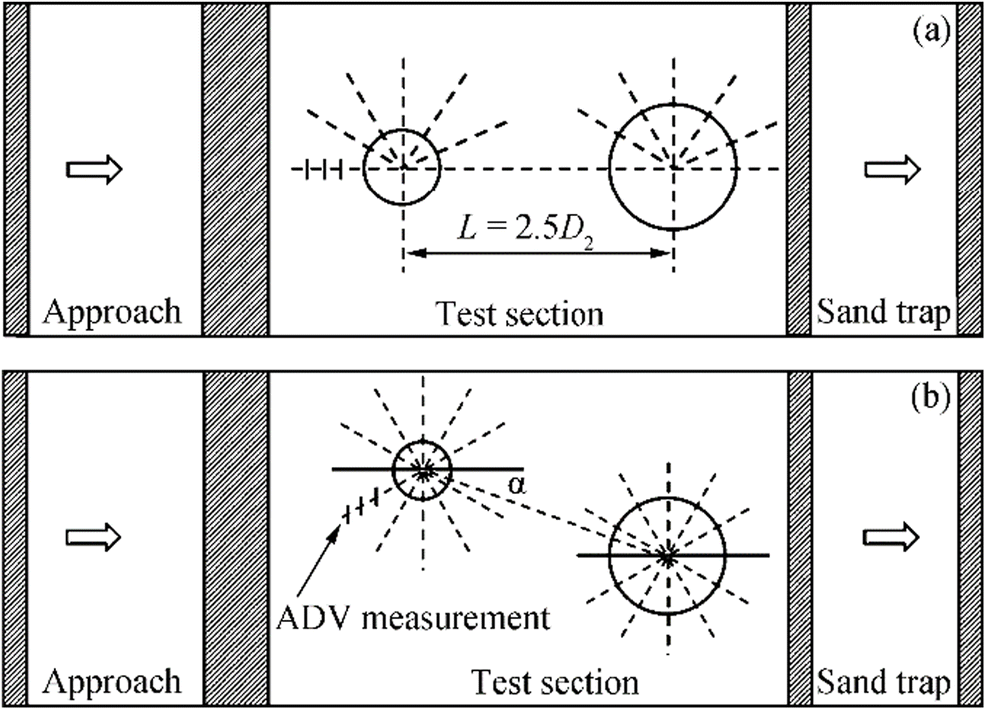 Figure 1 Schematic representation of the plan view for tandem (a) and skewed (b) cylinder with ADV measurement sections
Uniform and non-uniform non-cohesive sands having median size (d50) of 0.43–1.9 mm and geometric standard deviation (σg) of 1.2–2.3 were utilized for the experiments. The sieve analysis of the resulting mixture was carried out and the particle size distribution curves are presented in Figure 2. The critical shear velocity (u*c) of used sediments were 0.018 – 0.036 m/s. The values of u*/u*c for uniform and non-uniform sediment samples are 0.58–0.83 and 0.53–0.62 respectively (u*: flow shear velocity). Hence, clear water scour conditions were achieved during all the experiments as u*/u*c < 1. The flow at the entrance of the flume was allowed to pass a double layered perforated sheet to receive unidirectional undisturbed flow at the test section. An approach was also fabricated before the test section to further reduce the flow turbulence. The depth of water was regulated by the adjustable inbuilt tailgate at downstream end of the flume. The flow rate was measured by an electromagnetic flow meter (model: Process Master 300) with an accuracy of 0.2% of flow rate and least count of 0.01 L/s. The discharge into the flow meter was regulated by a gate valve fitted at the delivery pipe of the pump. Flow velocity (U) of 0.14–0.48 m/s, flow depth (d) of 0.19–0.26 m, and protruded height of the submerged cylinder (h= 0.10 m) into the flow were kept fixed during the experiments (Tables 1 and 2).The submergence ratio S (total flow depth to height of the submerged cylinders) was in the range of 1.9–2.6.
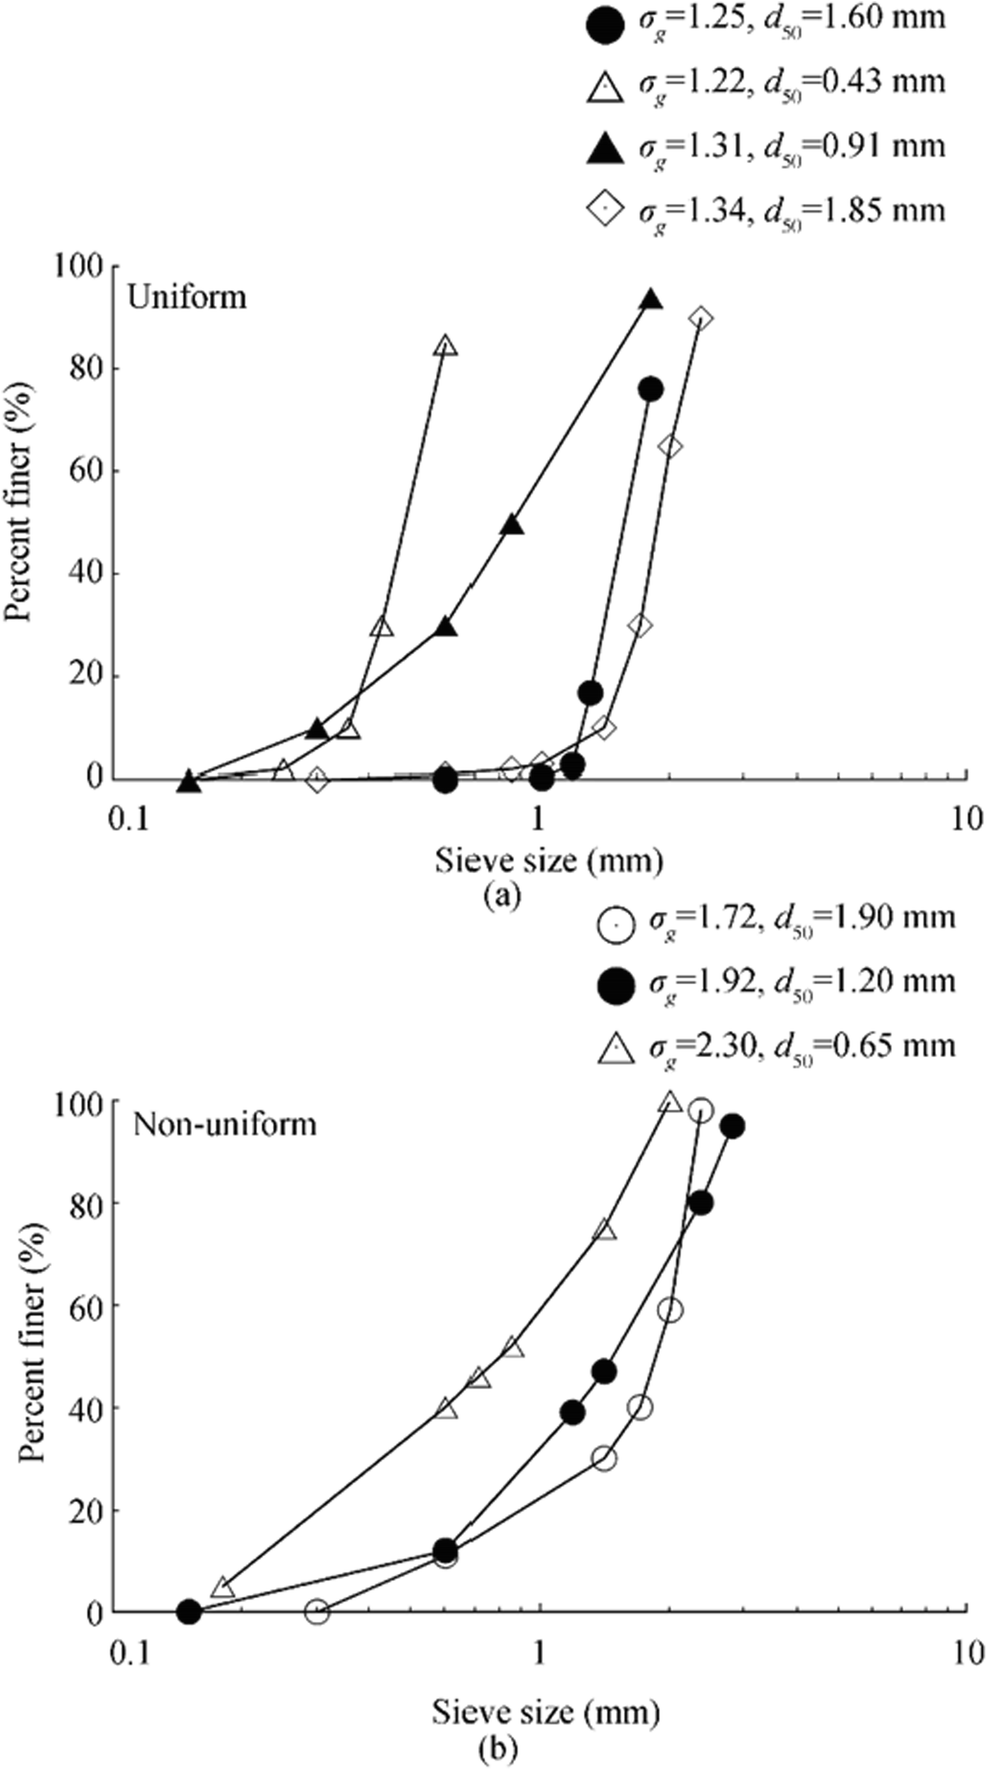 Figure 2 Uniform (a) and non-uniform (b) sediment grain size distribution curveTable 1 Experimental parameters for uniform sediments
No. D1
(mm)D2
(mm)σg d50
(mm)U
(m/s)d
(mm)Uc
(m/s)ds1
(mm)ds2
(mm)No. D1
(mm)D2
(mm)σg d50
(mm)U
(m/s)d
(mm)Uc
(m/s)ds1
(mm)ds2
(mm)α = 0 R1 50 50 1.2 1.6 0.36 225 0.50 51 46 R18 75 75 1.2 1.6 0.42 240 0.59 33 22 R2 75 75 1.2 1.6 0.42 220 0.58 53 38 R19 75 75 1.2 1.85 0.42 220 0.62 38 27 R3 30 30 1.2 1.6 0.42 240 0.59 52 33 R20 75 75 1.2 1.6 0.42 200 0.57 49 37 R4 30 30 1.2 0.91 0.36 220 0.45 38 32 R21 75 75 1.2 1.6 0.42 190 0.57 67 58 R5 30 30 1.2 1.6 0.42 190 0.57 73 62 R22 75 75 1.2 1.6 0.36 220 0.58 29 21 R6 30 30 1.2 1.6 0.48 220 0.58 71 53 R23 30 50 1.2 1.6 0.36 225 0.50 43 41 R7 30 30 1.2 1.6 0.42 220 0.58 62 44 R24 30 75 1.2 0.43 0.14 240 0.20 32 26 R8 30 30 1.2 1.6 0.36 220 0.58 38 32 R25 30 75 1.2 0.43 0.14 220 0.20 36 29 R9 30 30 1.2 1.6 0.36 260 0.59 22 17 R26 30 75 1.2 0.43 0.14 200 0.20 42 37 R10 30 75 1.2 1.6 0.42 260 0.59 42 38 R27 30 75 1.2 0.43 0.14 190 0.19 49 38 R11 30 75 1.2 1.6 0.42 240 0.59 51 42 R28 30 75 1.2 1.85 0.42 220 0.62 31 28 R12 30 75 1.2 1.6 0.42 220 0.58 54 48 R29 30 75 1.2 1.85 0.48 220 0.62 42 33 R13 30 75 1.2 1.6 0.42 200 0.57 58 52 R30 30 75 1.2 1.85 0.36 220 0.62 29 23 R14 30 75 1.2 1.6 0.42 190 0.57 68 64 R31 30 75 1.2 0.91 0.36 240 0.45 32 26 R15 30 75 1.2 1.6 0.42 220 0.58 52 43 R32 30 75 1.2 0.91 0.36 220 0.45 33 29 R16 30 75 1.2 1.6 0.48 220 0.58 68 66 R33 30 75 1.2 0.91 0.36 200 0.45 35 31 R17 30 75 1.2 1.6 0.36 220 0.58 28 23 α = 10° R34 30 30 1.2 1.6 0.42 240 0.59 25 36 R46 30 75 1.2 1.6 0.36 220 0.58 29 32 R35 30 30 1.2 1.6 0.42 220 0.58 38 46 R47 75 75 1.2 1.6 0.42 240 0.59 28 31 R36 30 30 1.2 1.6 0.42 200 0.57 48 57 R48 75 75 1.2 1.6 0.42 200 0.57 39 43 R37 30 30 1.2 1.6 0.42 190 0.57 55 61 R49 75 75 1.2 1.6 0.42 226 0.58 37 48 R38 30 30 1.2 1.6 0.36 220 0.58 28 33 R50 75 75 1.2 1.6 0.42 225 0.57 53 64 R39 30 30 1.2 1.6 0.36 260 0.59 32 23 R51 75 75 1.2 1.6 0.36 220 0.58 28 33 R40 30 30 1.2 1.6 0.42 220 0.58 36 39 R52 75 75 1.2 1.6 0.48 220 0.58 32 41 R41 30 75 1.2 1.6 0.42 240 0.59 25 31 R53 75 75 1.2 1.6 0.42 220 0.58 36 39 R42 30 75 1.2 1.6 0.42 200 0.57 38 46 R54 30 75 1.2 0.43 0.14 240 0.20 29 33 R43 30 75 1.2 1.6 0.42 220 0.58 32 46 R55 30 75 1.2 0.43 0.14 220 0.20 33 37 R44 30 75 1.2 1.6 0.42 190 0.57 52 58 R56 30 75 1.2 0.43 0.14 200 0.20 39 43 R45 30 75 1.2 1.6 0.48 220 0.58 69 81 R57 30 75 1.2 0.43 0.14 190 0.19 43 49 α = 20° R58 30 50 1.2 1.6 0.36 225 0.50 39 44 R68 30 75 1.2 1.6 0.42 220 0.58 42 53 R59 30 30 1.2 1.6 0.36 220 0.58 27 32 R69 30 75 1.2 1.6 0.42 200 0.57 46 58 R60 30 30 1.2 1.6 0.42 260 0.59 21 26 R70 30 75 1.2 1.6 0.42 190 0.57 67 78 R61 30 30 1.2 1.6 0.42 240 0.59 33 38 R71 30 75 1.2 1.6 0.42 220 0.58 45 53 R62 30 30 1.2 1.6 0.42 200 0.57 48 52 R72 30 75 1.2 1.6 0.48 220 0.58 78 89 R63 30 30 1.2 1.6 0.42 190 0.57 58 63 R73 30 75 1.2 1.6 0.36 220 0.58 27 32 R64 30 30 1.2 1.6 0.48 220 0.58 47 53 R74 30 75 1.2 0.43 0.14 240 0.20 32 38 R65 30 30 1.2 1.6 0.36 225 0.50 47 38 R75 30 75 1.2 0.43 0.14 220 0.20 37 43 R66 30 75 1.2 1.6 0.42 260 0.59 26 34 R76 30 75 1.2 0.43 0.14 200 0.20 42 48 R67 30 75 1.2 1.6 0.42 240 0.59 32 46 R77 30 75 1.2 0.43 0.14 190 0.19 47 53 α = 30 R78 30 30 1.2 1.6 0.42 240 0.59 32 43 R81 30 30 1.2 1.6 0.42 190 0.57 57 65 R79 30 30 1.2 1.6 0.42 220 0.58 36 48 R82 30 30 1.2 1.6 0.42 220 0.58 21 32 R80 30 30 1.2 1.6 0.42 200 0.57 39 51 α = 40 R83 30 30 1.2 1.6 0.42 240 0.59 33 45 R87 30 30 1.2 1.6 0.48 220 0.58 48 59 R84 30 30 1.2 1.6 0.42 220 0.58 38 56 R88 30 30 1.2 1.6 0.36 220 0.58 34 52 R85 30 30 1.2 1.6 0.42 200 0.57 42 53 R89 30 30 1.2 1.6 0.36 260 0.59 32 42 R86 30 30 1.2 1.6 0.42 190 0.57 53 62 R90 30 30 1.2 1.6 0.42 220 0.58 33 43 Table 2 Experimental parameters for non-uniform sedimentsNo. D1
(mm)D2
(mm)σg d50
(mm)U
(m/s)d
(mm)α
(°)Uc
(m/s)ds1
(mm)ds2
(mm)R91 50 50 1.72 1.9 0.36 225 0 0.58 48 31 R92 30 50 2.30 0.65 0.36 225 0 0.68 52 39 R93 50 50 1.92 1.2 0.36 225 0 0.62 45 37 R94 30 50 1.92 1.2 0.36 225 0 0.62 41 26 R95 50 50 2.30 0.65 0.36 225 0 0.68 48 36 R96 30 50 1.72 1.9 0.36 225 0 0.58 38 22 R97 50 50 1.92 1.2 0.36 225 10 0.62 53 57 R98 30 50 1.72 1.9 0.36 225 10 0.58 35 37 R99 50 50 1.72 1.9 0.36 225 10 0.58 49 52 R100 30 50 1.92 1.2 0.36 225 10 0.62 38 42 R101 50 50 2.30 0.65 0.36 225 10 0.68 54 58 R102 30 50 2.30 0.65 0.36 225 10 0.68 55 59 R103 30 50 1.72 1.9 0.36 225 20 0.58 37 42 R104 30 50 1.92 1.2 0.36 225 20 0.62 38 47 R105 30 50 2.30 0.65 0.36 225 20 0.68 55 62 The concept of equilibrium is controversial exclusively regarding the time taken to achieve it. As pointed out by several researchers (Melville and Chiew 1999; Lanca et al. 2013; Simarro et al. 2011), the equilibrium scour depth could not be reached even after running the experiments continuously over 7 days. However, from a practical viewpoint, it is very difficult to conduct an extensive series of experiments with such a long duration. Hence, the maximum duration of present experiments was continued for 16 h during which the final equilibrium scour depths were not achieved although the rate of increase of the scour depth reaches 1 mm per hour for all runs which is assumed as the equilibrium scour depth. In the present study, few runs were continued for a longer period of 30 h to check the influence of test duration on the scour depth, and the growth rate of the scour depth was observed to be less than 5% of the pier diameter after 24 h (Melville and Chiew 1999). However, the main objective of the present study was to develop temporal variations of scour depth model rather to show the equilibrium scour depth. Therefore, time variation evolutions of scour depth in the developing stage have been measured (Kothyari and Kumar 2012).
The characteristic of the horseshoe vortex at the cylinders is used to model the variation of scour depth versus time. Flow visualization was carried out to quantify the size and area of the horseshoe vortex produced at the upstream nose of the cylinders. For this purpose, the potassium permanganate (KMnO4) solution was injected at the upstream of the nose of both upstream and downstream cylinders through a 0.5 mm bored needle. Continuous video recordings of the response of the dye around the cylinders were recorded with a high resolution camera (Model: EOS 50) with 444 frames per minute, the frames of which were later frozen to obtain the diameter of the horseshoe vortex at different times within the scour hole. First, the pixels of the frozen photographs are calibrated from the scale pasted on the cylinder. Subsequently, the distance representing the diameter of the horseshoe vortex is determined using the extracted scale. Figure 3 shows the photograph of the flow visualization of a typical run around the upstream and downstream cylinders within the scour hole.
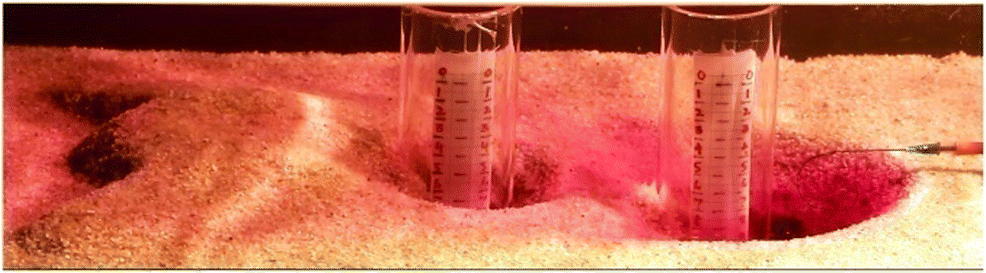 Figure 3 Photographs showing dye injection around upstream and downstream cylinders
The water from the scour hole was removed through the drainage hole provided at the bottom of the test section and the resin was sprayed over the scour bed and kept it for 24 h to stabilize. Over the stabilized scour bed, three-dimensional instantaneous velocity recording was carried out using 16 MHz side and down looking ADV. The ADV was installed with an instrument carriage for taking velocity recordings in the vertical and streamwise directions. The instrument carriage unit was also placed across the flume wall and moved on the rails in a streamwise direction, which enabled the measurements along vertical lines at different radial directions around the submerged tandem and skewed cylinders. A point gauge with an accuracy of ±0.1 mm was fixed on the secondary carriage unit to measure the flow depth. The flow characteristics at a far upstream section were measured and validated with the profiles and confirm a fully developed turbulent flow (Nezu and Rodi 1986). The instantaneous velocity data were measured at various sections along with different directions (Figure 1) from the center of the submerged circular cylinders. The time-independent velocity measurements were carried out for 3–6 min at a point. The time of measurement was varied depending on the turbulence levels as reported (Ataie-Ashtiani and Beheshti 2006; Ataie-Ashtiani and Kordkandi 2012). The down-looking ADV was used for the near bed measurements, whereas the side-looking ADV was used for the velocity measurements close to the submerged cylinders and the free surface. The sampling volume and rate were maintained 0.09 cm3 and 50 Hz respectively during measurements. The measured data were first checked and the data with low SNR (signal-to-noise ratio) and correlation coefficient of 15 and 0.70 respectively are deleted from the data set for further consideration (Lu et al. 2011).
3 Scour Process
Initially, the clear water scour began at the sides of the upstream cylinder and gradually progressed toward its nose. The eroded particles were scoured from the upstream and deposited between the tandem cylinders. During the initial phase, the scour depth around both cylinders increases with time. The deposited sediments formed dune within the spacing between the cylinders and subsequently got scoured and transported to the hole at downstream cylinder. Although no sediment was fed at the far upstream, yet the scour process showed similarity with live bed scour around the downstream cylinder, which led to the temporary reduction of the scour depth. With progress of time, the clear water scour around second cylinder increased and reached the equilibrium. For the skewed cylinders, the scour depth at downstream cylinder is much higher than upstream cylinder in comparison with that of the tandem cylinders. The upstream cylinder shields the downstream cylinder and prevents the scour hole to develop at a faster rate for the tandem position, whereas the sheltering effect is less predominant at higher skew angles resulting in much larger scour hole for the downstream skewed cylinder. For experiments with non-uniform sediments, the clear water scour depth around the tandem and the skewed cylinders are reduced due to the formation of armor layers over the sediment bed.
The flow visualization experiments showed that the flow at the front of the upstream cylinder dived down and subsequently rolled up after reaching close to the bed to form the horseshoe vortex. A schematic representation of the horseshoe vortex at time t0 and after time t is shown in Figure 4. The dashed line shows the vortex at time t0 and the solid line represents the vortex at a time t within scoured bed. The scour took place due to the vigorous action of the horseshoe vortex. The visualizations also indicate that the diameter of the horseshoe vortex (Vi; i=1, 2: vortex diameter of upstream and downstream cylinders respectively) increased over time with the evolution of the scour hole. Figure 5 represents the vector fields inside the scour depth around the submerged cylinders. The diameter of the horseshoe vortex for different runs was also calculated from the vector diagram of the velocity measurements and validated with the results obtained from the flow visualizations. In Figure 5, X (cm), Y (cm), and θ (°) are the longitudinal and vertical distances and angular measuring plane respectively. Two circular cylinders are placed at a center-to-center distance of 2.5D2. The velocity vectors bending downward and clockwise from the horizontal and having an inclination of greater than 10° with the horizontal were included inside the upper periphery (shown by solid arrow line in Figure 5) of the vortex (Kothyari and Kumar 2012). The diameter of the horseshoe vortex was obtained from the vector diagram matches well with the extracted vortex diameter from the flow visualization.
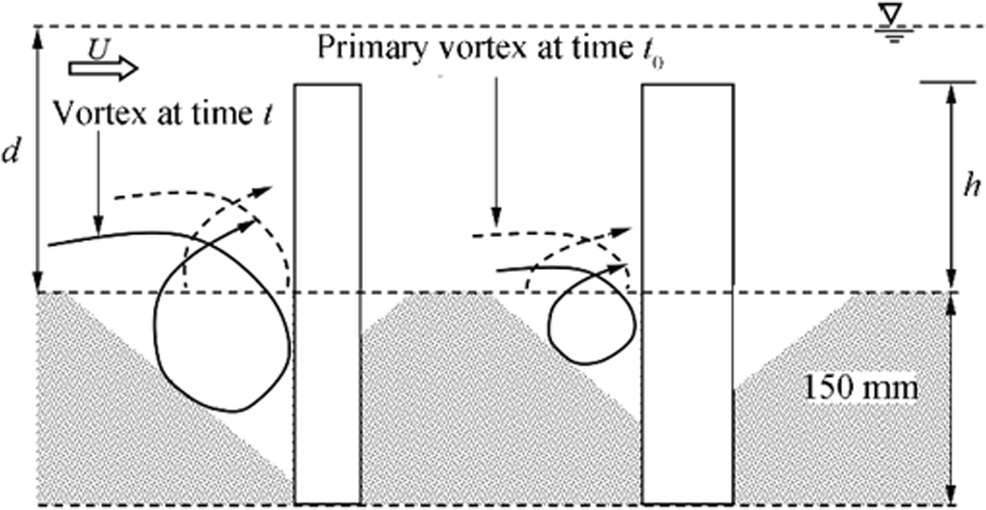 Figure 4 Schematic of vortex formation around tandem cylinders on sediment bed
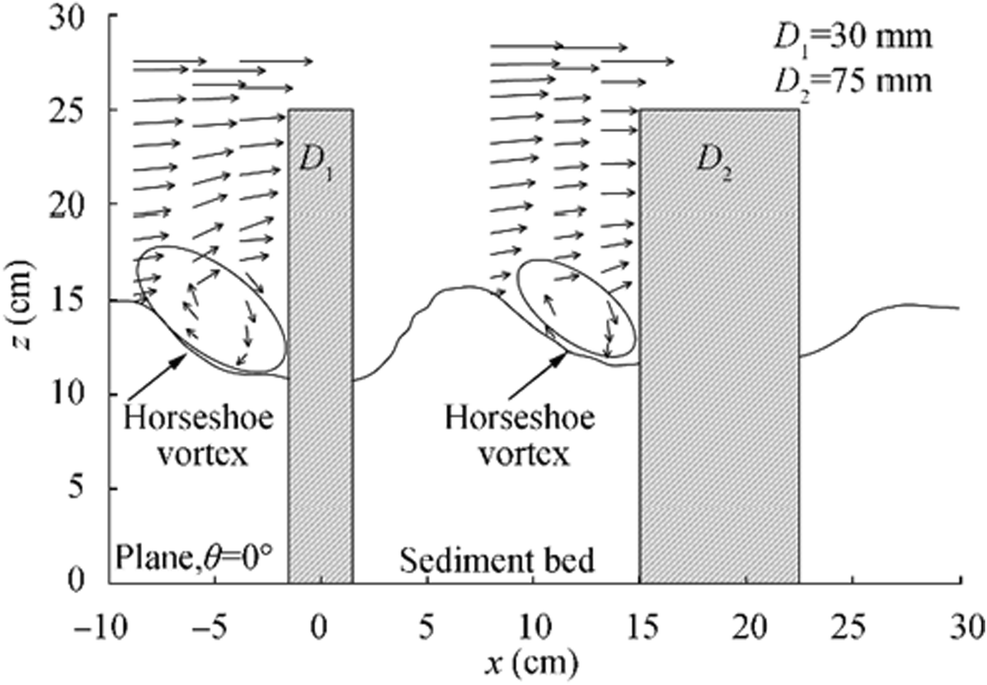 Figure 5 Velocity vector field around tandem cylinders on sediment bed
4 Mathematical Model
The flow visualization experiments and the velocity measurements conducted in the present study help to determine the changing behavior of the horseshoe vortex with the progressive development of scour hole around the upstream and downstream cylinders. The vortex diameter at fully submerged cylinders is determined using data extracted from the flow visualization videos. The measured experimental parameters and validated data of vortex diameters were represented using the non-dimensional expressions and regression analysis was carried out to formulate the Eq.1. The correlation coefficients of regression analysis of the following equations are 0.74–0.96.
$$ {\displaystyle \begin{array}{c}\frac{V_2}{D_2}=0.24{\left(\frac{D_2L}{d^2}\right)}^{-1.16}{(S)}^{-0.62}{\left(\alpha \right)}^{0.06}\\ {}\begin{array}{c}\frac{V_2}{D_2}=0.18{\left(\frac{D_2L}{d^2}\right)}^{-1.34}{(S)}^{-0.58}\\ {}\frac{V_1}{D_1}=0.27{\left(\frac{D_1}{d}\right)}^{-1.47}{(S)}^{-0.71}\end{array}\end{array}}\kern0.5em {\displaystyle \begin{array}{c}\begin{array}{c}\mathrm{downstream}\ \mathrm{cylinder}\ \left(\mathrm{skewed}\right)\\ {}\mathrm{downstream}\ \mathrm{cylinder}\ \left(\mathrm{tandem}\right)\end{array}\\ {}\mathrm{upstream}\ \mathrm{cylinder}\ \left(\mathrm{tandem}\ \mathrm{and}\ \mathrm{skewed}\right)\end{array}} $$ (1) Considering the relative influence of the parameters on the diameter of the horseshoe vortex, they are included in the respective equations for the submerged cylinders for various configurations. The parameters like the skew angle and the spacing between the cylinders are not included in the formulations of non-dimensional vortex diameter around upstream cylinder in Eq. 1, but both the skew angle and the spacing between the cylinders are included for the downstream cylinder for skewed configuration, whereas the skew angle is not considered for the downstream cylinder for tandem configuration. Furthermore, the sensitivity analysis is carried out using the one-at-a-time method (Boujia et al. 2017), where each independent parameter is varied around its mean value keeping others constant to determine the effect of it on the dependent parameter. In the present study, the sensitivity analysis is carried out varying ± 30 % of the independent parameters of the proposed model from their corresponding mean values. The results of the sensitivity analysis are represented in Figure 6, which shows the percentage change in the magnitude of the non-dimensional vortex diameter with respect to the percentage change in the magnitude of the independent parameters. The analysis shows that the submergence ratio is the most sensitive and skew angle is the least sensitive parameter for determining the vortex diameter using Eq. 1.
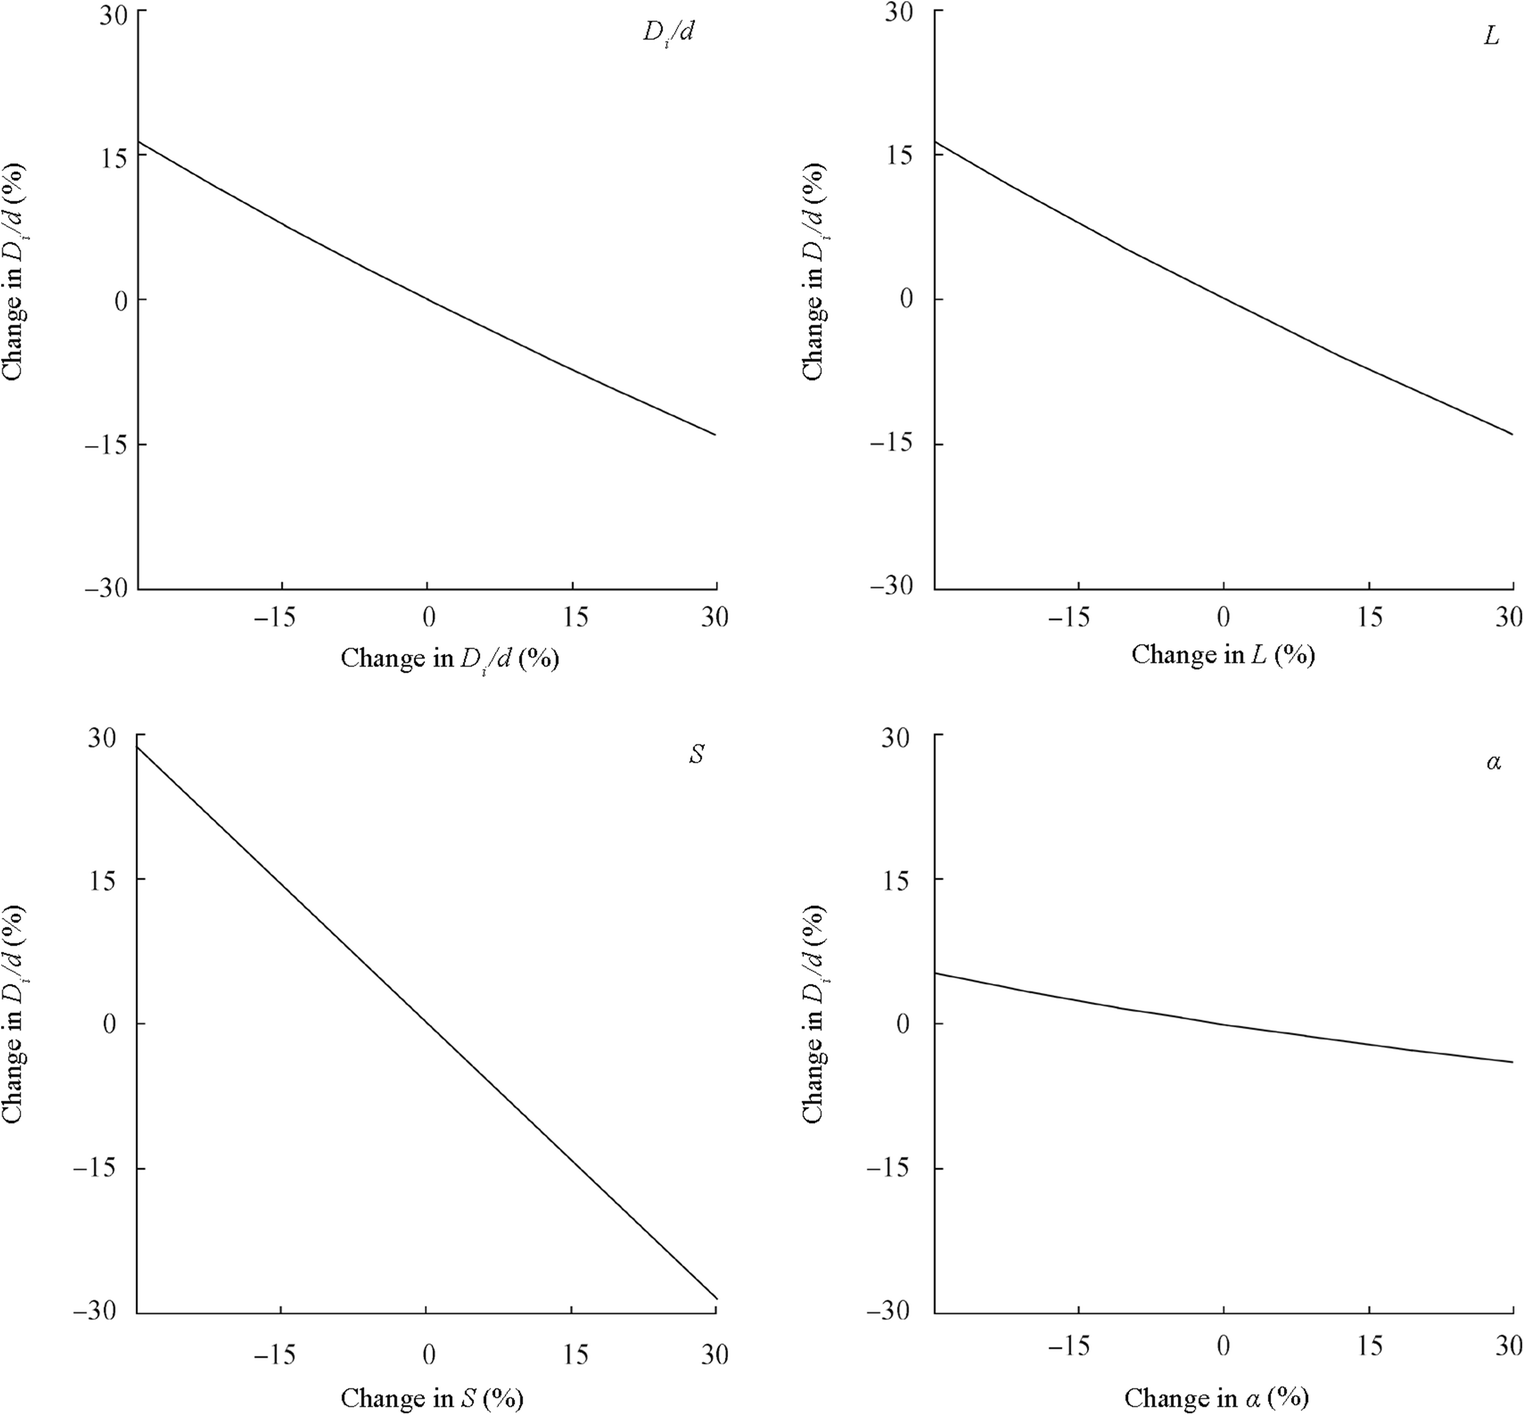 Figure 6 Sensitivity analysis of non-dimensional vortex diameter with respect to input parameters of the proposed model
The area of horseshoe vortex matches with the area of scour hole with increase of scour and progress of time (Melville 1975; Hjorth 1977). The area (At) of horseshoe vortex at any time t is written as,
$$ {A}_t={A}_{t-1}+{A}_{st} $$ (2) where the area of primary vortex at time t=0 is At-1 and Ast is the area of scour hole at time t. The At-1 and Ast are written as
$$ {A}_{t-1}=\frac{\pi }{4}{V}_i^2 $$ (3) $$ {A}_{st}=\frac{{d_{st}}^2}{2}\cot \left(\mathtt{ϕ} \right) $$ (4) where angle of repose is ϕ. For computational purposes, value of ϕ is assumed as 30°. The depth of scour hole below the bed level (dst) at time t.
At time t, the bed shear stress at pier nose τt is expressed as
$$ {\tau}_t={n\tau}_u{\left(\frac{A_{t-1}}{A_t}\right)}^{0.68} $$ (5) where n= 3.15, 3.4, and 4.2 for downstream cylinder tandem and skewed and upstream cylinder respectively as evaluated from bed shear stress. Investigations (Kothyari et al. 1992b; Mia and Nago 2003) revealed that the bed shear stress produced at the partially submerged cylinder nose at time t = 0 is K times τu, where τu is the shear stress induced by the approach flow velocity and K is a coefficient. It is pertinent to mention that the above-mentioned studies carried out a trial and error process to determine the coefficient K, which was reported in the range of 3.3–4. However, the bed shear stressτt produced at the fully submerged cylinders is estimated from Reynolds stresses. The recorded velocities parallel to scour bed slope at a vertical distance of 4 mm are used to calculate the bed shear stress (Wu and Rajaratnam 2000; Kothyari and Kumar 2012).
$$ \left.{\tau}_t=\sqrt{\mathtt{τ}_{\mathtt{θ}}^2+{\mathtt{τ}}_r^2}\right|\mathrm{at}\ \mathrm{bed} $$ (6) where τθ and τr are bed shear stress along tangential and radial directions and calculated from [τθ= -ρ($ \overline{u^{\prime }{w}^{\prime }} $ + $ \overline{u^{\prime }{v}^{\prime }} $)] and [τr = -ρ($ \overline{u^{\prime }{v}^{\prime }} $ + $ \overline{v^{\prime }{w}^{\prime }} $)], respectively, and u′, v', and w′are the fluctuations of the velocity components with respect to the means. Finally, the estimated τt is substituted back in Eq. 6 to determine the respective coefficients.
The time t* necessary for transport of one particle from the sediment bed (Paintal 1971; Kothyari et al. 1992b):
$$ {t}_{\ast }=\frac{{\mathtt{β} d}_{50}}{P_t{u}_{\ast_t}} $$ (7) where
$$ {u}_{\ast_t}=\sqrt{\frac{\mathtt{τ}_t}{\mathtt{ρ}}} $$ (8) and β is a parameter depends on the experimental parameters and kinematic viscosity of fluid. The value of β (0.02–0.08) is determined using the expressions of Kothyari and Kumar (2012), Pt is possibility of motion of particle at time t, and ρ is the mass density of water. u*t is shear velocity at time t. Also, Pt is determined from the following equation proposed (Kothyari and Kumar 2012):
$$ {P}_t=0.8{\left({\mathtt{τ}}_{\ast_t}\right)}^{4.2},\kern0.5em \mathrm{for}\ {\mathtt{τ}}_{\ast_t}\le 0.5 $$ (9) $$ {P}_t=0.18\ \ln \left({\mathtt{τ}}_{\ast_t}\right)+0.17\kern0.5em \mathrm{for}\ {\mathtt{τ}}_{\ast_t} \gt 0.5 $$ (10) The non-dimensional bed shear stressτ*t is calculated from the following equation;
$$ {\mathtt{τ}}_{\ast_t}=\frac{\mathtt{τ}_t}{\Delta _{\gamma_s{d}_{50}}} $$ (11) where Δγs = γs − γd = γd(s − 1), γs, and γd are the specific weights of sediment and fluid respectively, and s is the specific gravity of sediments.
However, for the tandem configurations, it was evident that scour at downstream cylinder reduces after achieving a local maximum due to the deposition of sediment, which was scoured from the upstream cylinder. This reduction of scour depth was estimated and incorporated in the model of the time variation for the downstream tandem cylinder. First, the sediment load (qb) deposited in the hole during t* is estimated using Meyer-Peter formula, where qb is the unit sediment discharge expressed in mass per unit time per unit width. Subsequently, the depth of deposition (dp) around the downstream cylinder resulting from the sediment inflow is calculated using the following equation:
$$ \frac{1}{2}\frac{d_p^2}{\tan \mathtt{ϕ}}{\pi D}_2={q}_bt\ast B $$ (12) Finally, the depth of deposition (dp) is subtracted from the modified value of the scour depth during every iteration to determine the variation of scour versus time at downstream cylinder for tandem configuration.
4.1 Time Variation of Scour Depth with Uniform Sediments
Figure 7 shows the algorithm followed for modeling the variation of scour versus time both for the tandem and skewed circular arrangement of submerged circular cylinders. The vortex diameter at beginning of the scour process is calculated using the expressions of vortex diameter for different cases as mentioned in Eq. 1. As the scour hole develops, the area of the horseshoe vortex is calculated as the sum of the areas of the vortex and scour hole. The average bed shear stress is computed using the flow characteristics and pier diameter. Equation 5 is used to estimate the shear stress at the cylinder nose at the beginning of the scour process (t =0). Subsequently, with the development of the scour hole, Eq. 5 is again used to determine the modified bed shear stress, which is a function of the modified cross-sectional area of the horseshoe vortex. The t* needed by a sediment particle for dislodgement is calculated using Eq. 7. The average probability of a single particle getting transported is a function of t* and is computed using Eqs. (9–10). Finally, the time is increased to accommodate for the increased scour depth. The simulation progresses until the modified bed shear stress after every iteration matches the critical value of the shear stress for the bed material. However, for the tandem configurations, the scour around the downstream cylinder reduces after achieving a peak scour depth due to the inflow of sediment from the dunes formed within the spacing between the cylinders. Hence, to account for this reduction in scour depth, the sediment load moving in to the scour hole during the time t* is estimated (Eq. 11) and subtracted from the modified value during every iteration. The computations end if the modified bed shear stress matches the critical shear stress. Similar steps are followed to obtain the variation of scour versus time for the downstream cylinder in tandem and skewed configuration.
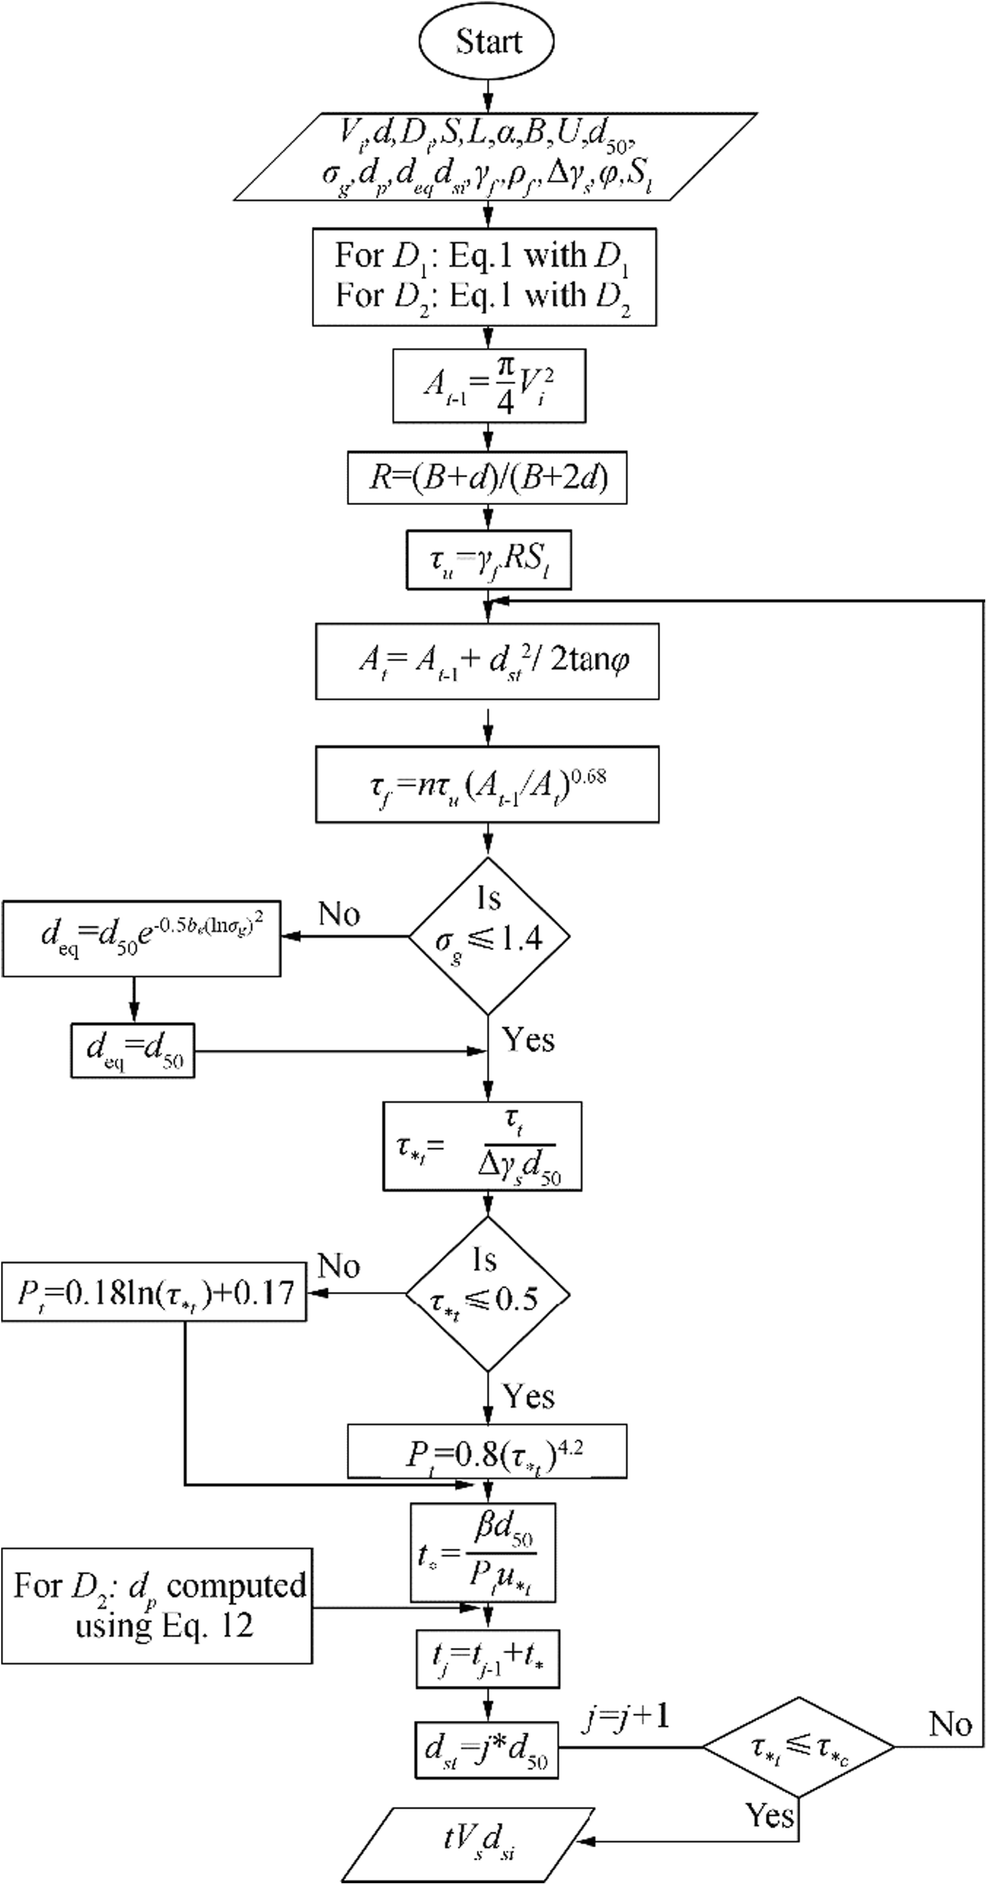 Figure 7 Algorithm for calculation of time variation of scour depth around tandem and skewed submerged cylinders
Figures 8 and 9 show the variations of scour versus time at the submerged cylinders measured during the experiments, and compared with the variations determined using the developed semi-empirical methodology. Figure 8 shows the variations for runs R1, R21, and R23. The run R1 and R21 were conducted using same diameter of 50 mm and 75 mm for the upstream and downstream cylinders, whereas different cylinder diameters of 30 mm and 50 mm were used as upstream and downstream cylinders respectively, for run R23. Both these runs were conducted in the tandem configuration (α = 0°). The detailed parameters of the various runs are tabulated in Table 1. It is evident from the variations that for runs with same cylinder diameter, the scour depth develops at a faster rate for the upstream cylinder and the equilibrium scour depth is more in comparison to the downstream cylinder. The interaction of the wake vortices from the upstream cylinder with the horseshoe vortices around the downstream cylinder shielded the scour hole to develop fully around the downstream cylinder. This sheltering effect is the highest in the tandem configuration. While the diameter of the upstream cylinder remaining same, it is also evident that the scour at downstream cylinder got reduced for run R23. This is due to the fact that the strength of horseshoe vortex around larger downstream cylinder reduces due to larger participation of wake vortex from smaller upstream cylinder. For the tandem and skewed arrangements, prediction errors of the values obtained using the proposed model are calculated with respect to the corresponding experimental data. The range of the magnitude of the prediction errors varies from 0.10%–7.45% and 0.30%–6.13% for the submerged cylinders respectively. Furthermore, the effects of skew angle on variation of scour versus time at submerged cylinders are evident from Figure 9. It is evident that scour at downstream cylinder increases with increase of skew angle as also reported (Rout and Sarkar 2019). However, with the increase of α, downstream cylinder gets exposed to the unobstructed flow. The downstream cylinder behaves more like a single cylinder with an enhanced rate of scour.
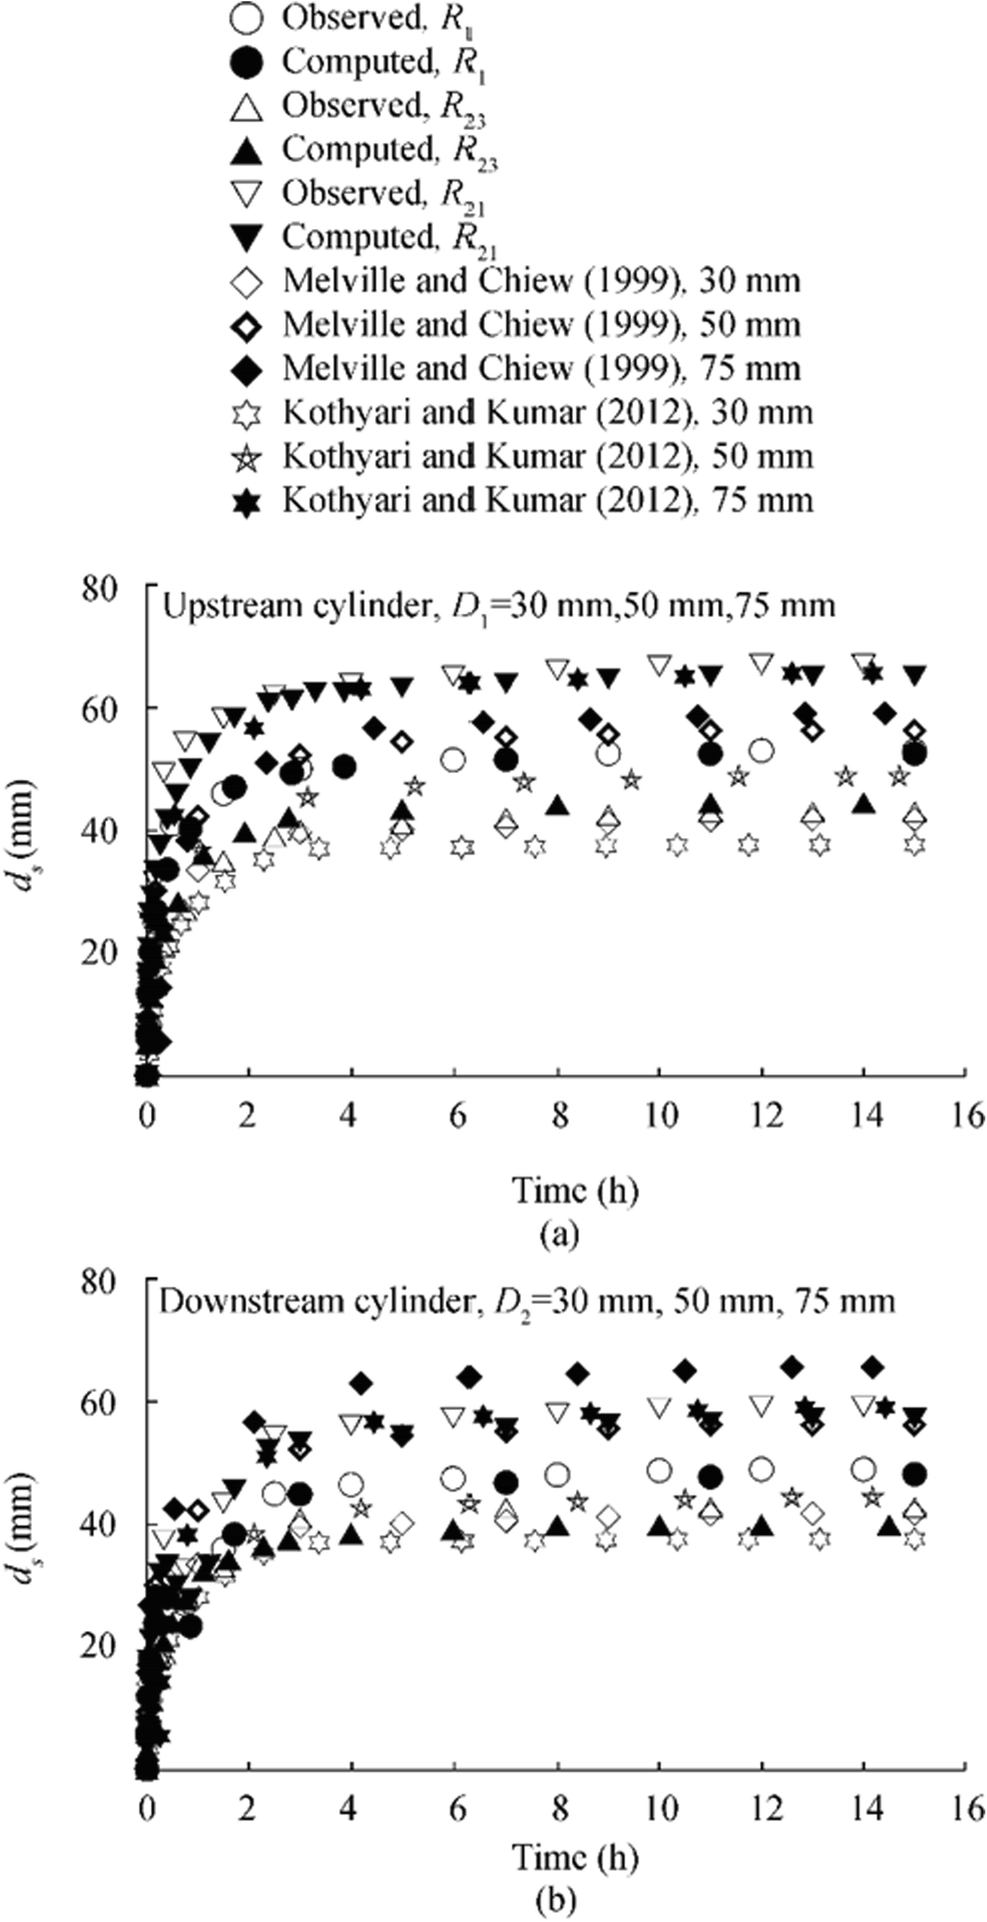 Figure 8 Time variation of scour depth for a upstream and b downstream cylinders arranged in tandem configurations with uniform sediments
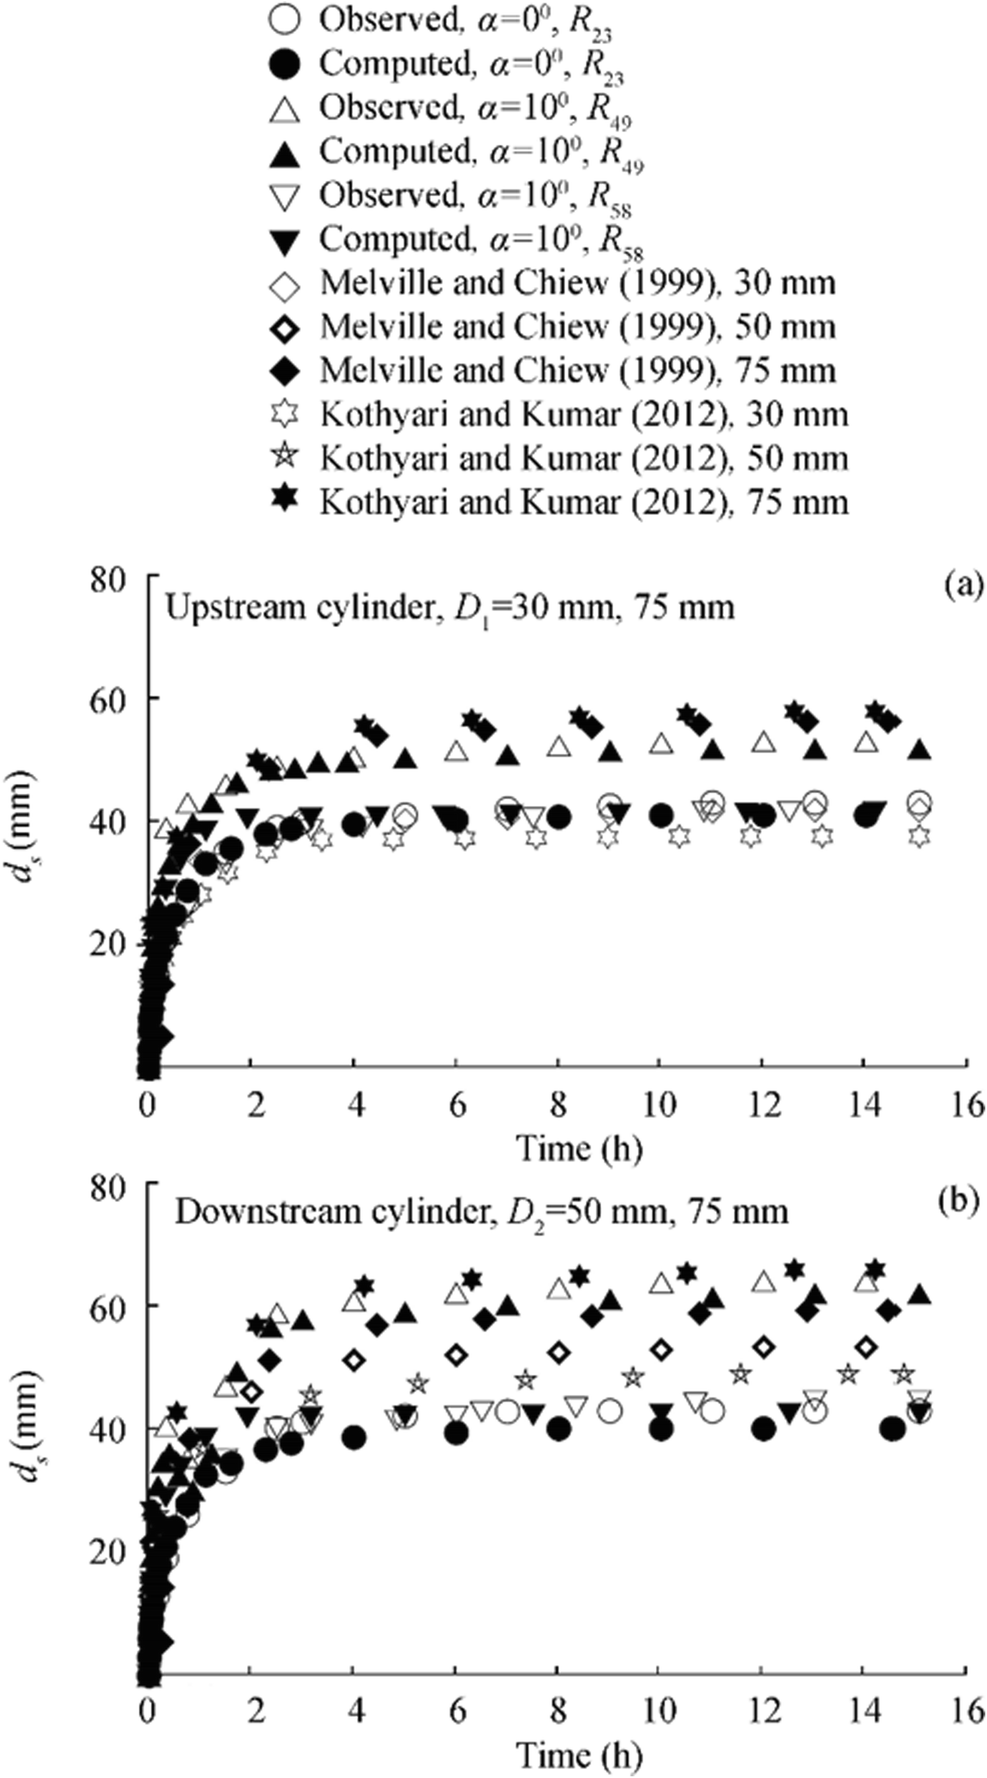 Figure 9 Time variation of scour depth for a upstream and b downstream cylinders arranged in skewed configurations with uniform sediments
Furthermore, due to the paucity of any experimental data on the scour around submerged dual cylinders in tandem or skewed configurations, the variation of scour versus time around partially submerged single cylinder is determined using the experimental parameters of runs R1, R21, R23, R49, and R58 from the analytical methodologies as proposed (Melville and Chiew 1999; Kothyari and Kumar 2012) and superimposed in Figures 8 and 9. However, in this context, it is pertinent to mention that Figures 8 and 9 do not represent the quantitative comparison of the results of time variation of the present study (Melville and Chiew 1999; Kothyari and Kumar 2012). The trends for the development of scour depth around a partially submerged single cylinder are superimposed to show the dissimilarities in the time rate of development of scour at submerged cylinders. The maximum equilibrium scour depth for the present experiments around the cylinders was found to lie between the results predicted using the models (Melville and Chiew 1999; Kothyari and Kumar 2012). The differences between the results of the present experiments with that of the proposed models for single partially submerged cylinders (Melville and Chiew 1999; Kothyari and Kumar 2012) exist mainly due to the modification in the diameter of the horseshoe vortex around submerged cylinders and the interaction of the shed vortices from the upstream cylinder with that of the downstream cylinder. The variations of scour depth versus time for the upstream cylinder are different compared with single partially submerged cylinder as also reported (Hannah 1978). Furthermore, the model of Kothyari and Kumar (2012) predicts the time variation of scour depth considering the variation of the diameter of horseshoe vortex with respect to time at the upstream of the partially submerged cylinders, whereas the model (Melville and Chiew 1999) uses various factors to predict the time variation without any emphasis on the flow physics. However, the time variation of scour depth as presented (Zhao et al. 2010) for local scour around submerged vertical circular cylinder is plotted in Figure 10. The data of Zhao et al. (2010) are further utilized to determine the time variation of scour depth using the developed model. The difference in the experimental data of Zhao et al. (2010) and predicted results of the proposed model is due to the interaction effects of the upstream cylinder on the downstream cylinder. This interaction effect was also established and reported by Keshavarzi et al. (2018). Also, the time variation of R1 for tandem cylinders is plotted in Figure 10, which shows that the time rate of development of the scour hole is high during the initial phase of the experiments for submerged cylinders.
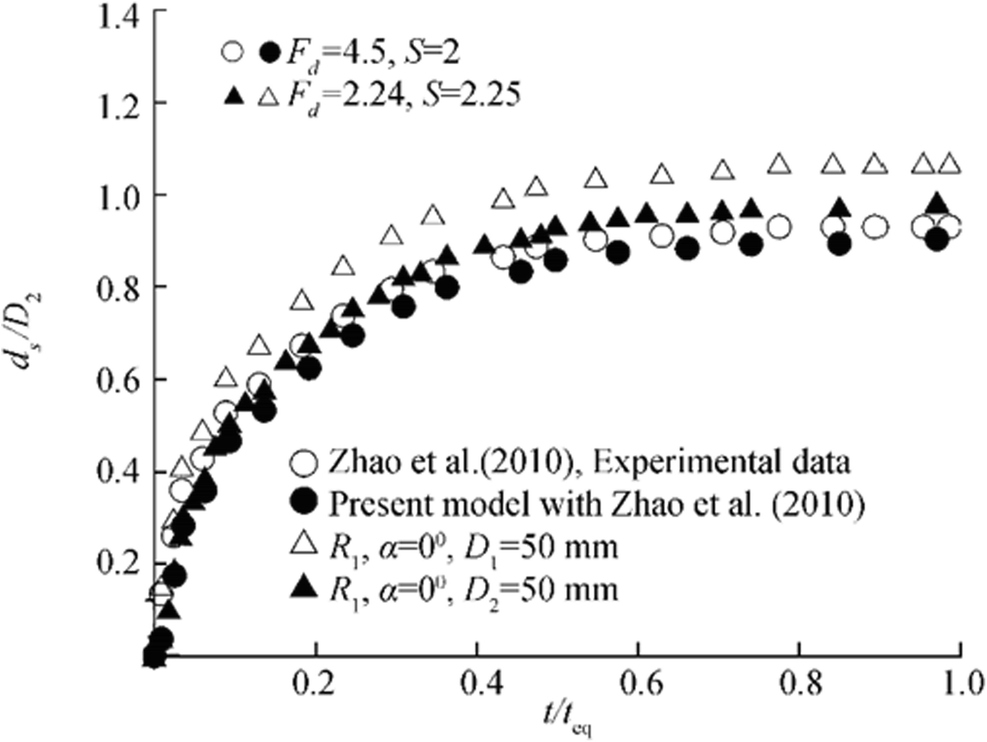 Figure 10 Comparison of results of Zhao et al. (2010) with the developed model
4.2 Time Variation of Scour Depth with Non-uniform Sediments
In view of the non-uniformity of natural bed sediments, the proposed model is further refined for the non-uniform sediments. The equivalent size of the non-uniform sediment is first calculated based on the assumption that the equivalent size particles of uniform diameter are also susceptible to scour at the same rate as the non-uniform sediments. The effective equivalent diameter of the non-uniform sediments is determined using the equation proposed by Wu et al. (2004). The proposed equation of Wu et al. (2004) is expressed as
$$ {d}_{eq}={d}_{50}{e}^{-0.5{b}_e{\left(\ln {\mathtt{σ}}_g\right)}^2} $$ (13) where deq is the effective equivalent diameter of non-uniform sediments, be is the exponent which depends on the particle size, flow intensity, and fractional transport rates of the sediment mixture. The relative transport capacity shows similar trends as it decreases with increase of particle size. According to Wu et al. (2004), the size gradation factor is significant with σg > 2 and the correction factor is negligible for σg < 1.5. However, in the present study, all the σg > 1.5. Hence, for simplicity, as proposed by Wu et al. (2004), be is assumed to be constant at 1.2 in the present model. The experiments as described in the previous sections were repeated for non-uniform sediments. The effective equivalent diameters of the non-uniform sediment mixtures are 0.43–1.6 mm as calculated using the Eq. 1 and it is used in the proposed model for computation of temporal evolution of scour at the tandem and skewed cylinders. Figure 11 shows the temporal evolution of scour depth for runs R1, R91, and R100 with different sediment size. The runs R1 and R91 were carried out in the tandem configuration using same diameter for the upstream and downstream cylinders, whereas the run R100 shows the unequal diameters of cylinders are arranged in tandem configurations. It is observed from the figure that the temporal evolutions of scour depth are reduced around the cylinders as the sediment size increases. The proposed model computed the temporal evolution of scour depth using the experimental parameters of the mentioned runs. The predicted data from the model matches well with the experimental data as shown in Figure 11. In tandem arrangement of cylinders both for equal and unequal diameters, the evolutions of scour depth were observed maximum around the upstream cylinder as due to the sheltering effect. Hence, the upstream cylinder can be used as a scour reduction device in tandem configurations only. Furthermore, the model of Melville and Chiew (1999) and Kothyari and Kumar (2012) were superimposed in Figure 11 to show the similarity and dissimilarity with the present model. The formation of the armor layer was observed around both the upstream and downstream cylinders; the thickness of the armor layer was higher for the upstream cylinder. It is evident that the reduction in the scour depths due to the formation of the armor layer for non-uniform sediments is 6% and 35% for upstream and downstream cylinders respectively.
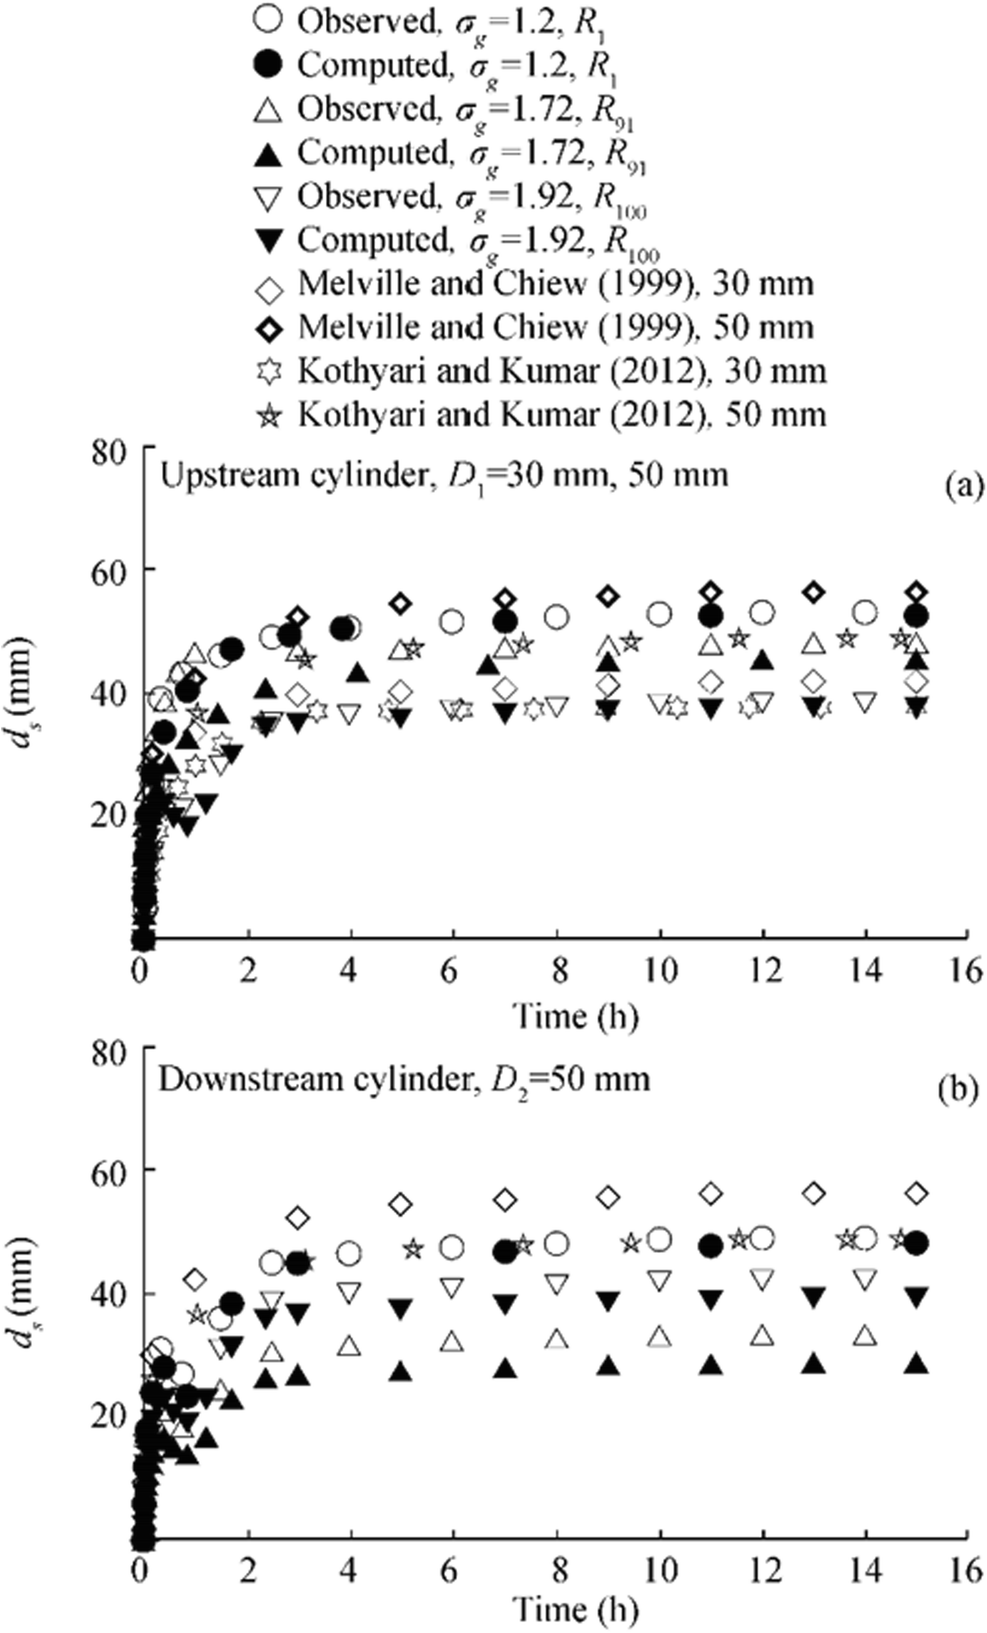 Figure 11 Time variation of scour depth for a upstream and b downstream cylinders arranged in tandem configurations with non-uniform sediments
Furthermore, the temporal evolutions of scour depth around the submerged cylinders arranged with different skew angles are presented in Figure 12. The presented data consists of three different runs of R96, R99, and R104 over non-uniform sediments with skew angles of 0°, 10° and 20°, respectively. The runs R96 and R104 consist of unequal diameters of cylinders and the run R99 represents the equal diameters of cylinder. The temporal evolution of scour depth was observed maximum around the downstream cylinders with the increasing of the skew angles. The proposed model also computed the time variations of scour depth around the cylinders and superimposed in the Figure 12. The evolution of scour at downstream cylinder almost remains same when compared with the results of uniform sediment as depicted from Figure 12. For downstream cylinder, vertical extension of scour hole developed at a rapid rate forming a local maximum, but immediately after, the scour reduced due to the deposition of the washed away sediment from the spacing between the cylinders. This phenomenon was more pronounced for the tandem configuration in comparison with the skewed cylinders due to the relative positioning of the cylinders. Furthermore, it is pertinent to mention that this momentary reduction of scour around downstream cylinder was more prominent for non-uniform sediments due to the bed sorting of larger size particles. Figure 13 represents the dip in scour for the tandem and skewed cylinders over uniform and non-uniform sediments as well. The dunes formed within the spacing of the cylinders mainly consist of finer particles for experiments with non-uniform sediments due to the sorting and erosion of the finer particles from the upstream cylinder. Hence, the dunes also got eroded much faster for non-uniform sediment as a result of larger bed shear stress applied by the flow.
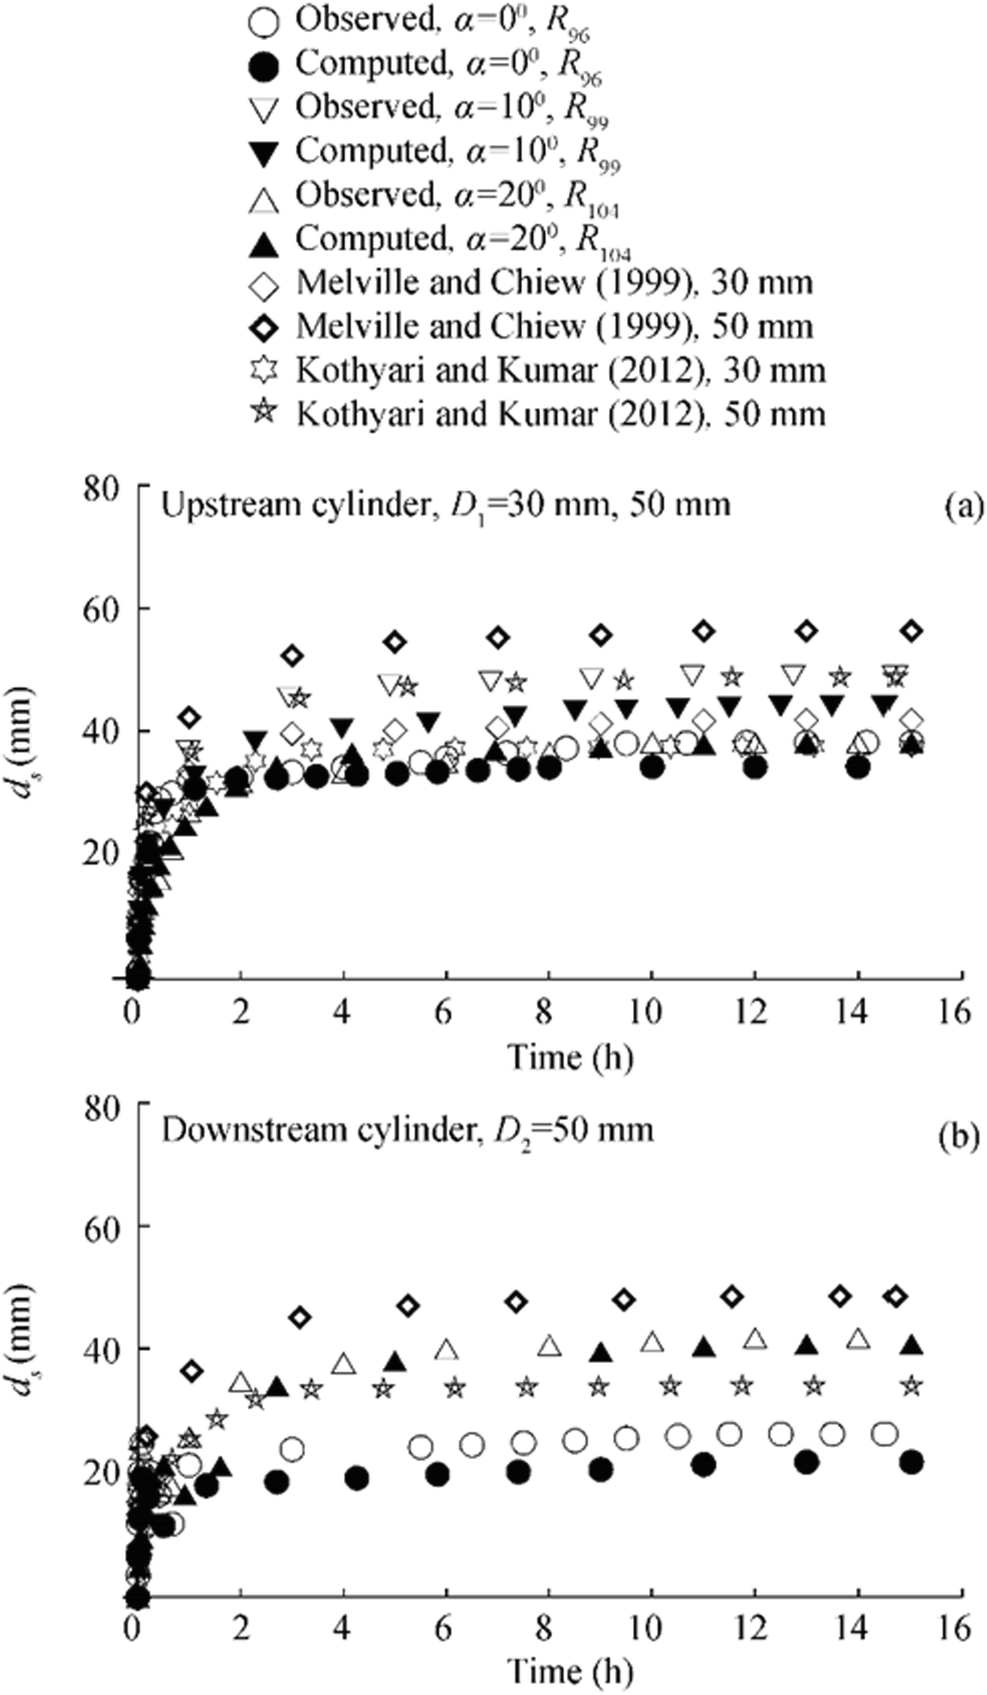 Figure 12 Time variation of scour depth for a upstream and b downstream cylinders arranged in skewed configurations with non-uniform sediments
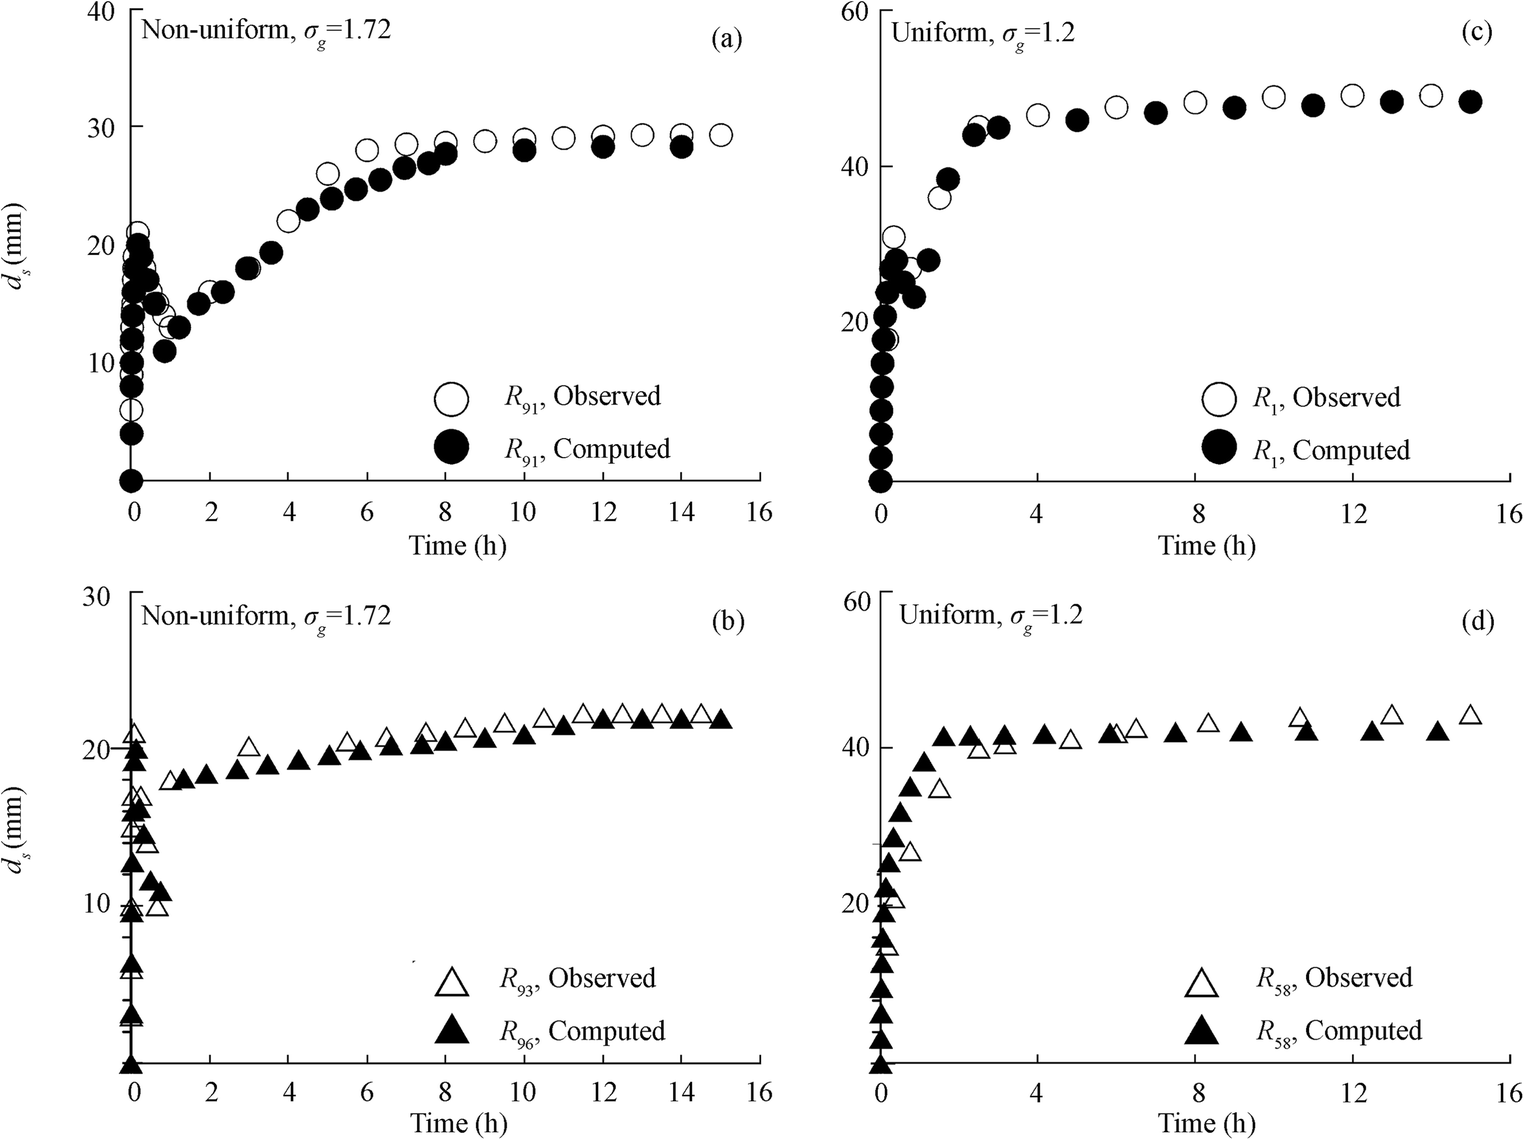 Figure 13 Time variation of scour depth for various runs with c, d uniform and a, b non-uniform sediments around downstream cylinder
The experimental results with non-uniform sediments are also checked with the equivalent diameter concepts (Kothyari et al. 1992b; Wu et al. 2004). Figure 14 shows the differences of the temporal evolution at upstream cylinder in comparison to that of proposed models of equivalent diameter (Kothyari et al. 1992b; Wu et al. 2004). Although the equivalent diameter expression (Wu et al. 2004) is used in the present model, the differences in the results are due to the modification in the expression carried out in the present study for the estimation of vortex diameter for submerged cylinders. It is evident that the results lie between the simulated results (Kothyari et al. 1992b; Wu et al. 2004).
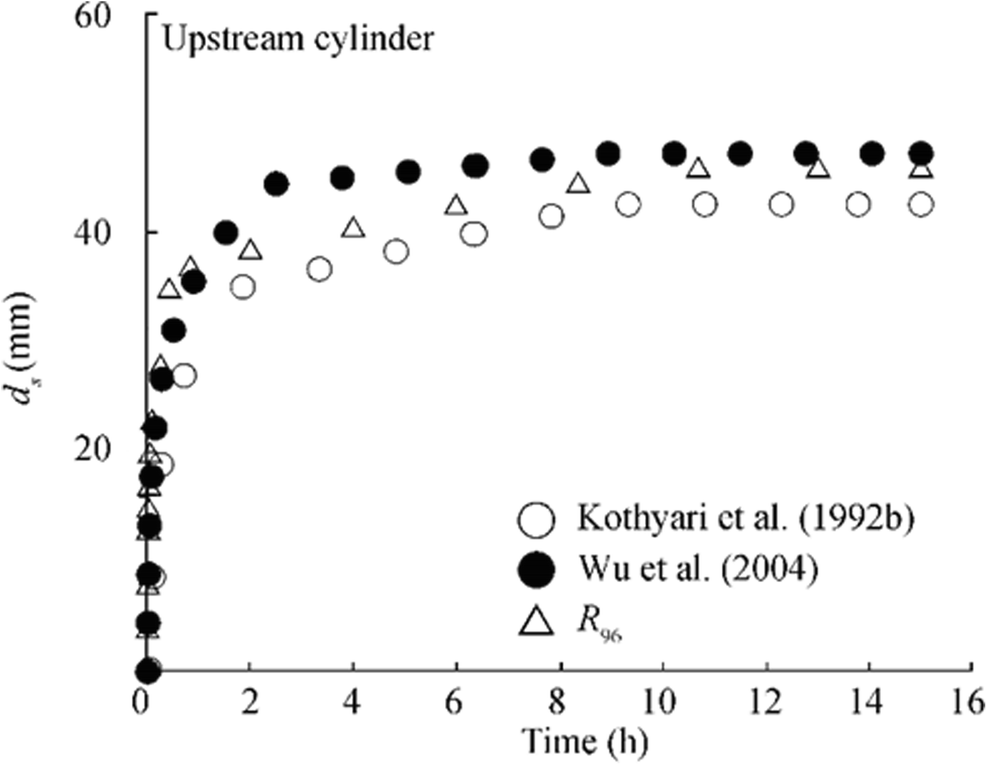 Figure 14 Time variation of scour depth with different equivalent diameter expressions
Figure 15 represents the non-dimensional contours ($ \hat{z} $= z/D1) of the scour bed around the tandem and skewed cylinders of the run R23 and R58. The non-dimensional horizontal ($ \hat{x} $= x/D1) and longitudinal ($ \hat{y} $= y/D1) axis as presented in Figure 14 helps to depict the scour geometry around the cylinders. The negative and positive contour values represent the scour and deposition pattern around the submerged cylinders. The maximum scour depth has been observed at upstream face of the downstream cylinder with the skew angle of 20°. It was observed that the scour depth increases 50%–60% at the downstream cylinder with an alignment angle of 20°.
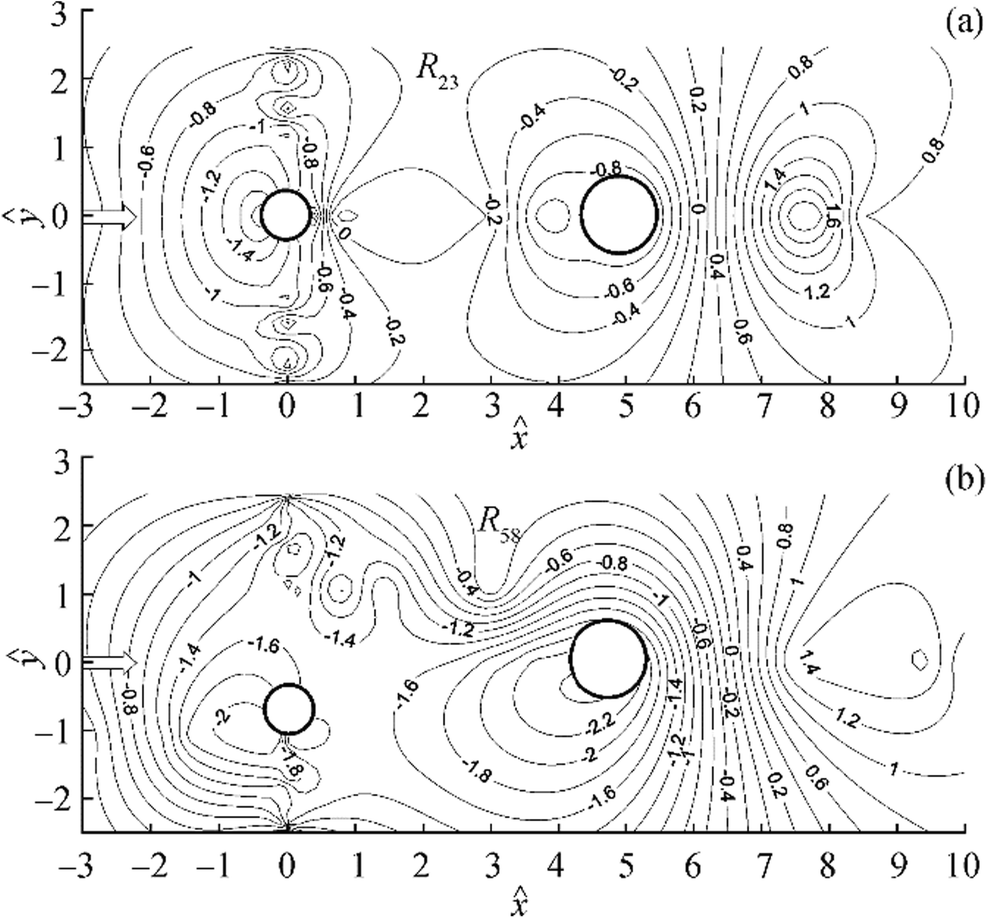 Figure 15 Scour depth geometry around submerged a tandem and b skewed circular cylinders
The time scale around single fully submerged cylinder was determined for substantial development of scour (Sarkar 2014), but the temporal evolution of scour hole around the tandem and skewed cylinders involves different scour process and even live bed like condition at the downstream cylinder. The schematic representation of time scale is shown in Figure 16 to find out the instantaneous scour depth at any time t. Hence, the time T is determined from the variation of scour depth versus time using the slope of the tangent to the curve at time t = 0. The time T is further non-dimensionalised to determine the time scale$ \hat{T} $, where
$$ \hat{T}=\frac{{\left(\Delta {gd_{50}}^3\right)}^{0.5}}{D_i^2} $$ (14) 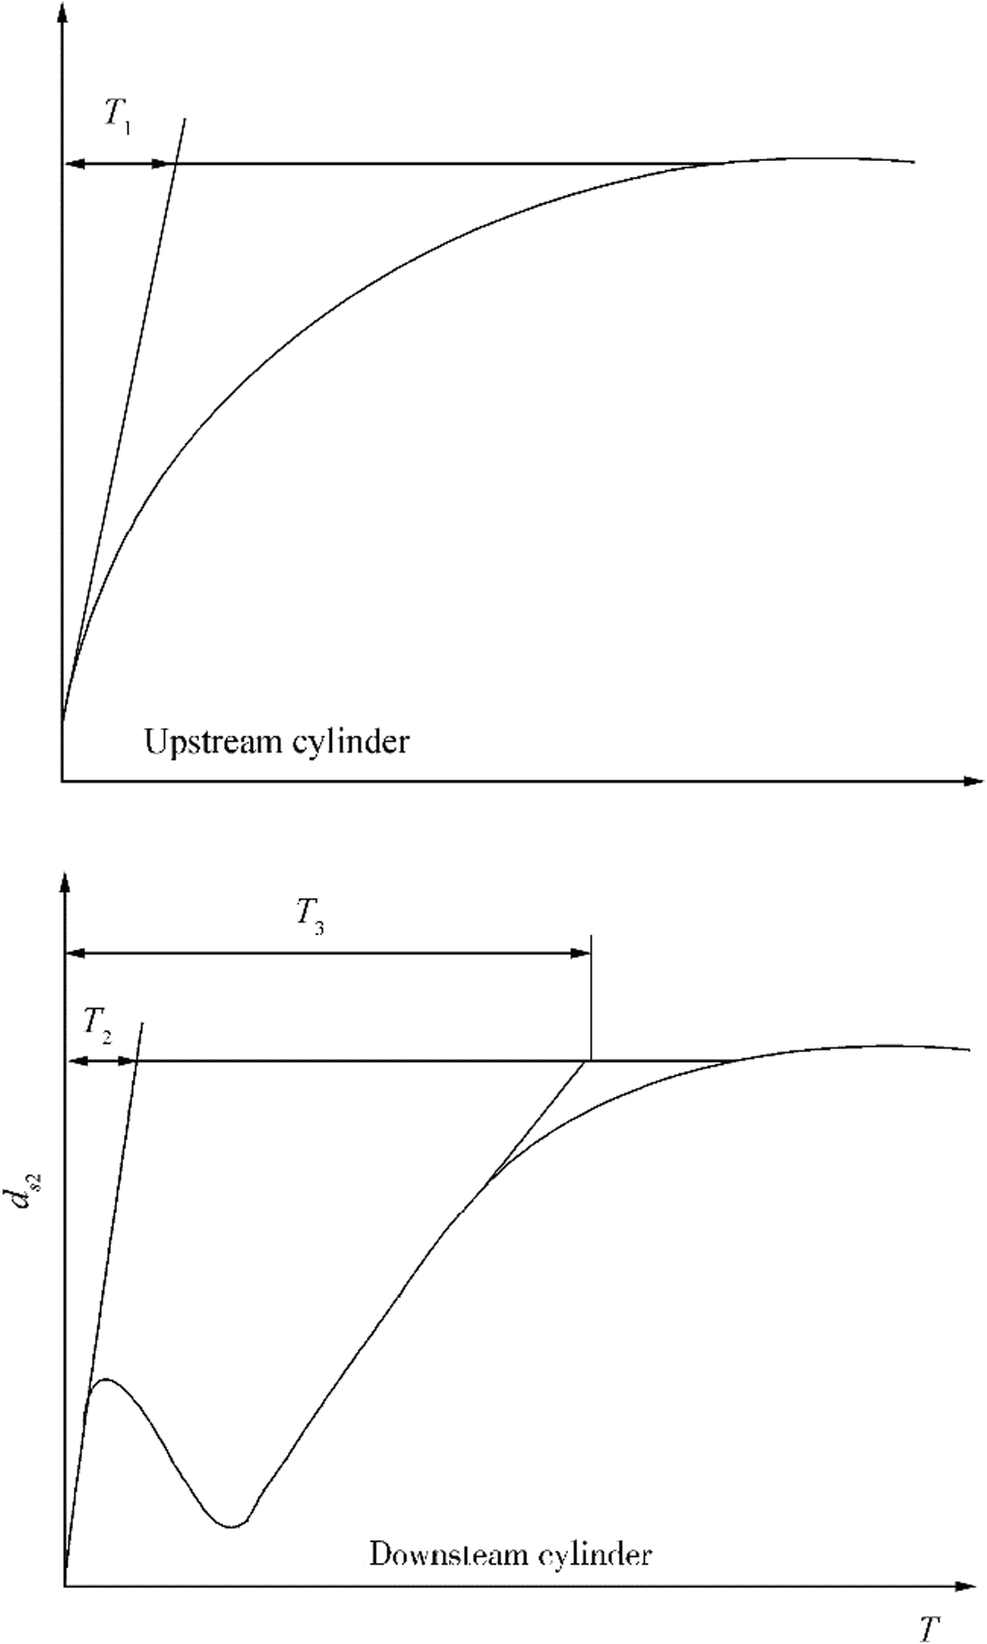 Figure 16 Schematic of time scale used for upstream and downstream cylinder
where Δ is s – 1, s is the specific gravity of sediments and g is the acceleration due to gravity. Thus, the present study gives three different time scales: one for upstream $ {\hat{T}}_1 $and other two for downstream cylinder (one for first local peak $ {\hat{T}}_2 $and the other $ {\hat{T}}_3 $for the process to reach equilibrium). Figure 17 shows the non-dimensional time scale with the densimetric Froude number. The time scales so determined are plotted versus densimetric Froude number Fd [Fd = U/(Δgd50)0.5] in Figure 17 separately for the tandem and skewed configurations. The figure shows that in general, the time scales decrease as a result of increase of Fd. However, $ {\hat{T}}_2 $ decreases significantly with the increase of the skew angle due to the quick growth of the scour hole; the downstream cylinder is unobstructed by the upstream cylinder. Immediately after the local peak, the process reached the equilibrium stage much faster for the downstream cylinder placed in tandem configuration resulting in higher$ {\hat{T}}_3 $.
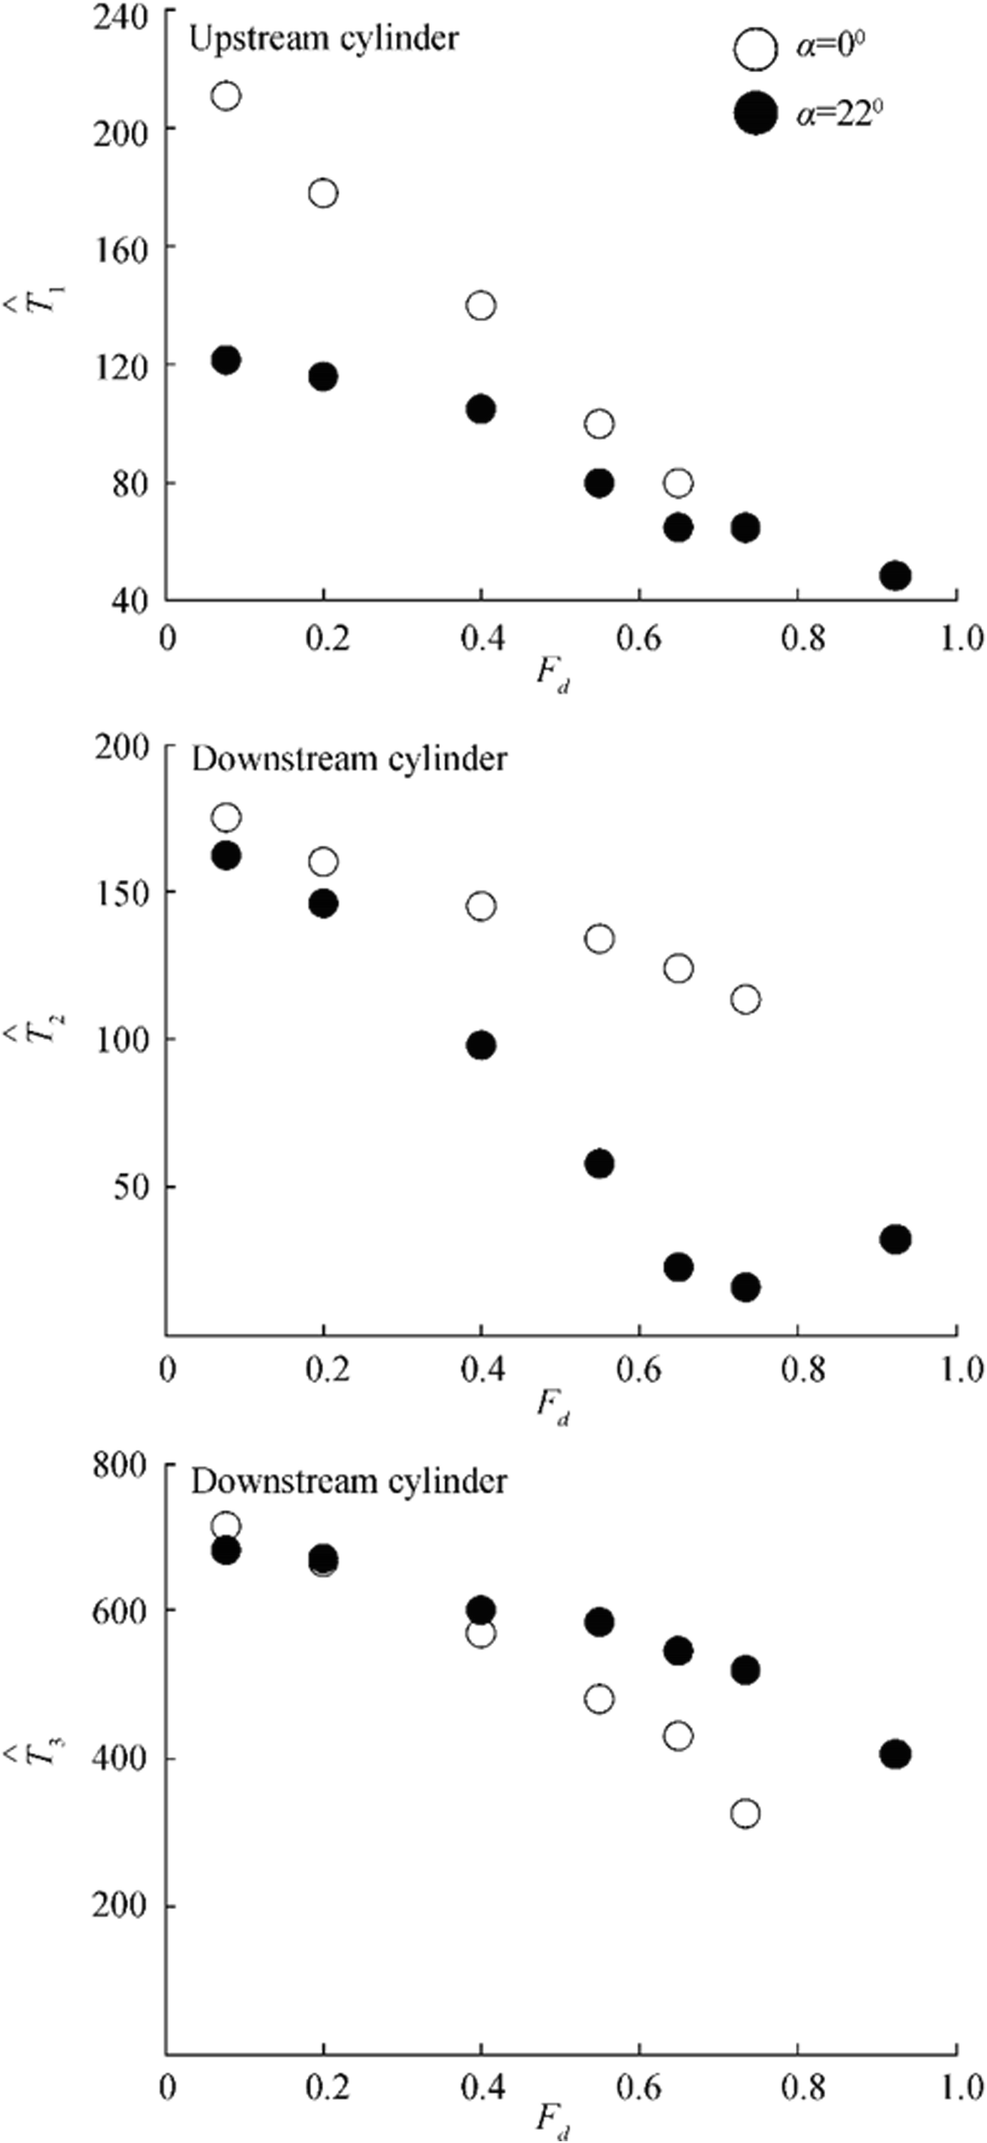 Figure 17 Variation of time scales versus densimetric Froude number
4.3 Comparison with Available Field Data
Field data on scour at bridge piers were measured during floods and observed that the total scour consists of three scour components: local, contraction, and general scour (Lu et al. 2008). The concerned field data as observed by Lu et al. (2008) were considered for the comparison in the present study. The field data as represented (Lu et al. 2008) together with the effective diameter concept (Wu et al. 2004) is incorporated in the present model to calculate the local scour component around the bridge pier. The results from the present model are further validated (Figure 18) using the local scour component of the field data reported (Lu et al. 2008). The comparisons show that the present model results match well with the field data as it reaches equilibrium stage.
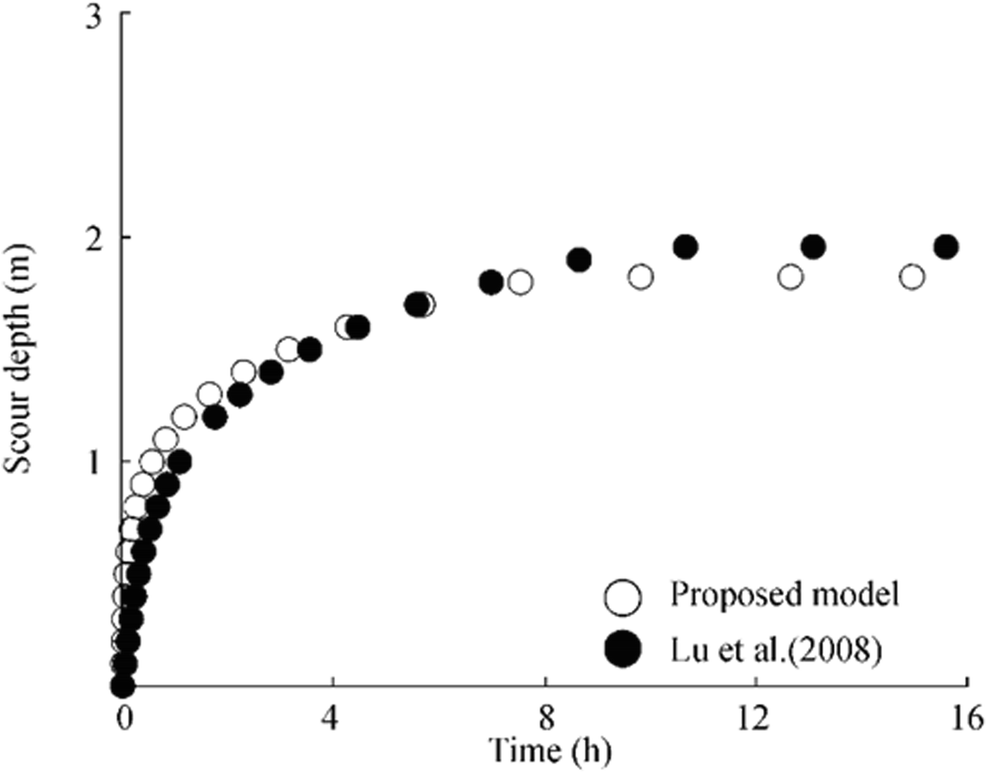 Figure 18 Time variation of local scour depth of proposed model with Lu et al. (2008)
5 Conclusions
The scour characteristic at submerged circular cylinders was studied. The process similar to live bed scour was noticed around the downstream cylinder. The process led to the temporary reduction of the scour depth, though finally reaching the equilibrium at the downstream cylinder. Present study also leads to the formulation of the equations for determining the diameter of the horseshoe vortex around the cylinders. The diameter of the horseshoe vortex is expressed in terms of diameter of respective cylinder, submergence ratio, spacing between the cylinders and skew angle. Furthermore, the variation of scour versus time at the submerged cylinders is modeled using the concept of dislodgement and transportation of a single sediment particle. The results show that although the upstream cylinder acts as a shield for the tandem arrangement, but the downstream cylinder is exposed to the unobstructed flow at 20° skew angles. The non-uniformity of the sediment particles is also included in the proposed model using an equivalent size of the non-uniform particles. The results show considerable reduction of scour depth of around 6% and 35% for upstream and downstream cylinders respectively due to the formation of the armor layer. The proposed model is also compared with the local scour component of reported field data to establish the differences that exist in the scour process around a partially submerged cylinder with that around fully submerged cylinders. However, it is pertinent to mention that the measured data and the results are only for the scour around tandem and skewed fully submerged cylinders. Hence, detailed studies are required to determine the vortex diameter around bodies of various shapes and sizes. Also, further experiments are required to quantify the influence of ratio of the cylinder diameters on scour around the submerged group of cylinders.
-
Figure 1 Schematic representation of the plan view for tandem (a) and skewed (b) cylinder with ADV measurement sections
Figure 2 Uniform (a) and non-uniform (b) sediment grain size distribution curve
Figure 3 Photographs showing dye injection around upstream and downstream cylinders
Figure 4 Schematic of vortex formation around tandem cylinders on sediment bed
Figure 5 Velocity vector field around tandem cylinders on sediment bed
Figure 6 Sensitivity analysis of non-dimensional vortex diameter with respect to input parameters of the proposed model
Figure 7 Algorithm for calculation of time variation of scour depth around tandem and skewed submerged cylinders
Figure 8 Time variation of scour depth for a upstream and b downstream cylinders arranged in tandem configurations with uniform sediments
Figure 9 Time variation of scour depth for a upstream and b downstream cylinders arranged in skewed configurations with uniform sediments
Figure 10 Comparison of results of Zhao et al. (2010) with the developed model
Figure 11 Time variation of scour depth for a upstream and b downstream cylinders arranged in tandem configurations with non-uniform sediments
Figure 12 Time variation of scour depth for a upstream and b downstream cylinders arranged in skewed configurations with non-uniform sediments
Figure 13 Time variation of scour depth for various runs with c, d uniform and a, b non-uniform sediments around downstream cylinder
Figure 14 Time variation of scour depth with different equivalent diameter expressions
Figure 15 Scour depth geometry around submerged a tandem and b skewed circular cylinders
Figure 16 Schematic of time scale used for upstream and downstream cylinder
Figure 17 Variation of time scales versus densimetric Froude number
Figure 18 Time variation of local scour depth of proposed model with Lu et al. (2008)
Table 1 Experimental parameters for uniform sediments
No. D1
(mm)D2
(mm)σg d50
(mm)U
(m/s)d
(mm)Uc
(m/s)ds1
(mm)ds2
(mm)No. D1
(mm)D2
(mm)σg d50
(mm)U
(m/s)d
(mm)Uc
(m/s)ds1
(mm)ds2
(mm)α = 0 R1 50 50 1.2 1.6 0.36 225 0.50 51 46 R18 75 75 1.2 1.6 0.42 240 0.59 33 22 R2 75 75 1.2 1.6 0.42 220 0.58 53 38 R19 75 75 1.2 1.85 0.42 220 0.62 38 27 R3 30 30 1.2 1.6 0.42 240 0.59 52 33 R20 75 75 1.2 1.6 0.42 200 0.57 49 37 R4 30 30 1.2 0.91 0.36 220 0.45 38 32 R21 75 75 1.2 1.6 0.42 190 0.57 67 58 R5 30 30 1.2 1.6 0.42 190 0.57 73 62 R22 75 75 1.2 1.6 0.36 220 0.58 29 21 R6 30 30 1.2 1.6 0.48 220 0.58 71 53 R23 30 50 1.2 1.6 0.36 225 0.50 43 41 R7 30 30 1.2 1.6 0.42 220 0.58 62 44 R24 30 75 1.2 0.43 0.14 240 0.20 32 26 R8 30 30 1.2 1.6 0.36 220 0.58 38 32 R25 30 75 1.2 0.43 0.14 220 0.20 36 29 R9 30 30 1.2 1.6 0.36 260 0.59 22 17 R26 30 75 1.2 0.43 0.14 200 0.20 42 37 R10 30 75 1.2 1.6 0.42 260 0.59 42 38 R27 30 75 1.2 0.43 0.14 190 0.19 49 38 R11 30 75 1.2 1.6 0.42 240 0.59 51 42 R28 30 75 1.2 1.85 0.42 220 0.62 31 28 R12 30 75 1.2 1.6 0.42 220 0.58 54 48 R29 30 75 1.2 1.85 0.48 220 0.62 42 33 R13 30 75 1.2 1.6 0.42 200 0.57 58 52 R30 30 75 1.2 1.85 0.36 220 0.62 29 23 R14 30 75 1.2 1.6 0.42 190 0.57 68 64 R31 30 75 1.2 0.91 0.36 240 0.45 32 26 R15 30 75 1.2 1.6 0.42 220 0.58 52 43 R32 30 75 1.2 0.91 0.36 220 0.45 33 29 R16 30 75 1.2 1.6 0.48 220 0.58 68 66 R33 30 75 1.2 0.91 0.36 200 0.45 35 31 R17 30 75 1.2 1.6 0.36 220 0.58 28 23 α = 10° R34 30 30 1.2 1.6 0.42 240 0.59 25 36 R46 30 75 1.2 1.6 0.36 220 0.58 29 32 R35 30 30 1.2 1.6 0.42 220 0.58 38 46 R47 75 75 1.2 1.6 0.42 240 0.59 28 31 R36 30 30 1.2 1.6 0.42 200 0.57 48 57 R48 75 75 1.2 1.6 0.42 200 0.57 39 43 R37 30 30 1.2 1.6 0.42 190 0.57 55 61 R49 75 75 1.2 1.6 0.42 226 0.58 37 48 R38 30 30 1.2 1.6 0.36 220 0.58 28 33 R50 75 75 1.2 1.6 0.42 225 0.57 53 64 R39 30 30 1.2 1.6 0.36 260 0.59 32 23 R51 75 75 1.2 1.6 0.36 220 0.58 28 33 R40 30 30 1.2 1.6 0.42 220 0.58 36 39 R52 75 75 1.2 1.6 0.48 220 0.58 32 41 R41 30 75 1.2 1.6 0.42 240 0.59 25 31 R53 75 75 1.2 1.6 0.42 220 0.58 36 39 R42 30 75 1.2 1.6 0.42 200 0.57 38 46 R54 30 75 1.2 0.43 0.14 240 0.20 29 33 R43 30 75 1.2 1.6 0.42 220 0.58 32 46 R55 30 75 1.2 0.43 0.14 220 0.20 33 37 R44 30 75 1.2 1.6 0.42 190 0.57 52 58 R56 30 75 1.2 0.43 0.14 200 0.20 39 43 R45 30 75 1.2 1.6 0.48 220 0.58 69 81 R57 30 75 1.2 0.43 0.14 190 0.19 43 49 α = 20° R58 30 50 1.2 1.6 0.36 225 0.50 39 44 R68 30 75 1.2 1.6 0.42 220 0.58 42 53 R59 30 30 1.2 1.6 0.36 220 0.58 27 32 R69 30 75 1.2 1.6 0.42 200 0.57 46 58 R60 30 30 1.2 1.6 0.42 260 0.59 21 26 R70 30 75 1.2 1.6 0.42 190 0.57 67 78 R61 30 30 1.2 1.6 0.42 240 0.59 33 38 R71 30 75 1.2 1.6 0.42 220 0.58 45 53 R62 30 30 1.2 1.6 0.42 200 0.57 48 52 R72 30 75 1.2 1.6 0.48 220 0.58 78 89 R63 30 30 1.2 1.6 0.42 190 0.57 58 63 R73 30 75 1.2 1.6 0.36 220 0.58 27 32 R64 30 30 1.2 1.6 0.48 220 0.58 47 53 R74 30 75 1.2 0.43 0.14 240 0.20 32 38 R65 30 30 1.2 1.6 0.36 225 0.50 47 38 R75 30 75 1.2 0.43 0.14 220 0.20 37 43 R66 30 75 1.2 1.6 0.42 260 0.59 26 34 R76 30 75 1.2 0.43 0.14 200 0.20 42 48 R67 30 75 1.2 1.6 0.42 240 0.59 32 46 R77 30 75 1.2 0.43 0.14 190 0.19 47 53 α = 30 R78 30 30 1.2 1.6 0.42 240 0.59 32 43 R81 30 30 1.2 1.6 0.42 190 0.57 57 65 R79 30 30 1.2 1.6 0.42 220 0.58 36 48 R82 30 30 1.2 1.6 0.42 220 0.58 21 32 R80 30 30 1.2 1.6 0.42 200 0.57 39 51 α = 40 R83 30 30 1.2 1.6 0.42 240 0.59 33 45 R87 30 30 1.2 1.6 0.48 220 0.58 48 59 R84 30 30 1.2 1.6 0.42 220 0.58 38 56 R88 30 30 1.2 1.6 0.36 220 0.58 34 52 R85 30 30 1.2 1.6 0.42 200 0.57 42 53 R89 30 30 1.2 1.6 0.36 260 0.59 32 42 R86 30 30 1.2 1.6 0.42 190 0.57 53 62 R90 30 30 1.2 1.6 0.42 220 0.58 33 43 Table 2 Experimental parameters for non-uniform sediments
No. D1
(mm)D2
(mm)σg d50
(mm)U
(m/s)d
(mm)α
(°)Uc
(m/s)ds1
(mm)ds2
(mm)R91 50 50 1.72 1.9 0.36 225 0 0.58 48 31 R92 30 50 2.30 0.65 0.36 225 0 0.68 52 39 R93 50 50 1.92 1.2 0.36 225 0 0.62 45 37 R94 30 50 1.92 1.2 0.36 225 0 0.62 41 26 R95 50 50 2.30 0.65 0.36 225 0 0.68 48 36 R96 30 50 1.72 1.9 0.36 225 0 0.58 38 22 R97 50 50 1.92 1.2 0.36 225 10 0.62 53 57 R98 30 50 1.72 1.9 0.36 225 10 0.58 35 37 R99 50 50 1.72 1.9 0.36 225 10 0.58 49 52 R100 30 50 1.92 1.2 0.36 225 10 0.62 38 42 R101 50 50 2.30 0.65 0.36 225 10 0.68 54 58 R102 30 50 2.30 0.65 0.36 225 10 0.68 55 59 R103 30 50 1.72 1.9 0.36 225 20 0.58 37 42 R104 30 50 1.92 1.2 0.36 225 20 0.62 38 47 R105 30 50 2.30 0.65 0.36 225 20 0.68 55 62 -
Abad JD, Rhoads BL, Guneralp I, Garcia MH (2008) Flow structure at different stages in a meander bend with bend way weirs. J Hydraul Eng 134(8): 1052–1063. https://doi.org/10.1061/(ASCE)0733-9429(2008)134:8(1052) Albers CD (1997) Hydraulics of a three obstacle cluster in open channels. MSc thesis, University of Alberta, Edmonton, Alta, Canada Amini A, Melville BW, Ali TM, Ghazali AH (2012) Clear water local scour around pile groups in shallow water flow. J Hydraul Eng 138(2): 177–185. https://doi.org/10.1061/(asce)hy.1943-7900.0000488 Ataie-Ashtiani B, Beheshti AA (2006) Experimental investigation of clear water local scour at pile groups. J Hydraul Eng 132(10): 1100–1104. https://doi.org/10.1061/(asce)0733-9429(2006)132:10(1100) Ataie-Ashtiani B, Kordkandi AA (2012) Flow field around side-by-side piers with and without a scour hole. Euro J Mech-B/Fluids 36: 152–166. https://doi.org/10.1016/j.euromechflu.2012.03.007 Azamathulla HM, Guven A, Demir YK (2011) Linear genetic programming to scour below submerged pipeline. Ocean Eng 38(8): 995–1000. https://doi.org/10.1016/j.oceaneng.2011.03.005 Azamathulla HM, Yusoff MAM, Hasan ZA (2014) Scour below submerged skewed pipeline. J Hydrol 509: 615–620. https://doi.org/10.1016/j.jhydrol.2013.11.058 Bauri KP, Sarkar A (2016) Flow and scour around vertical submerged structures. Sadhana 41(9): 1039–1053. https://doi.org/10.1007/s12046-016-0539-y Boujia N, Schmidt F, Siegert D, Bang DPV, Chevalier C (2017) Modeling of a bridge pier subjected to scour. Procedia Eng 199: 2925–2930. https://doi.org/10.1016/j.proeng.2017.09.343 Chang WY, Lai JS, Yen CL (2004) Evolution of scour depth at circular bridge piers. J Hydraul Eng 130(9): 905–913. https://doi.org/10.1061/(ASCE)0733-9429(2004)130:9(905) Chiew YM, Lim SY (2003) Protection of bridge piers using a sacrificial sill. Proc Inst Civ Eng-Water Marti Eng 156(1): 53–62. https://doi.org/10.1680/wame.2003.156.1.53 Chiew YM, Melville BW (1987) Local scour around bridge piers. J Hydraul Res 25(1): 15–26. https://doi.org/10.1080/00221688709499285 Dey S, Raikar RV, Roy A (2008) Scour at submerged cylindrical obstacles under steady flow. J Hydraul Eng 134(1): 105–109. https://doi.org/10.1061/(ASCE)0733-9429(2008)134:1(105) Dixen M, Sumer BM, Fredsøe J (2013) Numerical and experimental investigation of flow and scour around a half buried sphere. Coast Eng 73: 84–105. https://doi.org/10.1016/j.coastaleng.2012.10.006 Gao YY, Etienne S, Wang X, Tan SK (2014) Experimental study on the flow around two tandem cylinders with unequal diameters. J Ocean Univ China 13: 761–770. https://doi.org/10.1007/s11802-014-2377-z Hannah C (1978) Scour at pile groups. In: Research Report. University of Canterbury, Christchurch, pp 28–33 Haque MA, Rahman MM, Islanm GT, Hussain MA (2007) Scour mitigation at bridge piers using sacrificial piles. Intern J Sedime Res 22(1): 49–59 Hjorth P (1977) A stochastic model for progressive scour. In: Proc. IAHR Symposium on stochastic hydraulics. Lund, Sweden, 365–383 Keshavarzi A, Shrestha CK, Zahedani MR, Ball J, Khabbaz H (2017) Experimental study of flow structure around two in-line bridge piers. Proc Inst Civ Eng-Water Manag 171(6): 311–327. https://doi.org/10.1680/jwama.16.00104 Keshavarzi A, Shrestha CK, Melville B, Khabbaz H, Zahedani MR, Ball J (2018) Estimation of maximum scour depths at upstream of front and rear piers for two in-line circular columns. Environ Fluid Mech 18(2): 537–550. https://doi.org/10.1007/s10652-017-9572-6 Khaple SK, Hanmaiahgari PR, Gaudio R, Dey S (2017) Interference of an upstream pier on local scour at downstream piers. Acta Geophys 65(1): 29–46. https://doi.org/10.1007/s11600-017-0004-2 Kothyari UC, Kumar A (2012) Temporal variation of scour around circular compound piers. J Hydraul Eng 138(11): 945–957. https://doi.org/10.1061/(asce)hy.1943-7900.0000593 Kothyari UC, Ranga Raju KG, Garde RJ (1992a) Live bed scour around cylindrical bridge piers. J Hydraul Res 30(5): 701–715. https://doi.org/10.1080/00221689209498889 Kothyari UC, Garde RJ, Ranga Raju KG (1992b) Temporal variation of scour around circular bridge piers. J Hydraul Eng 118(8): 1091–1106. https://doi.org/10.1061/(asce)0733-9429(1992)118:8(1091) Lanca R, Fael C, Maia R, Pego J, Cardoso AH (2013) Clear water scour at pile groups. J Hydraul Eng 139(10): 1089–1098. https://doi.org/10.1061/(ASCE)HY.1943-7900.0000770 Lu JY, Hong JH, Su CC, Wang CY, Lai JS (2008) Field measurements and simulation of bridge scour depth variations during floods. J Hydraul Eng 134(6): 810–821. https://doi.org/10.1061/(ASCE)0733-9429(2008)134:6(810) Lu JY, Shi ZZ, Hong JH, Lee JJ, Raikar VK (2011) Temporal variation of scour depth at non-uniform cylindrical piers. J Hydraul Eng 137(1): 45–56. https://doi.org/10.1061/(asce)hy.1943-7900.0000272 Melville BW (1975) Local scour at bridge sites. University of Auckland, New Zealand, Report No. 117 Melville BW, Chiew YM (1999) Time scale for local scour at bridge piers. J Hydraul Eng 125(1): 59–65. https://doi.org/10.1061/(asce)0733-9429(1999)125:1(59) Melville BW, Hadfield AC (1999) Use of sacrificial piles as pier scour countermeasures. J Hydraul Eng 125(11): 1221–1224. https://doi.org/10.1061/(asce)0733-9429(1999)125:11(1221) Melville BW, Raudkivi AJ (1996) Effects of foundation geometry on bridge pier scour. J Hydraul Eng 122(4): 203–209. https://doi.org/10.1061/(asce)0733-9429(1996)122:4(203) Mia MF, Nago H (2003) Design method of time dependent local scour at circular bridge pier. J Hydraul Eng 129(6): 420–427. https://doi.org/10.1061/(asce)0733-9429(2003)129:6(420) Muzzammil M, Gangadharaiah T (2003) The mean characteristics of horseshoe vortex at a cylindrical pier. J Hydraul Res 41(3): 285–297. https://doi.org/10.1080/00221680309499973 Narayana PL, Timbadiya PV, Patel PL (2020) Bed level variations around submerged tandem bridge piers in sand beds. ISH J Hydraul Eng. https://doi.org/10.1080/09715010.2020.1723138 Nezu I, Rodi W (1986) Open channel flow measurements with a Laser Doppler Anemometer. J Hydraul Eng 112(5): 335–355. https://doi.org/10.1061/(asce)0733-9429(1986)112:5(335) Oliveto G, Hager WH (2005) Further results to time-dependent local scour at bridge elements. J Hydraul Eng 131(2): 97–105. https://doi.org/10.1061/(asce)0733-9429(2005)131:2(97) Paintal AS (1971) A stochastic model of bed load transport. J Hydraul Res 9(1): 91–109. https://doi.org/10.1080/00221687109500371 Pandey M, Azamathulla HM, Chaudhuri S, Pu JH, Pourshahbaz H (2020) Reduction of time-dependent scour around piers using collars. Ocean Eng 213: 107692. https://doi.org/10.1016/j.oceaneng.2020.107692 Pournazeri S, Li S, Haghighat F (2014) A bridge pier scour model with non-uniform sediments. Proc Inst Civ Eng-Water Manag 167(9): 499–511. https://doi.org/10.1680/wama.13.00094 Rout A, Sarkar A (2019) Local scour around submerged tandem and offset cylinders due to change in alignment angle. Proc Inst Civ Eng-Water Manag 173(1): 14–30. https://doi.org/10.1680/jwama.18.00030 Sadeque MAF, Rajaratnam N, Loewen MR (2008) Flow around cylinders in open channels. Eng Mech 134(1): 60–71. https://doi.org/10.1061/(asce)0733-9399(2008)134:1(60) Salim M, Jones JS (1996) Scour around exposed pile foundations. Compilation of Conference Scour Papers (1991-998), ASCE, Reston Sarkar A (2014) Scour and flow around submerged structures. Proc Inst Civ Eng-Water Manag 167(2): 65–78. https://doi.org/10.1680/wama.12.00117 Selamoglu M (2015) Modelling temporal variation of scouring at dual bridge piers. PhD Thesis, Middle East Technical University, Turkey Shamloo H, Rajaratnam N, Katopodis C (2001) Hydraulics of simple habitat structures. J Hydraul Res 39(4): 351–366. https://doi.org/10.1080/00221680109499840 Shen HW, Ogawa Y, Karaki S (1965) Time variation of bed deformation near the bridge piers. In: Proc 11th IAHR Congress, Leningrad, Russia, 3-14 Simarro G, Fael C, Cardoso AH (2011) Estimating equilibrium scour depth at cylindrical piers in experimental studies. J Hydraul Eng 137(9): 1089–1093. https://doi.org/10.1061/(asce)hy.1943-7900.0000410 Tajari M, Dehghani AA, Halaghi MM, Azamathulla HM (2020) Use of bottom slots and submerged vanes for controlling sediment upstream of duckbill weirs. Water Supply 20(8): 3393–3403. https://doi.org/10.2166/ws.2020.238 Tan SK, Yu G, Lim SY, Ong MC (2005) Flow structure and sediment motion around submerged vanes in open channel. J Waterw Port Coast Ocean Eng 131(3): 132–136. https://doi.org/10.1061/(asce)0733-950x(2005)131:3(132) Truelsen C, Sumer BM, Fredsøe J (2005) Scour around spherical bodies and self burial. J Waterw Port Coast Ocean Eng 131(1): 1–13. https://doi.org/10.1061/(asce)0733-950x(2005)131:1(1) Unger J, Hager WH (2007) Down-flow and horseshoe vortex characteristics of sediment embedded bridge piers. Exp Fluids 42(1): 1–19. https://doi.org/10.1007/s00348-006-0209-7 Wang H, Tang H, Liu Q, Wang Y (2016) Local scouring around twin bridge piers in open channel flows. J Hydraul Eng 142(9): 1–8. https://doi.org/10.1061/(asce)hy.1943-7900.0001154 Wu S, Rajaratnam N (2000) A simple method for measuring shear stress on rough boundaries. J Hydraul Res 38(5): 399–401. https://doi.org/10.1080/00221680009498321 Wu B, Molinas A, Julien PY (2004) Bed material load computations for non-uniform sediments. J Hydraul Eng 130(10): 1002–1012. https://doi.org/10.1061/(asce)0733-9429(2004)130:10(1002) Yalin MS (1977) Mechanics of sediment transport, 2nd edn. Pergamon, Oxford Yanmaz AM, Altinbilek HD (1991) Study of time-dependent local scour around bridge piers. J Hydraul Eng 117(10): 1247–1268. https://doi.org/10.1061/(asce)0733-9429(1991)117:10(1247) Yilmaz M, Yanmaz AM, Koken M (2017) Clear water scour evolution at dual bridge piers. Can J Civ Eng 44(4): 298–307. https://doi.org/10.1139/cjce-2016-0053 Yusoff MAM, Azamathulla HM, Ghani AA (2016) Time variations of scour below submerged skewed pipelines. Mater Sci Eng 136(1): 012071. https://doi.org/10.1088/1757-899x/136/1/012071 Zhao M, Cheng L, Zang Z (2010) Experimental and numerical investigation of local scour around a submerged vertical circular cylinder in steady currents. Coast Eng 57(8): 709–721. https://doi.org/10.1016/j.coastaleng.2010.03.002