Numerical Analysis of the Effects of Periodic Gust Flow on the Wake Structure of Ventilated Supercavities
https://doi.org/10.1007/s11804-021-00192-4
-
Abstract
A computational model is established to investigate the effects of a periodic gust flow on the wake structure of ventilated supercavities. The effectiveness of the computational model is validated by comparing with available experimental data. Benefited from this numerical model, the vertical velocity characteristics in the entire flow field can be easily monitored and analyzed under the action of a gust generator; further, the unsteady evolution of the flow parameters of the closed region of the supercavity can be captured in any location. To avoid the adverse effects of mounting struts in the experiments and to obtain more realistic results, the wake structure of a ventilated supercavity without mounting struts is investigated. Unsteady changes in the wake morphology and vorticity distribution pattern of the ventilated supercavity are determined. The results demonstrate that the periodic swing of the gust generator can generate a gust flow and, therefore, generate a periodic variation of the ventilated cavitation number σ. At the peak σ, a re-entrant jet closure appears in the wake of the ventilated supercavity. At the valley σ, a twin-vortex closure appears in the wake of the ventilated supercavity. For the forward facing model, the twin vortex appears as a pair of centrally rolled-up vortices, due to the closure of vortex is affected by the structure. For the backward facing model, however, the twin vortex appears alternately as a pair of centrally rolled-up vortices and a pair of centrally rolled-down vortices, against the periodic gust flow.Article Highlights• The wake structure of ventilated supercavities against a periodic gust flow was investigated.• The change laws of the vortex in the forward facing model and the backward facing model were found.• A numerical model for solving the problem of the ventilated supercavity against a periodical gust was established. -
1 Introduction
In 1946, Reichardt (1946) first proposed the formation of supercavities by artificial ventilation. Researchers have since employed this technique to reduce the drag on underwater vehicles. This technique allows an underwater vehicle to be completely encapsulated within a ventilated supercavity. Because the density of air is far lower than that of water, the creation of a supercavity can reduce the frictional resistance of an underwater vehicle by more than 90%. Ceccio (2010) demonstrated that this technique has achieved a breakthrough in increasing the velocities of underwater vehicles. Besides, in contrast to natural supercavities formed by increasing the velocity, supercavities formed by artificial ventilation have no strict requirements for the velocities of underwater vehicles. At a low velocity, the wake of a supercavity exhibits various structures due to factors such as the incoming flow velocity and the air entrainment coefficient Cq. This is a central topic in the field of ventilated cavitation (Karn et al. 2016a, b).
Most studies on ventilated supercavities have been conducted under a steady incoming flow and have analyzed ventilated supercavities through water tunnel tests or numerical simulations. Karn et al. (2015) demonstrated that the instantaneous flow patterns inside a supercavity can lead to fluctuations in instantaneous cavitation number at the closure and cause a change in the supercavity closure mechanism. Cao et al. (2017) numerically studied the pressure distribution inside the supercavity for the steady incoming flow. The pressure distribution was significantly different for small Fr, while this pressure distribution tends to be uniform for larger Fr. Besides, the model strut performs a significant effect on the wake flow. Karn and Rosiejka (2017) compared the constrained closure model (CCM, or forward facing model, FFM) and the free closure model (FCM, or backward facing model, BFM). It was found that the advantage of the constrained closure model lies in the generation of a transparent supercavity, which can be useful for visualization of internal flows of a supercavity, while the free closure model is beneficial for studying nature and variation of supercavity closures such as a twin vortex, quad vortex, and re-entrant jet.
In reality, when a vehicle moves in shallow seawaters, changes of the morphology of the supercavity often happened due to the presence of waves. These changes will result in the formation of wetted areas on the vehicle and thereby cause hydrodynamic changes. The collapse of the supercavity can even destabilize the movement of the vehicle. Recently, researchers have begun focusing on this problem and investigating the multiphase flow characteristics of supercavities by creating unsteady incoming flow conditions for ventilated supercavities. Arndt et al. (2009) installed a gust generator composed of two hydrofoils in a water tunnel. A periodic gust flow was generated in the downstream flow domain by the reciprocating swing of the upstream hydrofoils. On this basis, they studied the generation of ventilated supercavities and the associated maintenance mechanisms in the presence of a steady incoming flow and a periodic gust flow. Through experiments, Lee et al. (2013, 2016) studied the morphological changes in a ventilated supercavity in the presence of a gust flow. They found that there was a decrease in the length of the supercavity after the swing frequency of the gust generator f increased to a certain extent. They also compared the effects of front and back mounting struts on ventilated supercavities. Sanabria et al. (2015) empirically studied the dynamic modelling and control of supercavitating vehicles. They found that in the presence of a gust flow, the disturbance on the cavitator of a vehicle was negligible, whereas the hydrodynamic force generated as a result of the disturbance on the stern of a vehicle could not be overlooked. Karn et al. (2015, 2016a, b) experimentally examined several modes of closures in the wake of a supercavity and the effects of the Froude number Fr and Cq on these modes of closure. They also analyzed the relationship between changes in the pressure inside and outside a supercavity and closure transition. Karn et al. (2016a, b) studied the effects of Cq, flow field velocity, cavitator scale, and flow unsteadiness on the generation and collapse of a ventilated supercavity. They noted that a gust flow reduced the bubble condensation efficiency and an increase in the amplitude of the gust resulted in a slight monotonic increase in Cq for the generation and collapse of a supercavity. Shao et al. (2018) found that a supercavity was prone to becoming unstable and collapsing when its distortion exceeded its size as a result of the increase in f; further, increasing Cq and the cavitator scale could inhibit the collapse of a supercavity. Due to the limits of experimental monitoring, it is relatively difficult to study the velocity distribution pattern of the entire gust flow field. In addition, placing experimental mounting struts upstream of the model affects the surface smoothness of the supercavity and renders the contour of the supercavity unclear, whereas placing experimental mounting struts downstream of the model affects the free closure of the wake of the supercavity.
The periodic gust flow is a hot topic in the field of ventilation cavitation. At present, the research is mainly focused on the shape of cavities and the pressure change inside and outside the cavity. Due to the limits of experimental conditions in the water tunnel, there are few researches on the detailed unsteady evolution of the wake structure of supercavities. In the present paper, the detailed unsteady evolution of ventilated supercavities under the action of periodic gust flow is carefully studied. The more realistic ventilated supercavities are illustrated by avoiding to placing the experimental mounting struts upstream of the model. The evolution of the wake structure of ventilated supercavities and the reason of wake structure transformation are emphatically investigated. The characteristics of the vorticity distribution in the wake of ventilated supercavities under the action of periodic gust flow are analyzed.
2 Mathematical Model and Validation
2.1 Governing equations
A study of the ventilated supercavities under a periodic gust flow is carried out by a CFD software FLUENT. In this study, the flow velocity is given based on a water tunnel test (Lee et al. 2013). Due to the relative flow velocity and active ventilation, the effects of natural cavitation are negligible (Yu et al. 2010). Based on the experience of Wang et al. (2018) in cavitation computation, a volume-of-fluid multiphase flow model is used to study ventilated cavitation.
1) Continuity equation:
$$ \frac{\partial {\rho}_m}{\partial t}+\frac{\partial \left({\rho}_m{u}_i\right)}{\partial {x}_i}=0 $$ (1) where ρm = αlρl + αgρg is the density of the mixed medium; αl and αg are the volume fractions of the liquid and gas, respectively (αl + αg = 1); ρl is the density of the liquid; ρl=998.2 kg/m3; ρg is the density of the gas; ρg=1.225 kg/m3; ui is the velocity component of the mixed medium in the i-axis direction in the Cartesian coordinate system; xi is the coordinate in the i-axis direction (i = 1, 2, or 3); and t is time.
2) Momentum equation:
$$ \frac{\partial \left({\rho}_m{u}_i\right)}{\partial t}+\frac{\partial \left({\rho}_m{u}_i{u}_j\right)}{\partial {x}_j}={\rho}_m{g}_i-\frac{\partial p}{\partial {x}_i}+\frac{\partial {\tau}_{ij}}{x_j} $$ (2) where gi is the component of the gravitational acceleration in the i-axis direction; p is pressure and is the viscous stress; μm = αlμl + αgμg is the viscosity of the mixed medium; μl and μg are the dynamic viscosities of the liquid and gas, respectively; uj and uk are the velocity components of the mixed medium in the j- and k-axis directions, respectively; and δij is the Kronecker sign.
3) Volume fraction equation:
$$ \frac{\partial {\alpha}_g}{\partial t}+\frac{\partial }{\partial {x}_i}\left({\alpha}_g{u}_i\right)=0 $$ (3) where αg is the volume fraction of gas; if the grid cell is filled with water, αg = 0; if the grid cell is filled with gas, αg = 1; if the grid cell contains a gas-water interface, 0 < αg < 1.
4) Turbulence equation:
Based on the method of Wang et al. (2018) for calculating ventilated cavitating flows, the renormalization group turbulence energy k–turbulence energy dissipation rate ε turbulence model is used in this simulation. This model can satisfactorily deal with flows with high strain rates and streamline curvatures and can be used to investigate the wake vortex structure of a supercavity. The transport equations for k and ε are as follows:
$$ \frac{\partial \left({\rho}_mk\right)}{\partial t}+\frac{\partial \left({\rho}_m{ku}_i\right)}{\partial {x}_i}=\frac{\partial }{\partial {x}_j}\left({\alpha}_k{\mu}_t\frac{\partial k}{\partial {x}_j}\right)+{G}_k+{G}_b-{\rho}_m\varepsilon $$ (4) $$ \frac{\partial \left({\rho}_m\varepsilon \right)}{\partial t}+\frac{\partial \left({\rho}_m\varepsilon {u}_i\right)}{\partial {x}_i}=\frac{\partial }{\partial {x}_j}\left({\alpha}_{\varepsilon }{\mu}_t\frac{\partial \varepsilon }{\partial {x}_j}\right)\\ \;\;\;\;\;\;\;\;\;\;\;\;\;\;\;\;\;\;\;\;\;\;\;\;\;\;\;+{C}_{1\varepsilon}\frac{\varepsilon }{k}\left({G}_k+{C}_{3\varepsilon }{G}_b\right)-{C}_{2\varepsilon }{\rho}_m\frac{\varepsilon^2}{k}-{R}_{\varepsilon } $$ (5) where αk and αε are the negative effect Prandtl numbers of k and ε, respectively (αk = αε ≈ 1.393); μt is the turbulent viscosity; Gk is the turbulent energy generated by the average velocity gradient ($ {G}_k={\mu}_t\left(\frac{\partial {u}_i}{\partial {x}_j}+\frac{\partial {u}_j}{\partial {x}_i}\right)\frac{\partial {u}_i}{\partial {x}_j} $); Gb is the turbulent energy generated by buoyancy ($ {G}_b=-{g}_i\frac{\mu_t}{0.85{\rho}_m}\cdot \frac{\partial {\rho}_m}{\partial {x}_i} $); C1ε, C2ε, and C3ε are constants; and Rε is an additional item that corrects for the accuracy of the shear flow.
2.2 Computational Flow Domain and Boundary Conditions
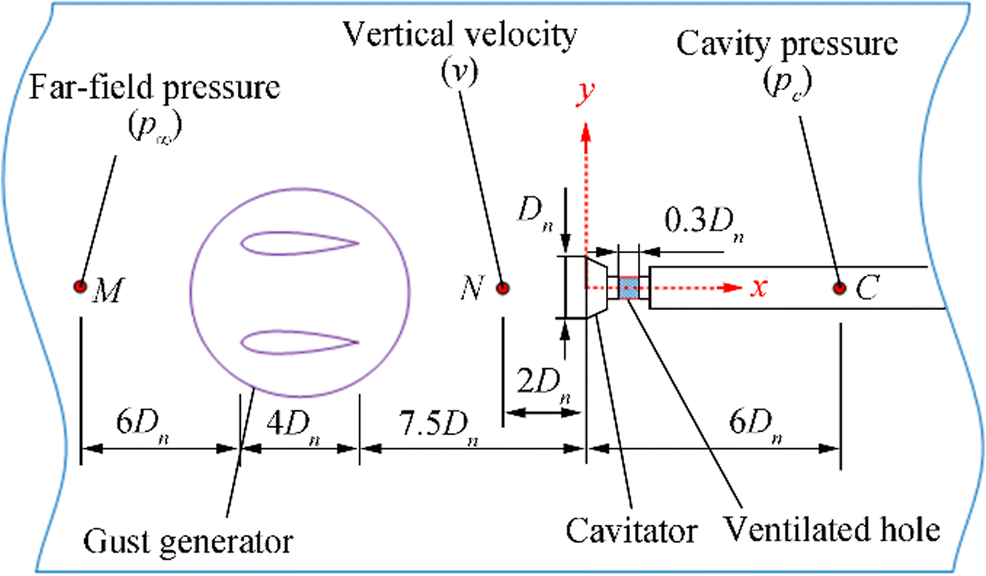
Figure 1 shows the arrangement of the cavitator and the gust generator in the flow domain. Based on water tunnel test conditions (Lee et al. 2013), the diameter of the cavitator Dn is set to 0.01 m. A circular air vent is placed behind the cavitator. The Cq value of the air vent is set to 0.15, Cq = Q/(u∞Dn2) = 0.15, where Q is the volume flow rate of air and u∞ = 8.34 m/s. The gust generator in front of the cavitator consists of two NACA-0020 hydrofoils and generates a gust flow downstream by swinging upstream in a cosine pattern. A far-field pressure monitoring point M is set up at a distance of 6Dn from the front of the gust generator. A vertical velocity monitoring point N is set up at a distance of 2Dn from the front of the cavitator. An internal supercavity pressure monitoring point C is set up at a distance of 6Dn from the back of the cavitator. In this study, the velocities in the x, y, and z directions in the flow domain are denoted by u, v, and w, respectively.
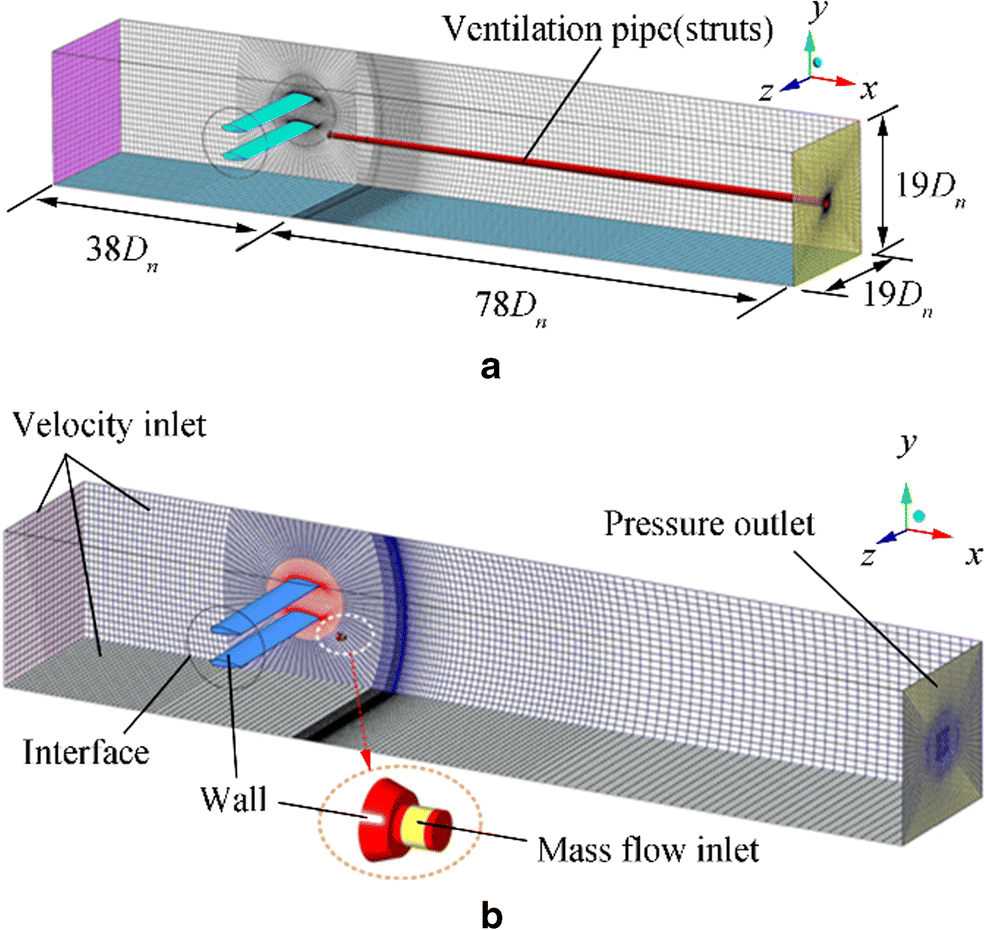
Figure 2 shows the boundary conditions for the computational domain. The flow domain scale in case 1 in Fig. 2a is the same as that in the test of Lee et al. (2013). The model in Fig. 2a contains a cavitator and ventilation pipe (struts). The flow domain scale in case 2 of Fig. 2b is the same as that in case 1. The model in Fig. 2b contains only a cavitator.
Wall-surface boundary conditions are used for the gust generator, the cavitator, and the struts inside the flow domain. Velocity-inlet boundary conditions are used for the left side and the surroundings of the flow domain. Pressure-outlet boundary conditions are used for the right side of the flow domain. Quality-inlet boundary conditions are used for the air vent. The peripheral cylindrical surface of the gust generator divides the computational domain into two regions (the inner region is marked by the red grid). These two regions are separated using a pair of cylindrical interfaces. When the gust generator swings, this pair of cylindrical interfaces slip relative to one another, whereas the grid cells within the two regions do not undergo deformation. The frequency, angular frequency, period, and rotational angular velocity of the gust generator are denoted by f, ω = 2πf, T0 = 1/f, and $ \dot{\theta}={\theta}_0\omega \cos \left(\omega\ t\right) $, respectively. The amplitude of the swing angle of the gust generator θ0 is ±6°. The pressure-based solver with Simplec solution methods is employed in the FLUENT setting based on structured grids using Quick discrete format.
2.3 Convergence Study
A hexahedrons grid is generated for the entire computational domain. The convergence studies with respect to the grid size and time step size were carried out. This study is conducted under inflow velocity u∞=8.34 m/s. The hydrofoils do not swing, and the cavitator model is set without ventilation condition. The value of time step, Δt, is 0.0001 s. The drag forces of the cavitator, FD, based on different grid quantities Ne are shown in Table 1, where relative error R refers to the difference between the current calculational results and the results of the maximum number of grids. CD is the drag coefficient of the cavitator, CD = FD/(0.5ρlu∞2An), where An is the front area of the cavitator. Table 1 indicates that when the number of grids is more than 980, 000, the drag coefficient is insensitive to the number of grids within its changes of 1%. So mesh C is used in the following paper.
Table 1 Verification of grid density convergenceMesh Ne(104) FD(N) CD R(%) Mesh A 68 3.749 1.375 17.52 Mesh B 83 3.441 1.262 7.86 Mesh C 98 3.193 1.171 0.08 Mesh D 115 3.190 1.170 0.00 Table 2 shows the calculated results of drag under four different time steps based on Mesh C. It indicates that when the time step is reduced to less than 0.0001 s, the relative error of the drag coefficient is within 1%. Considering the numerical accuracy and calculation efficiency, the time step of Time B is employed in the following study.
Table 2 Verification of time step convergenceTime step Δt(10−4 s) FD(N) CD R(%) Time A 0.5 3.187 1.169 0.00 Time B 1.0 3.190 1.170 0.08 Time C 2.0 3.231 1.185 1.37 Time D 5.0 3.253 1.193 2.05 2.4 Model Validation
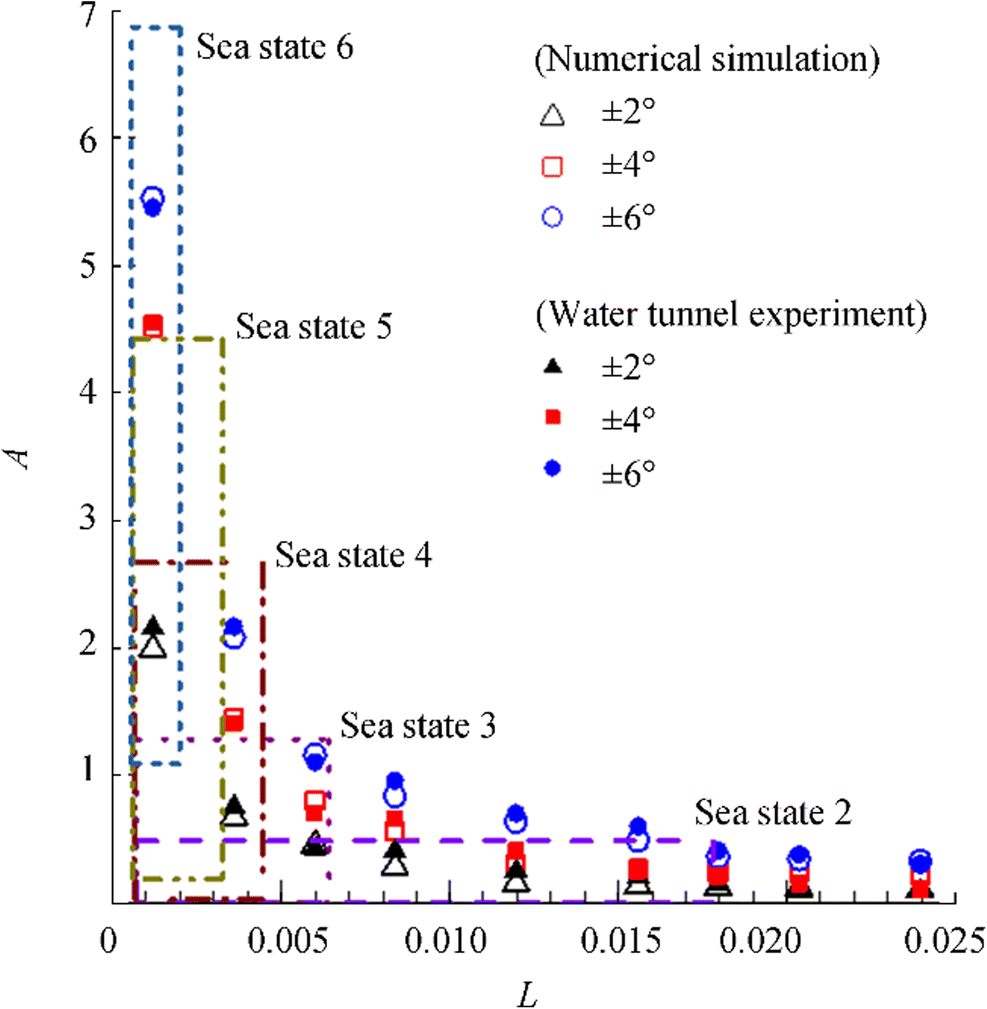
Figure 3 shows the comparison between the present numerical results and the experimental results in Lee et al. (2013). In Fig. 3, L and A are the dimensionless wavelength and amplitude, respectively.
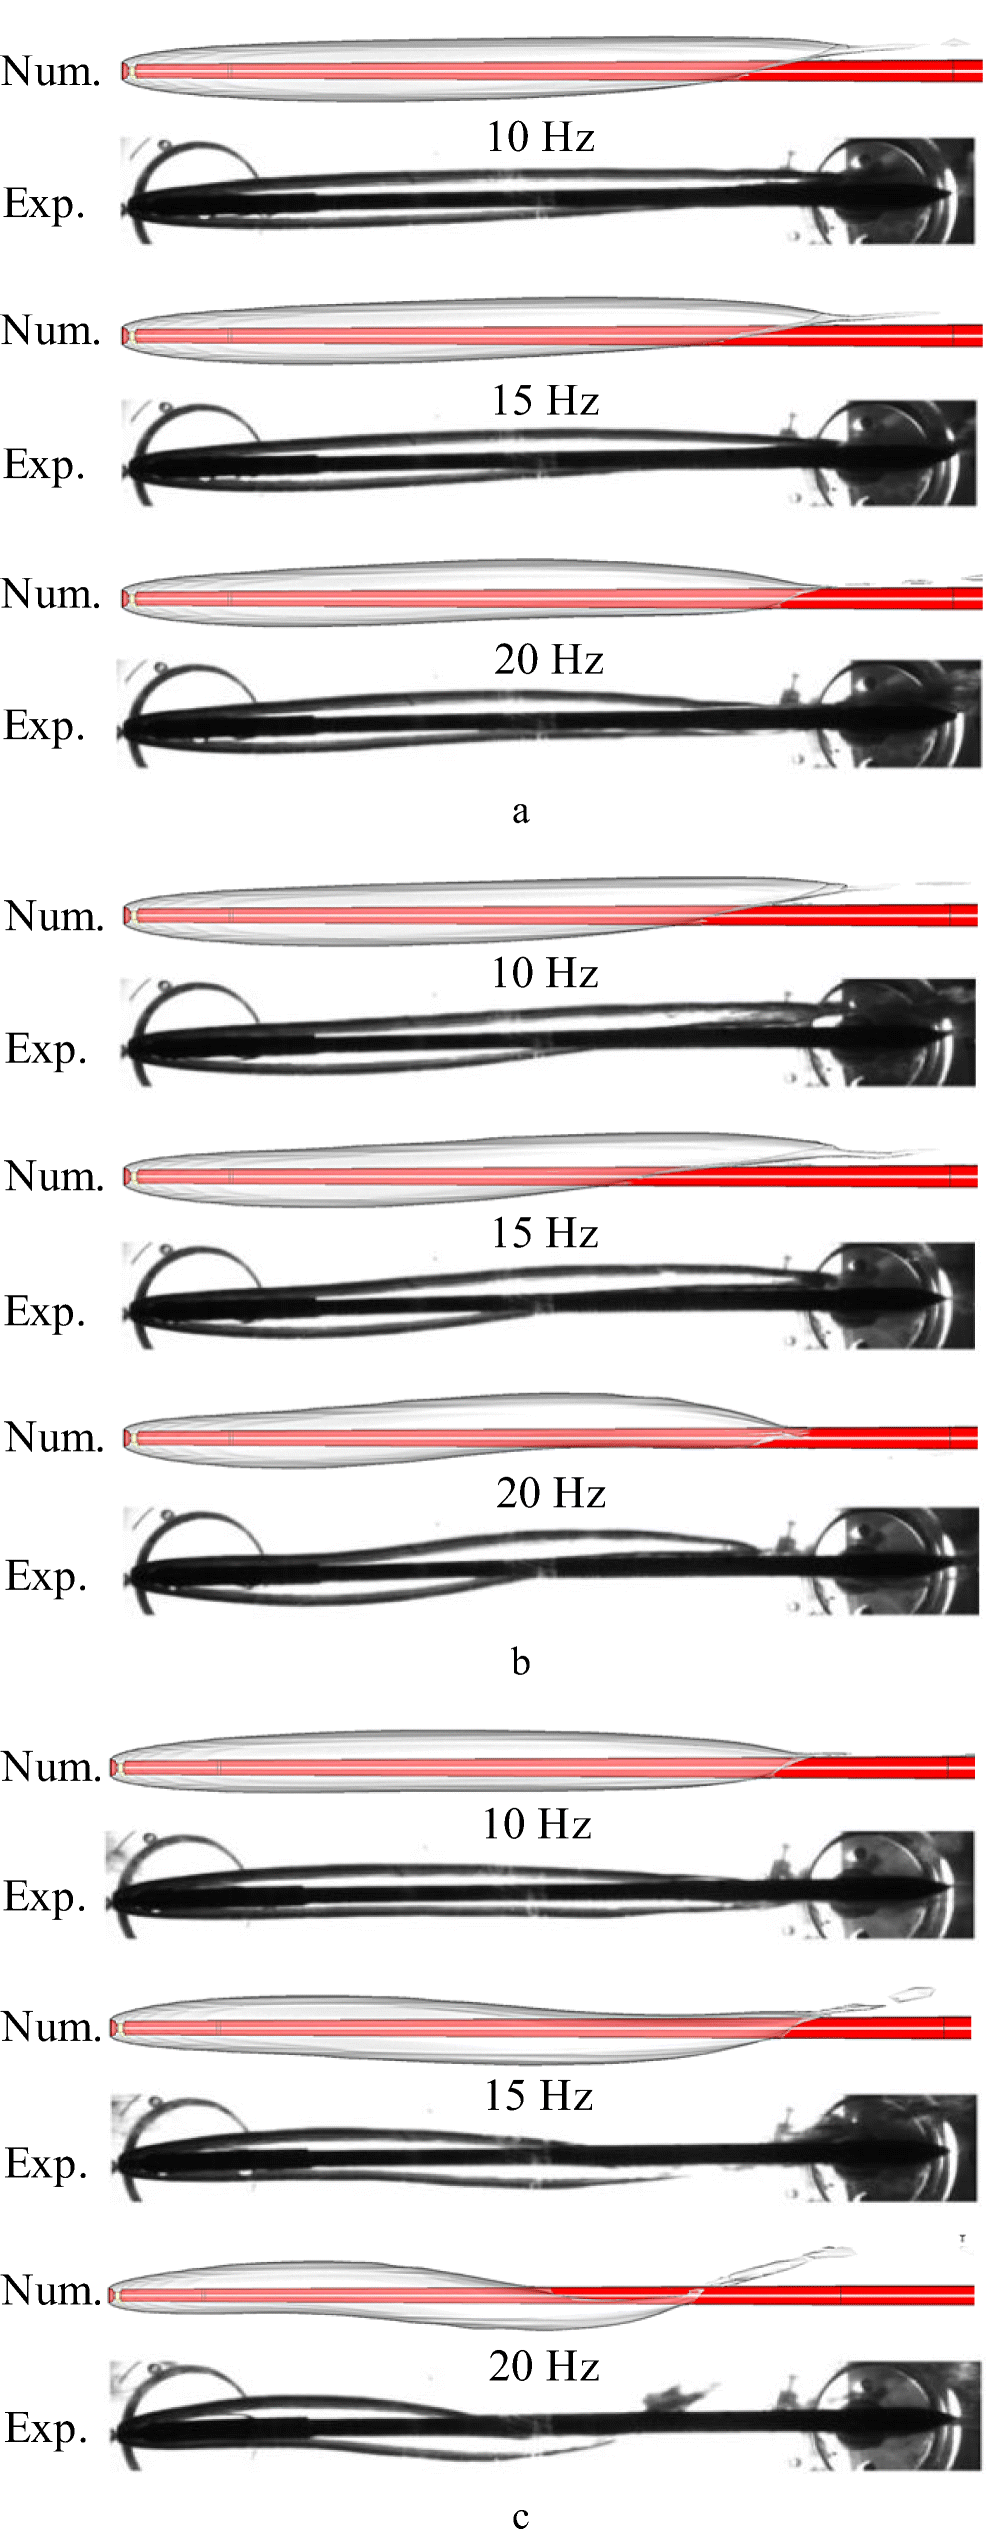
As demonstrated in Fig. 3, a good agreement between the present simulated results and the measurement can be observed. Figure 4 further compares the simulated morphological changes in the ventilated supercavity in the presence of a gust flow and the results obtained from the water tunnel test (the volume fraction of the surface of the supercavity is set to 50%). As demonstrated in Fig. 4, there is an agreement between the simulated morphological changes in the ventilated supercavity and the measured morphological changes in the ventilated supercavity. This finding adequately demonstrates the effectiveness of the numerical simulation method used in this study.
3 Computational Results and Analysis
3.1 Vertical Velocity Distribution in the Flow Domain
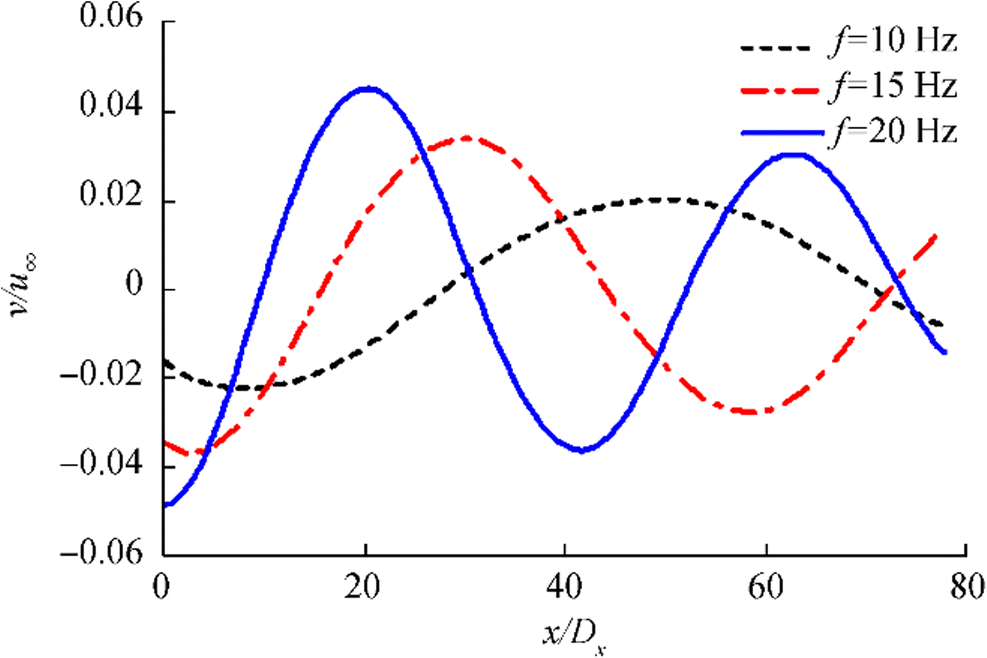
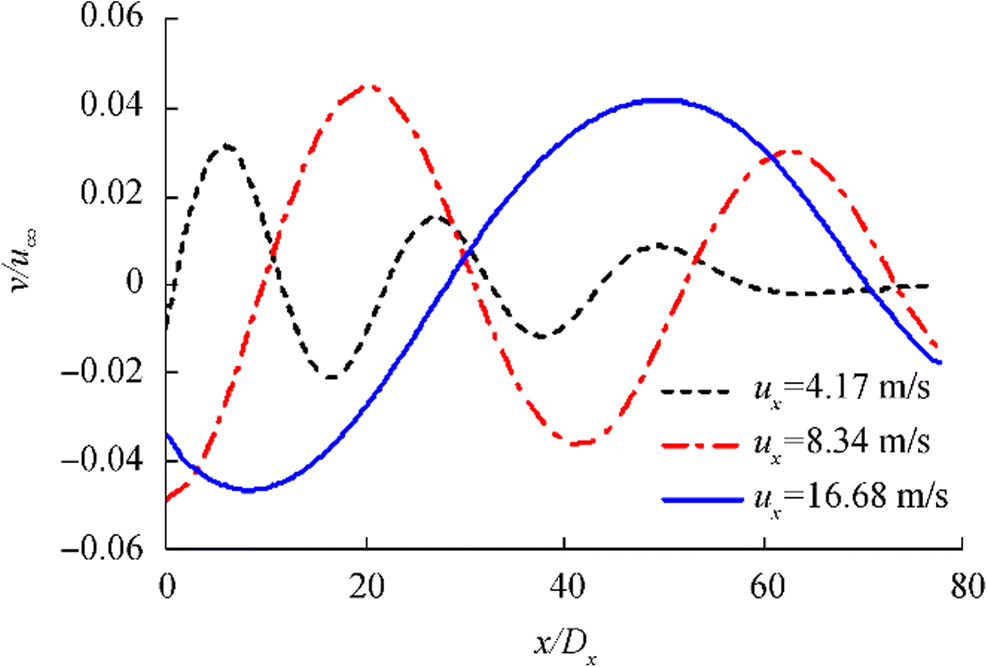
In this study, the wavelength λ in the flow domain is the ratio of u∞ to f, i.e., λ = u∞ / f. The wave amplitude in the flow domain often increases as θ0 increases (Lee et al. 2013). The vertical velocity in a gust flow field is the index parameter of most concern to researchers. Laser Doppler velocimetry is a single-point measurement technique that is inadequate for displaying the vertical velocity distribution pattern in the entire gust flow field during a water tunnel test. This issue can be satisfactorily addressed by numerical simulation. Without placing a model in the flow domain, a monitoring line is set up at the center of the flow domain along the flow direction to monitor the effects of the gust generator on the vertical velocity in the flow domain. After the gust generator has undergone several swing periods and the changes in the vertical velocity in the flow domain have stabilized, the vertical velocity distribution pattern on the monitoring line is examined when the hydrofoils are in the equilibrium position, as shown in Figs. 5 and 6.
As demonstrated in Fig. 5, when u∞ remains unchanged, the higher f is, the shorter λ is and the higher v/u∞ in the downstream flow field is. As demonstrated in Fig. 6, when f remains unchanged, the higher u∞ is, the longer λ is and higher v/u∞ in the downstream flow field is. As shown in Figs. 5 and 6, the wave amplitude decreases continuously downstream. The lower the velocity of the incoming flow is, the faster the attenuation is. The lower u∞ is, the faster v/u∞ decreases. This is because an incoming flow with a relatively high u∞ can rapidly transmit the disturbance energy generated by the gust generator to the downstream flow domain, resulting in the formation of a relatively high v/u∞. In comparison, at a relatively low u∞, the disturbance energy generated by the gust generator is lost inside the flow medium due to friction before being transmitted downstream.
3.2 Morphological Characteristics of the Wake of the Supercavity
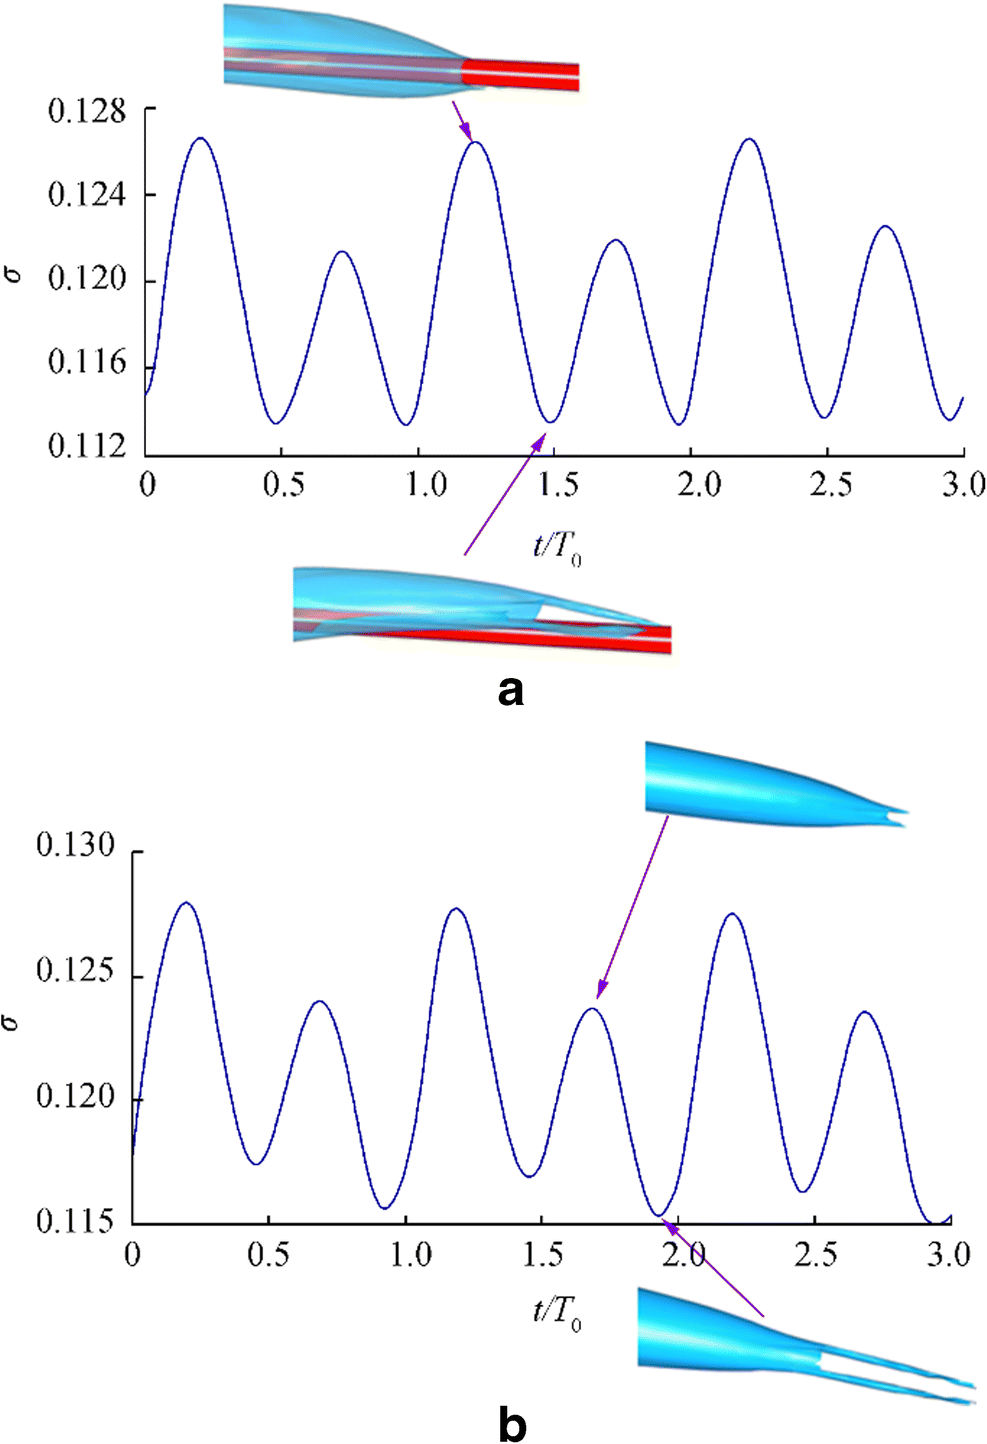
At a low Fr, air is leaked from the wake of a supercavity in a twin-vortex pattern in most cases. A detailed description of twin-vortex air leaking can be found elsewhere (Karn et al. 2016a, b). In this study, the wake structure of a supercavity in the presence of a gust flow is found to exhibit an interesting periodic variation pattern. The ventilated cavitation number σ is calculated as follows: σ = (p∞ − pc)/(0.5ρlu∞2), where p∞ is the far-field pressure and pc is the pressure inside the supercavity. Figure 7 shows the σ curve over three periods when T0 = 0.05 s and λ = 0.42 m.
As demonstrated in Fig. 7, σ fluctuates periodically under the action of the gust flow. In addition, there are two peak values and two valley values of σ within one period. This is because the hydrofoils of the gust generator reach the equilibrium position twice in one period. The maximum peak value of σ is different from its maximum valley value because the cavitator swings upward and downward at the equilibrium position, and there is a difference in the pressure disturbance generated by the hydrofoils of the gust generator on the flow domain when they swing upward and downward due to the environmental gravity factor. It takes a certain time for a water flow to move from the gust generator to the pressure monitoring point. Therefore, there is some phase difference between σ and the gust generator. Periodic air leaking in a twin-vortex pattern from the wake of the supercavity weakens as σ increases and strengthens as σ decreases. Twin-vortex air leaking from the wake of the supercavity fluctuates with σ.
Figure 8 shows a schematic of the mechanism of the closure of the wake of the supercavity to facilitate analysis. In Fig. 8, AT is the cross-sectional area of the flow domain, An is the front area of the cavitator, Ac is the cross-sectional area of the supercavity on the left side of the control volume V of the wake of the supercavity, uin is the velocity at which air enters V via the Ac plane, pRJ is the momentum of the re-entrant jet between the two vortices, Ao is the cross-sectional area of the two vortices, uout is the velocity at which air passes the Ao plane, ARJ is the cross-sectional area of the liquid re-entrant jet that enters the right side of V, uRJ is the velocity of the re-entrant jet, and pout is the pressure in the wake of the supercavity.
Through experiments, Karn et al. (2015) studied the relationship between the morphological change in the wake of a supercavity and the difference in pressure between the inside and outside of the supercavity. Based on the derivation method used by Karn et al. (2015), we further present the relationship between the momentum of the re-entrant jet in the wake of a supercavity and σ. Based on the momentum equations of fluid mechanics, we have

(6) where u is the flow velocity vector, n is the outer normal direction of the area differential element of the control volume, and ∑F is the resultant force exerted by the environment on the control volume. The far-field u∞ is constant, and u does not change with time. Therefore, $ \frac{\partial \left({\rho}_m\boldsymbol{u}\right)}{\partial t}=0 $. Thus, Eq. (6) is simplified as follows:

(7) Equation (7) demonstrates that the sum of the net momentum outflow from a control volume V within unit time equals the resultant force exerted by the environment on the control volume V. The sign for a moment outflow is "+", and the sign for a moment inflow is "-".
Based on the closure schematic of the ventilated supercavity in Fig. 8, Cao et al. (2017) pointed out that the pressure distribution becomes more uniform for larger Fr. Therefore, the pressure distribution inside the cavity is uniform in the present study (Fr = 26.6). According to Nesteruk's method (Nesteruk 2014), we assume that pc remains unchanged. The momentum equation for the control volume V in the closure region in the wake of the supercavity is derived from Eq. (7):
$$ {p}_c{A}_c-{p}_{\mathrm{out}}{A}_c=-{A}_c{\rho}_g{u_{in}}^2+{A}_o{\rho}_g{u_{\mathrm{out}}}^2-{A}_{RJ}{\rho}_l{u_{RJ}}^2 $$ (8) The morphology of the supercavity is relatively stable at this stage. In addition, the momentum of the air that enters the control volume in the wake of the supercavity is negligible when compared to the liquid (Karn et al. 2016a, b). Thus, Eq. (8) is simplified as follows:
$$ {p}_{\mathrm{out}}{A}_c-{p}_c{A}_c={A}_{RJ}{\rho}_l{u_{RJ}}^2 $$ (9) Similarly, the following momentum equation is given for the entire control volume between the two An interfaces:
$$ {p}_{\infty }{A}_T={F}_D+{p}_{\mathrm{out}}{A}_T=0.5{A}_n{\rho}_l{u}_{\infty}^2{C}_D+{p}_{\mathrm{out}}{A}_T $$ (10) By simplifying Eq. (10), we have
$$ {p}_{\mathrm{out}}={p}_{\infty }-0.5{A}_n{\rho}_l{u}_{\infty}^2{C}_D/{A}_T $$ (11) where FD is the drag of the cavitator and CD is the drag coefficient of the cavitator.
By substituting Eq. (11) into Eq. (9) and reorganizing the obtained equation, we have
$$ \frac{p_{\infty }-{p}_c}{0.5{\rho}_l{u_{\infty}}^2}-{C}_D\frac{A_n}{A_T}=\frac{A_{RJ}\rho {u_{RJ}}^2}{0.5{\rho}_l{u_{\infty}}^2{A}_c} $$ (12) (p∞ − pc)/(0.5ρlu∞2) = σ, CD = 0.82(1 + σ), An/AT = (Dn/DT)2 = B2, and ARJρluRJ2 = pRJ (where Dn is the diameter of the cavitator, DT is the hydraulic diameter of the flow domain, and B is the blockage ratio). By substituting these equations into Eq. (12), we have
$$ {p}_{RJ}=0.5{A}_c{\rho}_l{u_{\infty}}^2\left[\sigma \left(1-0.82{B}^2\right)-0.82{B}^2\right] $$ (13) When u∞ and Cq remain constant, p∞ and pc are relatively stable. Thus, σ is relatively stable. The periodic swing of the gust generator causes fluctuations in p∞ and pc, which thereby causes fluctuations in σ. In addition, the effect of the gust flow on the diameter of the supercavity is relatively nonsignificant (Lee et al. 2013). Thus, it can be considered that there is no significant change in Ac at this stage, the periodic change in σ causes fluctuations in pRJ, and the fluctuation in the re-entrant jet causes a periodic change in twin-vortex air leaking from the wake of the supercavity.
3.3 Characteristics of the Vorticity in the Wake of the Supercavity
The Froude number Fr is defined as follows: $ Fr={u}_{\infty }/\sqrt{gD_n} $. At a low Fr, air leaks in a twin-vortex pattern from the wake of a ventilated supercavity (Karn et al. 2016a, b). The Fr (26.6) and Cq (0.15) used in this study are within the test ranges for twin-vortex air leaking from a supercavity. Vorticity is defined as follows:
$$ \boldsymbol{\varOmega} =\left[{\varOmega}_x,{\varOmega}_y,{\varOmega}_z\right]=\left[\frac{\mathrm{\partial w}}{\partial y}-\frac{\partial v}{\partial z},\frac{\partial u}{\partial z}-\frac{\partial w}{\partial x},\frac{\partial v}{\partial x}-\frac{\partial u}{\partial y}\right] $$ (14) where Ωx, Ωy, and Ωz are the vortices in the x-, y-, and z-coordinate axis directions, respectively. The vorticity sign is determined according to the right-hand screw rule.
Lee et al. (2013) extensively studied the models with mounting struts and found that mounting struts affected the flow field in the wake of a supercavity. For this forward facing model, the pressure and the vorticity of the supercavity at three selected cross sections were calculated, as shown in Table 3. Among these three cross sections, the middle cross section is located at the cavity closure. The dimensionless pressure coefficient Cp is calculated as follows: Cp = (p − p∞)/(0.5ρlu∞2). From Table 3, it can be found that the ventilation pipe affects the free closure of the cavity, which leads to an alternate appearance of the re-entrant jet closure and the twin-vortex closure. Besides, the direction of the twin vortex is affected by the ventilation pipe, appearing as a pair of centrally rolled-up vortices.
Table 3 Pressure and vorticity distribution in the wake of the supercavity (FFM)
Supercavity formed by the artificial cavity is an effective way to reduce the resistance of underwater vehicle. For the forward facing model, the large bubbles formed at the periphery of the disk cavitator collided with the body present inside the supercavity (ventilation pipe) and underwent breakup events into bubbles of smaller size. Such breakup events inhibit the eventual coalescence, elongation of bubbles, and formation of a supercavity, and thus, larger air entrainment rates were required to produce sufficient bubbles to establish a supercavity (Karn and Rosiejka 2017). The vortex closure for the condition ignoring the body tail, especially for the models with free motion, is a usual research topic. To more accurately examine the wake of a supercavity, we focus on analyzing the wake of the supercavity generated by the cavitator alone. Three cross sections are selected at the closure of the wake of the supercavity, as shown in Fig. 9.
Table 4 summarizes the distribution contour plots of the pressure and vorticity Ωz at each of the selected cross sections of the wake of the supercavity.
Table 4 Pressure and vorticity distribution in the wake of the supercavity (BFM)
As demonstrated in Table 4, at t = 0.00T0 and t = 1.00T0, there is a twin-vortex closure in the wake of the ventilated supercavity. The high-pressure region of the wake of the supercavity consists of an upper subregion and a lower subregion. There is a pair of centrally rolled-up vortices in the vorticity direction in the wake. At t = 0.25T0 and t = 0.75T0, there is a re-entrant jet, a concentrated high-pressure region, and a quad-vortex flow field structure in the wake of the supercavity. At t = 0.50T0, there is a twin-vortex closure in the wake of the ventilated supercavity. There is a concentrated high-pressure region in the wake of the supercavity. In addition, there is primarily a pair of centrally rolled-down vortices in the wake of the supercavity. Due to the difference in the trend of the vertical movement of the wake of the supercavity in the gravity environment, there is a slight difference in the pressure and vorticity distribution between t = 0.50T0 and t = 1.00T0.
At a low Fr, a twin-vortex closure is naturally formed in the wake of the ventilated supercavity in the gravity environment (Karn et al. 2016a, b). The gust disturbance generated by the gust generator alters the pressure and flow velocity distribution in the flow field, which in turn alters the closure mode of the supercavity and the vorticity direction in the wake of the supercavity. A vortex is generally generated as a result of a difference in velocity. A further analysis can be performed based on the velocity distribution on the upper and lower surfaces of the supercavity. The curve up and curve down in Fig. 9 are lines of intersection between the upper and lower surfaces of the supercavity and the longitudinal plane of the flow domain (xoy plane), respectively. The circulation (Zhou 2013) around the closed contour of the entire supercavity on its longitudinal plane can be approximated as follows:
$$ \varGamma ={\oint}_l\boldsymbol{v}\cdot \mathrm{d}\boldsymbol{s}\approx {\int}_0^l\left({u}_2-{u}_1\right)\mathrm{d}x $$ (15) where v and s are the velocity and length vectors of the contour of the supercavity, respectively; l is the circumference of the contour of the supercavity; and u1 and u2 are the velocities on the curve up and curve down in the x-axis direction, respectively.
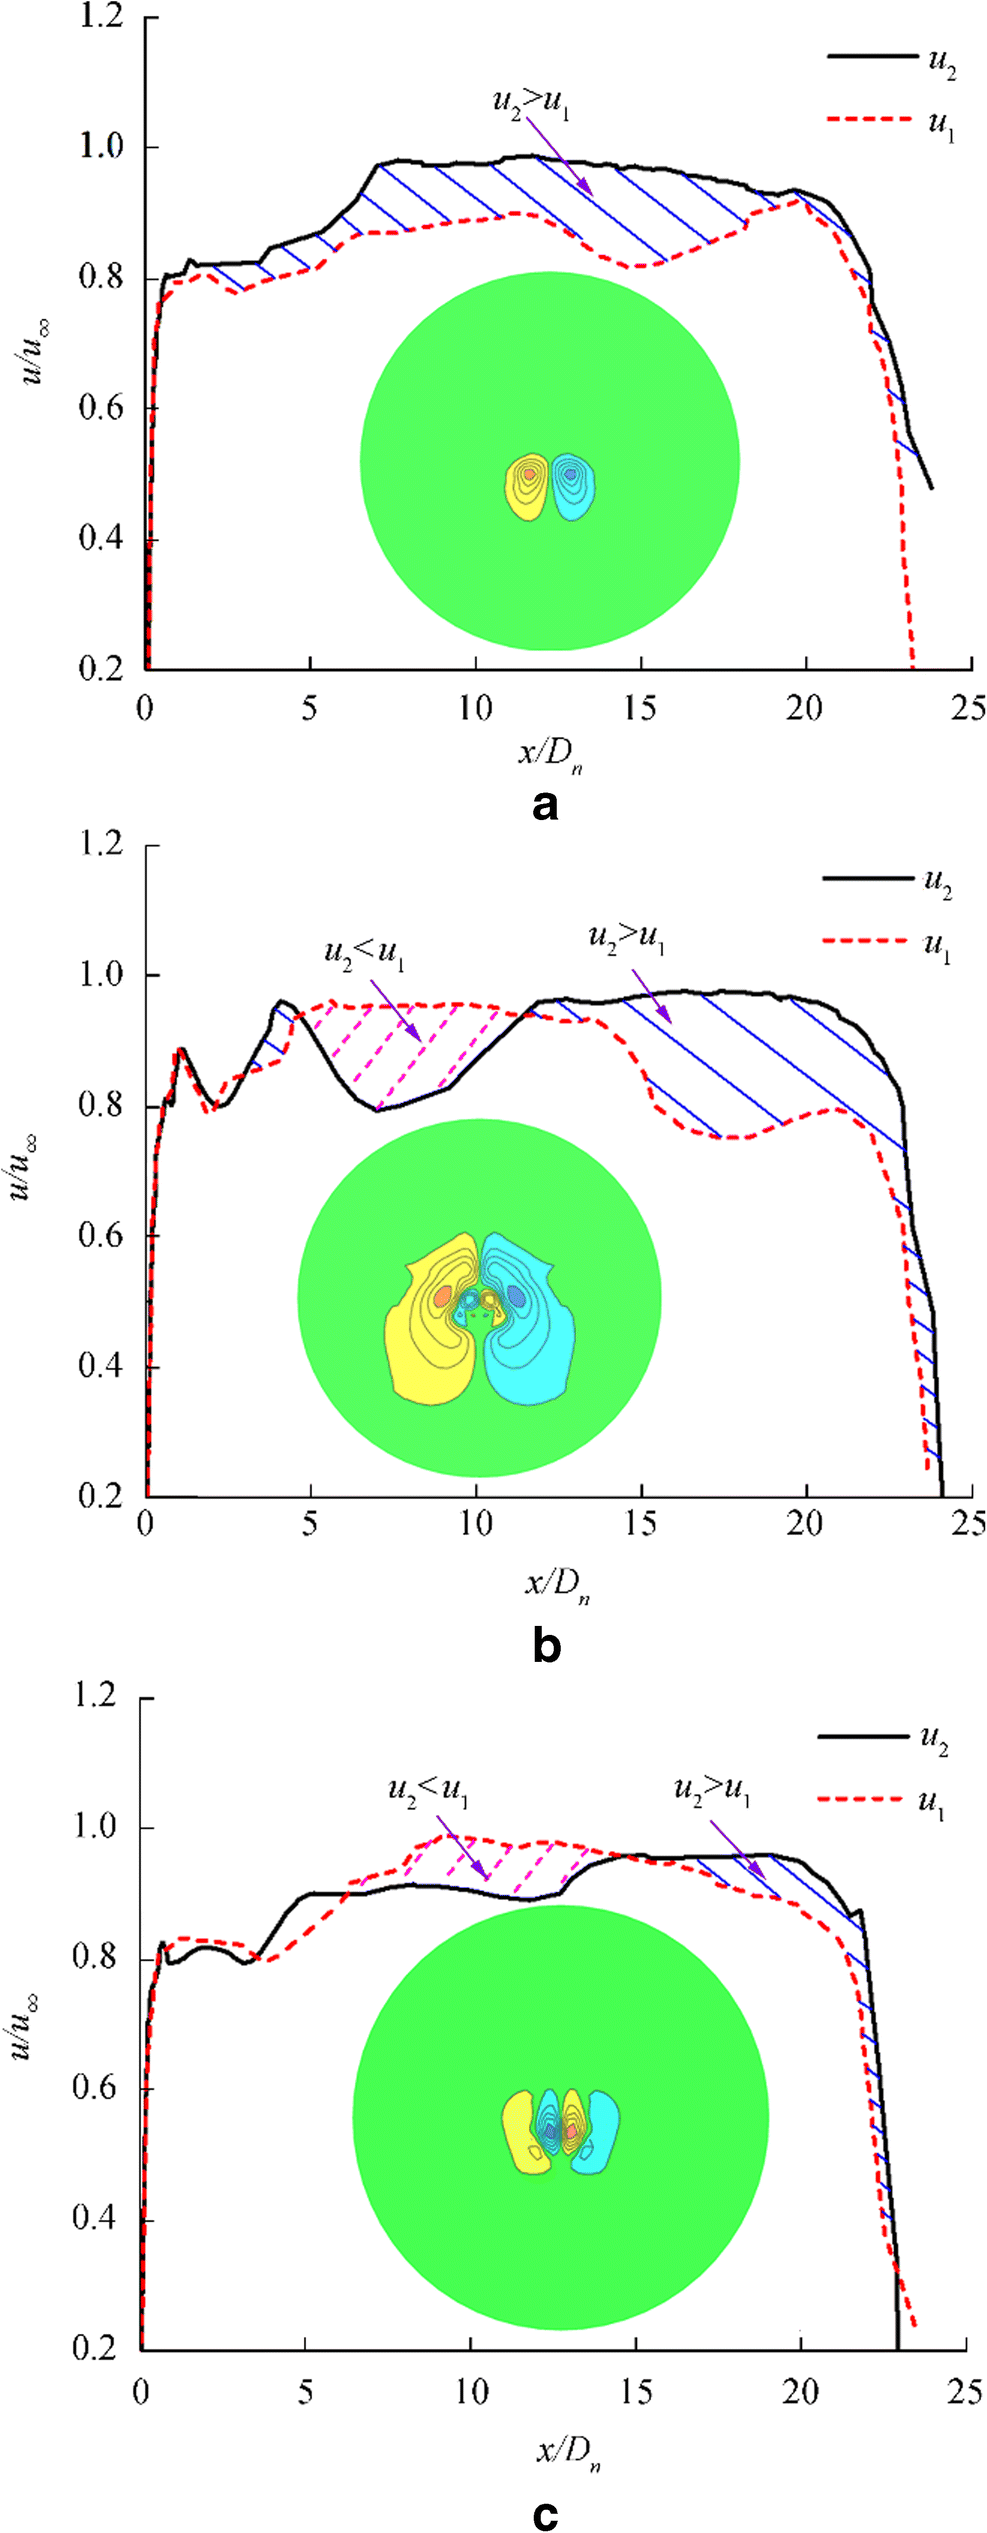
The area enclosed by the u1 and u2 curves can be used to approximately characterize the changes in the vorticity in the wake of the supercavity (Wang et al. 2019), as shown in Fig. 10.
As demonstrated in Fig. 10a, at t = 0.00T0, we have u2 > u1 within the longitudinal plane of the supercavity. The vortex formed within the longitudinal plane will induce the wake of the supercavity to roll up upward. Gravity also exists in the flow domain environment. The pressure is higher beneath the supercavity than above it. Therefore, a pair of centrally rolled-up vortices is formed in the wake of the supercavity. The disturbance generated by the gust generator affects the flow velocities on the upper and lower surfaces of the supercavity and the pressure distribution in the flow domain. In Fig. 10b, at t = 0.25T0, there is an area where u2 > u1 and an area where u2 < u1 within the longitudinal plane of the ventilated supercavity. Therefore, a multi-vortex wake structure will be formed after the vortex that formed within the longitudinal plane of the supercavity has propagated to the wake of the supercavity. Because the area where u2 > u1 is greater than the area where u2 < u1, there is primarily a pair of centrally rolled-up vortices in the vorticity direction in the wake of the supercavity. In Fig. 10c, at t = 0.50T0, the area where u2 > u1 is comparable to the area where u2 < u1 within the longitudinal plane. A four-vortex wake structure is formed after the two vortices that formed within the longitudinal plane of the supercavity have propagated to the wake of the supercavity. This four-vortex structure has also been found in a study conducted by the Saint Anthony Falls Laboratory (Karn et al. 2016a, b). The simulated morphology of the wake flow of the supercavity differs from the experimental result to some extent. Due to the difference in the volume fraction of air selected for the analysis of the computational result and the difference between the numerically simulated vortex structure of microbubbles and the experimental result, the numerical method is unable to accurately reflect the details of the vortex tube in the experiment. An analysis performed using a method similar to that used for analyzing Fig. 10 a and b finds that at t = 0.75T0 and t = 1.00T0, the flow velocity difference caused by the gust generator results in a continuous change in vorticity.
4 Conclusion
A numerical computational model was introduced to study a ventilated supercavity in the presence of a periodical gust flow, and the effects of the gust flow on the ventilated supercavity were investigated. The effectiveness of the numerical computational model was examined by comparing with experimental data. The lower f or the longer λ is, the lower v/u∞ is in the flow domain. The lower u∞ or the shorter λ is, the lower v/u∞ is. v/u∞ gradually decreases along the flow direction toward the downstream flow domain. The lower u∞ is, the faster v/u∞ decreases.
The changes in the wake flow of a ventilated supercavity in the presence of a periodic gust flow were investigated under the periodic disturbance generated by the gust generator. A periodic change in σ was found with two peak values and two valley values within one period. At the peak of σ, the momentum of the re-entrant jet in the wake of the supercavity is relatively high, and a re-entrant jet closure in the wake of the supercavity was observed. At the valley of σ, the momentum of the re-entrant jet in the wake of the supercavity is relatively low, and a more interesting twin-vortex closure in the wake of the supercavity appears.
Under the periodic disturbance generated by the gust generator, a periodic change between two and four vortices in the vorticity direction in the wake of the supercavity is excited. It was found that the twin vortex appears as a pair of centrally rolled-up vortices for the Forward facing model, while the twin vortex appears alternately as a pair of centrally rolled-up vortices and a pair of centrally rolled-down vortices for the Backward facing model.
Overall, cavity stability performs a significant effect on the underwater vehicle. The high-speed vehicle with natural supercavity especially have higher requirements of cavity stability. It was known that ventilated cavity is more stable than the vapor cavity; however, the behavior of ventilated supercavitating against unsteady incoming flow is unknown. In this study, the ventilated supercavitating against the gust flow induced by a pair of hydrofoils was investigated. The cavity characteristics especially for the vortex closure are analyzed for the forward facing model and the backward facing model, which facilitates our study to understand the fundamental physics of high-speed supercavitating vehicles in a real-world phenomenon.
Acknowledgements: We wish to thank Prof. Cong Wang of Harbin Institute of Technology for his attentive guidance on the preparation of this paper and Prof. Pengfei Liu of Newcastle University in the UK for his valuable opinions and suggestions on this paper.Open Access This article is licensed under a Creative Commons Attribution 4.0 International License, which permits use, sharing, adaptation, distribution and reproduction in any medium or format, as long as you give appropriate credit to the original author(s) and the source, provide a link to the Creative Commons licence, and indicate if changes were made. The images or other third party material in this article are included in the article's Creative Commons licence, unless indicated otherwise in a credit line to the material. If material is not included in the article's Creative Commons licence and your intended use is not permitted by statutory regulation or exceeds the permitted use, you will need to obtain permission directly from the copyright holder. To view a copy of this licence, visit http://creativecommons.org/licenses/by/4.0/. -
Table 1 Verification of grid density convergence
Mesh Ne(104) FD(N) CD R(%) Mesh A 68 3.749 1.375 17.52 Mesh B 83 3.441 1.262 7.86 Mesh C 98 3.193 1.171 0.08 Mesh D 115 3.190 1.170 0.00 Table 2 Verification of time step convergence
Time step Δt(10−4 s) FD(N) CD R(%) Time A 0.5 3.187 1.169 0.00 Time B 1.0 3.190 1.170 0.08 Time C 2.0 3.231 1.185 1.37 Time D 5.0 3.253 1.193 2.05 Table 3 Pressure and vorticity distribution in the wake of the supercavity (FFM)

Table 4 Pressure and vorticity distribution in the wake of the supercavity (BFM)

-
Arndt REA, Hambleton WT, Kawakami E, Amromin EL (2009) Creation and maintenance of cavities under horizontal surfaces in steady and gust flows. J Fluids Eng 131:111301. https://doi.org/10.1115/1.4000241 Cao L, Karn A, Arndt REA, Wang Z, Hong J (2017) Numerical investigations of pressure distribution inside a ventilated supercavity. J Fluids Eng 139:021301. https://doi.org/10.1115/1.4035027 Ceccio SL (2010) Friction drag reduction of external flows with bubble and gas injection. Annu Rev Fluid Mech 42(1): 183–203. https://doi.org/10.1146/annurev-fluid-121108-145504 Karn A, Rosiejka B (2017) Air entrainment characteristics of artificial supercavities for free and constrained closure models. Exp Thermal Fluid Sci 81:364–369. https://doi.org/10.1016/j.expthermflusci.2016.10.003 Karn A, Arndt REA, Hong J (2015) Dependence of supercavity closure upon flow unsteadiness. Exp Thermal Fluid Sci 68:493–498. https://doi.org/10.1016/j.expthermflusci.2015.06.011 Karn A, Arndt REA, Hong J (2016a) An experimental investigation into supercavity closure mechanisms. J Fluid Mech 789(3): 259–284. https://doi.org/10.1017/jfm.2015.680 Karn A, Arndt REA, Hong J (2016b) Gas entrainment behaviors in the formation and collapse of a ventilated supercavity. Exp Thermal Fluid Sci 79:294–300. https://doi.org/10.1016/j.expthermflusci.2016.08.003 Lee SJ, Kawakami E, Arndt REA (2013) Investigation of the behavior of ventilated supercavities in a periodic gust flow. J Fluids Eng 135:081301. https://doi.org/10.1115/1.4024382 Lee SJ, Kawakami E, Karn A, Arndt REA (2016) A comparative study of behaviors of ventilated supercavities between experimental models with different mounting configurations. Fluid Dyn Res 48:1–12. https://doi.org/10.1088/0169-5983/48/4/045506 Nesteruk I (2014) Shape of slender axisymmetric ventilated supercavities. J Comput Eng: 1–18. https://doi.org/10.1155/2014/501590 Reichardt H (1946) The laws of cavitation bubbles as axially symmetrical bodies in a flow. ministry of aircraft production great britain, reports and translations, No. 766 Sanabria DE, Balas G, IEEE F, Arndt REA (2015) Modeling, control, and experimental validation of a high-speed supercavitating vehicle. IEEE J Ocean Eng 40(2): 362–373. https://doi.org/10.1109/JOE.2014.2312591 Shao SY, Wu Y, Haynes J, Arndt REA (2018) Investigation into the behaviors of ventilated supercavities in unsteady flow. Phys Fluids 30:052102. https://doi.org/10.1063/1.5027629 Wang W, Wang C, Wei YJ, Song WC (2018) A study on the wake structure of the double vortex tubes in a ventilated supercavity. J Mech Sci Technol 32(4): 1601–1611. https://doi.org/10.1007/s12206-018-0315-5 Wang W, Wang C, Li CH, Song WC (2019) The influence of the wetted area of vehicle on the wake structure of cavity. Acta Armamentarii 40(10): 2111–2118. https://doi.org/10.3969/j.issn.1000-1093.2019.10.017 Yu KP, Zhou JJ, Min JX, Zhang G (2010) A contribution to study on the lift of ventilated supercavitating vehicle wich low Froude number. J Fluids Eng 132(11): 111303. https://doi.org/10.1115/1.4002873 Zhou W (2013) The oretical and numerical research on ventilated supercavitating flows based on logvinovich's principle. Harbin: Harbin Institute of Technology (in Chinese)

