The Effect of Backfilling Stiffness on the Lateral Response of Deeply Buried Pipelines: an Experimental Study
https://doi.org/10.1007/s11804-020-00186-8
-
Abstract
Subsea pipelines passing through the shallow area are physically protected against the environmental, accidental, and operational loads by trenching and backfilling. Depending on construction methodology, environmental loads, and seabed soil properties, the stiffness of backfilling material may become largely different from the native ground (softer than native ground in most of the cases). The different stiffness between the backfill and native ground affects the soil failure mechanisms and lateral soil resistance against large pipeline displacements that may happen due to ground movement, landslides, ice gouging, and drag embedment anchors. This important aspect is not considered by current design codes. In this paper, the effect of trench-backfill stiffness difference on lateral pipeline-backfill-trench interaction was investigated by performing centrifuge tests. The soil deformations and failure mechanisms were obtained by particle image velocimetry (PIV) analysis. Three experiments were conducted by using three different backfills including loose sand, slurry, and chunky clay that represent the purchased, natural in-fill, and pre-excavated materials, respectively. The study shows that the current design codes underestimate the lateral soil resistance for small to moderate pipe displacements inside the trench and overestimate it for large lateral displacement, where the pipeline is penetrating into the trench wall.Article Highlights• Centrifuge tests were conducted to investigate the effect of backfilling with different stiffness on lateral resistance.• The study showed that the interaction effects become more significant for the larger differences between the stiffness of backfill and native ground.• The trench-backfill-pipe interaction was found to reduce the ultimate soil resistance compared with uniform soil.• Design codes do not account for the trench-backfill-pipe interaction effect on lateral soil resistance. -
1 Introduction
Submarine pipelines are usually trenched and buried in shallow waters to mitigate the risk of damage due to environmental, operational, and accidental loads. Buried pipelines may be subjected to large lateral displacements due to ground movements, landslides, ice gouging, and drag anchors. Pre-dredged material is commonly used as a cost-effective backfilling option. Purchased granular material may be also used on some occasions to achieve the pipeline target stability or suppress the wave/current-induced liquefaction or scour. The fine backfilling material is usually remolded to a high extent depending on the trenching techniques, construction procedure, and environmental loads. The granular backfilling materials may be also densified under the action of environmental loads. These processes result in a backfilling material with a stiffness that is significantly different from the seabed native ground (see Figure 1).
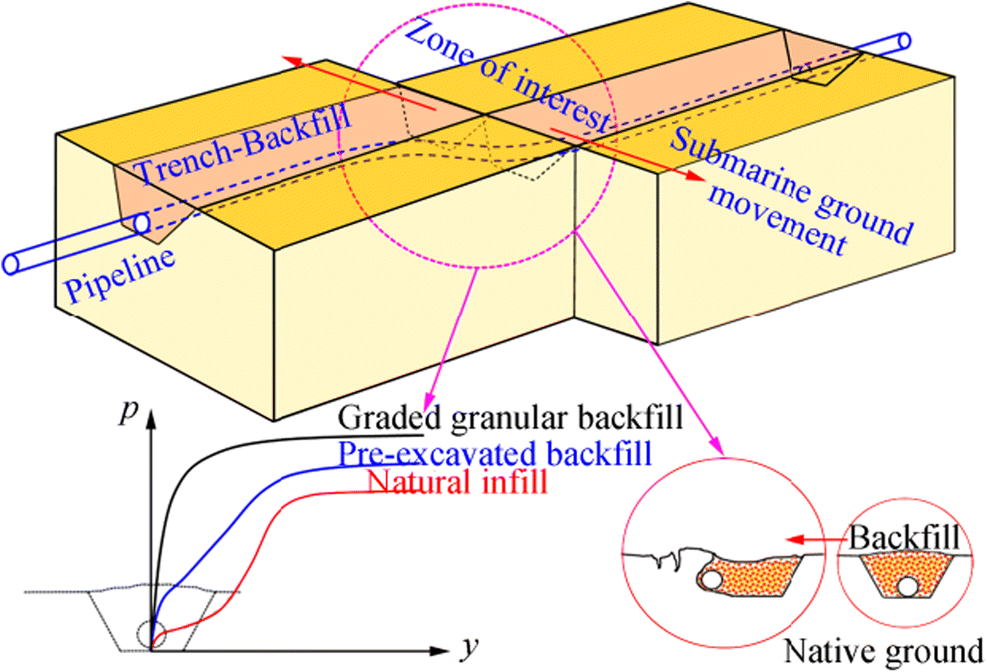 Figure 1 The lateral response of trenched pipeline to submarine ground movement
The previous studies have shown that the high difference between the stiffness of the backfill and native ground (i.e., trench wall and bed) could have a significant influence on lateral soil resistance against the largely displaced pipe (Paulin 1998; Kianian et al. 2018). However, the trenching/backfilling effect is currently not considered by pipeline design codes (e.g., DNVGL-RP-F114 2017; PRCI 2009; ALA 2005; ASCE Committee 2014) due to less-explored pipeline-backfill-trench interaction and its impact on the soil failure mechanism. Therefore, the existing solutions for prediction of lateral soil resistance are usually based on lateral pipe-soil interaction in uniform soil (Tschebotarioff 1973; Wantland et al. 1979; Paulin 1998) or anchor-soil interactions in uniform soil (Hansen 1948; Hansen and Christensen 1961; Das and Seeley 1975; Rowe and Davis 1982; Merifield et al. 2001).
In this study, centrifuge tests were conducted on trenched pipelines deeply buried in three different kinds of backfills including loose sand, slurry, and chunky clay to qualitatively investigate the internal soil deformations and failure mechanisms affected by different backfilling strengths. These three backfilling materials represented the purchased (granular), natural infill (slurry), and pre-excavated material (remolded soft clay) that are the most probable scenarios. The particle image velocimetry (PIV) analysis was conducted by using a transparent observation window and digital cameras. Paulin (1998) observed that pipeline-backfill-trench interaction is not fully developed in undrained conditions. Therefore, the partially drained condition was adopted in this study by applying a low pipe moving velocity to magnify the pipeline-backfill-trench interaction effects. This enabled a clear capturing of the shear bands and failure mechanism affected by trench configuration and seabed soil properties.
The study showed that the current design codes underestimate the lateral soil resistance for small to moderate pipe displacements inside the trench and overestimate it for large lateral displacement, where the pipeline is penetrating into the trench wall. The design practice can take advantage of pipeline-backfill-trench interaction effects to improve the safety and cost-effectiveness of the design of the buried pipeline against the large lateral displacements. Further numerical and experimental studies are required for proposing quantitative design equations incorporating the pipeline-backfill-trench interaction effects on lateral soil resistance.
2 Test Setup and Modeling Remarks
The C-CORE centrifuge facilities located at St. John's Campus of the Memorial University of Newfoundland were used to conduct a series of tests investigating different aspects of lateral pipeline-backfill-trench interaction. Since the main objective of the study was a qualitative assessment of the effect of different backfilling stiffness on the failure mechanisms, there was no need for a high number of tests that are usually required for quantitative studies. Therefore, three tests (T1P2, T2P1, and T5P2) with a different type of backfilling material were selected to study the most potential backfilling scenarios. The PIV analysis was conducted to obtain the internal soil deformation and failure mechanisms by monitoring through a transparent observation sidewall. Similar test setup to Paulin (1998) was adopted to facilitate comparing the results with earlier studies. The strongbox accommodated two pipe sections in each run that were horizontally pulled in opposite directions. Figure 2 shows the test setup and post-test condition.
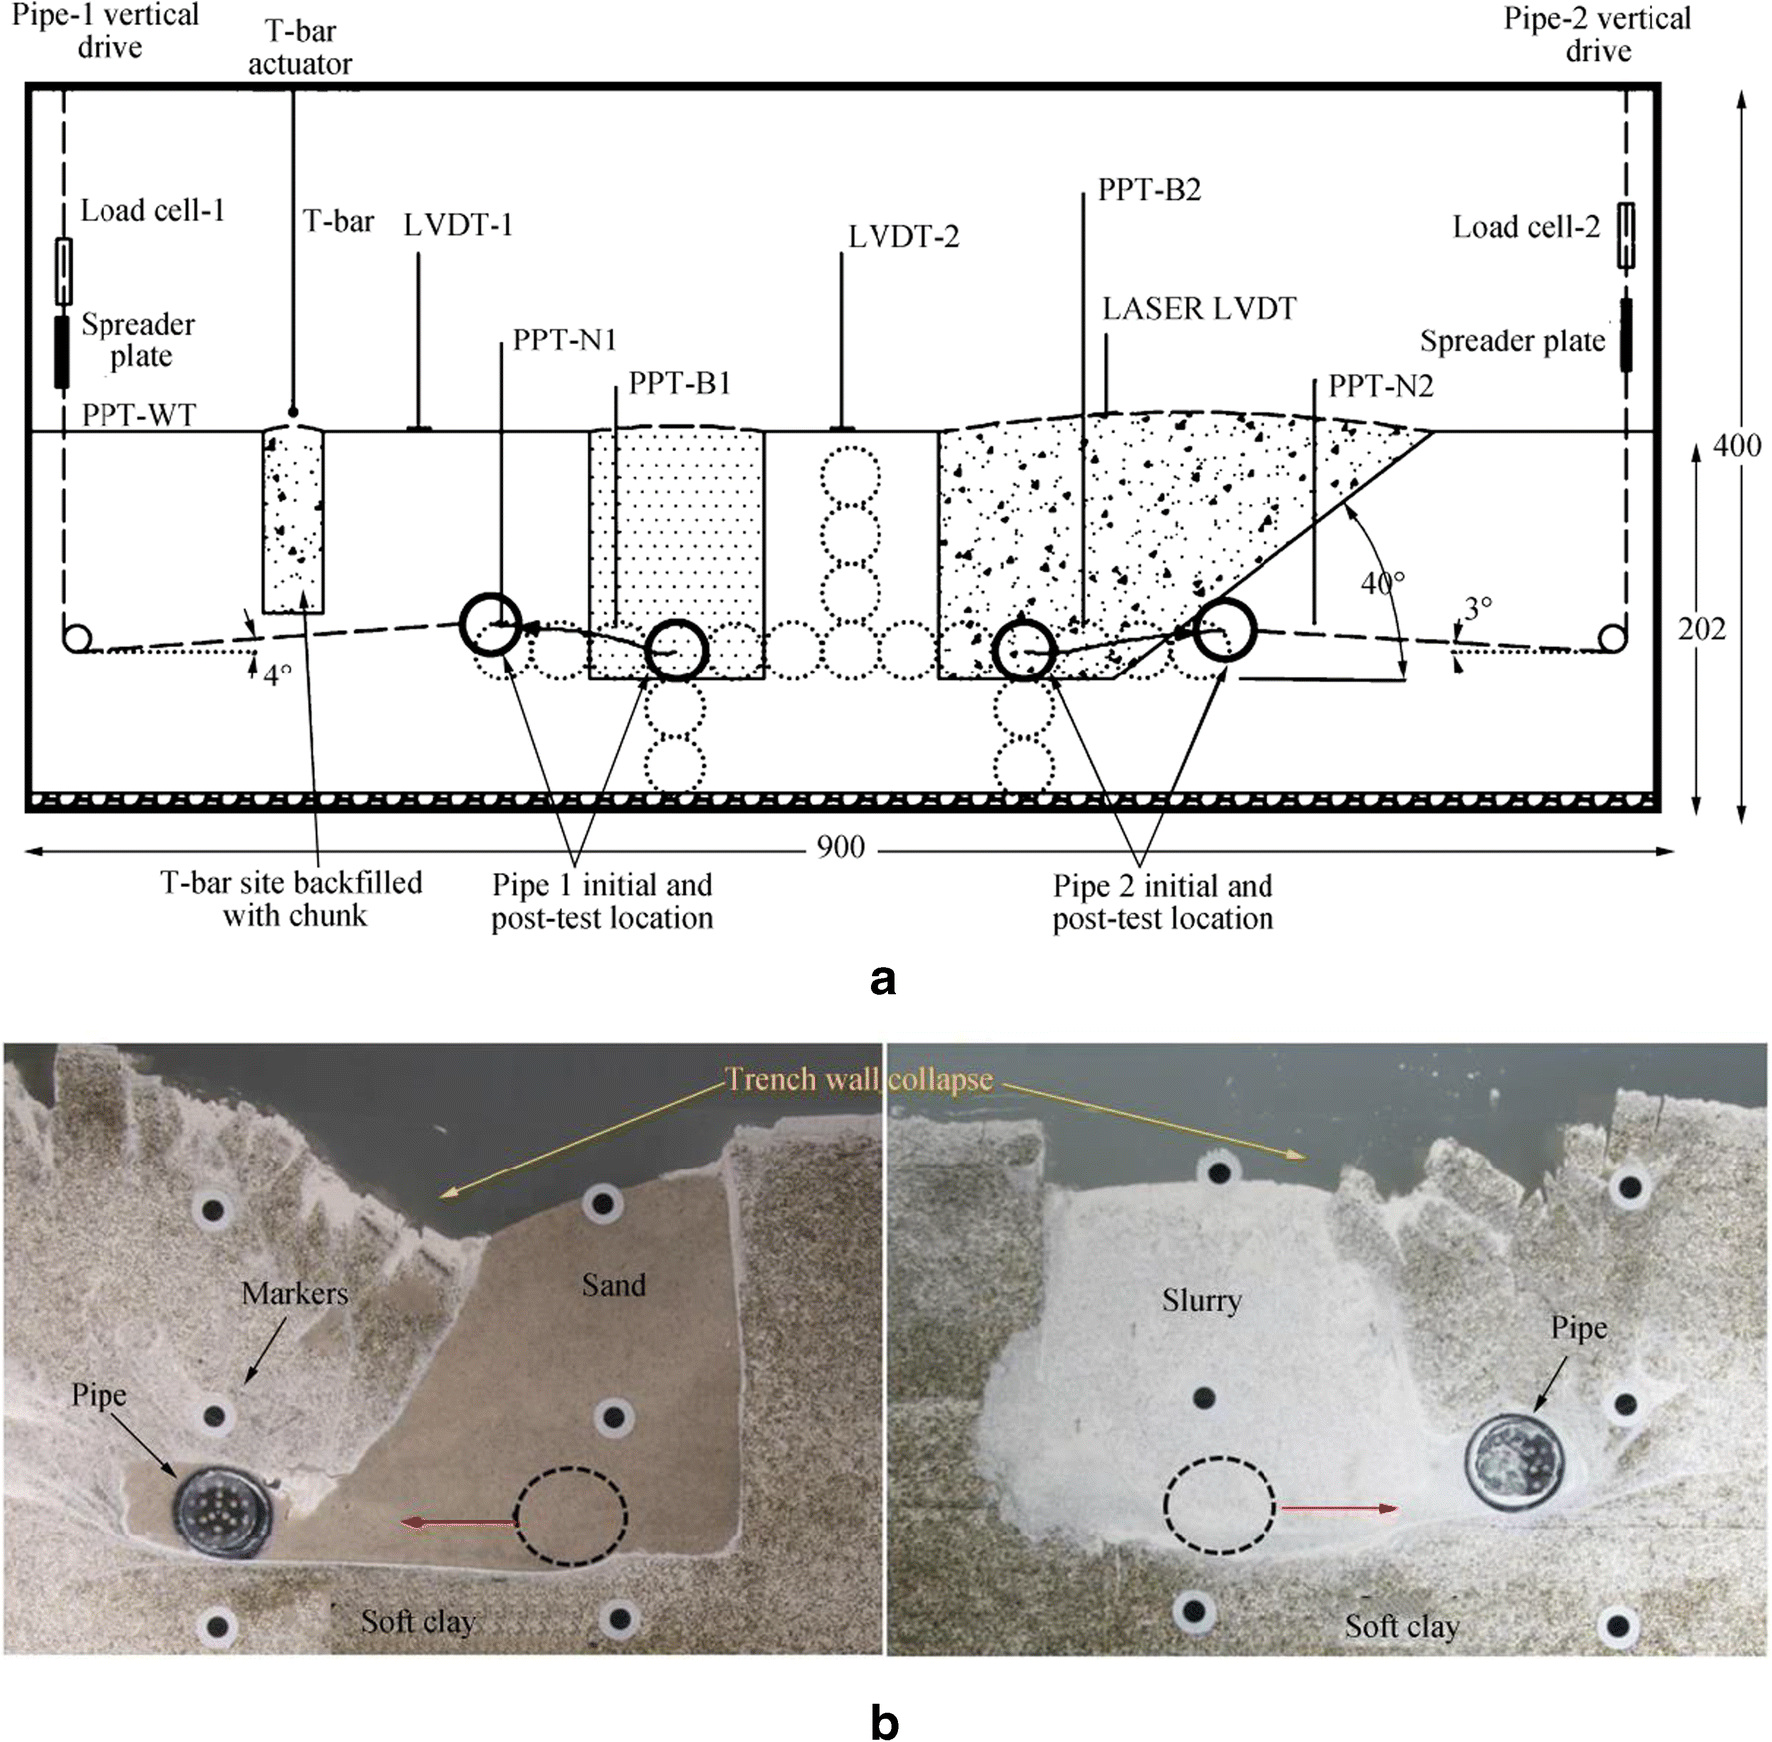 Figure 2 Test setup and post-test conditions (dimensions in mm). a Schematic view of dimensions. b Post-test condition
A 24″ pipe with an external diameter of 610 mm was selected as a technical requirement by the project's industry sponsor in continuation of their earlier full-scale studies in the sand (Burnett 2015). Therefore, a stainless still pipe section was used for model pipe with a diameter of 31.75 mm to enable accommodating the internal pressure transducer without folding the data transfer cable. Two sets of strain gauges, one internal pore pressure transducer (facing the rear of pipe), two pulling cables, and two rubber end caps (both lubricated, on patterned in window side), were used as model pipe instrumentation. These sizing requirements resulted in a spinning acceleration of 19.1g. It is worth noting that centrifugal acceleration simulates gravity and allows for correspondence of stress fields between model and full scale resulting in enhancement of modeling accuracy. Paulin (1998) conducted modeling of model tests and attempted to model the same prototype condition at 1:25, l: 50, and 1:100 scales for the lateral response of trenched/backfilled pipelines in clay to verify the scale effects. The study showed acceptable results with most of the interaction curves within a bandwidth of 0.5–1 normalized lateral loads. Considering these earlier results, the scaling studies were not repeated in the current study, having a test setup almost identical to Paulin (1998).
A 50%–50% (equal weight) mixture of Speswhite kaolin clay and Sil-Co-Sil silt were used with a sufficient amount of water to form a slurry with a nominal moisture content of about 70%. The prepared slurry was incrementally consolidated up to the effective stress of 400 kPa and then was unloaded to 100 kPa with an open drainage valve. The base drain was closed to stop the water flow into the sample during the unloading process. The consolidation resulted in a soft clay bed with an undrained shear strength of 15 to 25 kPa. A blade mounted on a supporting beam was used to excavate rectangular trenches about 3.6D wide and 4.0D deep (T1P2 and T2P1). Chaloulos et al. (2015) showed that the trench wall angle has no influence on lateral soil resistance of deeply buried pipelines. Having limitations in access to the centrifuge facilities and the total number of tests, this advantage reported by Chaloulos et al. (2015) was used and a trench wall angle of 40 degrees was configured in the test T5P2. This enabled using the results of this test in multiple comparative studies in the main testing program without affecting the objectives of the current study. An average burial depth ratio of H/D = 3.5 was considered to model the deep burial condition (H/D was defined as the initial ratio of the pipe springline depth to the pipe diameter). The boundary effects were suppressed by assuming a 2D clearance between the trench bottom and the lower drainage layer at the bottom of the test box.
The testing operation was monitored by using three parallel data acquisition systems and a range of instruments including pore pressure transducers (PPTs), strain gauges, load cells, conventional and laser linear variable differential transformers (LVDTs), T-bar, vertical drive motion controller, digital cameras, markers, and artificial textures. The state-of-the-art instrumentation enabled capturing the development of shear bands in backfill and native soil, progressive failure mechanisms, lateral soil resistance of the pipeline, the suction force in the rear of pipe, and the pore pressure variation in the surrounding soil. The lubricant was applied to the internal walls of the strongbox to suppress the friction between the box walls and the pipe end caps. The suppression of the friction was verified by performing a trial pipe pulling with no soil bed and measuring the pulling load. In addition, to bypass, the friction between the cable and the soil, and the cable and pulleys, two strain gauges were installed on each pipe to purely measure the lateral soil resistance right in front of the pipe. Load cells were also used on pulling cables to cross-check the measurements of the strain gauges. The results presented in this paper are those obtained from the strain gauges.
The pipes located at the center of the trench were laterally pulled in opposite directions and under displacement-controlled condition, while there was no restriction against vertical displacement. The bottom elevation of the pulleys was aligned with the pipe springline to ensure a horizontal pull. Releasing the vertical restraints allowed the pipes to slightly move upward at the beginning of the test following the least resistance path. This enabled the effect of the pipeline/trench bed interaction on lateral soil resistance to develop. With larger pipe displacements, the pipes tended to move vertically downward as the result of the pipe weight, bearing stress, and pulling cable. The measured lateral forces are better to be calibrated against the instantaneous pipe trajectory for more accurate lateral soil resistance. However, this would only improve the current results by about ± 0.4%. Figure 3 shows the flowchart of the test setup preparation and testing procedure.
 Figure 3 Flowchart of test preparation and testing procedure
Partially drained condition was adopted (average normalized velocity, vD/cv = 0.3, based on Phillips et al. 2004) to consolidate the surrounding soil, eliminate the effect of excess pore pressure, and magnify the effect of pipeline-backfill-trench interaction. Besides these advantages of partially drained condition, silt fractions are found in natural offshore soft clays in many geographical locations (e.g., the Gulf of Mexico, Schiffman 1982) that tend the consolidation characteristics of clay towards partially drained and even fully drained conditions. Other compositional and depositional fractions may also show a similar effect.
The strength profile of the backfill and the native ground was measured in-flight by using a T-bar penetrometer with a head bearing area of 30 × 7.4 mm2 (Stewart and Randolph 1994). The T-bar test site was configured to allow for assessing the backfill and native ground strengths in a single run (see Figure 2). This was due to limited space on the test box and having access to only one T-bar actuator. The selected dimensions of the T-bar site allowed the suppression of the boundary effects in different directions. The T-bar was first penetrating to the backfill material and then continued to penetrate into the native ground. A base-case T-bar test was also conducted on the pure native ground to capture the net shear strength profile of the native soil. Figure 4 shows the schematic configuration of the T-bar site, and the measured undrained shear strength profiles with linear curve fit in T1P2 and T5P2 tests.
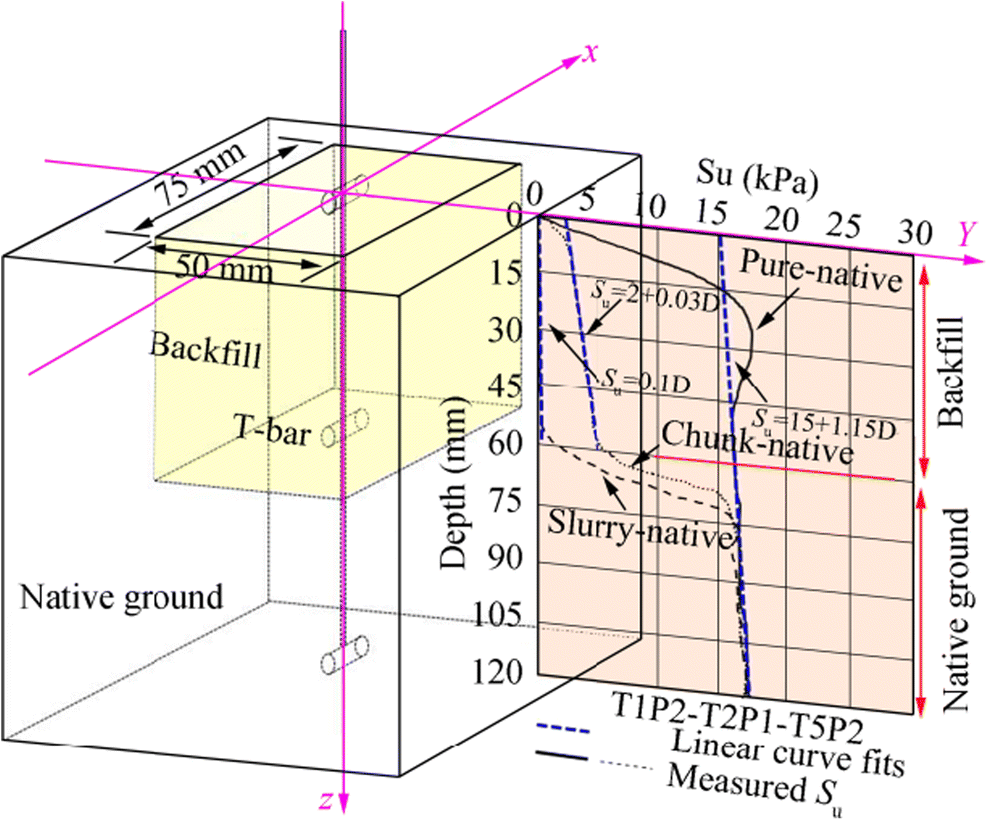 Figure 4 Schematic configuration of the T-bar site and the measured undrained shear strength profiles with linear curve fits.
Figure 4 shows almost a negligible undrained shear strength for slurry. Due to the slight water penetration from the backfill to the native soil, a slightly softer response was observed in the initial stages of penetration right underneath the backfill material, that is, by increasing the penetration, the plots of overlaid native soil strengths are gradually matching the profile of pure native soil. Table 1 shows a summary of the backfilling and native material prepared and tested in this study.
Table 1 Summary of the backfilling and native soil propertiesTest ID Trench backfill type Native cu at pipe invert (kPa) Native water content before and after the test (%) ϒsat (kN/m3) Native soil mudline strength, Sum (kPa) Native soil Strength gradient, ksu (kPa/m) Backfill mudline strength, Sum (kPa) Backfill strength gradient, ksu (kPa/m) T1P2 Slurry 17.6 32.04–32.97 18.33 15 1.15 0 0.10 T5P2 Chunk 18 30.12–32.13 18.43 15 1.15 2 1.60 T2P1 Sand 17.9 31.86–32.56 18.56 15 1.15 N/A N/A In order to convert the measured unit bearing resistance, q, to the local undrained strength, Su, a T-bar factor of Nkt = 10.5 was used as recommended by Stewart and Randolph (1994) (based on the plasticity solution, Randolph and Houlsby 1984). A reduced bearing factor was used for shallower depth by considering the effect of soil buoyancy and a shallow failure mechanism mobilized prior to the full flow of soil around the bar (White et al. 2010). Linear curve fits were used to approximate the Su profiles both in the backfill and native soils to facilitate the back analysis of the test data. The sand backfill properties were adapted from Paulin (1998) due to using an identical sand material and test configuration.
3 Results of Testing Program
The effect of different backfills on internal soil deformations and the failure mechanisms were investigated by performing PIV analysis using GeoPIV-RG software (White et al. 2003; Stanier et al. 2016). The soil displacements and strain levels were obtained and their relationship with lateral soil resistance or force-displacement curves (p-y curve) were studied through defining three different zones of pipe displacements (i.e., zones Ⅰ, Ⅱ, and Ⅲ). Several interactive soil deformation mechanisms were observed in the various stages of pipeline lateral displacements that are significantly affected by the stiffness of the backfilling material. The identified displacement zones (zones Ⅰ, Ⅱ, and Ⅲ) facilitated a detailed investigation of the mobilization of lateral soil resistance against the moving pipe (see Figure 5).
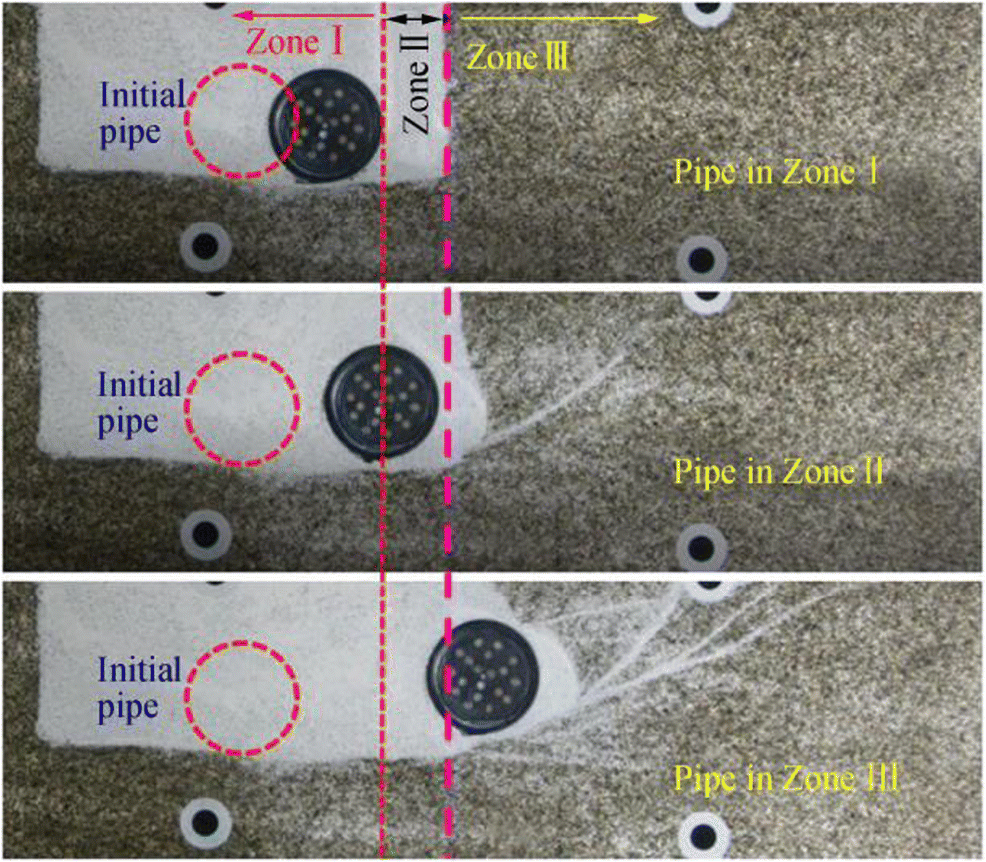 Figure 5 Identified zones of pipeline displacements with different failure mechanisms
Zones Ⅰ, Ⅱ, and Ⅲ refer to (ⅰ) the pipeline moving inside the backfill with almost no interaction with the trench wall, (ⅱ) the pipeline approaching and interacting with the trench wall, and (ⅲ) the pipeline fully penetrated into the trench wall, respectively. It will be shown in the coming sections that in the case of sand backfill, the pipeline interacts with the trench wall as soon as the pulling starts. Therefore, zone Ⅰ is not applicable to test T2P1 (see Figure 5). The p-y response for these three tests is shown in Figure 6. The responses in zones Ⅰ, Ⅱ, and Ⅲ have been highlighted by orange, green, and purple highlights for further references in the coming discussions. In these types of plots, the load is usually normalized by pipe diameter and undrained shear strength to obtain the interaction factor. However, in the current study, normalizing the load could result in discontinuities in p-y response due to different magnitude of undrained shear strength in backfill and native. This could be more complicated in the transition from backfill to native soil. Therefore, the load response was not normalized in Figure 6 for a proper presentation of the p-y response.
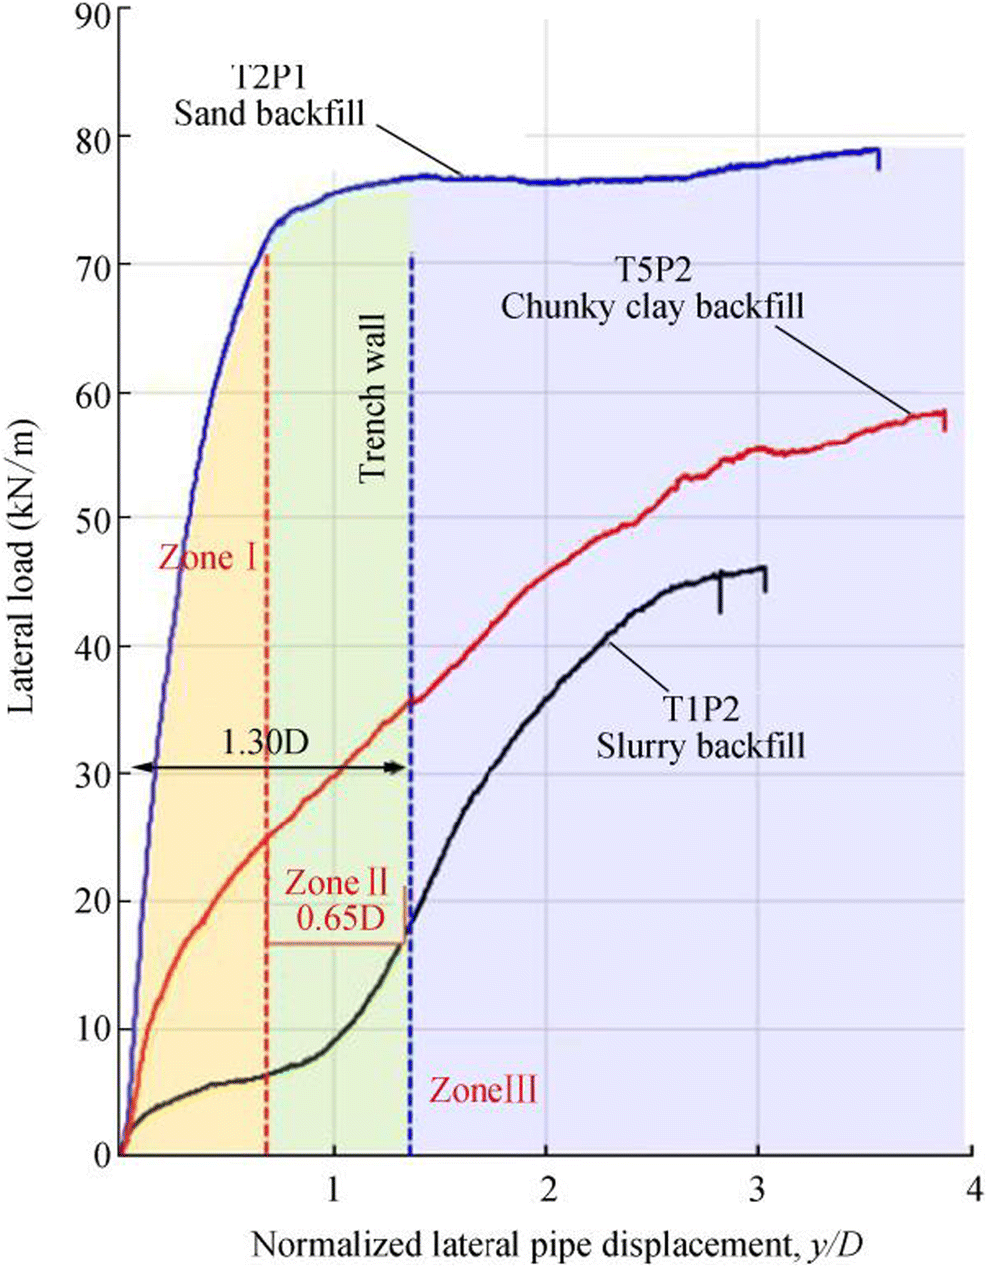 Figure 6 The p-y responses of tests with slurry, chunk, and sand backfills
It was observed that the ultimate lateral soil resistance is significantly reduced by increasing the stiffness of backfilling material. The slurry backfill qualitatively representing the natural infill of the seabed trench resulted in the lowest ultimate soil resistance. The sand backfill produced the highest soil resistance, even being in a loose condition. The response obtained from the chunky clay backfill that represents the pre-dredged material ended in between the sand and slurry backfilling cases. In addition, the soil resistance followed different but meaningful paths to achieve the ultimate resistance. A proper understanding of the differences between the p-y curves needs a comparative investigation of the soil deformation mechanisms and the pipe-backfill-trench interaction in different zones of the pipe displacements that will be discussed in the coming sections.
3.1 Pipeline Moving Inside the Trench
As soon as the centrifuge starts spinning, the pipeline slightly penetrates into the trench bed (by about 0.1D) due to its weight, before starting the pulling operation. This causes the pipe to interact with the backfill and trench bed, both of which could contribute to the mobilized lateral soil resistance. Figure 7 shows samples of the PIV analysis in the conducted tests, while the pipe is moving in zone 1. The results have been presented based on an identical pulling direction to facilitate comparison.
 Figure 7 Sample of PIV analysis results in zone Ⅰ
Figure 7 shows several interesting mechanisms that describe the different p-y responses observed in Figure 6. In tests P1T2 and P5T2 (slurry and chunky backfilled), the pipe and backfill displacements showed almost no influence on the trench wall. Inversely, the trench wall in test T2P1 (sand backfilled) started to deform immediately after starting the pipe pulling. Therefore, as mentioned earlier, there is no zone Ⅰ in this particular test. As shown in Figure 7 by highlighted orange areas, the soil volume mobilized against the pipe movement in T2P1 (sand backfilled) is contributed by both native ground and sand backfill. Therefore the p-y curve of T2P1 in Figure 6 is much larger than T1P2 (slurry backfilled) and T5P2 (chunky backfilled), where the native ground showed no contribution and the backfilling shear strength was much lower. Considering a very low magnitude of the shear strength in the slurry backfill (T1P2), the lateral soil resistance was expected to be very low in zone Ⅰ. However, the p-y response of T1P2 in Figure 6 still shows a remarkable amount of lateral soil resistance. The PIV analysis revealed that this mobilized force in zone Ⅰ is the result of the interaction between the pipeline and the trench bed. The initial embedment of the pipe into the trench bed during the in-flight consolidation creates small soil berms on both sides of the pipe. These small soil berms, their enlargement during the lateral pipe movement, squeezing the soil berm to the trench corner, and overall the pipeline-trench bed interaction and its intensity effect on lateral soil resistance have been entirely investigated and discussed by Kianian and Shiri (2019).
In addition, a second mechanism, i.e., the pipeline-backfill interaction was also observed in this zone. Although the contribution of this mechanism to p-y response in T1P2 is negligible due to the very low shear strength of the slurry backfill. However, it is still worth reviewing the features of this interesting mechanism. As schematically shown in Figure 8, the mechanism comprises loops of eccentric spiral soil flows with rotational circles around the moving pipe. These spiral flow surfaces emanate from a point above the pipe and move horizontally with the pipe until the failure surface touches the trench wall. From this stage, with a further displacement of the pipe towards the trench wall, the spiral flow starts to contract with a varying ratio that depends on its distance to the wall. The closer to the wall, the smaller the failure circle will be. An additional upside down wedge failure was observed on the top right of the spiral flow with side legs remaining asymptotic to the spiral surface at the rear of the moving pipe. The far failure surface (in the rear of the pipe) is still a kind of logarithmic spiral, but there is an inflection point in the near failure surface (above the pipe) of the deep backfill.
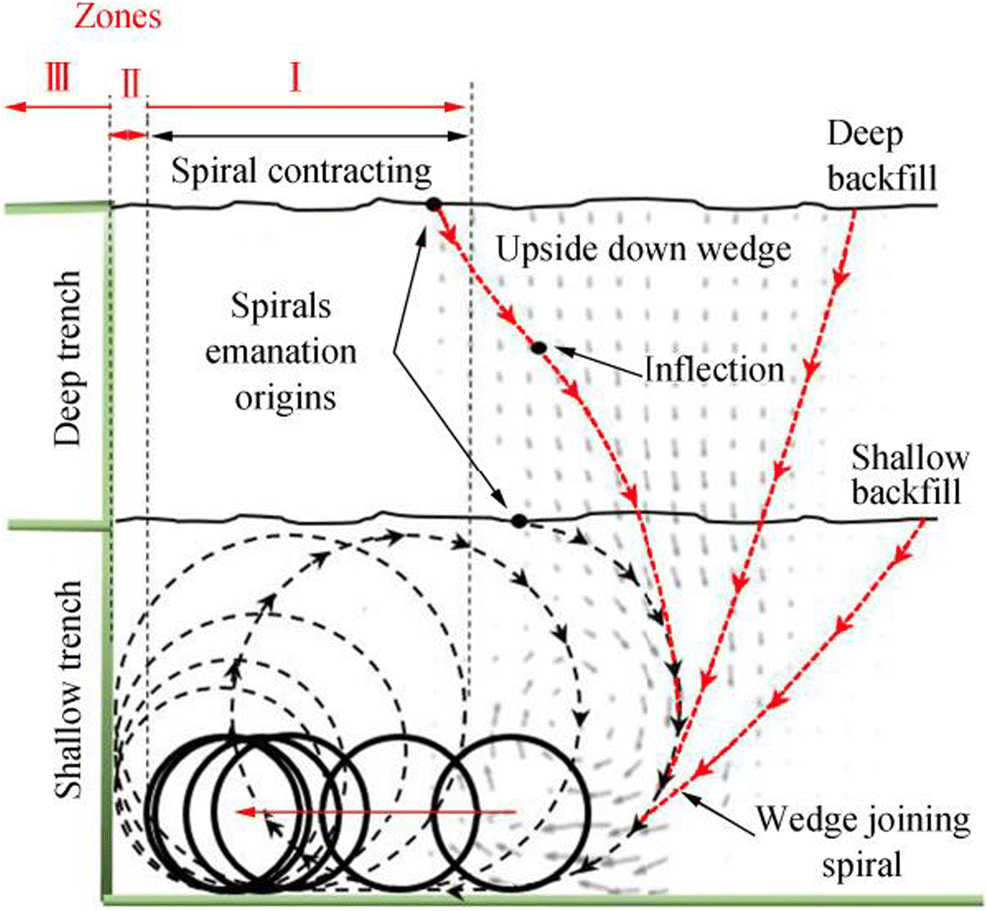 Figure 8 Contracting spiral flow mechanism of slurry backfill
Looking at progressively contracting spiral flows, the contribution of pipeline-backfill interaction to the lateral load is dissipated due to the reduction of the magnitude of mobilized rotational shear stress in the backfill. However, the obtained p-y responses show a continuous increase in lateral load due to the aforementioned pipeline-trench bed interaction process (see Figure 6).
3.2 Pipeline Interacting with the Trench Wall
Zone Ⅱ was started as soon as the pipeline interacts with the trench wall and the pipe displacement inside the trench causes the trench wall to be displaced as well. In test T2P1 (sand backfill), zone Ⅱ started immediately as the pipeline was laterally pulled. This zone ends by arriving at the pipe front at the initial position of the trench wall (see Figure 5). The total length of zone Ⅱ in this study was about 0.65D for T1P2 (slurry backfilled), 0.80D for T5P2 (chunky backfilled), and 1.30D for T2P1 (sand backfilled). This shows that zone Ⅱ becomes larger as the backfilling strength is increased. During the pipeline displacement in zone Ⅱ, the soil deformations in the trench bed, backfill, and trench wall were interactively developed. Moving inside zone Ⅱ, the backfilling material in T2P1 and the trench bed making a soil berm in front of the pipe in T1P2 were compressed between the pipe and trench wall and caused the pipeline to virtually act as a larger pipe. These virtual pipes were pushed into the trench wall and resulted in a local failure in T1P2 and the formation of the first failure shear band in the trench wall of T2P1. The latter one was formed before arriving at the pipe to the end of zone Ⅱ or the initial trench wall location. Figure 9 shows a sample of the failure mechanism and the PIV analysis results for T1P2 (slurry backfilled) and T2P1 (sand backfilled) tests in zone Ⅱ. The larger virtual pipe in T2P1 with a larger imaginary diameter has mobilized a larger amount of native ground and resulted in a higher lateral soil resistance in comparison with T1P2.
 Figure 9 Sample of PIV results for T2P1 and T1P2 in zone Ⅱ
Also, a closer look at the pipes trajectories shows that having no vertical restriction, the pipe in T1P2 has naturally followed the route with the least work, i.e., upward towards the backfill with softer material. Despite the T1P2 (slurry backfilled), the higher backfilling weight in T2P1 (sand backfilled) has not allowed the pipe to freely move upward. This resulted in the mobilization of a larger soil volume and larger lateral soil resistance, consequently. In the test T2P1, another mechanism has also contributed to increasing the p-y response. This mechanism is related to the stiffness of the backfilling material that will be further discussed in zone Ⅲ.
3.3 Pipeline Penetrating into the Trench Wall
Zone Ⅲ starts by arriving at the pipe front at the initial trench wall location. Figure 10 compares samples of PIV analysis and soil deformation mechanisms in the case of backfills with the highest and lowest shear strengths, i.e., the T2P1 and T1P2, consequently. At the start of zone Ⅲ, a small triangular wedge was created in front of the pipe, while the shear band in the trench wall was developed. It was observed that the orientation of this shear band with the horizontal line depends on the orientation of the pipeline displacement and almost follows the same orientation as the pipeline. As the pipe moved forward, the cable angle offset from the horizontal line was increased, and this affected the pipe trajectory by pulling it down. By changing the pipe trajectory, a new global shear band formed underneath the pipe with a new orientation. The first global instability of the trench wall appeared on top of the pipe, as soon as the top front edge of the real pipe touched the native trench wall. At this stage, the trench wall tends to slip down into the backfill. However, the backfilling material produces passive pressure against the collapsing wall. This passive pressure is directly related to the shear strength of the backfilling material. The sand backfill has a shear strength higher than chunky and slurry backfills. In T2P1, the high shear strength of sand backfill did not allow the full development of the shear bands in the trench wall towards the soil surface. Therefore, the mobilized energy in the native ground (trench wall) could not be released throughout the shear bands. This, in turn, resulted in higher lateral soil resistance in T2P1. In T1P2, the soft slurry backfill could not produce sufficient passive pressure against the failing trench wall. Therefore, the shear bands in the trench wall were fully developed and arrived at the soil surface. This caused the trench wall to slip into the backfill and significantly release the lateral soil resistance. In T5P2 with chunky backfilling material, a moderate condition happened and the shear bands development was larger than T2P1 (sand backfilled) and smaller than T1P2 (slurry backfilled). Figure 11 shows the strain counters, soil deformations, shear bands, and failure mechanisms for T1P2 (slurry backfilled), T2P1 (sand backfilled), and T5P2 (chunky backfilled) at various stages of the pipeline displacements.
 Figure 10 Sample of PIV results and soil displacement in zone Ⅲ of T1P2 and T2P1
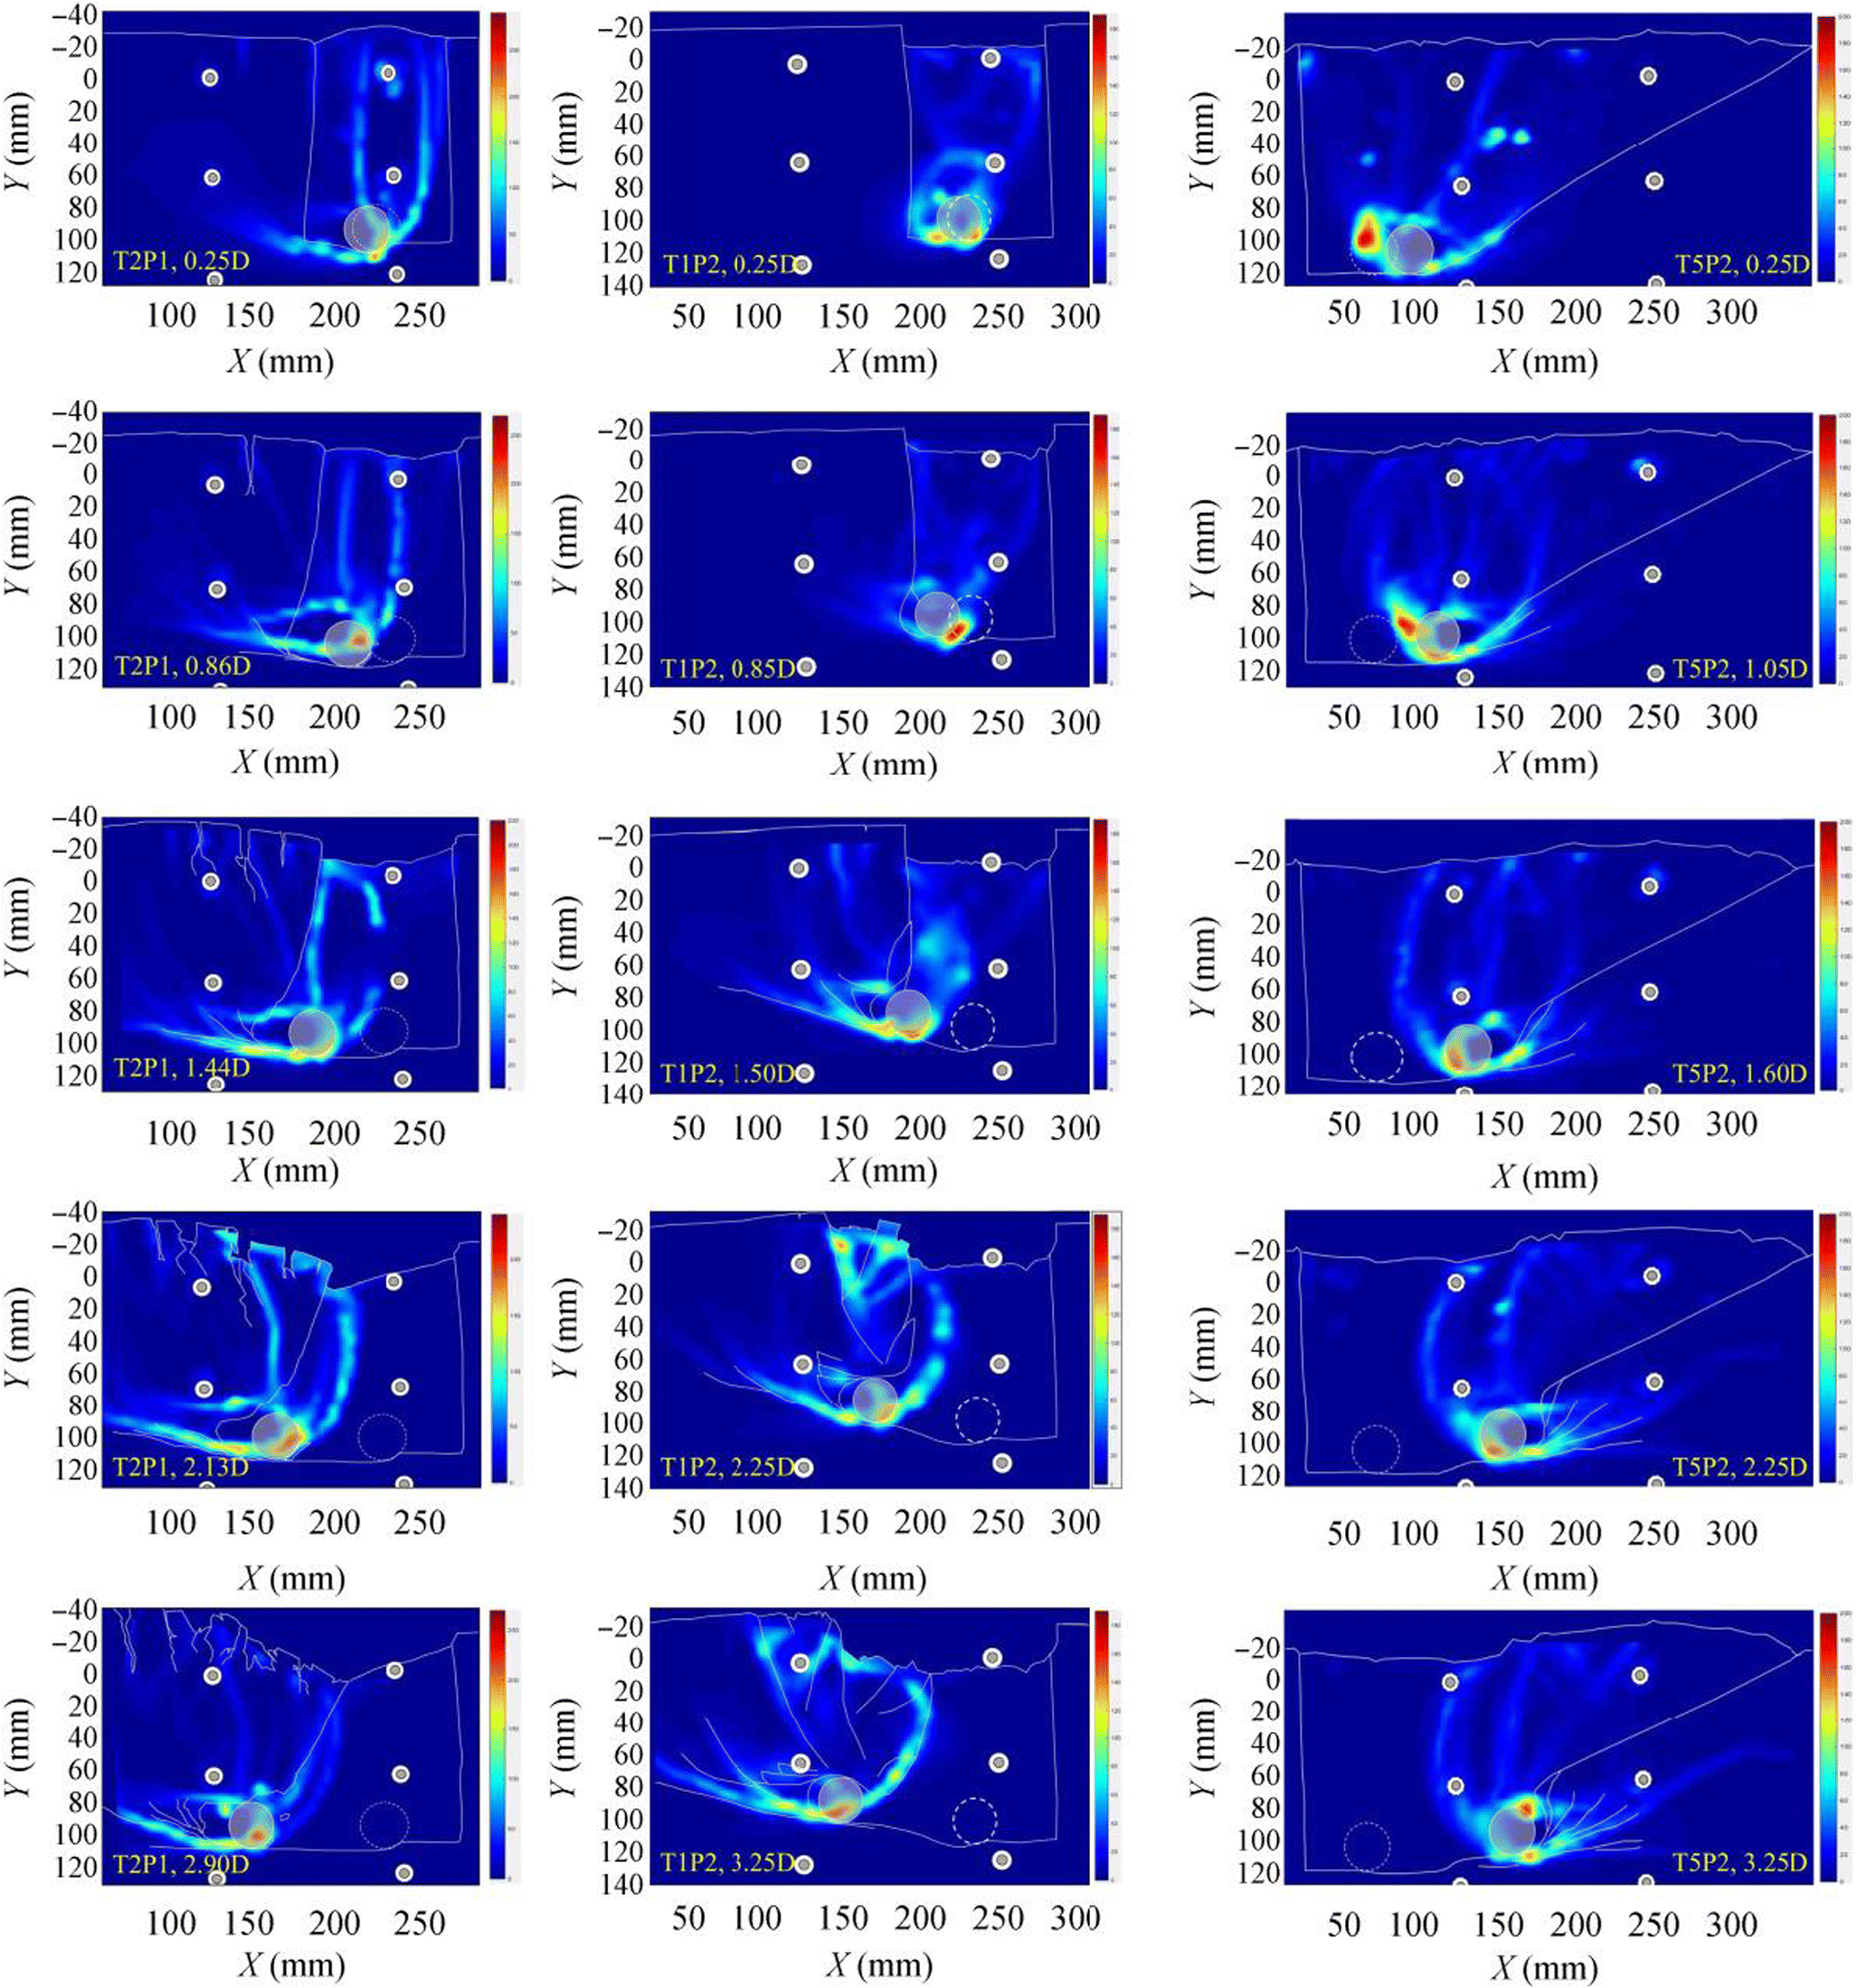 Figure 11 Strain contours obtained from PIV analysis for T1P2 and T2P1
Overall, these mechanisms resulted in the highest lateral soil resistance in T2P1 (sand backfilled), the lowest resistance in the T1P2 (slurry backfilled), and the moderate resistance in T5P2 (chunky backfilled).
3.4 Pore Pressure Measurement
Pore pressure transducers (PPTs) were placed in various locations (see Figure 2) inside the pipe, backfill, and native ground. PPTs could capture the pore pressure variation and also the suction force behind the pipe. A surface PPT was also used to monitor the water table in the testbed. Figure 12 shows the variation of pore pressure against the pipe displacement in the rear of the pipe (Internal PPT), native ground, and in backfills.
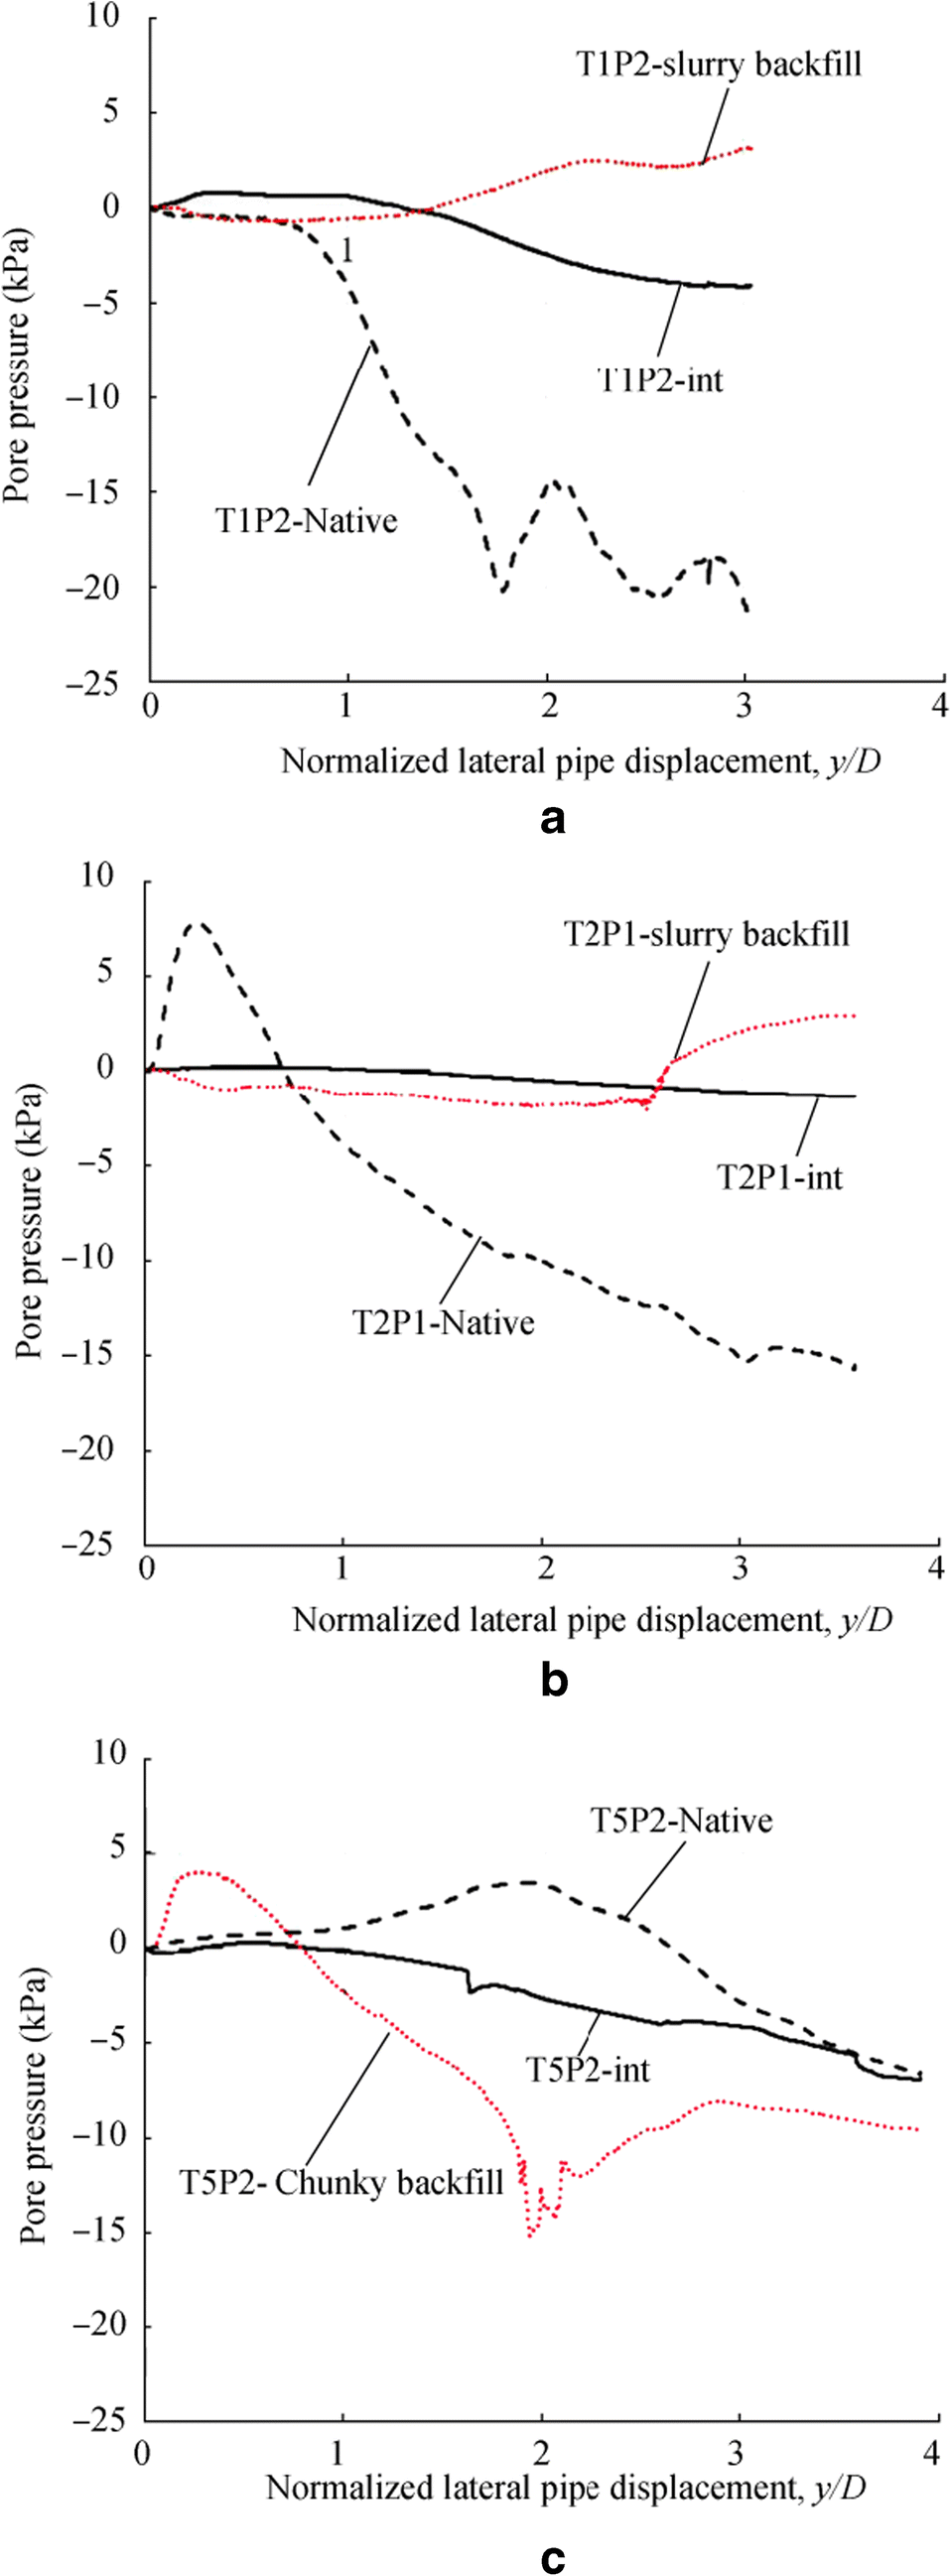 Figure 12 Pore pressure variation in backfill (BF), native ground (NG), and rear of the pipe. a T1P2 (slurry backfill). b T2P1 (sand backfill). c T5P2 (chunky backfill)
Overall, similar trends were observed in the PPTs used in T1P2 (slurry backfilled), T2P1 (sand backfilled), and T5P2 (Chunky backfilled). An initial increase of the pore pressure was observed in the internal PPTs (dashed lines in Figure 12) in zone Ⅰ followed by the dissipation of the excess pore pressure and developing a slight suction force behind the pipe in zones Ⅱ and Ⅲ. The magnitude of this suction force is not significant due to the low displacement rate of the pipe in a partially drained test condition. A similar trend with larger excess pore pressure and suction forces was observed in PPTs located in the native ground (solid lines in Figure 12). The PPTs inside the backfill (dotted lines in Figure 12) showed a slight suction at the beginning followed by an excess pore pressure in large displacements (except T5P2). The irregular fluctuation of the pore pressure variation in T5P2 is the result of the ununiformed distribution of the chunky backfill. The larger magnitude of the suction force in the native ground on T2P1 and T5P2 are in agreement with the soil failure mechanisms and progressive development of incomplete shear bands in the native ground due to delayed interaction of the pipe section and the trench wall, and consequently, the p-y responses showed in Figure 10.
4 Observed p-y vs. Existing Solutions
The p-y responses in T1P2, T2P1, and T5P2 were compared with the solutions recommended by some of the most popular pipeline design codes (i.e., PRCI 2009; ALA 2005; ASCE Committee 2014). There is still no systematic solution or recommendation by design codes to consider the effect of trenching and backfilling on lateral soil resistance. Therefore, the comparison was independently made only for backfill and native ground assuming uniform soil in the zone Ⅰ and Ⅲ. Figure 13 shows the p-y comparison both in drained and undrained conditions depending on the applicability.
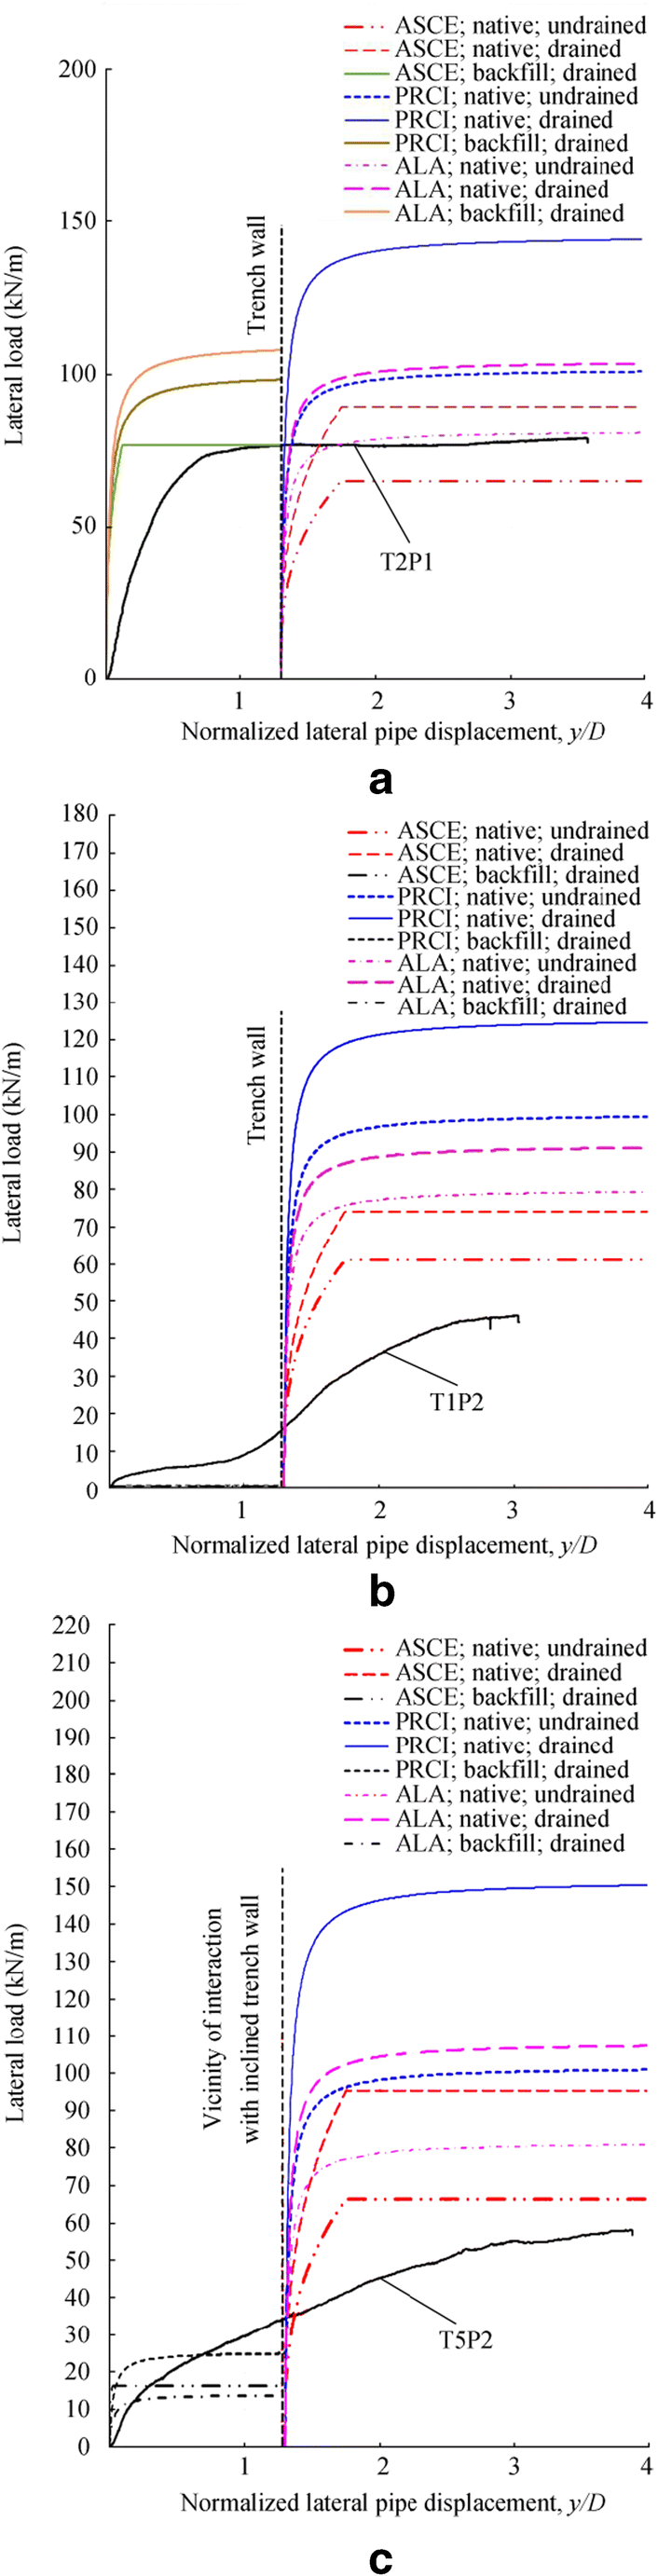 Figure 13 The comparison of the p-y responses between the test results and design codes. a T2P1 (sand backfill). b T1P2 (slurry backfill). c T5P2 (chunky backfill)
Figure 4 was used to extract the soil strength parameters for the undrained condition. The soil parameters for drained parameters were adopted from the tri-axial tests (Paulin 1998). It is worth mentioning that the PRCI (2009) and ALA (2005) guidelines have solutions both for drained and undrained conditions by superposing the contribution of effective friction angle and effective cohesion for drained conditions and considering the undrained shear strength for the undrained condition. The ASCE Committee (2014) provides separate solutions for sand and clay using the friction angle and undrained shear strength, respectively. To use the recommended equations for clay under drained conditions, the effective cohesion was disregarded. For sand, the effective friction angle was used in the proposed equations. Unlike the ASCE Committee (2014), the formulations recommended by PRCI (2009) and ALA (2005) do not cover the low range of friction angles preventing them from being used for very soft slurry backfill used in this study.
The comparison of experimental p-y results with the existing solutions in Figure 13 shows that the lateral soil resistance can be significantly underestimated in zone Ⅰ and overestimated in zone Ⅲ if the trenching/backfilling effects are ignored. Figure 14 schematically shows the comparison of the observed soil resistance trends.
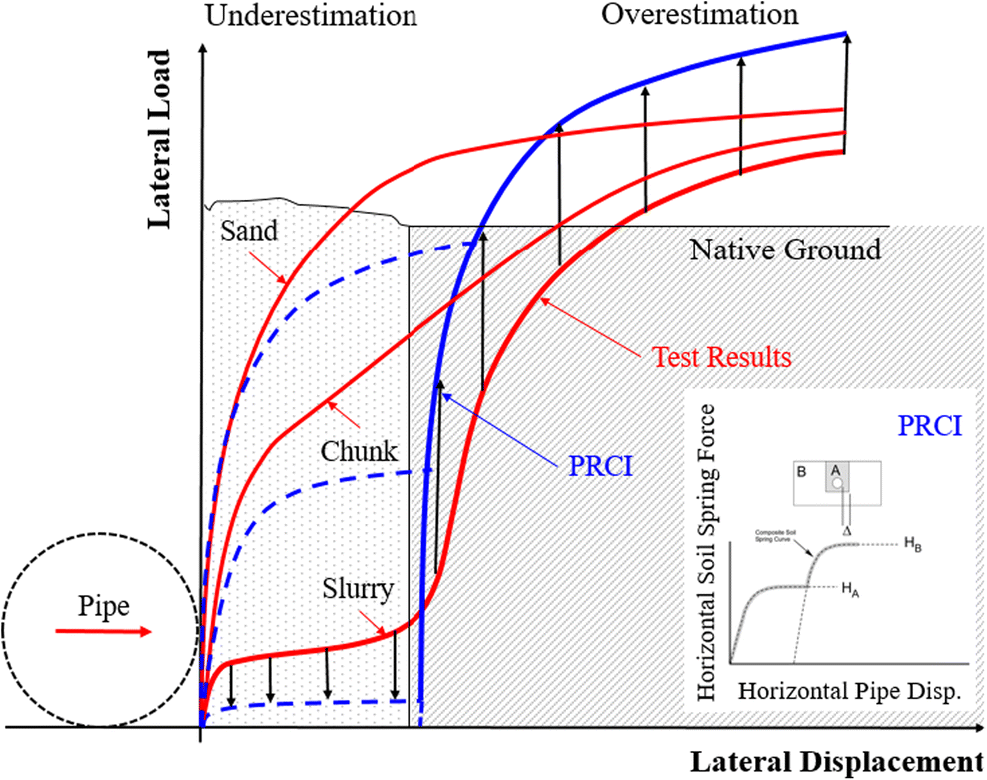 Figure 14 Schematic illustration of the difference between the p-y curves predicted by design code and experimental observations
The PIV results suggest that the underestimation of the soil resistance inside the backfill (zone Ⅰ) is due to neglecting the pipeline-trench bed interaction. This effect is less significant in the case of sand backfill (T2P1).
The overestimation of ultimate soil resistance in the native ground (zone Ⅲ) is because of the trench effect and the lower magnitude of the passive pressure against the collapsing trench wall that is provided by a softer backfill. Both of these effects are currently neglected by design codes (e.g., DNVGL-RP-F114 2017; PRCI 2009; ALA 2005; ASCE Committee 2014) due to less explored soil deformation mechanisms. Also, Figure 13 shows that the design codes underestimate the lateral soil resistance in zone Ⅱ or transition from backfill to native ground. This implies more risk on pipeline design since the majority of pipeline displacements occur in these ranges. A proper estimation of the soil resistance in these domains could result in a more cost-effective design.
5 Conclusions
The effect of backfilling shear strength on the lateral soil resistance against the moving pipeline was investigated by performing three small-scale centrifuge tests. Sand, slurry, and chunky clay backfills were investigated. Internal soil deformations and failure mechanisms in the soil surrounding the pipe were investigated by using a transparent observation window and PIV analysis. The partially drained condition was adopted to magnify the significance of pipeline-backfill-trench interaction. Several important aspects were observed that are shortly summarized as below:
• Regardless of the backfill stiffness, the presence of the trench results in less ultimate lateral soil resistance against the pipe when approaching/penetrating the trench wall. This resistance reduction is due to the progressive collapse of the trench wall into the backfill. The magnitude of the reduction depends on the stiffness of the backfill and the amount of passive lateral pressure that the backfill material mobilizes against the active trench collapse.
• Soft backfill, i.e., slurry, mobilizes less passive pressure against the trench wall failure. This, in turn, causes full development of shear bands in the trench wall towards the soil surface, slipping the slices of the trench wall into the trench, and reduction of lateral soil resistance. In the case of backfills with higher shear strength, i.e., sand, the passive pressure is increased and prevents developing full shear bands. This, in turn, increases the lateral soil resistance. The chunky backfill with moderate shear strength shows a moderate p-y response in between the slurry and sand.
• Pipeline-trench bed interaction significantly contributes to the lateral soil resistance against the pipe moving inside the trench and also the ultimate soil resistance against the pipe penetrating into the trench wall. This effect is less significant in the case of sand backfill.
Overall, the study showed a significant effect of trenching/backfilling and the backfilling shear strength on the lateral soil resistance against the large pipeline displacements. These effects depend on a wide range of parameters including but not limited to the trench configuration, seabed soil properties, construction methodologies, nature of applied loads, site-specific conditions, etc. Incorporation of trenching/backfilling effect can result in a safer and more cost-effective design.
-
Figure 1 The lateral response of trenched pipeline to submarine ground movement
Figure 2 Test setup and post-test conditions (dimensions in mm). a Schematic view of dimensions. b Post-test condition
Figure 3 Flowchart of test preparation and testing procedure
Figure 4 Schematic configuration of the T-bar site and the measured undrained shear strength profiles with linear curve fits.
Figure 5 Identified zones of pipeline displacements with different failure mechanisms
Figure 6 The p-y responses of tests with slurry, chunk, and sand backfills
Figure 7 Sample of PIV analysis results in zone Ⅰ
Figure 8 Contracting spiral flow mechanism of slurry backfill
Figure 9 Sample of PIV results for T2P1 and T1P2 in zone Ⅱ
Figure 10 Sample of PIV results and soil displacement in zone Ⅲ of T1P2 and T2P1
Figure 11 Strain contours obtained from PIV analysis for T1P2 and T2P1
Figure 12 Pore pressure variation in backfill (BF), native ground (NG), and rear of the pipe. a T1P2 (slurry backfill). b T2P1 (sand backfill). c T5P2 (chunky backfill)
Figure 13 The comparison of the p-y responses between the test results and design codes. a T2P1 (sand backfill). b T1P2 (slurry backfill). c T5P2 (chunky backfill)
Figure 14 Schematic illustration of the difference between the p-y curves predicted by design code and experimental observations
Table 1 Summary of the backfilling and native soil properties
Test ID Trench backfill type Native cu at pipe invert (kPa) Native water content before and after the test (%) ϒsat (kN/m3) Native soil mudline strength, Sum (kPa) Native soil Strength gradient, ksu (kPa/m) Backfill mudline strength, Sum (kPa) Backfill strength gradient, ksu (kPa/m) T1P2 Slurry 17.6 32.04–32.97 18.33 15 1.15 0 0.10 T5P2 Chunk 18 30.12–32.13 18.43 15 1.15 2 1.60 T2P1 Sand 17.9 31.86–32.56 18.56 15 1.15 N/A N/A -
ALA (2005) Guidelines for the design of buried steel pipe. American Lifelines Alliance, a partnership between FEMA and ASCE, 68-72. https://www.americanlifelinesalliance.com/pdf/Update061305.pdf ASCE Committee (2014) Soil parameters for assessing axial and transverse behaviour of restrained pipelines—Part 2: Transverse behavior. Pipelines 2014: From Underground to the Forefront of Innovation and Sustainability, ASCE, Portland, 1849–1863. https://ascelibrary.org/doi/abs/10.1061/9780784413692.167?src=recsys Burnett AJ (2015) Investigation of full scale horizontal pipe–soil interaction and large strain behaviour of sand. MSc. thesis, Queen's University Kingston, Ontario, Canada. http://hdl.handle.net/1974/12722 Chaloulos YK, Bouckovalas GD, Zervos SD, Zampas AL (2015) Lateral soil-pipeline interaction in sand backfill: effect of trench dimensions. Comput Geotech 69: 442–451. https://doi.org/10.1016/j.compgeo.2015.05.014 Das BM, Seeley GR (1975) Uplift capacity of buried model piles in sand. 101(GT10), 91–94. https://trid.trb.org/view/35387 DNVGL-RP-F114 (2017) Recommended practice for Pipe-soil interaction for submarine pipelines. Det Norske Veritas. Oslo. Norway Hansen JB (1948) The stabilizing effect of piles in clay. CN Post No. 3, Christiani and Nielson, Copenhagen, Denmark, November, 14–15. Hansen JB, Christensen NH (1961) The ultimate resistance of rigid piles against transversal forces. Geoteknisk Institut, Copenhagen Kianian M, Shiri H (2019) The influence of pipeline-trench bed interaction intensity on lateral soil resistance and failure mechanisms. Int J Geotech Eng 14(7): 752–765. https://doi.org/10.1080/19386362.2019.1709948 Kianian M, Esmaeilzadeh M, Shiri H (2018) Lateral response of trenched pipelines to large deformations in clay. Offshore Technology Conference. Houston. Texas. USA. May 2018. OTC-28842-MS, 1–4. https://doi.org/10.4043/28842-MS Merifield RS, Sloan SW, Yu HS (2001) Stability of plate anchors in undrained clay. Géotechnique 51(2): 141–153. https://doi.org/10.1680/geot.2001.51.2.141 Paulin M (1998) An investigation into pipelines subjected to lateral soil loading. PhD. thesis, Memorial University of Newfoundland, St. John's, Canada Phillips R, Nobahar A, Zhou J (2004) Trench effects on pipe-soil interaction, Proceeding of International Pipeline Conference, Calgary, Alberta, Canada, IPC2004-141 PRCI (2009) Guidelines for constructing natural gas and liquid hydrocarbon pipelines through areas prone to landslide and subsidence hazards. In Pipeline Research Council International. Chantilly. VA. USA Randolph MF, Houlsby GT (1984) The limiting pressure on a circular pile loaded laterally in cohesive soil. Géotechnique 34(4): 613–623. https://doi.org/10.1680/geot.1984.34.4.613 Rowe RK, Davis EH (1982) The behaviour of anchor plates in clay. Géotechnique 32(1): 87–101. https://doi.org/10.1680/geot.1982.32.1.9 Schiffman RL (1982) The consolidation of soft marine sediments. Geo-Mar Lett 2(3–4): 199–203 Stanier SA, Blaber J, Take WA, White DJ (2016) Improved image-based deformation measurement for geotechnical applications. Can Geotech J 53(5): 727–739. https://doi.org/10.1139/cgj-2015-0253 Stewart DP, Randolph MF (1994) T-bar penetration testing in soft clay. J Geotech Eng 120(12): 2230–2235. https://doi.org/10.1061/(ASCE)0733-9410(1994)120:12(2230) Tschebotarioff GP (1973) Foundations, retaining and earth structures. McGraw-Hill Book Company, New York, 340–365 Wantland GM, Consultants W, Kalajian EH (1979) Pipeline lateral stability in soft clay. Offshore Technol Conf 34:217–220. https://doi.org/10.2118/8528-PA White DJ, Take WA, Bolton MD (2003) Soil deformation measurement using particle image velocimetry (PIV) and photogrammetry. Geothechnique 53(7): 619–631. https://doi.org/10.1680/geot.2003.53.7.619 White DJ, Gaudin C, Boylan N, Zhou H (2010) Interpretation of T-bar penetrometer tests at shallow embedment and in very soft soils. Can Geotech J 47(2): 218–229. https://doi.org/10.1139/T09-096