On Wave-Induced Elastic Deformations of a Submerged Wave Energy Device
https://doi.org/10.1007/s11804-020-00142-6
-
Abstract
Structural integrity has remained a challenge for design and analysis of wave energy devices. A difficulty in assessment of the structural integrity is often laid in the accurate determination of the wave-induced loads on the wave energy devices and the repones of the structure. Decoupled hydroelastic response of a submerged, oscillating wave energy device to extreme nonlinear wave loads is studied here. The submerged wave energy device consists of an oscillating horizontal disc attached to a direct-drive power take-off system. The structural frame of the wave energy device is fixed on the seafloor in shallow water. Several extreme wave conditions are considered in this study. The nonlinear wave loads on members of the submerged structure are obtained by use of the level Ⅰ Green-Naghdi equations and Morison's equation for cylindrical members. Distribution of Von Mises stresses and the elastic response of the structure to the extreme wave loads are determined by use of a finite element method. The decoupled hydroelastic analysis of the structure is carried out for devices built by four different materials, namely stainless steel, concrete, aluminium alloy, and titanium alloy. The elastic response of these devices is studied and results are compared with each other. Points of maximum stress and deformations are determined and the structural integrity under the extreme conditions is assessed. It is shown that the proposed approaches provide invaluable information about the structural integrity of wave energy devices.-
Keywords:
- Renewable energy ·
- Wave energy converter ·
- Wave loads ·
- Hydroelasticity ·
- Green-Naghdi equations
-
1 Introduction
A survey conducted by the World Energy Council (2013), and others before, shows that fossil fuel resources are reduced and its share over the world energy demand is decreasing annually. As the reserve of fossil-based resources is limited, it is certain to be depleted in the future. Moreover, the use of fossil fuels has a significant negative impact on the global environment. In light of the above, the use of renewable energy as a sustainable source of energy has received significant attention in recent years. Johansson et al. (2012), for example, predicted that renewable energy (biomass, hydro, wind, solar, and geothermal) will increase from 10% of world energy supply in 2012 to 15%–30% in 2030, to 20%–75% in 2050, and to 30%–95% in 2100.
There are four main categories of marine renewable energy resources from the oceans, namely ocean thermal energy conversion (OTEC), wave energy, current tidal energy, and wind energy. Compared with other sources of marine renewable energy, wave energy has some distinct advantages: (ⅰ) wave energy is highly available and predictable, (ⅱ) waves provide the highest energy density, (ⅲ) waves have little energy loss in a long distance travel (e.g. see Clément et al. 2002; Thorpe 1999; Drew et al. 2009; Polinder and Scuotto 2005; Pelc and Fujita 2002 for details).
The wave energy technology is relatively new. Economically, it currently cannot compete with more mature technologies, such as wind energy. However, the interest from the governments and industries is increasing steadily. Over the past 25 years, wave energy technology has undergone a cycle of enthusiasm, disappointment, and reconsideration. But the continued development and efforts in technology are constantly changing the performance of wave energy technology.
Wave energy is yet to become an economical solution. There are several challenges with typical wave energy converter (WEC hereafter) devices (see Drew et al. 2009; Antonio 2010; Cruz 2007 for details). These include:
1) Converting the slow, random, high-force oscillating motion of waves into functional motion to generate electricity,
2) Wave direction is usually variable. Most of the devices, however, are most effective in a certain direction,
3) The devices are often under the impact of extreme wave loads near the surface,
4) The ocean environment is highly corrosive, and devices with complex structure and components suffer from the operation and maintenance challenges,
5) Floating devices on the surface create visual obstruction and limitation to shipping.
In response to some of the challenges with the existing wave energy devices, Hayatdavoodi et al. (2017a) have proposed a fully submerged wave energy converter solution. The submerged wave energy device (SWED hereafter) consists of a horizontal disc connected to a direct-drive power take-off (PTO) system. The disc is allowed to oscillate in the vertical direction due to the wave-induced loads. Other motions of the disc are restricted by use of guide rails. The device structure is fixed on the seabed. Since SWED is fully submerged, it is protected from the impact of the extreme wave on the surface. In fact, extreme wave conditions are desirable to SWED. The structure of SWED is simple, it is relatively easy to maintain, and it operates independent of the wave direction.
SWED can use corrosion resisting materials to operate under seawater. A major component of the device is the oscillating disc. The oscillating part and the structural parts of SWED can be constructed using different corrosion resisting materials. This study is concerned with the structural analysis of SWED, made up of concrete, aluminium alloy, titanium alloy and stainless steel.
In addition to SWED, submerged horizontal discs have been used as the core component of several other wave energy devices (see, e.g., Carter and Ertekin 2014; Graw 1997; Newman 2016, for various applications). Additionally, flapping foils have been used as an energy extraction device (see, e.g., Daniel 2002; Filippas et al. 2018; Jeanmonod and Olivier 2017; Priovolos et al. 2018; Xiao and Zhu 2014). The goal of this study is to determine the nonlinear wave loads on a submerged horizontal disc, and cylindrical members of the wave energy device, and to assess the structural integrity under the extreme wave conditions. Various materials are proposed to construct wave energy devices. This study aims to assess the vulnerability of the structures made by these materials, and hence provide information on the suitability of such material for wave energy devices.
The submerged wave energy device is introduced in Section 2. This is followed by a discussion of the extreme environmental condition that is considered in this study. The theories used to determine the wave-induced loads on the structure are given in Section 3, followed by a review of the structural analysis theory. The paper continues with the results and discussion of wave loads on the energy device and deformation of the structure due to this loads. The paper is closed by the concluding remarks.
2 The Submerged Wave Energy Device
In responses to common challenges of the commercial wave energy devices, Hayatdavoodi et al. (2017a) have proposed a fully submerged solution that functions independent of the wave direction.
The submerged wave energy device (SWED) consists of a fully submerged body (circular disc or a three-dimensional wedge shape) that is allowed to oscillate vertically due to the wave loads, while other motions are restricted. In this study, we confine our attention to an oscillating submerged disc. Propagation of waves above the submerged disc results in an oscillatory pressure differential above and below the disc. The pressure differential, in return, results in a net force (three-dimensional in general) on the disc. The oscillatory wave-induced forces cause vertical oscillations of the disc. Guide rails are used to restrict the motion of the disc in other directions. A schematic of SWED is shown in Figure 1, also showing the coordinate system and directions that we use in this section. The equation of the vertical motion of the disc is given by
$$ {\Sigma} F = m s_{,tt,} $$ (1)  Figure 1 Orthographic projection and isometric views of SWED (unit: m)
where ΣF is the sum of vertical forces and m is the mass of the disc. s = s(t) specifies the vertical position (in the z direction) of the disc, measured from a fixed reference (here from the still-water level, SWL). s, tt is the instantaneous acceleration of the disc.
ΣF is the sum of all forces contributing to the vertical oscillation of the disc, namely the wave-induced vertical force (Fz), the PTO force (FPTO), the spring (control) force (Fk), and the friction force (Ff) between the disc and the guide rails, i.e.
$$ {\Sigma} F = F_{z} + F_{\text{PTO}} + F_{k} + F_{f}. $$ (2) In Eq. (2), Fk(z, t) = −k(s − s0), where k is the spring stiffness and s0 is the initial (neutral) vertical position of the spring. The spring is used to control the motion of the disc. The friction force is defined by $ F_{f}(z,t) = -\left (\frac {|s_{,t}|}{s_{,t}}\right ) \mu F_{x} $, where s, t is the velocity of the disc, μ is the friction coefficient between the disc (or the bearing attached to the disc) and the guide rails, and Fx(z, t) is the wave-induced horizontal forces on the disc. The term $ \left (\frac {|s_{,t}|}{s_{,t}}\right ) $ is used to determine the appropriate sign of the friction force, based on the oscillation direction. FPTO(z, t) = −cs, t where c is the equivalent damping coefficient of the PTO. The wave-induced vertical and horizontal forces on the disc are determined by use of the Green-Naghdi Equations and will be discussed in the following section.
The disc is connected to a direct-drive PTO system for the energy extraction. The direct-drive PTO connects to the oscillating disc by use of a shaft. With the motion of the disc, a permanent magnet linear synchronous generator (PMLSG) with a toothed stator within the PTO system will generate the power output (see, for example, Polinder and Scuotto 2005; Vermaak and Kamper 2012 for details).
3 Wave Loads
An essential characteristic of the wave energy device that must be carefully assessed is structural integrity. Loads and responses on the structure include the wave loads, foundation/mooring loads, and loads and vibrations due to the disc oscillations. The structural responses include the oscillation of the disc and the elastic deformation of the body due to the loads. Other than the disc, the wave energy device is fixed on the seabed. In this study, waves are assumed long crested, and hence the model and calculations of wave loads on the disc are developed and carried out in two dimensions. The prime mover of the device is a circular disc. Its oscillation is due to the pressure differential above and below the disc. Due to the circular shape of the prime mover, the oscillations are independent of the wave direction. The wave-induced load is distributed uniformly into the page, and hence, the two-dimensional calculations provide a conservative estimation of the wave loads on the disc.
In this study, we confine our attention to interaction of long-crested waves with the submerged wave energy system. The prime mover of the device is a circular disc. The wave-induced loads on the disc are obtained by use of the level Ⅰ GN equations, and the calculations are performed in 2D, resulting in conservative load distribution over the circular disc. The frame of the wave energy device is made of circular members that are stretched over the three spatial directions. Wave loads on the fixed frame are obtained by use of Morison's equation, considering the flow distribution in the three-dimensional space.
The level Ⅰ Green-Naghdi (GN) nonlinear shallow-water wave equations are originally developed by Green and Naghdi (1976a, b) for incompressible fluids of small thickness (depth). In the general form, the GN equations are applicable to viscous or inviscid fluids, and whether homogeneous or nonhomogeneous. The GN equations satisfy the nonlinear free surface and seafloor boundary conditions exactly, and the integrated balance laws of mass and momentum are postulated. In this theory, by use of the Cosserat surfaces (see Green et al. (1965) and Ertekin et al. (2014)), the variation of the vertical velocity along the fluid sheet is prescribed. In the level Ⅰ GN equations, also known as the restricted theory, the vertical component of particle velocity is assumed to vary linearly along the water column. This assumption, along with the incompressibility condition, results in uniform distribution of the horizontal velocity across the water column. The level Ⅰ GN equations are mostly applicable to the propagation of fairly long water waves in shallow depth. Unlike classical water wave theories, in the GN equations, there is no restriction on the rotation of the flow (see, e.g., Kim et al. 2001; Zhao et al. 2015 for details).
Here, attention is confined to the two-dimensional motion of a homogeneous, incompressible and inviscid fluid sheet. The rectangular Cartesian coordinate system is chosen such that the x-y plane is the SWL. The motion of the fluid sheet is restricted to the horizontal x and vertical z plane. That is, the velocity component in the y direction (into the page) is assumed zero. The gravitational acceleration g is in the − z direction. The fluid mass density ρ is constant. We do not consider wave-breaking over the structure.
Ertekin (1984, 1986) have obtained the level Ⅰ GN equations in classic form. These equations for a stationary and flat seafloor are given as
$$ \eta_{,t}+ \{(h+\eta) u_{1}\}_{,x}=0, $$ (3a) $$ \dot{u}{_{1}} + g \eta_{,x}+\frac{\hat{p}_{,x}}{\rho}=-\frac{1}{3}\{2\eta_{,x} \ddot{\eta}+(h+\eta)\left( [\ddot{\eta}]\right)_{,x}\}, $$ (3b) where η(x, t) is the surface elevation measured from the SWL, V(x, z, t) = u1e1 + u2e2 is the velocity vector, e1 and e2 are the unit normal vectors in x and z directions respectively, $ \hat {p}(x,t) $ is the pressure on the top surface of the fluid sheet, and h is the water depth. Superposed dot in Eqs. (3b) denotes the two-dimensional material derivative and double dot is defined as the second material derivative. All lower case Latin subscripts with comma designate partial differentiation with respect to the indicated variables. Dimensionless form of the level Ⅰ GN equations are given in Hayatdavoodi et al. (2018).
The pressure on the bottom curve (α), $ \bar {p} $, is given explicitly (see Ertekin (1984)) as
$$ \bar{p}(x,t) =\left( \frac{\rho}{2}\right)\left( h+\eta-\alpha \right) \left( 2\ddot{\eta} +2g \right) + \hat{p,} $$ (4) for a flat and stationary seafloor. The vertical component of particle velocity is given by
$$ u_{2}=\frac{z+h}{\left (h +\eta \right )}\dot{\eta,} $$ (5) (see, e.g., Ertekin 1988).
In this study, we are specifically concerned with the interaction of long-crested nonlinear water waves with a thin, submerged, horizontal disc. Hayatdavoodi et al. (2016) have shown that wave-induced loads on a submerged, fixed disc are larger than those on a submerged, oscillating disc. For the structural analysis carried out in this study, we will use the loads on a fixed disc placed at various submergence depths. This should provide us with a conservative load estimation.
Hayatdavoodi and Ertekin (2015b, c) have developed a model based on the above GN equations for the interaction of water waves with a submerged fixed disc. In this approach, the computational domain is separated into four regions, namely R-Ⅰ, R-Ⅱ, R-Ⅲ, and R-Ⅳ. Region R-Ⅰ is the upwave region, x ≤ XL, where the leading edge of the disc is fixed at XL. The surface is free and hI is the constant water depth throughout the region. Region R-Ⅱ is above the disc, XL ≤ x ≤ XT and − S ≤ z < η, where the trailing edge of the disc is fixed at XT. The surface is free and the water depth is S, also defined as the submergence depth of the disc. Region R-Ⅲ is the region below the disc, XL ≤ x ≤ XT and − hI ≤ z ≤−S, where the thickness of the fluid sheet, and thus the surface, is specified, hIII. Region R-Ⅳ is the downwave region, XT ≤ x, where the surface is free and the constant water depth, hI, is the same as in Region R-Ⅰ. That is, we assume a flat seafloor at the location of the device. This, however, is not always necessary. Also note that the disc is thin, i.e. S + hIII = hI.
Equations of motion specified in each region are derived and given in Hayatdavoodi and Ertekin (2015b), and are summarized here. In Regions R-Ⅰ, R-Ⅱ and R-Ⅳ, the atmospheric pressure is assumed zero on the top surface, $ \hat {p}=0 $, without loss in generality. The equations of motion, Eqs. (3b), the vertical component of the particle velocity, and pressures at the bottom of the fluid sheet are given by
$$ \eta_{,t}+ \{(h+\eta) u_{1}\}_{,x}=0, $$ (6a) $$ \dot{u_{1}} + g \eta_{,x}=-\frac{1}{3}\{ \left( 2\eta_{,x} \ddot{\eta} \right)+\left( h+\eta \right) \ddot{\eta}_{,x}\}, $$ (6b) $$ u_{2}=\frac{z + h}{\left (h +\eta \right )} \dot{\eta,} $$ (6c) $$ \bar{p}=\left( \frac{\rho}{2}\right)\left( h+\eta \right) \left( \ddot{\eta} +2g \right), $$ (6d) where h = hI in Regions R-Ⅰ, R-Ⅳ and h = S in Region R-Ⅱ. In R-Ⅲ, the thickness of the fluid sheet, hIII, is prescribed and thus $ \hat {p} $ remains unknown, and the level Ⅰ GN (3b) reduce to (see Hayatdavoodi and Ertekin (2015a, b))
$$ u_{1,x}=0, $$ (7a) $$ u_{1,t} + \frac{\hat{p}_{,x}}{\rho}=0, $$ (7b) which is the velocity field of a uniform flow in the horizontal direction.
In order to obtain a uniformly valid solution in the entire domain, $ -\infty \lt x \lt \infty $, the solutions in the separate regions are matched by use of jump and matching conditions at the discontinuity curves at the leading and trailing edges of the disc. The jump conditions are demanded by the integral balance laws, used to derive the governing equations of the theory, and ensure that mass and momentum is conserved across the discontinuity curves (see Hayatdavoodi 2013 for details).
The GN system of equations of the entire domain consists of the governing equations in each of the four regions and the jump and matching conditions at the discontinuity curves at the leading and trailing edges of the disc. The nonlinear level Ⅰ GN equations (6a) and (6b) are solved in Regions R-Ⅰ, R-Ⅱ (above the disc) and Region R-Ⅳ, for the unknown functions η(x, t) and u1(x, t) simultaneously. In Region R-Ⅲ, Eqs. (7) are solved for the unknowns u1(t) and $ \hat {p}(x,t) $, all together with the unknowns in other regions.
A numerical wavemaker capable of generating nonlinear cnoidal waves is set on the left-boundary of the wave tank. Details of the cnoidal solutions of the GN equations, along with the specific numerical conditions used in the wavemaker of this problem can be found in Hayatdavoodi (2013) (also see, e.g., Ertekin and Becker 1998 for the cnoidal-wave solution of the level Ⅰ GN equations). On the right-boundary of the wave tank, an open boundary condition, the Orlanski's condition with constant phase speed $ c=\pm \sqrt {g h_{\text {I}}} $ is imposed.
The system of equations is solved numerically by the central-difference method, second-order in space, and with the modified Euler method for time integration. Further details on numerical solution of the equations can be found in Hayatdavoodi and Ertekin (2015c).
Figure 2 shows time series of surface elevation and the wave-induced horizontal and vertical forces on a submerged disc, calculated by the GN model discussed here. In this figure, water depth is h = 0.071 m, wave height is H = 0.021 m, and the wavelength is λ = 1.9 m. The disc length (in wave propagation direction) is D = 0.305 m, its thickness is tD = 0.013 m, and it is located at S = 0.043 m below the SWL. Results of the GN model are compared with the laboratory measurements and CFD computations of Hayatdavoodi et al. (2015b). Overall, good agreement is observed between the results of the GN model and the laboratory measurements and CFD computations for both the surface elevation and the wave-induced forces. See Hayatdavoodi et al. (2015b) for more details about this case.
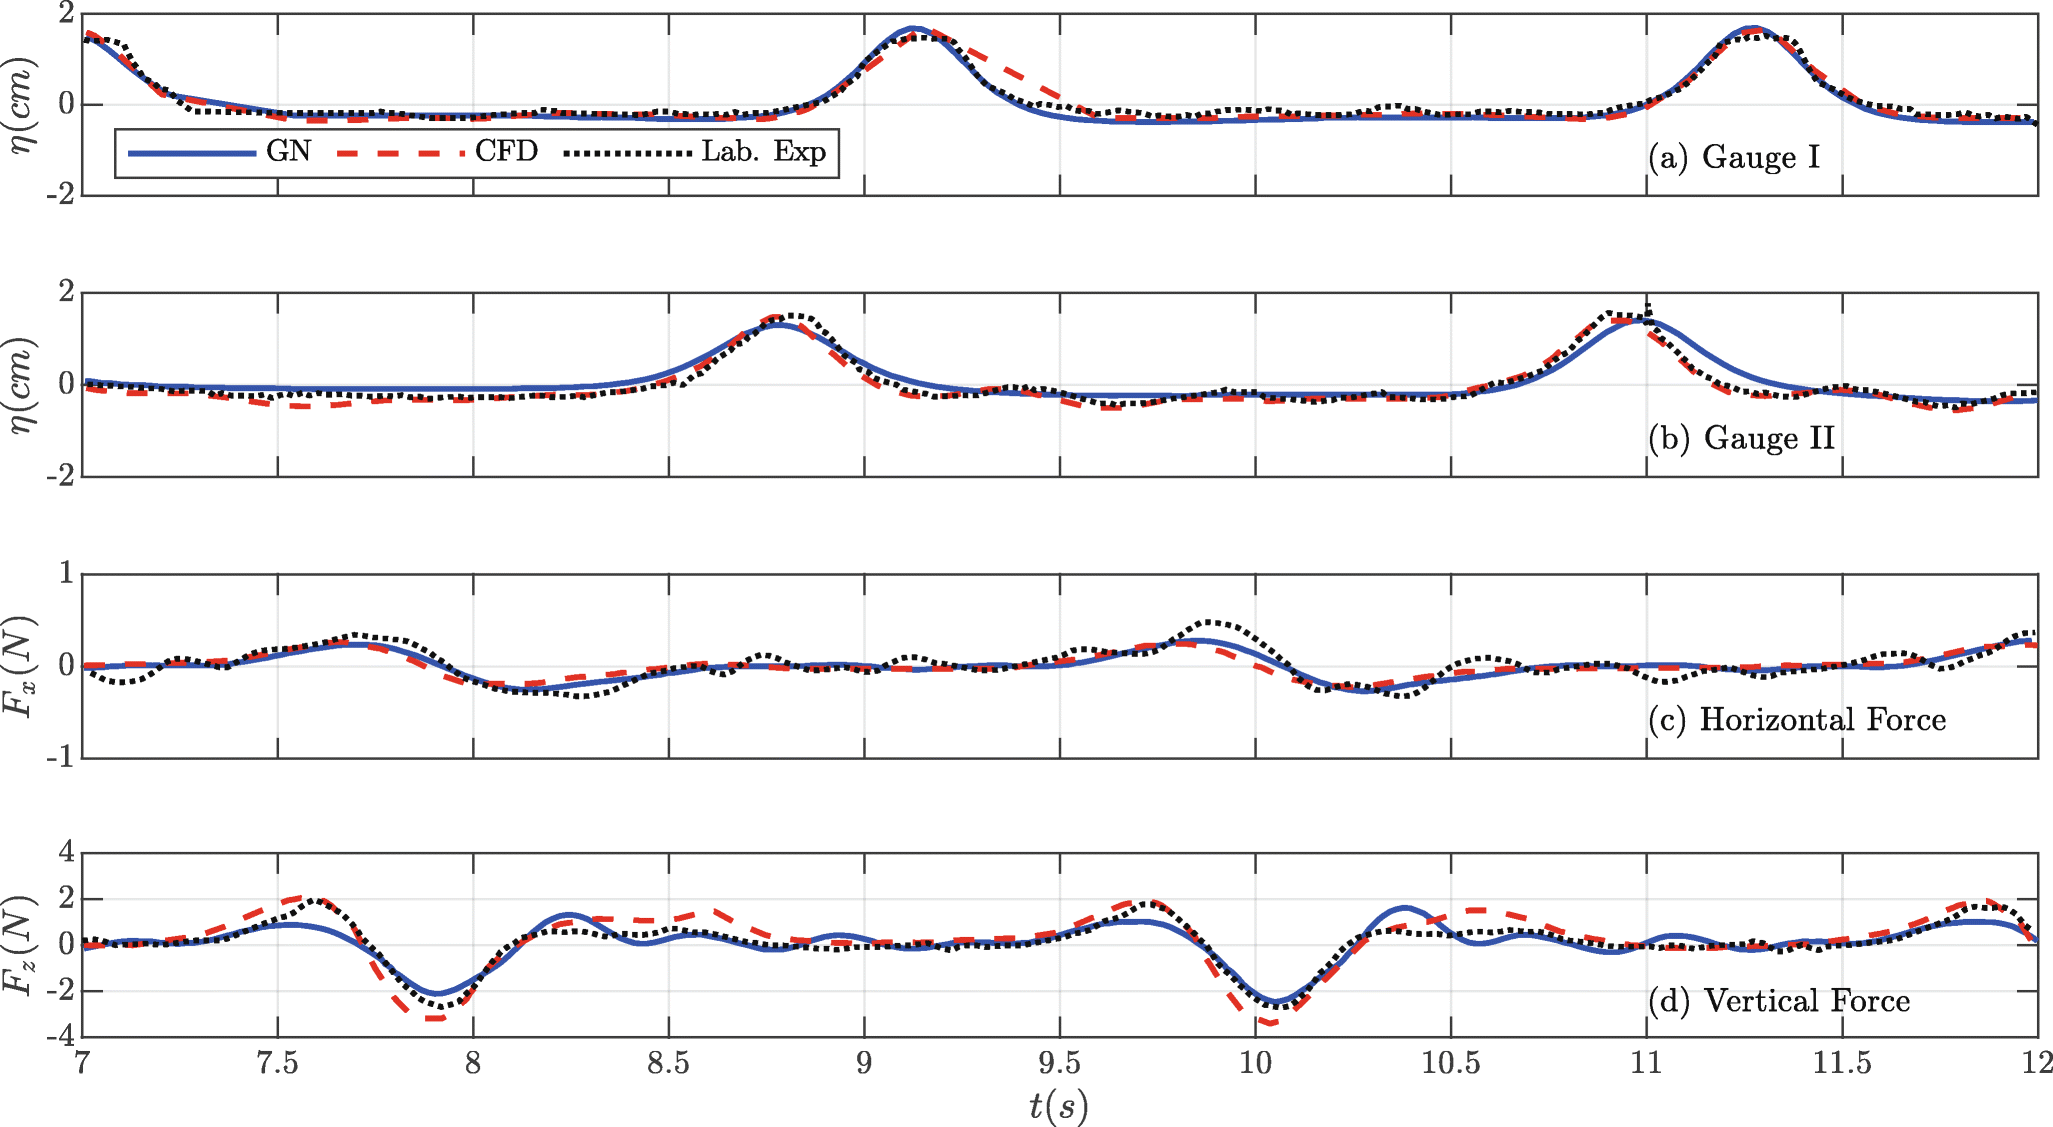 Figure 2 Time series of surface elevation and wave-induced forces on a submerged disc, calculated by the GN model, and the laboratory measurements and CFD computations of Hayatdavoodi et al. (2015b). Gauges Ⅰ and Ⅱ are located at 2D upwave and 2D downwave from the submerged disc, respectively
See Hayatdavoodi et al. (2016, 2017b, 2019) for further comparisons of the results of the GN model with laboratory experiments. See Hayatdavoodi et al. (2015a) for the application of the GN equations to wave loads on coastal bridge decks. A comparison of wave-induced pressure on horizontal surfaces calculated by the GN model and other computational approaches can be found in Liu et al. (2020).
Wave loads on the circular columns of the frame are calculated by use of Morison's equation (Morison et al. 1950). The sectional force is expressed as dF = dFI + dFd where dFI is the sectional inertia force, $ {dF}_{I}=C_{M}\rho \frac {\pi D^{2}}{4}\frac {du}{dt} $ and dFD is the sectional drag force, $ d{F_D} = {C_D}\rho \frac{D}{2}u|u| $, where u1 = u1(x, y, z, t), $ \frac {du}{dt} $ is the flow acceleration, CD is the drag coefficient, and CM is the inertial coefficient. Here we assume CD = 1.2 and CM = 2. D is the diameter of the cylindrical columns.
For inclined cylindrical members, the wave loads are determined by obtaining the velocity and acceleration distribution over the members at a given time. The fluid velocity and acceleration are obtained using the linear wave theory.
4 Structural Analysis
Our objective in this study is to determine the wave-induced stresses on the columns and disc of the device and calculate and assess their elastic deformations.
The Von Mises theory is used to determine the stresses on the structure. The Von Mises theory agrees best with the test data for ductile materials and is commonly used in design. In this study, the following relation is given between the principle stresses, σ1, σ2 and σ3 in x, y and z directions, respectively, and the yield strength, σyp, at the beginning of yield (see, e.g., Ugural 1991):
$$ {(\sigma_{1}{-\sigma}_{2})}^{2}+{(\sigma_{2}{-\sigma}_{3})}^{2}+{(\sigma_{3}{-\sigma}_{1})}^{2}=2{\sigma_{yp}}^{2}. $$ (8) The structural analysis is carried out by use of the finite element method (FEM) in ANSYS. The mesh is generated using ANSYS. The wave-induced pressure and force distribution on the device are determined using the approaches discussed in Figure 3, and then imported into ANSYS for the structural analysis.
 Figure 3 Formal structural analysis and design flowchart of the wave energy device
In this study, we carry out a decoupled hydroelasticity analysis. That is, we focus on the elastic deformation of the disc and structural members due to the wave loads. It is assumed that the relatively small elastic deformations of the device (as it will be shown in the following sections) does not alter the wave-induced loads noticeably. This shall provide a conservative response of the device to the loads.
The following steps are followed to carry out a formal structural analysis of the wave energy device:
1) Mesh generation in ANSYS,
2) Calculation of the wave loads by use of the GN and Morison's equations,
3) Structural analysis in ANSYS,
4) Structural assessment.
The flowchart of the structural design process is shown in Figure 3. Different material and structural dimensions are required if the structural assessment shows that the structure would fail due to the loads.
In this study, we will present the wave loads on different elements of the structure. The structural members are labelled in Figure 4, which will be referred to in the following sections. Several cylindrical columns are used to form the supporting frame of the device. For the structural purpose, these are assumed cylinders with diameters 0.25 m and 0.5 m. Orthographic projection of the wave energy devices, along with the dimensions used in the calculations, is shown in Figure 1. Stress and deformation on the circular disc are recorded at 10 points distributed uniformly along the main diameter. The stress sensors are shown in Figure 5.
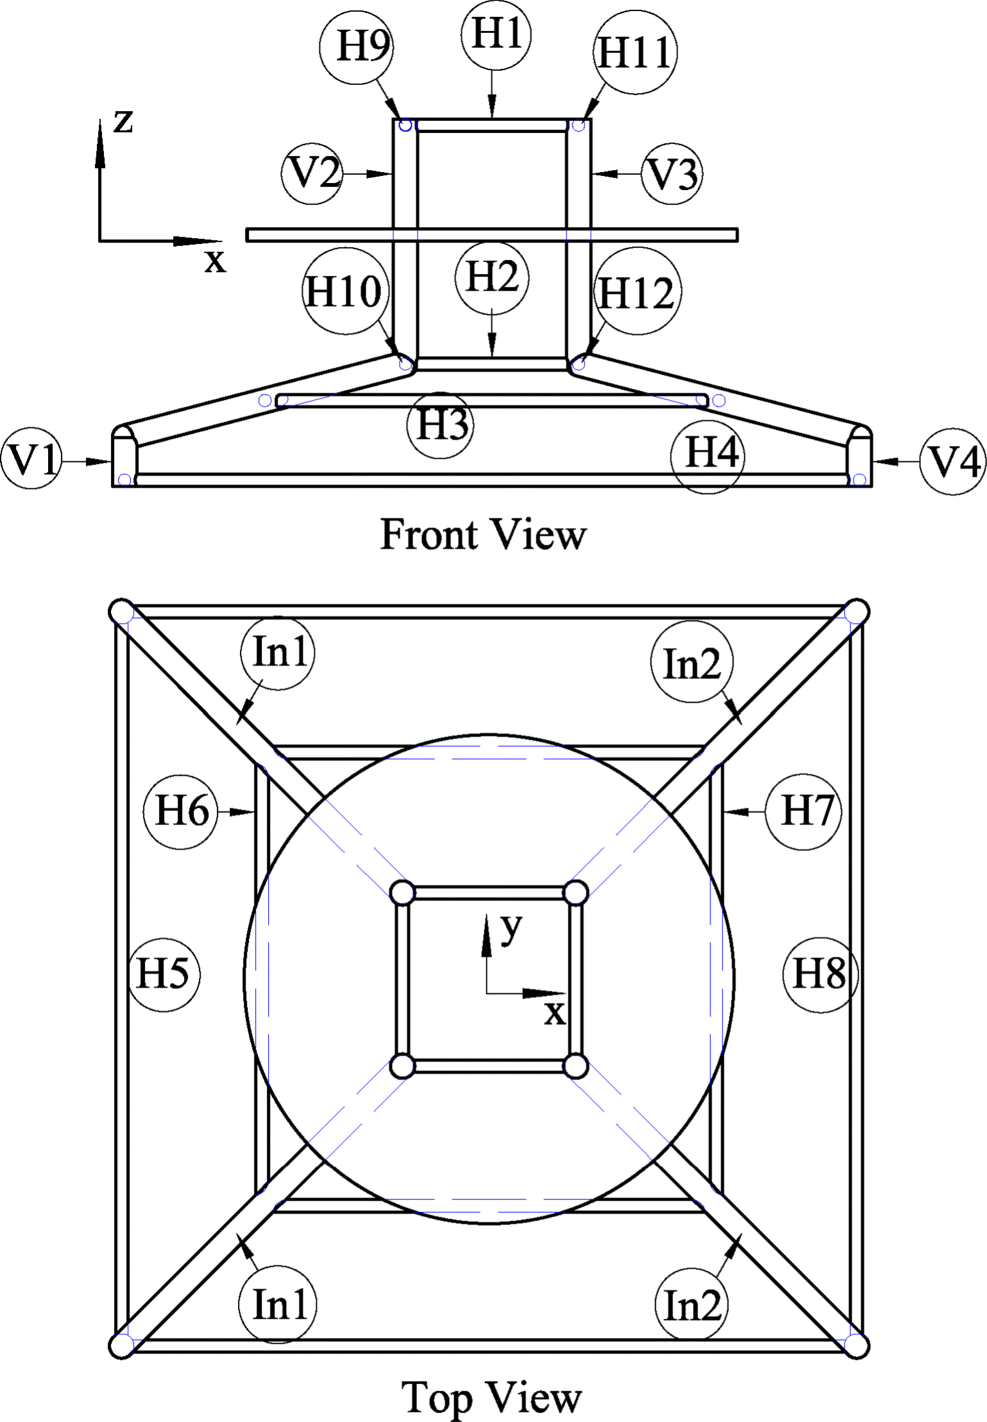 Figure 4 Structural labels which are used to refer to in the text
 Figure 5 Schematic of SWED, and the location of the pressure sensors on the disc. The sensors are 1 m apart. x = 0 m refers to the leading edge of the disc
5 Computational Setup
5.1 Structural Properties
The structural analysis of SWED is carried out for devices, made by four different materials (typically used in wave energy devices). These include concrete, aluminium alloy, titanium alloy and stainless steel. Properties of these materials are listed in Table 1.
Table 1 Properties of the materials considered in this study, given in ANSYS Inc (2016)Concrete Aluminium alloy Titanium alloy Stainless steel Density (kg/m3) 2300 2770 4620 7750 Young's modulus (Pa) 3.00E + 10 7.10E + 10 9.60E + 10 1.93E + 11 Poisson's ratio 0.18 0.33 0.36 0.31 Tensile yield strength (Pa) 0 2.80E + 08 9.30E + 08 2.07E + 08 Compressive yield strength (Pa) 0 2.80E + 08 9.30E + 08 2.07E + 08 Tensile ultimate strength (Pa) 5.00E + 06 3.10E + 08 1.07E + 09 5.86E + 08 Compressive ultimate strength (Pa) 4.10E + 07 0 0 0 5.2 Wave and Device Conditions
SWED is designed for shallow waters. In this study, we consider 12 wave conditions. This includes a combination of two wave heights, H = 3 m and H = 4 m, and two wave periods T = 10 s and T = 15 s. We assume a site with h = 10 m in this study. These wave conditions represent some extreme shallow-water wave conditions. The structural analysis is carried out at three instances of the disc oscillation, namely when the disc is submerged at S = 0.3 h, 0.5 h, and 0.7 h, where the submergence depth is measured from the SWL to the top of the disc. These results in 12 wave-structure conditions, shown in Table 2.
Table 2 Wave-structure conditions considered in this studyWave-structure conditions 1 2 3 4 5 6 7 8 9 10 11 12 Wave height, H (m) 3 3 4 4 3 3 4 4 3 3 4 4 Submergence depth, S (m) 3 3 3 3 5 5 5 5 7 7 7 7 Wave period, T (s) 10 15 10 15 10 15 10 15 10 15 10 15 Water depth is h = 10 m For the wave conditions considered here, previous studies (see, e.g., Hayatdavoodi 2013) show that the wave-induced vertical force is larger for $ \frac {D}{h} \approx 1 $, where D is the cylinder diameter. Hence, for a conservative analysis, here we D = 10 m.
Both the wave crest and wave trough may result in extreme loading and deformation of the structure, see Hayatdavoodi 2013. Hence, in the analysis of each of the wave conditions, we consider two cases for (ⅰ) wave crest above the disc at the centre, and (ⅱ) wave trough above the disc at the centre. Therefore, in total, 24 wave-structure conditions are considered.
6 Results and Discussion
Results of the wave loads on the device and the structural analysis are given and discussed in this section. Wave loads on the cylindrical members and the circular disc are presented first. This is followed by the structural analysis results of the stress distribution on the cylinders and the disc. Finally, the response of the oscillating disc to the loads made of four different materials, are given and discussed.
At first, the wave loads (time series and spatial distributions) are given for a sample wave-structure condition, namely Condition 4 given in Table 2. This is followed by results for all wave-structure conditions considered in this study.
6.1 Wave Loads on the Cylinders
Wave force on the cylindrical members (frame) of the submerged wave energy device is calculated by use of Morison's equation. The inertial and drag forces in Morison's equation depend on the flow acceleration ($ \frac {du}{dt} $) and velocity square (u|u|). We assume waves are long crested (into the page, along the y-axis) and hence u = u(x, z, t). Therefore the force distribution on the cylindrical members vary if they are horizontal (Cylinders H1–H12), inclined (Cylinders In1–In2) or vertical (Cylinders V1–V4). The horizontal members are stretched either in x direction (Cylinders H1–H4) or in y direction (H5–H12). We recall that the labels of the structural members are shown in Figure 4. For H5–H12 members, the force distribution is uniform, since waves are long crested and u = u(x, z, t). For all other members, appropriate distribution of the flow velocity and acceleration are considered to determine the force distributions.
Results in this subsection are given for all conditions and when the wave crest is above the centre of the device. The sectional forces on H5–H12 members are given in Table 3. The force distribution on other members for these conditions are shown in Figures 6, 7, and 8. As expected, the wave loads on the cylinder is distributed nonlinearly, even though the incident wave is linear.
Table 3 Force distribution (kN/m) on the horizontal cylinders (Cylinders H5 to H12) stretched in y direction, under the wave-structure conditions of Table 2 and when the wave crest is above the centre of the deviceCylinder H = 3 m, T = 10 s H = 3 m, T = 15 s H = 4 m, T = 10 s H = 4 m, T = 15 s H5 − 105.37 − 74.23 − 155.34 − 107.30 H6 − 86.51 − 62.45 − 119.76 − 85.67 H7 − 40.08 − 37.62 − 38.97 − 42.11 H8 0.44 − 15.11 30.00 − 3.13 H9 − 86.58 − 60.31 − 115.52 − 80.45 H10 − 78.86 − 57.81 − 105.22 − 77.11 H11 − 73.47 − 54.20 − 92.96 − 69.82 H12 − 67.85 − 52.17 − 86.32 − 67.31 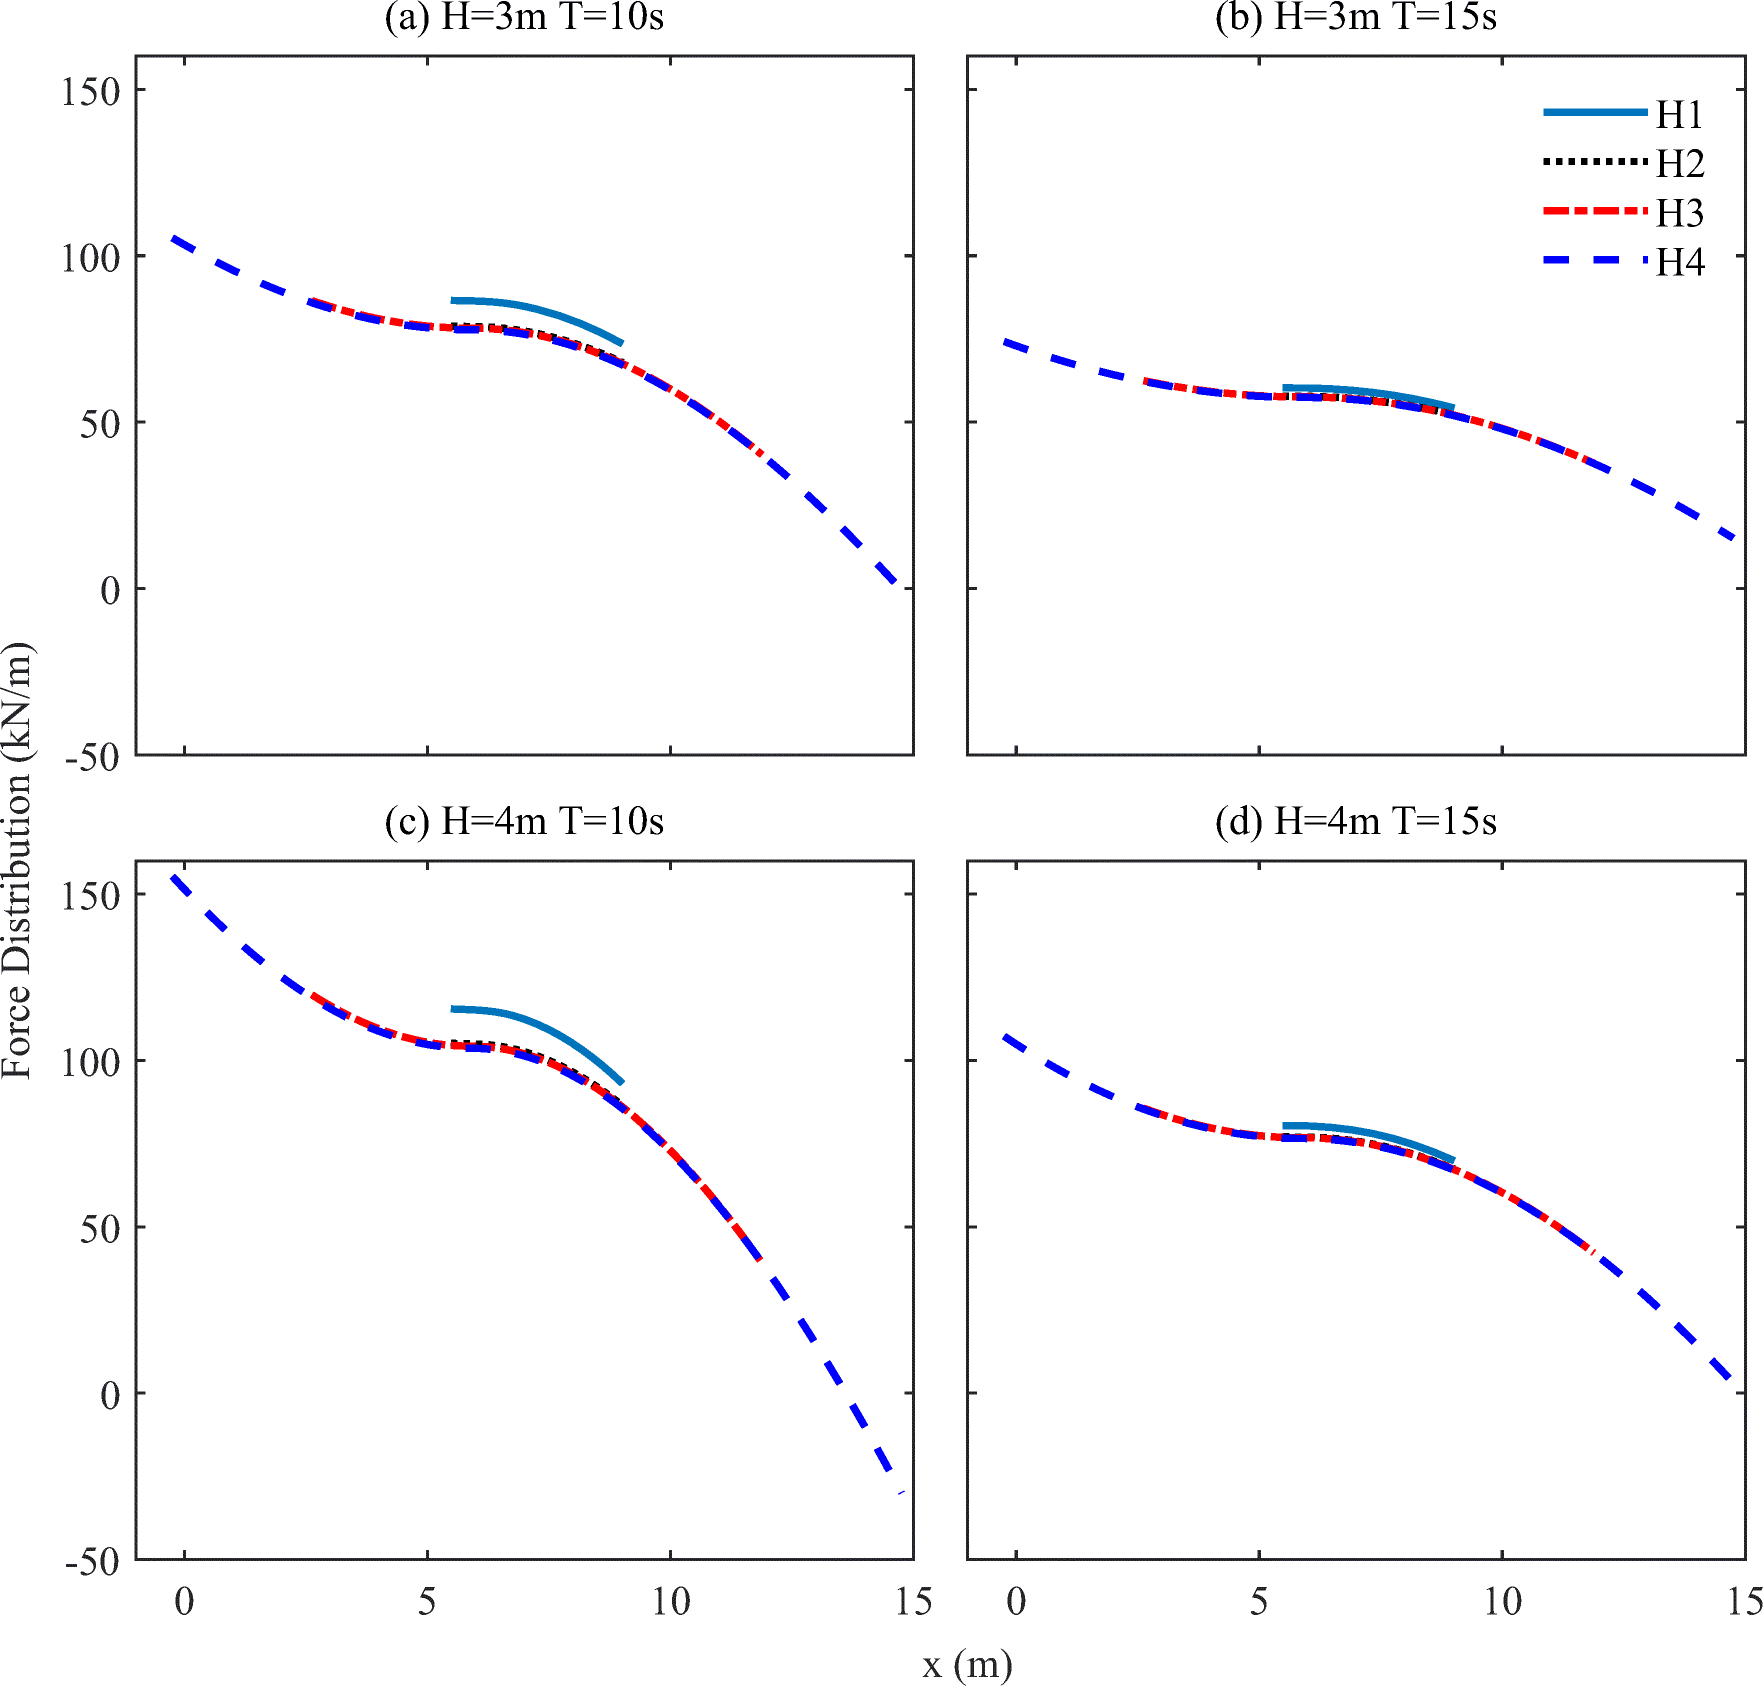 Figure 6 Force distribution on the horizontal cylinders (Cylinders H1 to H4) stretched in x direction, under all wave-structure conditions and when the wave crest is at the centre of the device
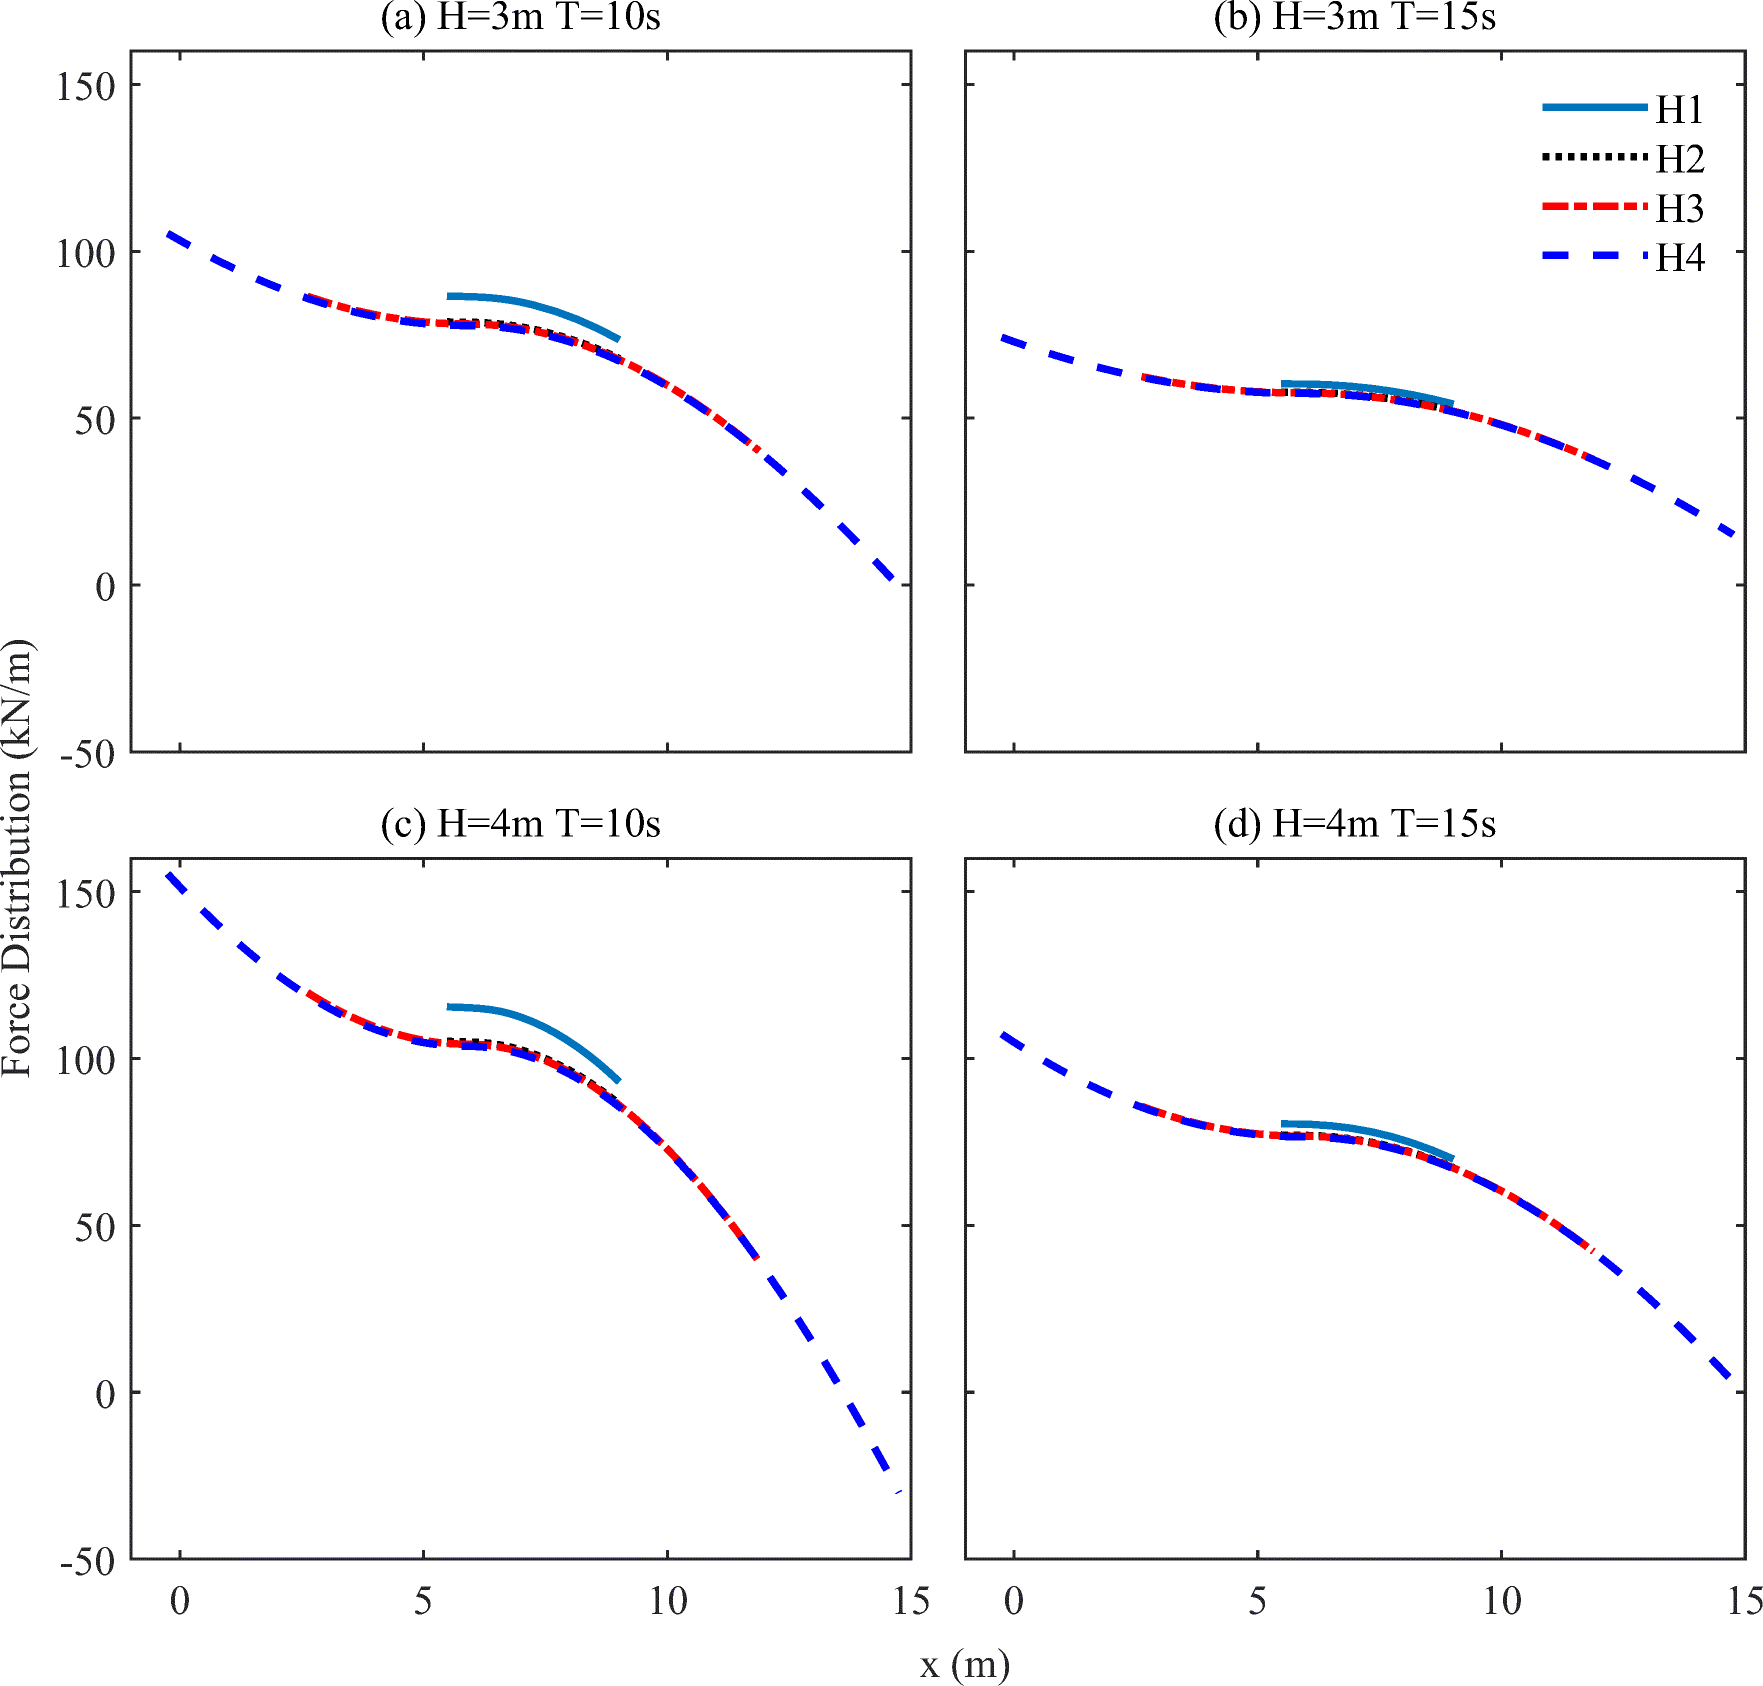 Figure 7 Force distribution on the vertical cylinders (Cylinders V1 to V4) stretched in z direction, under all wave-structure conditions and when the wave crest is at the centre of the device
 Figure 8 Force distribution on the inclined cylinders (Cylinders In1 to in2) stretched over x and z directions, under all wave-structure conditions and when the wave crest is at the centre of the device
6.2 Wave Loads on the Disc
The GN calculations are performed in two dimensions (see, e.g., Hayatdavoodi and Ertekin 2015b), assuming waves are long crested. Hence, pressure is distributed uniformly into the page across the disc. The average pressure on the disc is obtained by
$$ p=\frac{4F_{\mathrm{3D}}}{\pi D^{2}} , $$ (9) where D is the diameter of the circular disc, and F3D is the wave-induced force on the entire circular disc (3D). The two-dimensional wave-induced force (F2D) calculated by the GN equations is converted into the three-dimensional force on the entire circular disc by use of the following relation:
$$ F_{\mathrm{3D}}=\frac{\pi D}{4}F_{\mathrm{2D}} . $$ (10) Wave loads on the horizontal disc are determined by use of the level Ⅰ GN equation. Figure 9 shows time series of the wave-induced vertical force on the disc for the wave-structure Condition 4. A ramp function is used to generate the numerical wave, and hence, the force increases gradually at the beginning (see Ertekin and Becker 1998 for the ramp function). As expected, the wave-induced force is nonlinear. Also seen in this figure, the wave trough has resulted in larger force magnitude on the disc, showing that both moments when the wave crest and wave trough are above the disc may result in extreme loads, as discussed earlier.
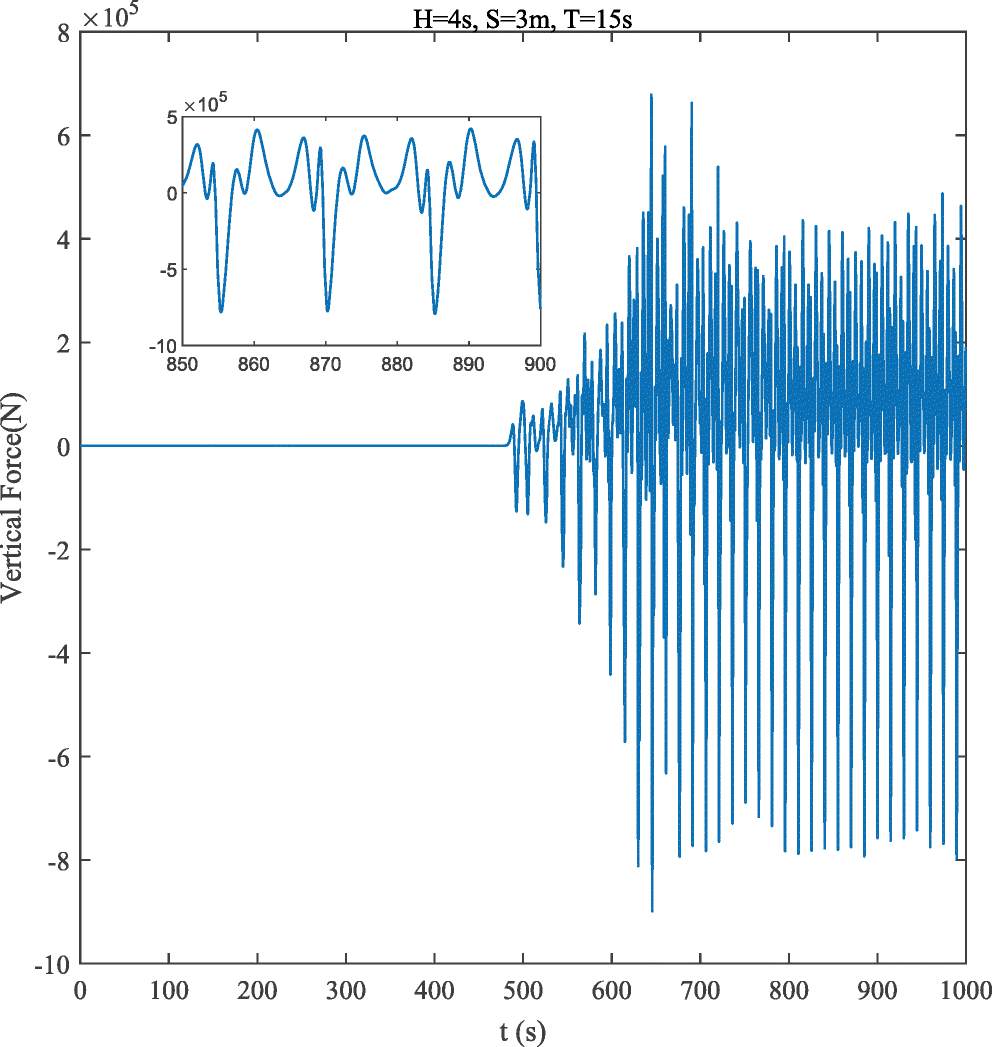 Figure 9 Wave-induced vertical forces on the disc under wave-structure Conditions 4
Figure 10 shows the wave-induced vertical force on the disc for all wave-structure conditions. The wave-structure conditions are given in Table 2. In this figure, submergence depth is fixed in each vertical column of sub-figures, and wave height is fixed in each row of sub-figures. Seen in Figure 10, the wave-induced vertical force is nonlinear for almost all cases considered here. The magnitude of the maximum and minimum wave forces reduce with deeper submergence depth, and these change nonlinearly with the submergence depth. The largest forces are observed when the disc is closer to the SWL, and for longer wave periods.
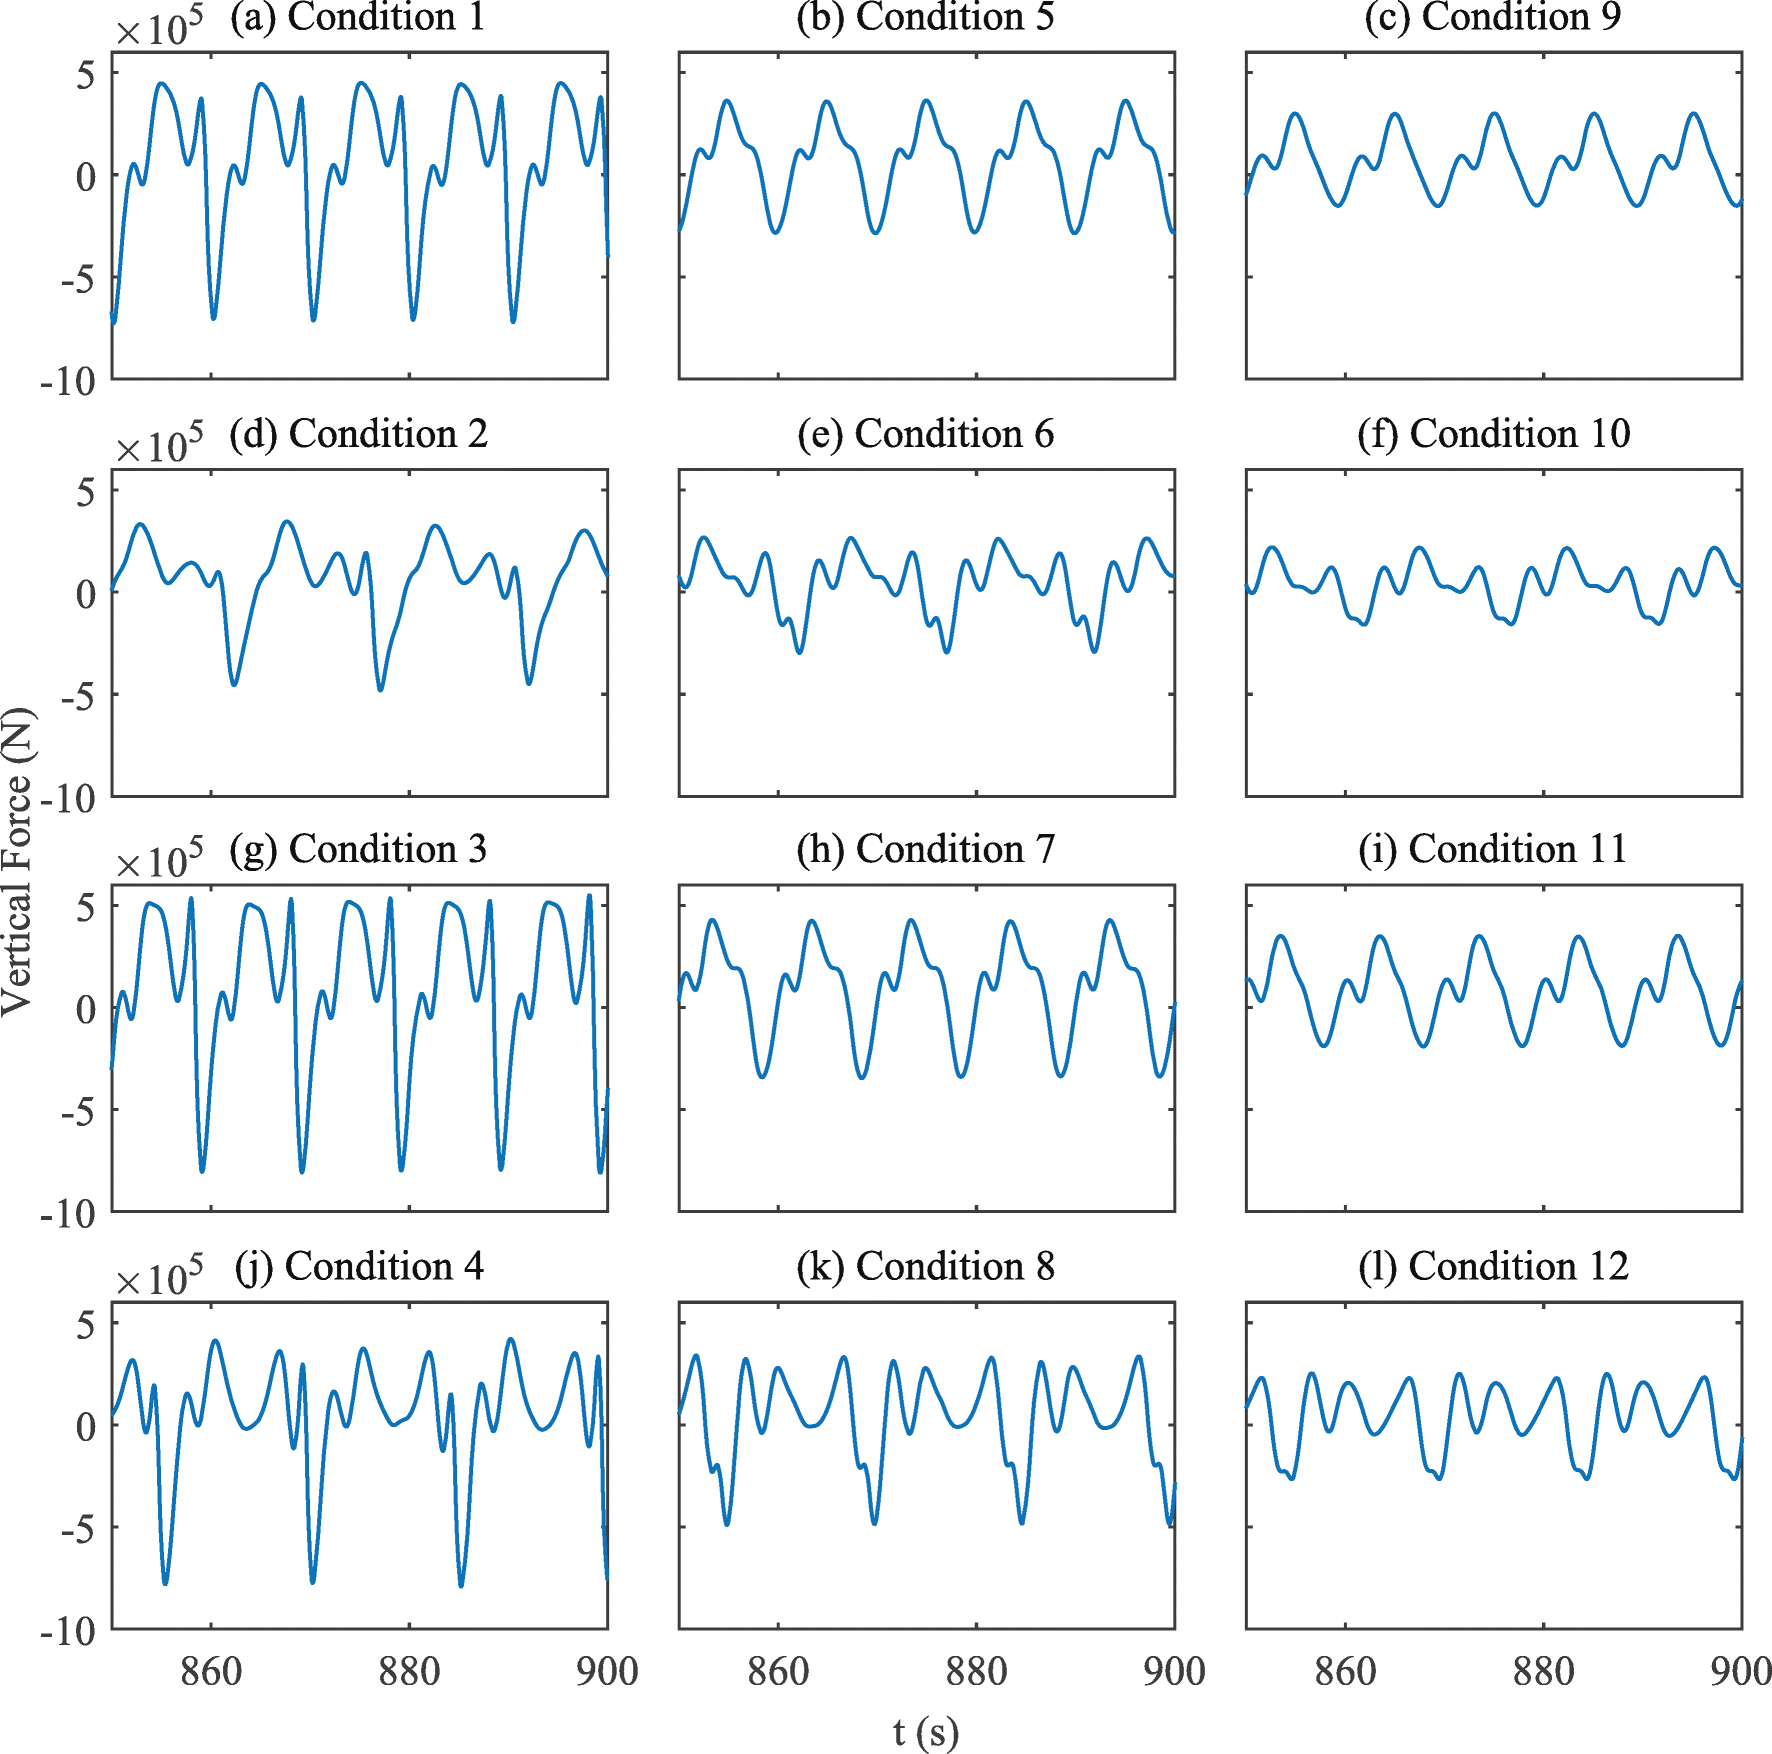 Figure 10 Wave-induced vertical forces on the disc under all wave-structure conditions
Distribution of pressure differential on the disc under all wave-structure conditions is shown in Figure 11. The pressure differential on the disc is given by $ p_{\text {net}} = \hat {p}(x,t)-\bar {p}(x,t) $ where $ \bar {p} $ is the disc top pressure and $ \hat {p} $ is the disc bottom pressure. Hence, the positive net pressure means the bottom pressure is larger than the top pressure. The four sub-figures on the left of Figure 11 show the pressure differential at the time of wave crest at the centre of the disc and the right sub-figures show the pressure differential at the time of wave trough at the centre of the disc. Every sub-figure in Figure 11 shows the pressure differential in three different submergence depths of the disc, namely S = 3 m, S = 5 m, and S = 7 m. For most of the cases in this figure, the pressure differential on the disc increases from the leading edge to the trailing edge of the disc under the wave crest. Pressure distribution on the disc is nonlinear under the wave crest.
 Figure 11 Pressure distribution on the disc for three submergence depths under all wave-structure conditions. x = 0 corresponds to the leading edge of the disc
6.3 Stresses and Elastic Deformations
The wave-induced Von Mises stresses on the structure and the elastic deformations of the structure made by different materials under the wave-structure conditions will be presented in this section. For structural analysis, it is assumed that the entire structure is made of the same material.
The distribution of the wave force on the cylindrical members and the distribution of the pressure on the disc of the device, obtained by the approaches introduced in Sections 6.1 and 6.2, are imported to ANSYS and the resulting stresses and deformation on the device are derived. We assume that waves are long crested. Hence, for the stress calculation on the circular disc, the two-dimensional pressure distribution (in the x direction) is distributed uniformly into the page (in the y direction).
6.3.1 Wave Crest
Figure 12 demonstrates the Von Mises stresses on the structure for four different materials (concrete, stainless steel, aluminium alloy and titanium alloy) under the wave crest of wave-structure Condition 4 (H = 4 m, S = 3 m, T = 15 s, and t ≈ 838 s in Figure 9). The relatively large Von Mises stresses mainly concentrate on the edges where the disc and cylinders meet. The maximum stress on the structure under the wave crest of wave-structure Condition 4 is given in Table 4, along with the yield strength of the three metal materials and ultimate strength of concrete. Given in Table 4, the maximum stress on the disc is about two orders of magnitude smaller than the tensile and compressive yield strengths for aluminium alloy, titanium alloy, stainless steel and concrete. However, the maximum stress has marginally exceeded the tensile strength of the disc made by concrete.
 Figure 12 Von Mises stress on SWED under the wave crest of wave-structure Condition 4. The wave propagates from left to rightTable 4 The maximum stresses and deformation under wave-structure Condition 4 on the device for all materials
Concrete Aluminium alloy Titanium alloy Stainless steel Tensile ultimate/yield strength (Pa) 5.0E + 06 2.8E + 08 9.3E + 08 2.07E + 08 Compressive ultimate/yield strength (Pa) 4.1E + 07 2.8E + 08 9.3E + 08 2.07E + 08 Maximum stress, wave crest (Pa) 5.92E + 06 4.70E + 06 4.78E + 06 4.65E + 06 Maximum stress, wave trough (Pa) 1.01E + 07 7.94E + 06 8.08E + 06 7.85E + 06 Figure 13 shows the resulting deformation contours of the entire structure under the wave crest of wave-structure Condition 4. The vectors illustrate the direction of the deformation points and the colour bars show the magnitude of the disc deformation. The deformation of the cylindrical members is significantly smaller when compared with that of the disc. Largest deformations are observed at the edges of the circular disc, with the trailing edge experiencing the maximum deformation under this wave-structure condition.
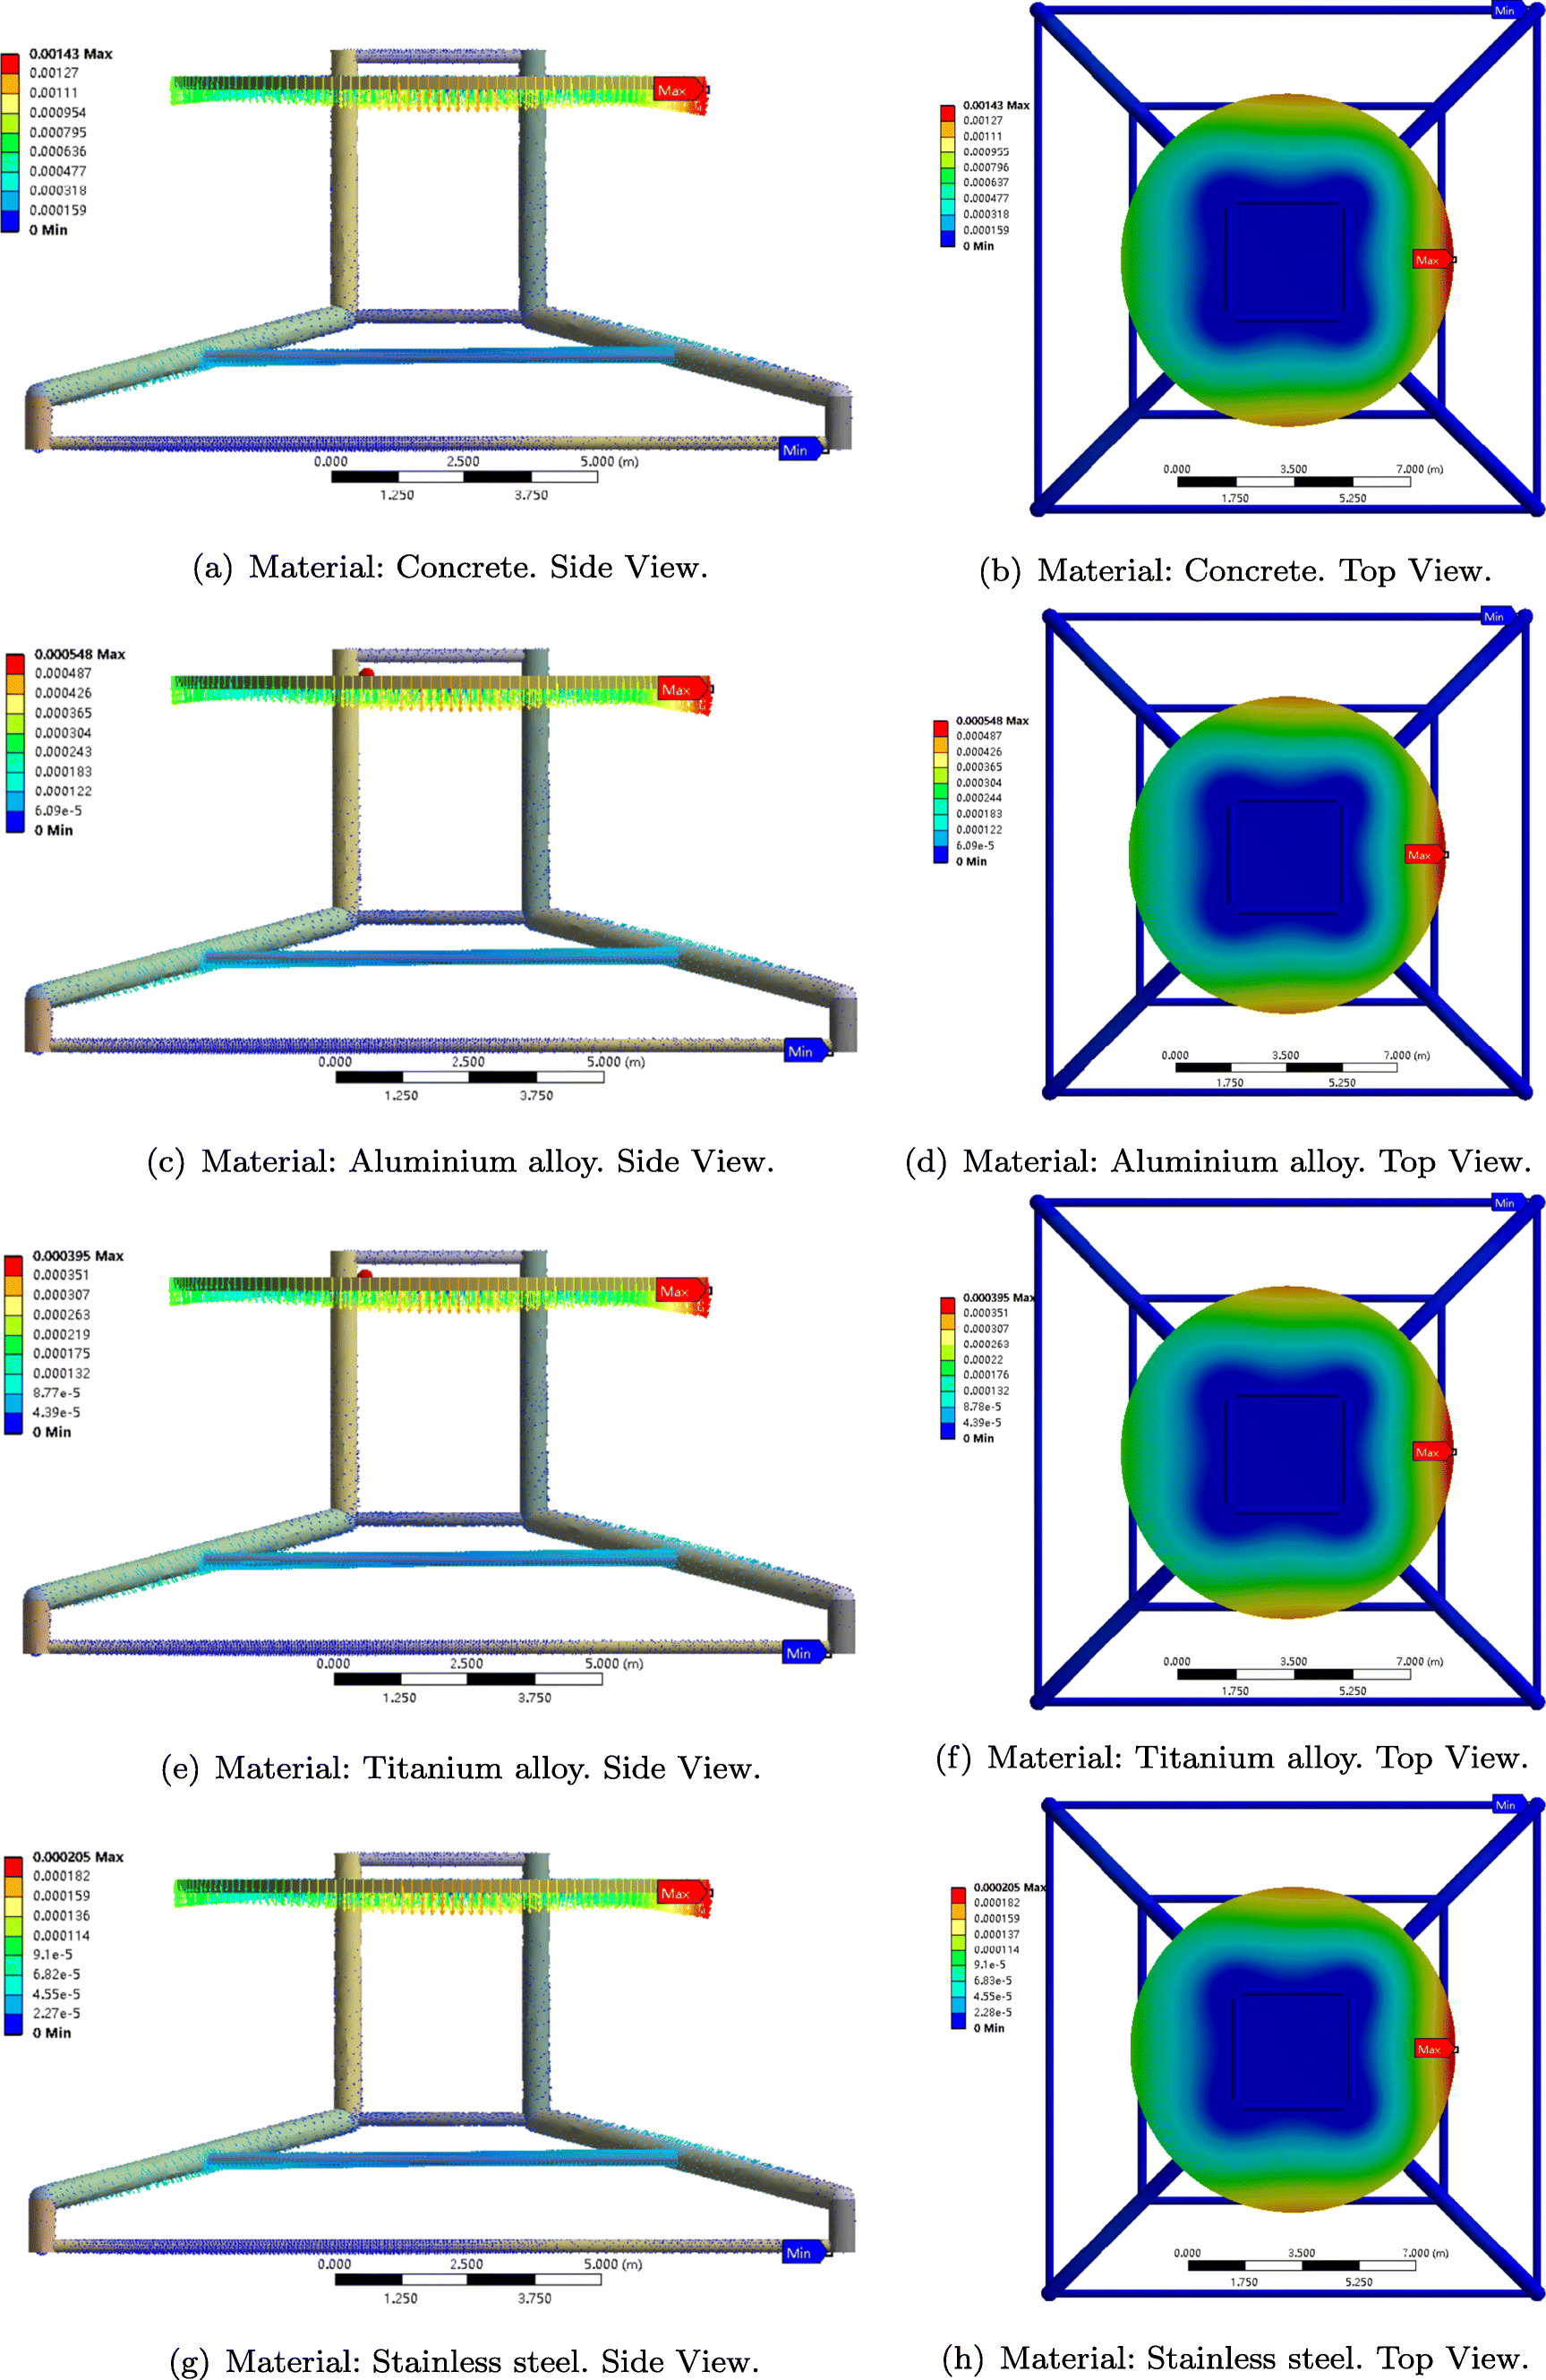 Figure 13 Deformation contour of the structure under the wave crest of wave-structure Condition 4. The wave propagates from left to right
To better demonstrate the maximum disc deformation, the spatial deformation of the disc edges from the equilibrium position under the wave crest of wave-structure conditions for the four materials is shown in Figure 14. In this figure, x = 0 refers to the leading edge of the disc, and deformations are shown for ten points distributed uniformly at the edges of the circular disc. Vertical deformations are measured from the equilibrium positions, and positive and negative values refer to the deformation direction. The leading edge of the disc has larger vertical deformation under wave Conditions 1–3, while in all other cases, the trailing edge of the disc undergoes the larger deformation. This is inline with the spatial pressure distribution from the leading to the trailing edges of the disc under these conditions, shown in Figure 11 (left column sub-figures). Shown in Figure 14, under the same conditions, the deformation of concrete is significantly larger than other materials while stainless steel has the smallest deformation.
 Figure 14 Spatial disc deformations under wave crest of the 12 wave-structure conditions of this study (given in Table 2). x = 0 corresponds to the leading edge of the disc
The absolute value of maximum disc deformations for all materials and under the wave-structure conditions studied here are shown in Figure 15. It is seen that when the wave crest is on top of the disc, the maximum deformation of the disc reduces for longer waves. Also, the largest deformation is observed when the disc is at the upper half of the water depth.
 Figure 15 Absolute value of maximum deformation of different materials under wave crest of the 12 cases considered in this study. The dash lines separate the three submergence depths
The maximum deformation on the disc is increased when wave height increases for all materials. Moreover, it is observed that under the wave crest of all conditions, the largest deformation appears in concrete, followed by aluminium alloy and titanium alloy, and the minimum deformation appears in stainless steel.
6.3.2 Wave Trough
In this section, the impact of the wave is studied when the wave trough is at the centre of the device. Our goal here is to assess whether this condition may result in larger stresses and deformation than those discussed in the previous section, i.e. when the wave crest is above the disc.
The Von Mises stress contours on the structure when the wave trough is at the top centre of the disc for the wave-structure Condition 4 is shown in Figure 16 (H = 4 m, S = 3 m, and T = 15 s and t ≈ 884 s in Figure 9). The relative large Von Mises stresses mainly concentrate on the edges where the disc and cylinders meet, same as that under the wave crest. The maximum stress on the structure under the wave trough of wave-structure Condition 4 is given in Table 4, along with the yield strength of each material. In this case again, the maximum stress has exceeded the tensile yield strength of concrete, while it is two orders of magnitude smaller for other materials. Also given in Table 4, the maximum stress on the disc under the wave trough of this wave-structure condition is larger than that under the wave crest for all materials.
 Figure 16 Von Mises stress on SWED under the wave trough of wave-structure Condition 4. The wave propagates from left to right
Figure 17 shows the deformation of the entire structure under the same conditions as in Figure 16. In Figure 17, most of the relatively large deformations are on the disc edges, which is similar to the wave crest condition. The maximum disc deformation is at the trailing edge.
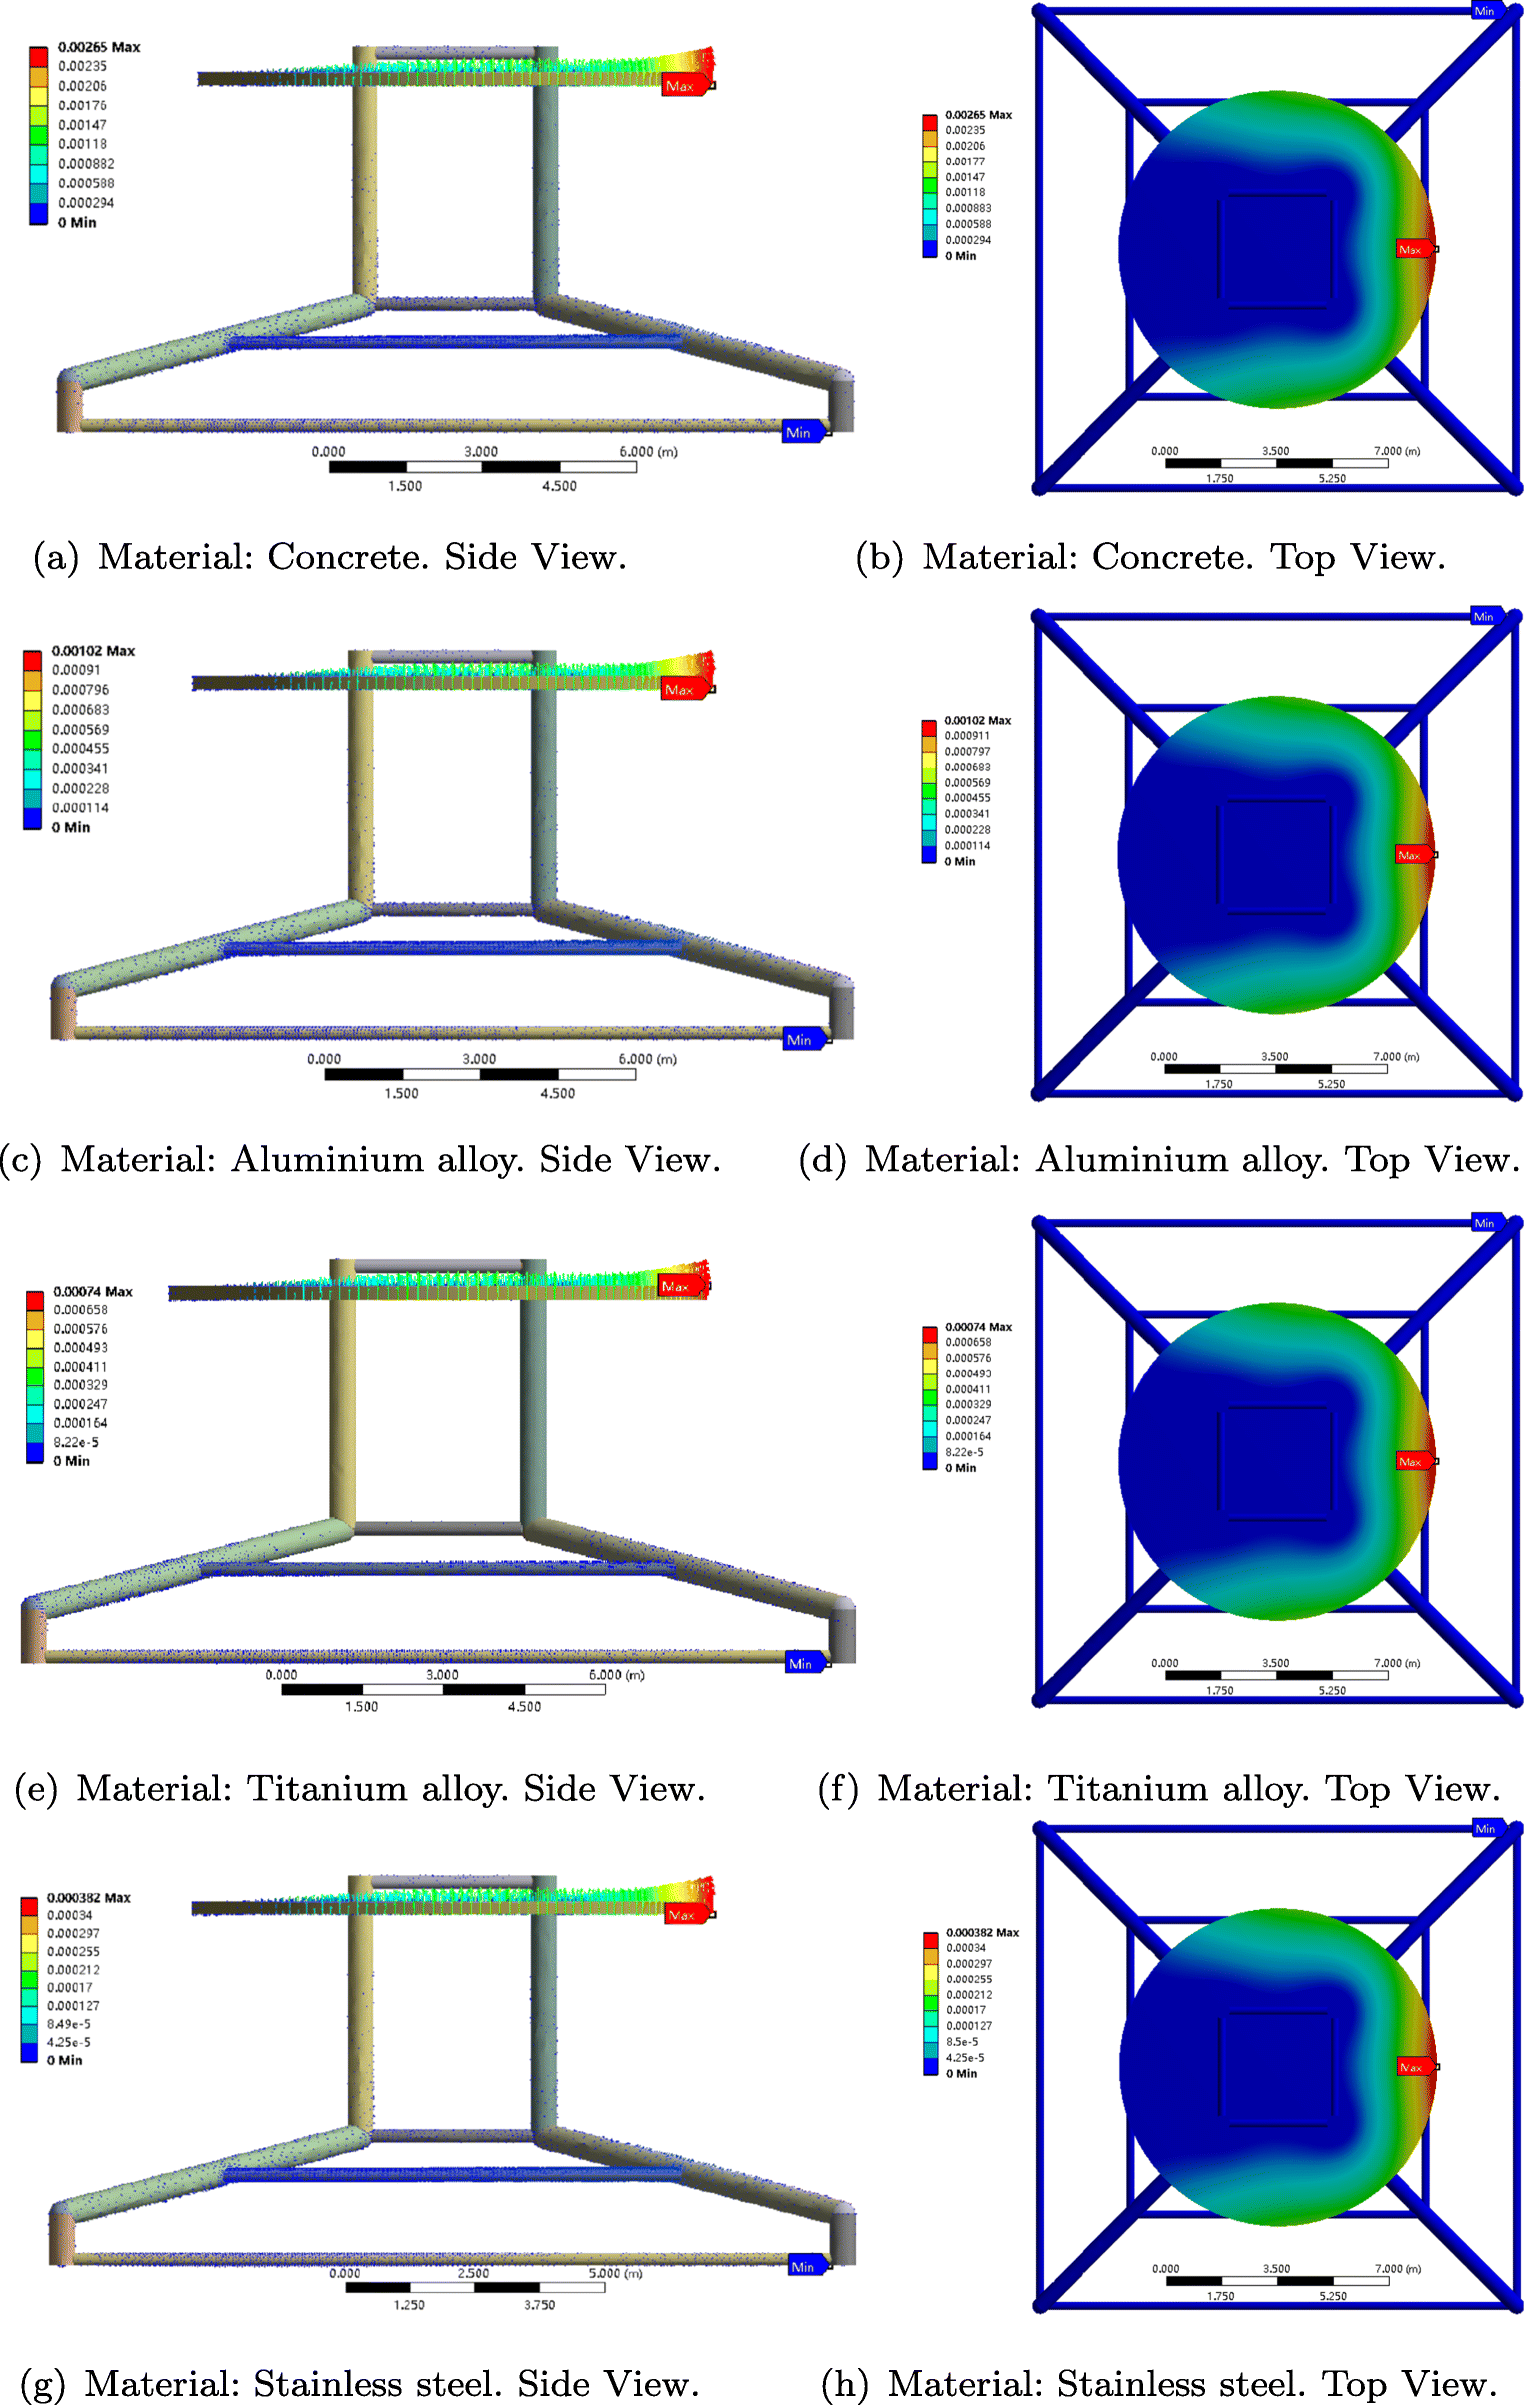 Figure 17 Deformation contour of the structure under the wave trough of wave-structure Condition 4. The wave propagates from left to right
Figure 18 shows the spatial deformation of the disc edges for all four materials under the trough for all wave-structure conditions. The sensors are located uniformly around the disc edge, and x = 0 refers to the leading edge of the disc. Positive and negative vertical deformations, measured from the equilibrium positions, refer to the deformation direction. Again, concrete and stainless steel show the largest and smallest deformations, respectively. For all materials, the largest and smallest deformations are on the edges of the disc. Similar to the wave crest case, the centre edge of the disc experiences a relative lager deformation. Similar deformation distribution is observed in all materials.
 Figure 18 Spatial disc deformation under wave trough of wave-structure Condition 4. x = 0 corresponds to the loading edge of the disc
This analysis is carried out for all materials considering the 12 wave-structure conditions of Table 2, and the absolute value of maximum disc deformations under the wave trough are shown in Figure 19.
 Figure 19 Absolute value of maximum deformation of different materials under wave trough of the 12 cases considered in this study. The dash lines separate the three submergence depths
Shown in Figure 19, the maximum deformation of the disc under the wave trough decreases with increasing submergence depth of the disc. Increasing wave height results in larger deformations and the same is observed with decreasing wave period. This is expected.
6.4 Further Discussion
When comparing the properties of materials under the same conditions, we see that concrete has significantly larger deformations among the four materials. This is not remarkable as concrete is prone for its weak tension properties (see, e.g., Rossi et al. 1994). On the other hand, the deformation of aluminium alloy is almost twice larger than that of titanium alloy, and about 3 times of that of stainless steel.
By comparing Figures 15 and 19, we see that the maximum deformation of the disc changes significantly with the change of submergence depth of the disc under wave trough. However, the maximum deformation changes slightly with the change of submergence depth of the disc under the wave crest. That is, the disc deformations vary significantly with the wave-structure condition under the wave crest versus the wave trough. Larger wave height results in an increase of the disc deformation of most cases. The wave period, however, has an oscillating effect on the deformation.
Comparison of Figures 14 and 18 shows that the disc deformations are larger under the wave trough when compared with the wave crest. This is true for almost all wave conditions (see Figures 15 and 19), where all deformations are almost twice larger under the wave trough at all submergence depths.
7 Concluding Remarks
In this study, an approach is suggested to carry out the structural analysis of a submerged WEC under extreme wave conditions, and hence to assess the vulnerability of the structure. The wave energy device under consideration consists of a horizontal disc which oscillates vertically due to the wave-induced loads. Suggestions are made to construct wave energy devices using four materials, namely concrete, aluminium alloy, titanium alloy, and stainless steel. In this study, structural integrity of devices made by these materials is assessed under different environmental conditions.
The wave-induced loads on the structure are determined by use of the level Ⅰ GN equations, and by Morison's equation. The Von Mises stresses on the structure due to the wave loads are then calculated by use of a Finite Element approach. Knowing the material properties, deformations of the structure due to the wave-induced stresses are obtained.
It is found that the submergence depth has a significant impact on the maximum deformation of the structure. The deformation of the disc is larger when the disc is closer to the free surface. The effect of submergence depth on the disc is larger when the trough of the wave is above the device compared with when the crest of the wave is above the device. The maximum deformation of SWED is observed at the edges of the disc. For the wave-structure conditions considered in this study, the wave-induced stresses and deformations are larger under the wave trough than the wave crest. It is recommended that full duration of wave period to study the wave-structure interaction problem is considered.
Among the four materials considered here, concrete has the largest deformation, and stainless steel has the smallest deformation. The wave-induced stresses on the structure have exceeded the capacity of concrete. Although concrete is durable due to lower construction and maintenance cost, it cannot be used to build the disc. Reinforcement of concrete is essential. Other materials considered here, namely stainless steel, aluminium alloy, and titanium alloy, have larger capacity under the wave-induced stresses and can withstand the loads.
The study is confined to a decoupled hydroelastic analysis of the device. Disc deformation is assumed small when compared with its oscillation. Hence, it is assumed that the effect of the elastic deformation of the structure on the fluid domain is negligible. A fully coupled fluid-structure-fluid analysis is suggested to assess the applicability of this assumption, although we do not expect large effects.
This decoupled hydroelastic study is confined to a static analysis of the structure. The static analysis provides conservative loads and responses in general, which are desirable at this stage. A dynamic analysis, where the disc is allowed to oscillate due to the wave loads, is recommended to determine the time effect on the structural responses, and possibly to reassess durability of the device made by concrete.
Open Access This article is licensed under a Creative Commons Attribution 4.0 International License, which permits use, sharing, adaptation, distribution and reproduction in any medium or format, as long as you give appropriate credit to the original author(s) and the source, provide a link to the Creative Commons licence, and indicate if changes were made. The images or other third party material in this article are included in the article's Creative Commons licence, unless indicated otherwise in a credit line to the material. If material is not included in the article's Creative Commons licence and your intended use is not permitted by statutory regulation or exceeds the permitted use, you will need to obtain permission directly from the copyright holder. To view a copy of this licence, visit http://creativecommons.org/licenses/by/4.0/.Publisher's note Springer Nature remains neutral with regard to jurisdictional claims in published maps and institutional affiliations. -
Figure 1 Orthographic projection and isometric views of SWED (unit: m)
Figure 2 Time series of surface elevation and wave-induced forces on a submerged disc, calculated by the GN model, and the laboratory measurements and CFD computations of Hayatdavoodi et al. (2015b). Gauges Ⅰ and Ⅱ are located at 2D upwave and 2D downwave from the submerged disc, respectively
Figure 3 Formal structural analysis and design flowchart of the wave energy device
Figure 4 Structural labels which are used to refer to in the text
Figure 5 Schematic of SWED, and the location of the pressure sensors on the disc. The sensors are 1 m apart. x = 0 m refers to the leading edge of the disc
Figure 6 Force distribution on the horizontal cylinders (Cylinders H1 to H4) stretched in x direction, under all wave-structure conditions and when the wave crest is at the centre of the device
Figure 7 Force distribution on the vertical cylinders (Cylinders V1 to V4) stretched in z direction, under all wave-structure conditions and when the wave crest is at the centre of the device
Figure 8 Force distribution on the inclined cylinders (Cylinders In1 to in2) stretched over x and z directions, under all wave-structure conditions and when the wave crest is at the centre of the device
Figure 9 Wave-induced vertical forces on the disc under wave-structure Conditions 4
Figure 10 Wave-induced vertical forces on the disc under all wave-structure conditions
Figure 11 Pressure distribution on the disc for three submergence depths under all wave-structure conditions. x = 0 corresponds to the leading edge of the disc
Figure 12 Von Mises stress on SWED under the wave crest of wave-structure Condition 4. The wave propagates from left to right
Figure 13 Deformation contour of the structure under the wave crest of wave-structure Condition 4. The wave propagates from left to right
Figure 14 Spatial disc deformations under wave crest of the 12 wave-structure conditions of this study (given in Table 2). x = 0 corresponds to the leading edge of the disc
Figure 15 Absolute value of maximum deformation of different materials under wave crest of the 12 cases considered in this study. The dash lines separate the three submergence depths
Figure 16 Von Mises stress on SWED under the wave trough of wave-structure Condition 4. The wave propagates from left to right
Figure 17 Deformation contour of the structure under the wave trough of wave-structure Condition 4. The wave propagates from left to right
Figure 18 Spatial disc deformation under wave trough of wave-structure Condition 4. x = 0 corresponds to the loading edge of the disc
Figure 19 Absolute value of maximum deformation of different materials under wave trough of the 12 cases considered in this study. The dash lines separate the three submergence depths
Table 1 Properties of the materials considered in this study, given in ANSYS Inc (2016)
Concrete Aluminium alloy Titanium alloy Stainless steel Density (kg/m3) 2300 2770 4620 7750 Young's modulus (Pa) 3.00E + 10 7.10E + 10 9.60E + 10 1.93E + 11 Poisson's ratio 0.18 0.33 0.36 0.31 Tensile yield strength (Pa) 0 2.80E + 08 9.30E + 08 2.07E + 08 Compressive yield strength (Pa) 0 2.80E + 08 9.30E + 08 2.07E + 08 Tensile ultimate strength (Pa) 5.00E + 06 3.10E + 08 1.07E + 09 5.86E + 08 Compressive ultimate strength (Pa) 4.10E + 07 0 0 0 Table 2 Wave-structure conditions considered in this study
Wave-structure conditions 1 2 3 4 5 6 7 8 9 10 11 12 Wave height, H (m) 3 3 4 4 3 3 4 4 3 3 4 4 Submergence depth, S (m) 3 3 3 3 5 5 5 5 7 7 7 7 Wave period, T (s) 10 15 10 15 10 15 10 15 10 15 10 15 Water depth is h = 10 m Table 3 Force distribution (kN/m) on the horizontal cylinders (Cylinders H5 to H12) stretched in y direction, under the wave-structure conditions of Table 2 and when the wave crest is above the centre of the device
Cylinder H = 3 m, T = 10 s H = 3 m, T = 15 s H = 4 m, T = 10 s H = 4 m, T = 15 s H5 − 105.37 − 74.23 − 155.34 − 107.30 H6 − 86.51 − 62.45 − 119.76 − 85.67 H7 − 40.08 − 37.62 − 38.97 − 42.11 H8 0.44 − 15.11 30.00 − 3.13 H9 − 86.58 − 60.31 − 115.52 − 80.45 H10 − 78.86 − 57.81 − 105.22 − 77.11 H11 − 73.47 − 54.20 − 92.96 − 69.82 H12 − 67.85 − 52.17 − 86.32 − 67.31 Table 4 The maximum stresses and deformation under wave-structure Condition 4 on the device for all materials
Concrete Aluminium alloy Titanium alloy Stainless steel Tensile ultimate/yield strength (Pa) 5.0E + 06 2.8E + 08 9.3E + 08 2.07E + 08 Compressive ultimate/yield strength (Pa) 4.1E + 07 2.8E + 08 9.3E + 08 2.07E + 08 Maximum stress, wave crest (Pa) 5.92E + 06 4.70E + 06 4.78E + 06 4.65E + 06 Maximum stress, wave trough (Pa) 1.01E + 07 7.94E + 06 8.08E + 06 7.85E + 06 -
ANSYS Inc (2016) ANSYS® Academic Research, Release 16.2, help system. engineering data sources Antonio FO (2010) Wave energy utilization: a review of the technologies. Renew Sustain Energ Rev 14(3): 899–918. https://doi.org/10.1016/j.rser.2009.11.003 Carter RW, Ertekin RC (2014) Focusing of wave-induced flow through a submerged disk with a tubular opening. Appl Ocean Res 47:110–124. https://doi.org/10.1016/j.apor.2014.04.002 Clément A, McCullen P, Falcão A, Fiorentino A, Gardner F, Hammarlund K, Lemonis G, Lewis T, Nielsen K, Petroncini S, Pontes MT, Schild P, Sjöström BO, HC Sørensen, Thorpe T (2002) Wave energy in europe: current status and perspectives. Renew Sustain Energ Rev 6(5): 405–431. https://doi.org/10.1016/S1364-0321(02)00009-6 Cruz J (2007) Ocean wave energy: current status and future prespectives. Springer Science & Business Media, United Kingdom Daniel TL (2002) Flexible wings and fins: Bending by inertial or fluid-dynamic forces?. Integr Comp Biol 42(5): 1044–1049. https://doi.org/10.1093/icb/42.5.1044 Drew B, Plummer AR, Sahinkaya MN (2009) A review of wave energy converter technology, vol 223, pp 887–902, DOI https://doi.org/10.1243/09576509JPE782 Duffett J, Beck RF, Zhang X, Maki KJ, Newman JN (2016) Experimental and numerical study of waves amplified by a submerged plate. In: Proceedings of the 31st Int. workshop on water waves and floating bodies (IWWWFB), 3-6 April, Plymouth, MI, USA, pp 37–40 Ertekin RC (1984) Soliton generation by moving disturbances in shallow water: Theory, computation and experiment. PhD thesis, University of California at Berkeley, May, v + 352 pp Ertekin RC (1988) Nonlinear shallow water waves: the Green-Naghdi equations. In: Pacific congress on marine science and technology, PACON, vol 88, pp 42–52 Ertekin RC, Becker JM (1998) Nonlinear diffraction of waves by a submerged shelf in shallow water. J Offshore Mechan Arctic Eng 120(4): 212–220. https://doi.org/10.1115/1.2829542 Ertekin RC, Webster WC, Wehausen JV (1986) Waves caused by a moving disturbance in a shallow channel of finite width. J Fluid Mechan 169:275–292. https://doi.org/10.1017/S0022112086000630 Ertekin RC, Hayatdavoodi M, Kim JW (2014) On some solitary and cnoidal wave diffraction solutions of the green–naghdi equations. Appl Ocean Res 47:125–137. https://doi.org/10.1016/j.apor.2014.04.005 Filippas E, Gerostathis T, Belibassakis K (2018) Semi-activated oscillating hydrofoil as a nearshore biomimetic energy system in waves and currents. Ocean Eng 154:396–415. https://doi.org/10.1016/j.oceaneng.2018.02.028 Graw K (1996) About the development of wave energy breakwaters Green AE, Naghdi PM (1976a) Directed fluid sheets. Proceedings of the royal society of london a mathematical and physical sciences 347(1651): 447–473. https://doi.org/10.1098/rspa.1976.0011 Green AE, Naghdi PM (1976b) A derivation of equations for wave propagation in water of variable depth. J Fluid Mech 78:237–246. https://doi.org/10.1017/S0022112076002425 Green AE, Naghdi PM, Wainwright WL (1965) A general theory of a Cosserat surface. Arch Ration Mech Anal 20(4): 287–308. https://doi.org/10.1007/BF00253138 Hayatdavoodi M (2013) Nonlinear wave loads on decks of coastal structures. PhD thesis, University of Hawaii at Manoa, xiv+186 Hayatdavoodi M, Ertekin RC (2015a) Nonlinear wave loads on a submerged deck by the Green-Naghdi equations. J Offshore Mechan Arctic Eng 137(1): 011, 102:1–9. https://doi.org/10.1115/1.4028997 Hayatdavoodi M, Ertekin RC (2015b) Wave forces on a submerged horizontal plate. part i: theory and modelling. J Fluids Struct 54(April): 566–579. https://doi.org/10.1016/j.jfluidstructs.2014.12.010 Hayatdavoodi M, Ertekin RC (2015c) Wave forces on a submerged horizontal plate. Part ii: solitary and cnoidal waves. J Fluids Struct 54(April): 580–596. https://doi.org/10.1016/j.jfluidstructs.2014.12.009 Hayatdavoodi M, Ertekin RC, Robertson IN, Riggs HR (2015a) Vulnerability assessment of coastal bridges on Oahu impacted by storm surge and waves. Natural Hazards pp 1–25, https://doi.org/10.1007/s11069-015-1896-2 Hayatdavoodi M, Seiffert B, Ertekin RC (2015b) Experiments and calculations of cnoidal wave loads on a flat plate in shallow-water. J of Ocean Eng Marine Energ 1(1): 77–99. https://doi.org/10.1007/s40722-014-0007-x Hayatdavoodi M, Wagner JJ, Wagner JR, Ertekin RC (2016) Vertical oscillation of a horizontal submerged plate. In: 31St international workshop on water waves and floating bodies (IWWWFB31), plymouth, MI, USA, pp 53–56 Hayatdavoodi M, Ertekin RC, Thies JT (2017a) Conceptual design and analysis of a submerged wave energy device in shallow water. In: ASME 36th international conference on ocean, offshore and arctic engineering, american society of mechanical engineers, OMAE, Trondheim, Norway, p V010T09A033 Hayatdavoodi M, Ertekin RC, Valentine BD (2017b) Solitary and cnoidal wave scattering by a submerged horizontal plate in shallow water. AIP Advances 7(6): 065–212. https://doi.org/10.1063/1.4987024 Hayatdavoodi M, Neill DR, Ertekin RC (2018) Diffraction of cnoidal waves by vertical cylinders in shallow water. Theor Comput Fluid Dynam 32(5): 561–591. https://doi.org/10.1007/s00162-018-0466-0 Hayatdavoodi M, Treichel K, Ertekin RC (2019) Parametric study of nonlinear wave loads on submerged decks in shallow water. J Fluids Struct 86:266–289. https://doi.org/10.1016/j.jfluidstructs.2019.02.016 Jeanmonod G, Olivier M (2017) Effects of chordwise flexibility on 2D flapping foils used as an energy extraction device. J Fluids Struct 70:327–345. https://doi.org/10.1016/j.jfluidstructs.2017.01.009 Johansson TB, Patwardhan AP, Nakićenović N, Gomez-Echeverri L (2012) Global energy assessment: toward a sustainable future. Cambridge University Press, Cambridge Kim JW, Bai KJ, Ertekin RC, Webster WC (2001) A derivation of the Green-Naghdi equations for irrotational flows. J Eng Math 40:17–42. https://doi.org/10.1023/A:1017541206391 Liu J, Hayatdavoodi M, Ertekin RC (2020) On bore dynamics and pressure: RANS, GN, and SV equations. J Offshore Mechan Arctic Eng 142(2): 021–902. (1–10), https://doi.org/10.1115/1.4044988 Martin PA, Farina L (1997) Radiation of water waves by a heaving submerged horizontal disc. J Fluid Mechan 337:365–379. https://doi.org/10.1017/S0022112097004989 Morison JR, O'Brien MP, Johnson JW, Schaaf SA (1950) The force exerted by surface waves on piles. J Pet Technol 2(05): 149–154. https://doi.org/10.2118/950149-G Newman JN (2015) Amplification of waves by submerged plates. 30th international workshop on water waves and floating bodies (IWWWFB), Bristol, UK Pelc R, Fujita RM (2002) Renewable energy from the ocean. Mar Policy 26(6): 471–479. https://doi.org/10.1016/S0308-597X(02)00045-3 Polinder H, Scuotto M (2005) Wave energy converters and their impact on power systems. In: The international conference on future power systems, vol 2005. IEEE, Netherlands, pp 1–9 Priovolos AK, Filippas ES, Belibassakis KA (2018) A vortex-based method for improved flexible flapping-foil thruster performance. Eng Anal Boundary Elements 95:69–84. https://doi.org/10.1016/j.enganabound.2018.06.016 Rossi P, Wu X, Le Maou F, Belloc A (1994) Scale effect on concrete in tension. Mater Struct 27(8): 437–444. https://doi.org/10.1007/BF02473447 Thorpe TW (1999) A brief review of wave energy. harwell laboratory energy technology support unit (ETSU), Oxford, UK Ugural AC (1991) Mechanics of materials. McGraw-Hill, New York Vermaak R, Kamper MJ (2012) Design aspects of a novel topology air-cored permanent magnet linear generator for direct drive wave energy converters. IEEE Trans Ind Electron 59(5): 2104–2115. https://doi.org/10.1109/TIE.2011.2162215 World Energy Council (2013) World energy resources 2013 Survey. world energy council, London Xiao Q, Zhu Q (2014) A review on flow energy harvesters based on flapping foils. J Fluids Struct 46:174–191. https://doi.org/10.1016/j.jfluidstructs.2014.01.002 Zhao BB, Ertekin RC, Duan WY (2015) A comparative study of diffraction of shallow-water waves by high-level IGN and GN equations. J Comput Phys 283:129–147. https://doi.org/10.1016/j.jcp.2014.11.020