Multiple Nonlinear Regression Analysis for the Stability of Non-overtopping Perforated Quarter Circle Breakwater
https://doi.org/10.1007/s11804-020-00145-3
-
Abstract
Breakwaters have been built throughout the centuries for the coastal protection and the port development, but changes occurred in their layout and criteria used for the design. Quarter circle breakwater (QBW) is a new type evolved having advantages of both caisson type and perforated type breakwaters. The present study extracts the effect of change in the percentage of perforations on the stable conditions of seaside perforated QBW by using various physical models. The results were graphically analyzed using dimensionless parameters and it was concluded that there is a reduction in dimensionless stability parameter with an increase in steepness of the wave and change in water depth to the height of breakwater structure. Multiple non–linear regression analysis was done and the equation for the best fit curve with a higher regression coefficient was obtained by using Excel statistical software—XLSTAT.-
Keywords:
- Breakwater ·
- Perforations ·
- Regression analysis ·
- Stability ·
- Wave steepness ·
- Water depth
Article Highlights• Stability of perforated quarter circle breakwater based on physical models and empirical approaches is studied.• An equation is developed for the stability parameter using the multiple nonlinear regression analysis. -
1 Introduction
Ports are considered to be the most important transit locations to carry out the world trade through seaways, which need to be protected from the disturbances due to the incoming waves. A seaport plays an important role in the sector of sea transportations, exports, imports, tourism, and travel, and thus, it is an important ingredient of economic growth. Water transport is a major economy input for a nation with over 82% of world trade in tons and 94% of world trade in tons-kilometers which are moved by shipping and thereby through ports.
The basic requirement of any port, harbor, or marina is a sheltered area free from the sea waves. In the coastal areas where natural protection from sea waves is not available, the development of harbor requires artificial protection for the creation of calm areas. Large structures such as rubble mound breakwaters or vertical wall breakwaters were constructed in major harbors and nearer to other marine structures where more tranquility conditions are essential for its sustainability. Breakwaters are also provided in the lagoon and at the entrance channel of ports, for maneuvering of ships and port operations. Sometimes, they are used to protect beaches from erosion due to the destructive wave forces.
Recent advances in science and technology led to the development in various types of composite type breakwater structures with different layouts and using modern construction techniques. The design of breakwater depends on the wave conditions, locality, and their appearance. As a result, variety of breakwater structures has been evolved in the past few decades. Innovative concepts for types of breakwater are in progress as a measure for calming down the destructive effect caused by sea waves. Semicircular breakwater is a composite structure first developed in Japan at the beginning of the 1990s and first adopted for the formation of the harbor in Miyazaki Port, Japan. Xie et al. (2006), developed the concept of QBW, and has conducted studies comparing the performance of semicircular and QBW. Quarter circle breakwater (QBW) has various advantages such as lightweight and cheaper to construct. It is also found to be favorable in all soil conditions, can be easily transported and placed, provide better esthetic view, sustainable, and can withstand severe wave conditions.
Recent studies in this field are related to the effect of earthquake and tsunami waves on the stability of the breakwater foundation. Chaudhary et al. (2017) investigated various effective reinforcement techniques for the foundation of the breakwater in order to provide resiliency to overcome earthquake and tsunami. It was found that the duration and magnitude of acceleration of earthquake loadings had significant impacts on the settlement and horizontal displacement of the breakwater. Chaudhary et al. (2018a, b) evaluated the effectiveness of the reinforced foundation by conducting a series of shaking table tests and hydraulic model tests, and comparisons were made between the conventional and reinforced foundations. Numerical analyses were also performed to clarify the mechanism of the soil–breakwater–reinforcement–fluid system. Chaudhary et al. (2018a, b) carried out physical model studies using geo-grid, gabions, and sheet piles for reinforcing a foundation for reducing the damage of the breakwater brought by the earthquake and tsunami. Chaudhary et al. (2019) conducted studies on the development of reinforcing countermeasures for a breakwater foundation that can produce a resilient breakwater against earthquakes and tsunamis, such as foundations reinforced with sheet piles and gabions. Physical model tests were carried out for scaled-down breakwater models to examine the performance of the reinforcing countermeasures under an earthquake and tsunami.
The present study investigates the stability of an emerged seaside perforated quarter circle breakwater with varying percentage of perforations, for different water depths and wave conditions. The major objectives include the study of the effect of incident wave steepness, S/D (spacing between perforations/diameter of perforations) ratio or percentage perforations, and water depth on the stability of quarter circle breakwater with varying seaside perforations.
2 Experimental Investigations
The experimental studies were carried out in a 2D wave flume existing in the Marine Structures Laboratory under Applied Mechanics and Hydraulics Department, National Institute of Technology Karnataka, Mangalore, India (Hughes 1993).
2.1 Wave Flume and Instrumentation
The physical model study for regular waves was conducted in a 2D wave flume having a length of 50 m long, width 0.71 m, and depth of 1.1 m (refer Figure 1). Ranges of wave height varying from 0.08 to 0.24 m and periods from 0.8 to 4.0 s can be generated with this facility (Shi et al. 2011).
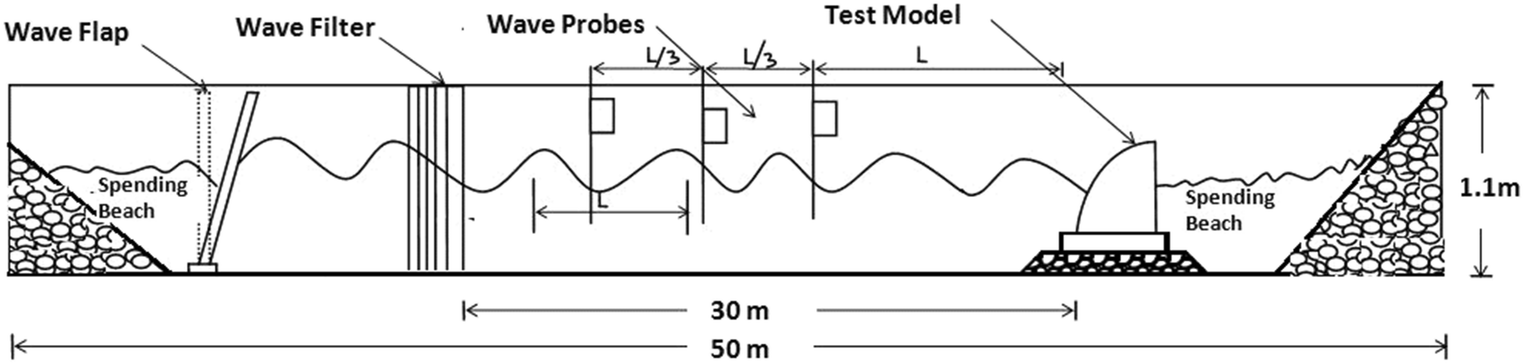 Figure 1 Longitudinal section of wave flume
2.2 Breakwater Test Model
The model for the quarter circle breakwater was constructed as two parts: the topmost part is a caisson having a quarter-circular shape and a bottom part consisting of base slab constructed with precast concrete placed on rubble mound foundation (Luwen et al. 2013).
Quarter circular caisson is made-up of the galvanized iron (GI) sheets having 2 mm thickness and is joined together. For the experimental study, physical models with geometrical similarity having a scale of 1:30 are used to simulate the present wave conditions of the Mangalore coast and suitable size of perforation in accordance with the Froude's law.
Based on the wave conditions and water depth available for the present study, QBW having a radius of 0.55 m radius was selected so that there will be no wave overtopping and the model serves as the emerged type QBW under all adverse conditions. Stiffeners are used for fixing the breakwater model and the base slab. The perforations are made in the quarter circle shaped front part of the QBW model, with the help of the drilling machine. The typical cross-section of QBW considered for the study is shown in Figure 2.
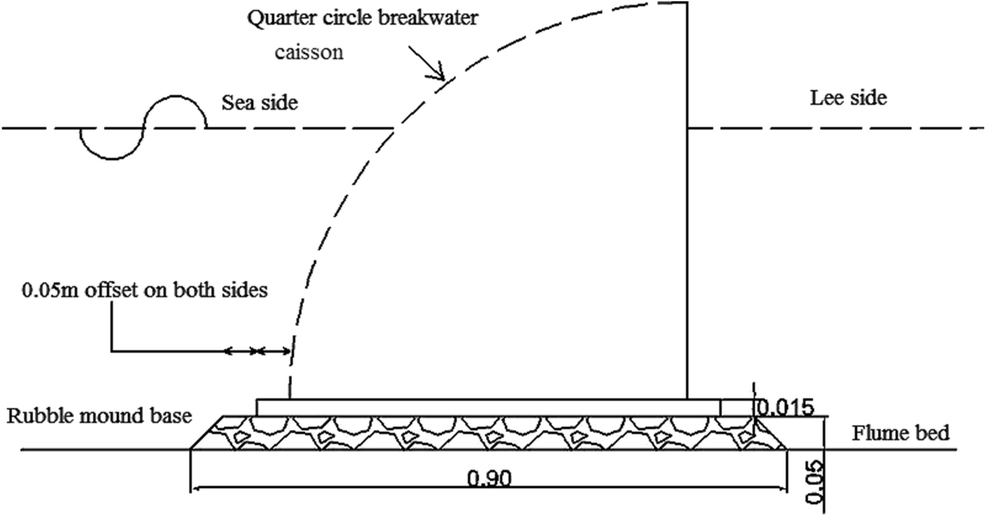 Figure 2 Typical cross-section of perforated QBW
3 Methodology
Rubble mound foundation having a slope 1:2 and thickness 0.05 m was laid with stones having weight 50 to 100 g and the QBW model after casting was placed over it. The entire QBW model with the foundation was placed at 30 m distance from the wave flap (Binumol et al. 2017).
For measuring the wave height for the incident and reflected waves, the 3 probe method proposed by Isaacson (1991) was used. The distance between the first probes from the center of the model is kept as one wavelength L, but for other probes, space between the probes was maintained as L/3. To avoid continuous reflection, a burst of five waves was generated for each trial used. The elevation of the wave surface obtained by the wave probes was recorded by the wave recorder and the voltage signals are transformed into wave heights and wave period with the help wave recorder software developed by EMCON (Environmental Measurements and Controls), Kochi, India. The list of experimental variables and the ranges used for the present study are tabulated as shown in Table 1.
Table 1 Experimental variablesParameters Range Wave specific parameters Incident wave height, Hi (m) 0.03, 0.06, 0.09, 0.12, 0.15, 0.18 Water depth, d (m) 0.35, 0.40, 0.45 Time period, T (s) 1.2, 1.4, 1.6, 1.8, 2.0, 2.2 Structure specific parameters Radius of the structure (m) 0.55 S/D ratio 2, 2.5, 3, 4, 5 Diameter of perforation (m) 0.016, 0.020 The experimental investigations carried out are based on the following assumptions:
· The sea bed is rigid and horizontal and it is assumed that the sediment movement does not interfere with the wave motion and does not affect the model performance.
· The waves are periodic and monochromatic.
· There is no interference between the incident waves and the structure since the waves are generated by the flume as bursts.
· The generation of secondary waves is not taken into account.
· Reflection caused by the waves on the flume bottom or flume side walls is avoided.
· The difference between the density of freshwater and seawater is neglected.
· The frictional effects between the base slab and structure have not been accounted
4 Results and Discussions
Studies are conducted on emerged seaside perforated QBW with 0.55 m radius and different spacing to diameter (S/D) ratios having the depth of water 0.35, 0.40, and 0.45 m under varying wave conditions. Variations of minimum weight to prevent sliding for different wave conditions and structural parameters were studied, and the variations were then presented in graphical format using dimensionless parameters obtained from a dimensional analysis by Buckingham's π theorem. The stability based on sliding performance was denoted by a dimensionless stability parameter (W/γHi2), where W is the minimum weight of the QBW required (including the additional weight) to resist the sliding per unit length of the breakwater, γ is the specific weight of water, and Hi is the incident wave height. The sliding of QBW occurs when the wave force exceeds the frictional resistance offered by the QBW. The stability of QBW against wave force increases with an increase in the total weight of the structure. Therefore, the experiment is repeated by the addition of weight in increments until the structure stops sliding.
4.1 Influence of Incident Wave Steepness on W/γHi2
The graphs of non-dimensional stability parameter (W/γHi2) against the incident wave steepness, Hi/gT2 (Hi = incident wave height in m, g = acceleration due to gravity in m/s2, and T = wave period in sec), are plotted for different values of relative water depth, d/hs, and a constant spacing to diameter of perforation ratio (S/D).
4.1.1 Seaside Perforated QBW with S/D = 2
The variation of W/γHi2 with Hi/gT2 at different water depths for QBW radius 0.55 m and S/D ratio equal to 2 was plotted as shown in Figure 3.
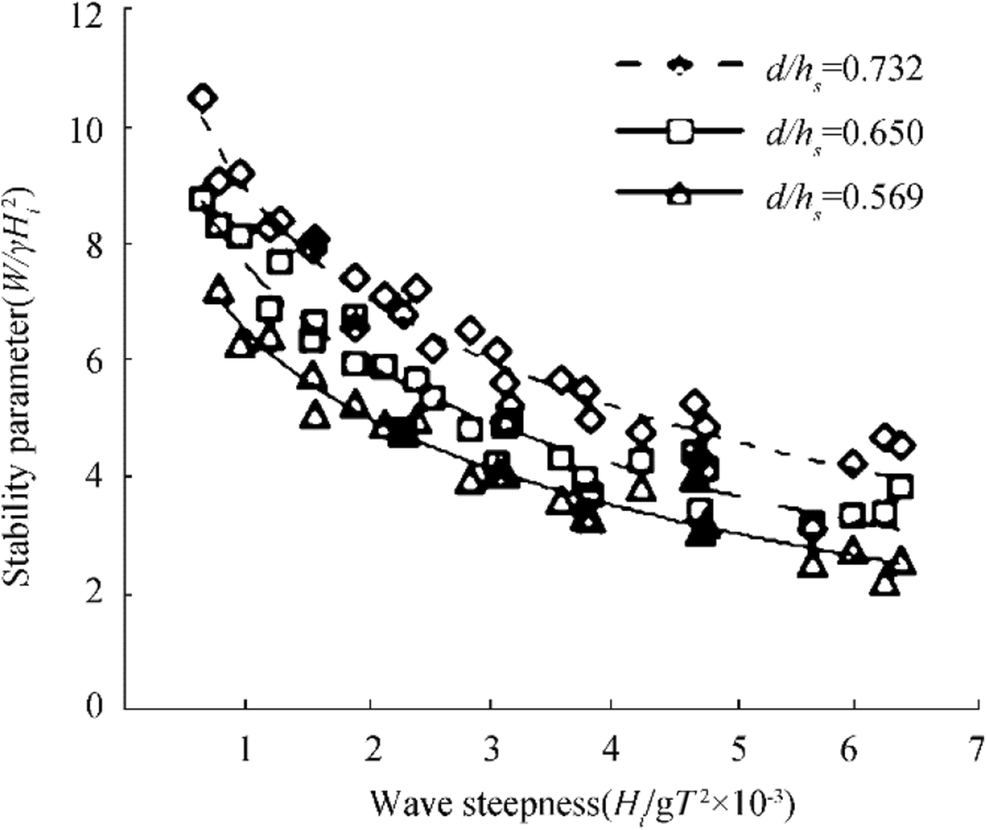 Figure 3 Influence of Hi/gT2 on W/γHi2 for S/D = 2
It is clear from the graphs that W/γHi2 decreases with increase in Hi/gT2 for all values of d/hs. This may be due to the reason that waves of higher steepness (lower wave period for a given wave height) interact with the QBW surface only for short interval of time causing lesser wave force. Therefore, lesser weight has to be added to prevent sliding and hence lower values of W/γHi2.
Considering all values d/hs, W/γHi2 varies from 2.225 to 10.532 for 6.24 × 10⁻⁴ < Hi/gT2 < 6.4 × 10⁻³ and S/D = 2. The maximum value for W/γHi2 observed is 10.532 for Hi/gT2 = 6.318 × 10⁻⁴ and at 0.45 m water depth (d/hs equal to 0.732). The minimum value for W/γHi2 observed is 2.225 for Hi/gT2 = 6.241 × 10⁻³ and at water depth equal to 0.35 m (d/hs = 0.569).
4.1.2 Seaside Perforated QBW with S/D = 2.5
When S/D ratio is increased to 2.5, the observed values for W/γHi2 vary from 2.110 to 10.269 for 6.24 × 10⁻⁴ < Hi/gT2 < 6.4 × 10⁻³. The maximum value for W/γHi2 observed is 10.269 for Hi/gT2 = 6.318 × 10⁻⁴ and at water depth equal to 0.45 m (d/hs equal to 0.732). The minimum W/γHi2 observed is 2.110 for Hi/gT2 = 6.241 × 10⁻³ and at water depth equal to 0.35 m (d/hs = 0.569) (refer Figure 4).
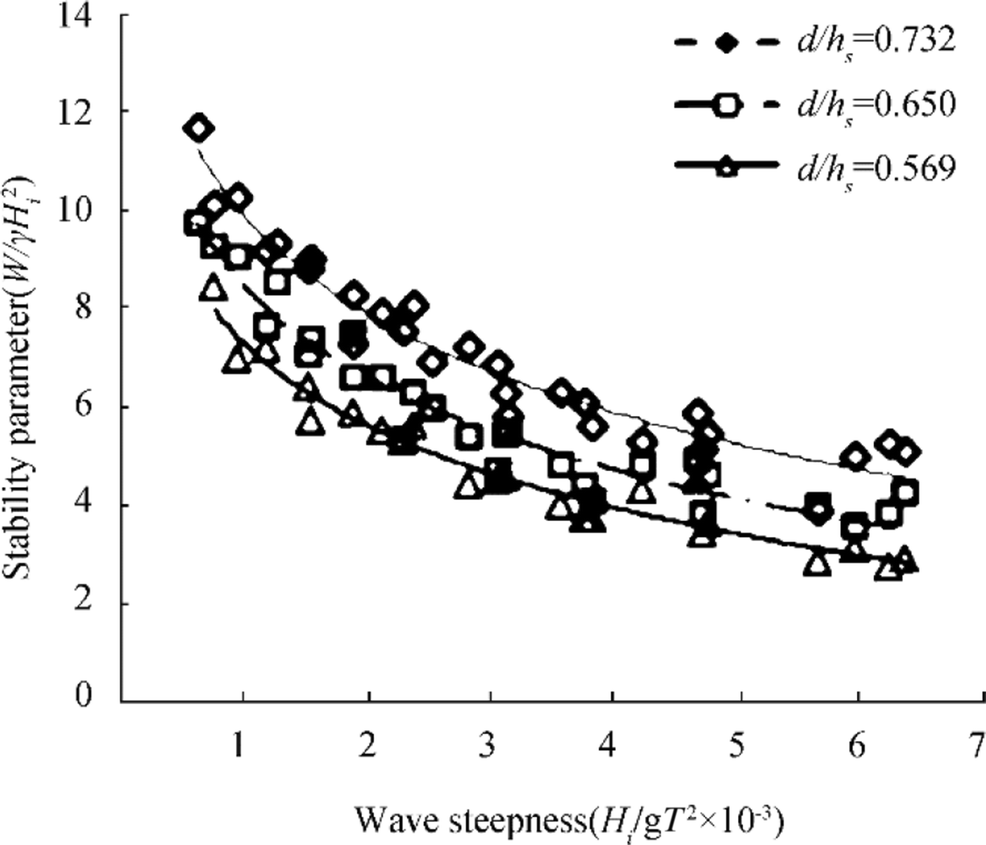 Figure 4 Influence of Hi/gT2 on W/γHi2 for S/D = 2.5
4.1.3 Seaside Perforated QBW with S/D = 3
For S/D = 3, the values obtained from the experiments for W/γHi2 are observed to be varying from 2.472 to 11.223 for 6.24 × 10⁻⁴ < Hi/gT2 < 6.4 × 10⁻³ (Refer Figure 5). The maximum W/γHi2 observed is 11.223 for Hi/gT2 = 6.318 × 10⁻⁴ and at water depth equal to 0.45 m. The minimum W/γHi2 observed is 2.472 for Hi/gT2 = 6.241 × 10⁻³ and at 0.35 m water depth.
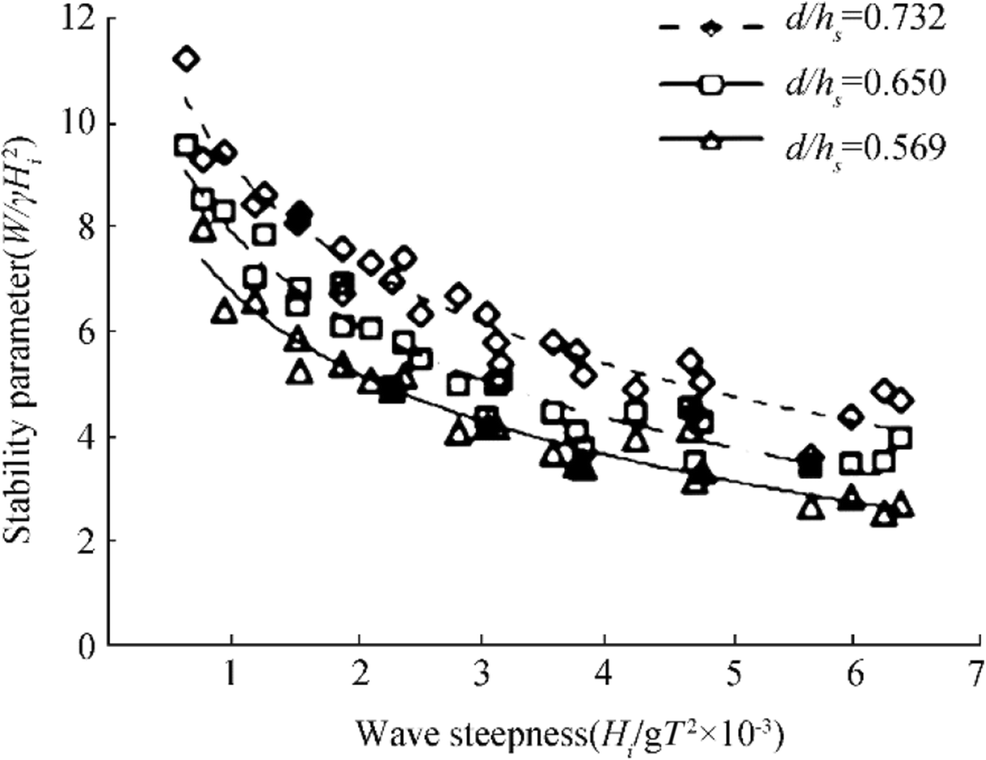 Figure 5 Influence of Hi/gT2 on W/γHi2 for S/D = 3
4.1.4 Seaside Perforated QBW with S/D = 4
From Figure 6 showing the variation of W/γHi2 with Hi/gT2 for different water depths with radius of breakwater constant (R = 0.55 m or hs = 0.615 m) and S/D ratio equal to 4, the values of W/γHi2 are found to be varying from 2.729 to 11.668 for 6.24 × 10⁻⁴ < Hi/gT2 < 6.4 × 10⁻³. The maximum W/γHi2 observed is 11.688 for wave height of 0.03 m and a wave period of 2.2 s (Hi/gT2 = 6.318 × 10⁻⁴) and at water depth equal to 0.45 m (d/hs equal to 0.732). The minimum W/γHi2 observed is 2.729 for wave height of 0.12 m and a wave period of 1.4 s (Hi/gT2 = 6.2410 × 10⁻³) and at water depth equal to 0.35 m (d/hs equal to 0.569).
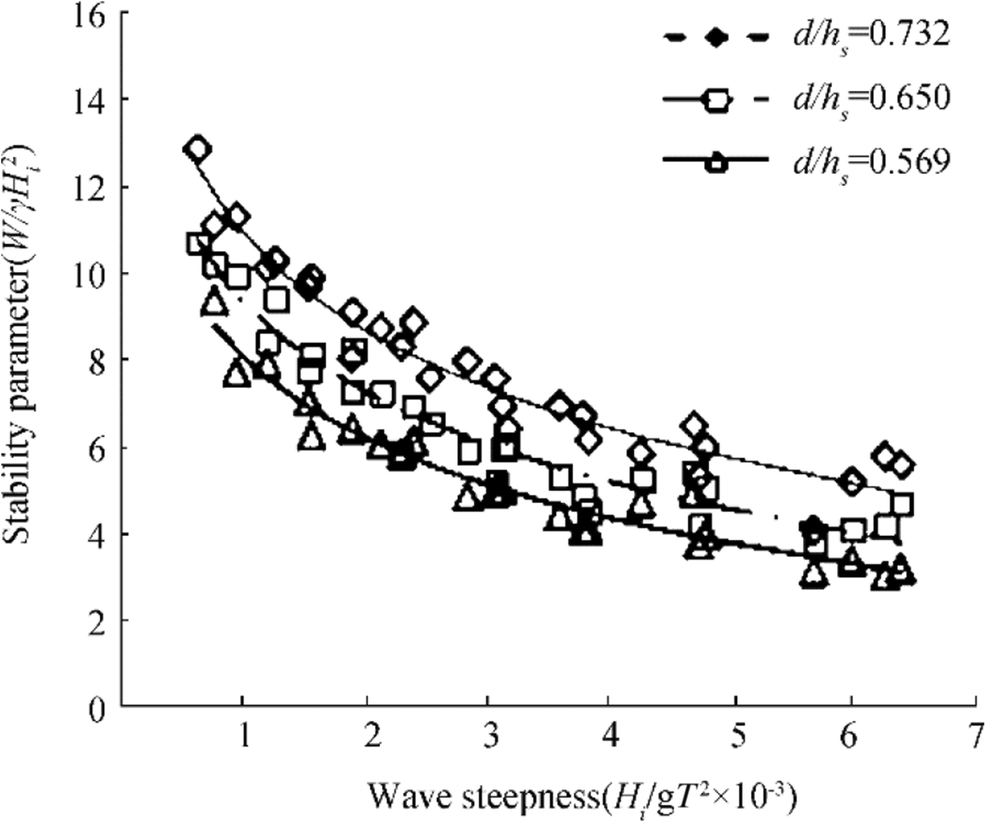 Figure 6 Influence of Hi/gT2 on W/γHi2 for S/D = 4
4.1.5 Seaside Perforated QBW with S/D = 5
From Figure 7, it is observed that for S/D equal to 5 and for all values d/hs and QBW of 0.55 m radius, W/γHi2 varies from 3.006 to 12.850 for 6.24 × 10⁻⁴ < Hi/gT2 < 6.4 × 10⁻³. The highest value for W/γHi2 observed is 12.850 for Hi/gT2 = 9.439 × 10⁻⁴ and at water depth equal to 0.45 m. The lowest W/γHi2 observed is 3.006 for wave height of 0.12 m and a wave period of 1.4 s (Hi/gT2 = 6.241 × 10⁻³) and at water depth equal to 0.35 m.
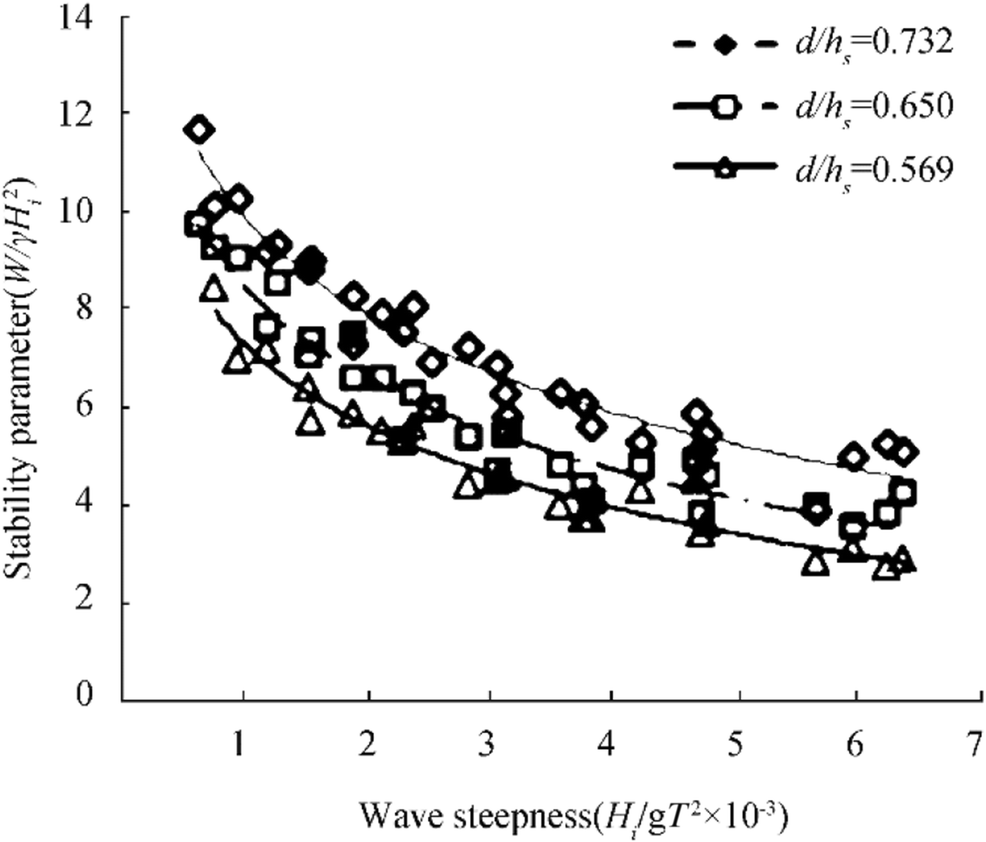 Figure 7 Influence of Hi/gT2 on W/γHi2 for S/D = 5
For all models, it was concluded that when Hi/gT2 increases, the dimensionless stability parameter decreases. Hence, for a given wave height, considering waves of long period (lower values of Hi/gT2) impart a larger force on the caisson resulting in more minimum weight and short period (steep) waves transfer low force, hence minimum structural weight. The safety due to sliding for higher values of wave force is increased by providing more weight into the QBW caisson thereby increasing the structural weight. The variation of W/γHi2 with Hi/gT2 for different water depths and S/D ratio for seaside perforated QBW was summarized in Table 2.
Table 2 Variation of W/γHi2 with Hi/gT2S/D ratio Water depth (cm) d/hs Variation of W/γHi2 2 0.45 0.732 3.335–10.532 0.40 0.650 3.236–8.766 0.35 0.569 2.225–7.249 2.5 0.45 0.732 3.198–10.269 0.40 0.650 3.155–8.546 0.35 0.569 2.110–6.967 3 0.45 0.732 3.566–11.223 0.40 0.650 3.385–9.566 0.35 0.569 2.472–7.989 4 0.45 0.732 3.882–11.668 0.40 0.650 3.555–9.711 0.35 0.569 2.729–8.412 5 0.45 0.732 4.056–12.850 0.40 0.650 3.779–10.695 0.35 0.569 3.006–9.355 4.2 Influence of Water Depth on W/γHi2
From Figure 8, it is concluded that by increasing the water depth, the values of W/γHi2 will be more and the lesser value for W/γHi2 is obtained for 0.35 m water depth. If water depth changes from 0.35 to 0.40 m, the values for W/γHi2 were found to be increased by 17.30% to 31.24%. When water depth increases from 0.35 to 0.45 m, there is an increase in W/γHi2 by 31.17% to 33.28%. Therefore, it is clear that the structure is safe against sliding with minimum weight including additional weight at lower water depths. For deep water conditions, more area of the QBW will be subjected to wave action resulting in greater force and higher values of W/γHi2. Hence, for a constant S/D ratio, heavier structure is required for sliding stability in more water depths compared with lower values for water depth.
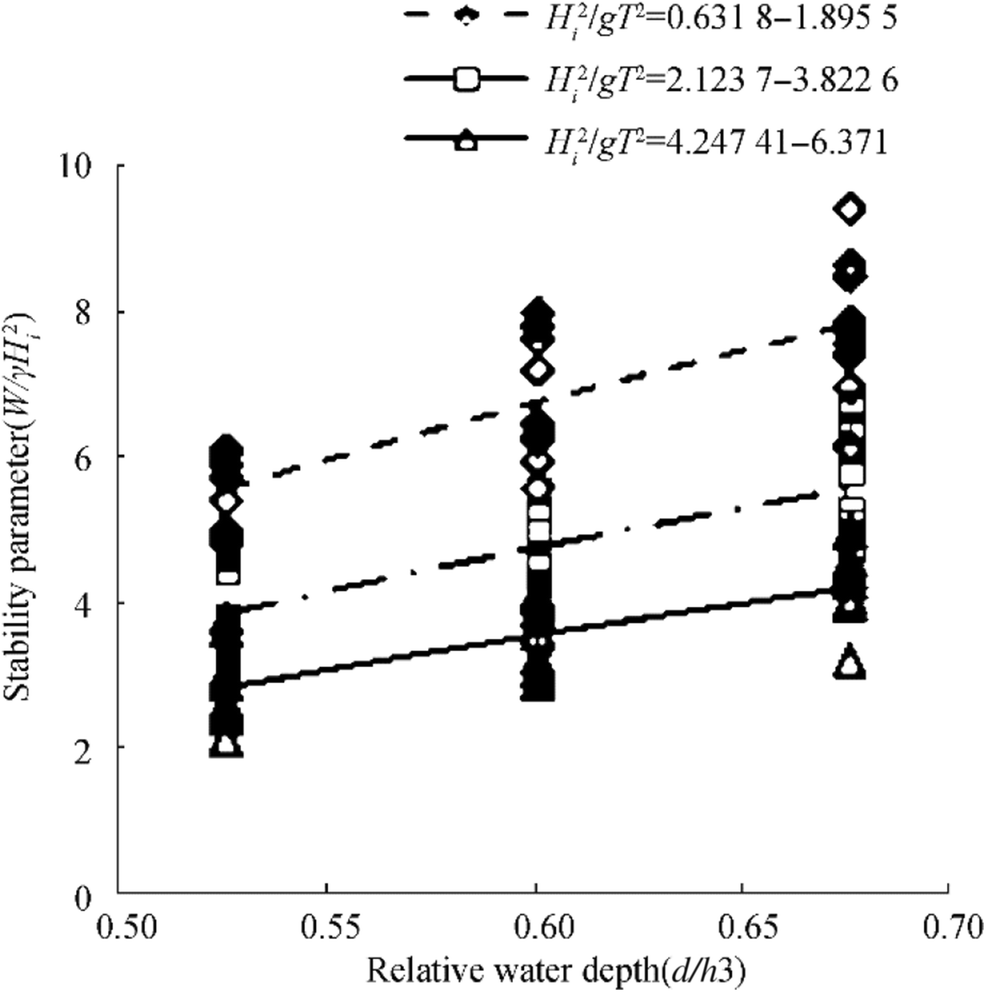 Figure 8 Influence of d/hs on W/γHi2
4.3 Influence of S/D Ratio on W/γHi2
Figure 9 shows the variation on the values of W/γHi2 for different values of S/D and Hi/gT2. From dimensionless graphs, it was concluded that the values of W/γHi2 are more for higher values of the S/D ratio. When depth of water changes to 0.40 m, there will be decrease in W/γHi2 from 5.92% to 9.20%, 10.42% to 10.55%, 16.51% to 20.09%, and 14.36% to 18.04% for S/D = 4, 3, 2.5, and 2 when compared with S/D equal to 5. Similarly, when the depth of water changes to 0.45 m, the percentage of W/γHi2 reduces for S/D = 4 from 4.3% to 9.2% compared with S/D = 5.
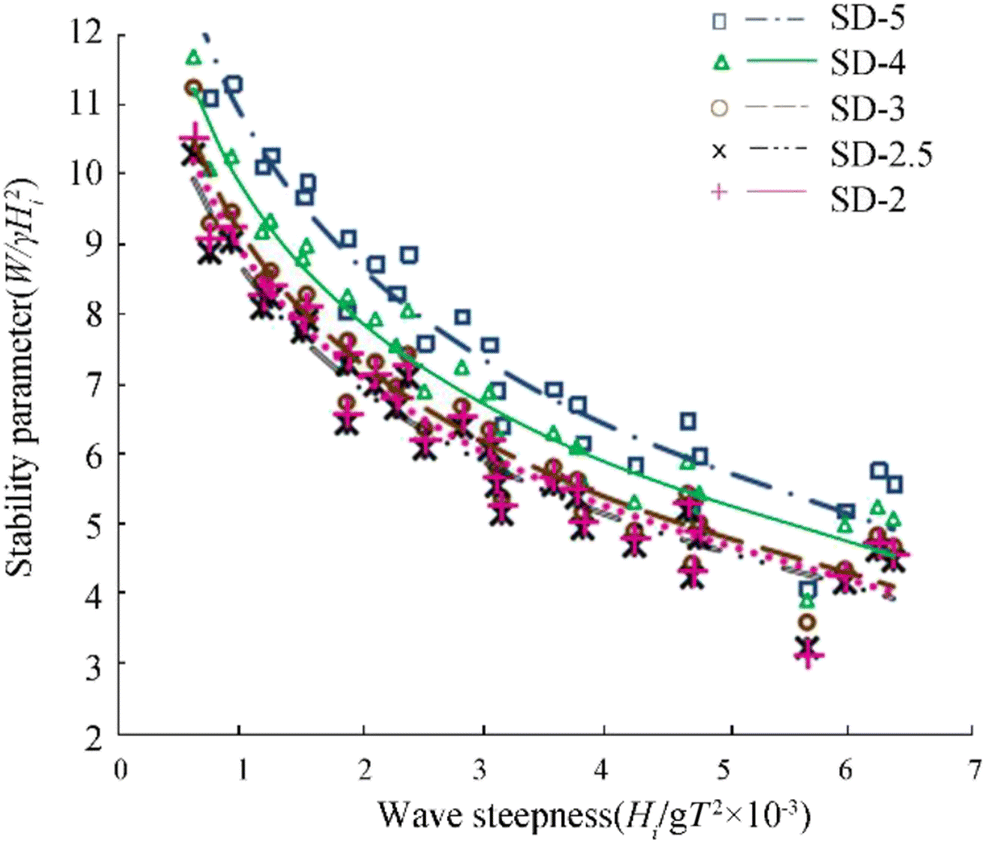 Figure 9 Influence of S/D values on W/γHi2 for different Hi/gT2
The percentage reduction in W/γHi2 for S/D = 3, 2.5, and 2 is 12.3% to 12.7%, 20.08% to 21.2%, and 17.8% to 18.1% with respect to S/D = 5.When values of S/D are decreased, W/γHi2 was found to lower when compared with higher values of S/D except for the QBW model having S/D = 2.
For lower values of S/D, more perforations will be affected causing the absorption of a significant amount of energy due to incoming waves, and therefore, force exerted on the caisson will be less. Hence, lesser additional weight to be added for resisting sliding stability and hence the values for W/γHi2 will be lower.
4.4 Equations Developed for Stability Parameter
The results for the experimental studies on stability characteristics for impermeable QBW for different breakwater radius at different water depths and wave conditions are combined into suitable dimensionless terms (Jiang et al. 2008). The regression analysis is done by using the Excel statistical software—XLSTAT—and the equation for the best fit curve is obtained.
Nonlinear regression analysis was conducted using the XLSTAT software with 1254 sets of data's for W/γHi2 corresponding to different values of Hi/gT2, d/hs, and S/D. Model parameters are assigned according to the limitations while selecting dependent and independent variables. For this case, W/γHi2 is the dependent variable which depends on values of Hi/gT2, d/hs, and S/D. Summary of the statistics is shown in Table 3 and the fitness of the statistics is shown in Table 4.
Table 3 Summary of statisticsVariable Minimum Maximum Mean Standard deviation W/γHi2 1.967 11.668 5.515 1.850 Hi/gT2 0.632 6.371 3.141 1.666 d/hs 0.526 0.732 0.626 0.067 S/D 2.000 5.000 3.298 1.076 Table 4 Fitness of statisticsObservations 1254.000 Degrees of Freedom, DF 1247.000 Regression coefficient, R2 0.909 Sum of squares of the errors, SSE 393.927 Mean of squares of the errors, MSE 0.316 Root mean squares of the errors, RMSE 0.562 Iterations 53.000 From the above table, it is clear that regression coefficient R2 is 0.909 which means the curve obtained is the best fit curve with minimum error. The resulting equation is obtained as the output from the XLSTAT software is noted (Misra 2001).
The equation for W/γHi2 for seaside perforated QBW was obtained as follows:
$$ \begin{array}{c} W/{\gamma H}_i^2\kern0.5em =6.813\left({H}_i/{gT}^2\right)-0.503+31.580\left(d/{h}_s\right)8.357+\\ 0.0008\left(d/{h}_s\right)4.524-0.0841 \end{array} $$ Figure 10 shows the residual of the errors obtained after the regression analysis. Residual errors are obtained due to the difference of the measured results from the actual values.
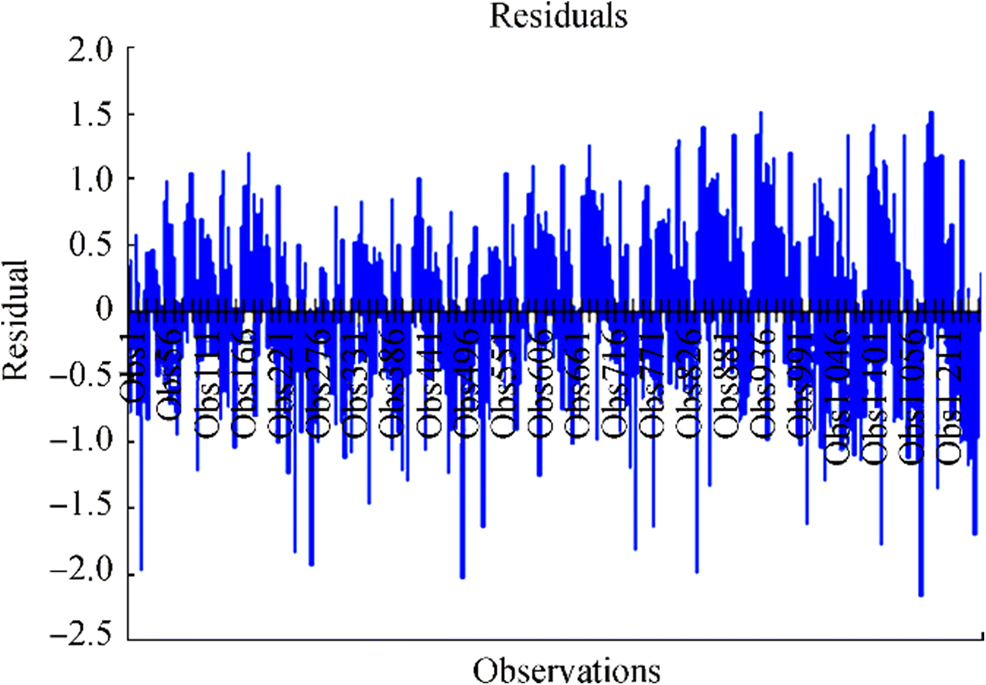 Figure 10 Residuals values of W/γHi2 for perforated QBW
Figure 11 shows the comparison between the measured and predicted values of stability parameter W/γHi2 for perforated QBW obtained using the XLSTAT software.
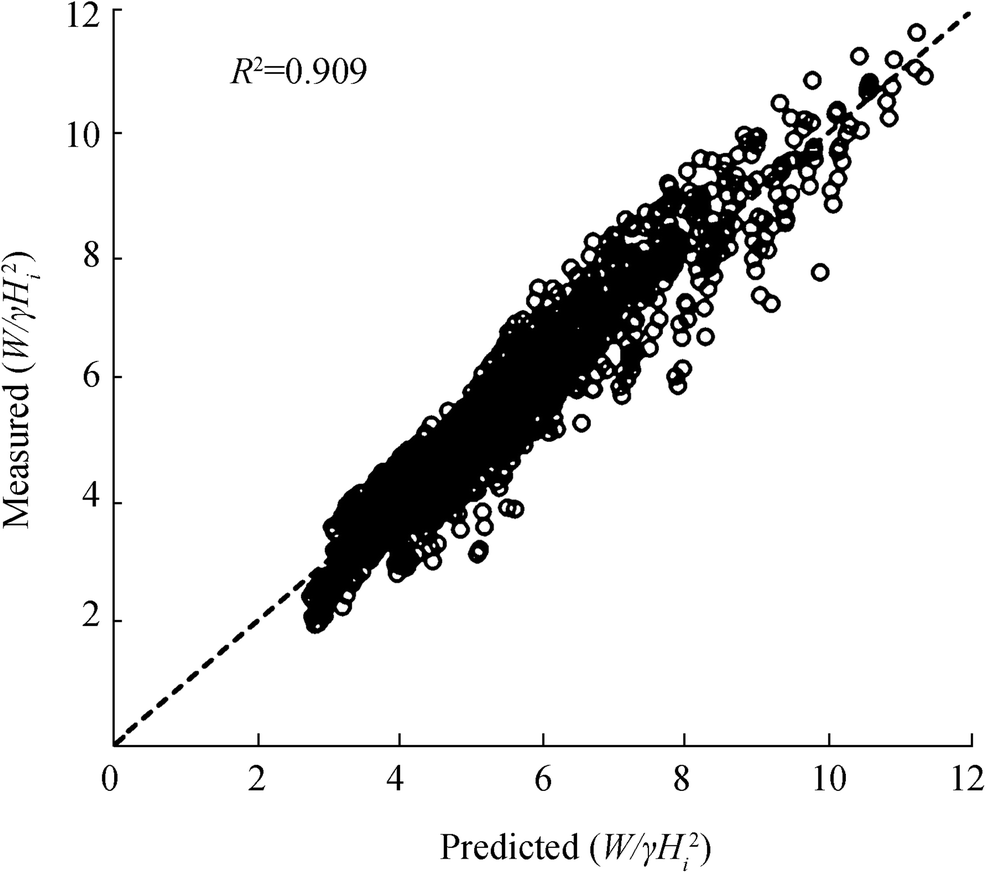 Figure 11 Comparison between measured and predicted values of W/γHi2 for perforated QBW
5 Conclusions
Based on the model studies conducted on seaside perforated QBW, following are the conclusions obtained:
1) For varying d/hs and S/D ratio, the values of W/γHi2 will be lesser for higher values of Hi/gT2.
2) For different values for S/D and Hi/gT2, the values for stability parameter (W/γHi2) are found to be more for higher values of water depth when compared with lower water depth.
3) The stability parameter W/γHi2 is found to be reduced for lower S/D ratio with different values of Hi/gT2 and d/hs, but a reverse trend was obtained for seaside perforated QBW having S/D = 2. When S/D is reduced, there will be more dissipation of wave energy and QBW is subjected to less wave force resulting in less weight of QBW to prevent sliding or lesser values of W/γHi2. Further decreasing S/D to 2 causes back propagation of wave and hence exerts more force on QBW resulting in higher values for W/γHi2.
4) Nonlinear regression analysis was carried out for the various tests conducted and the equation for the best fit curve with a good regression coefficient (R2 value) was found out.
5) From the experiments conducted and the comparative analysis, it is clear that the perforated QBW of S/D = 2.5 has better performance characteristics and can be adopted in the site with the favorable condition.
Acknowledgments: The authors are thankful to Director, NITK Surathkal and the Head of Applied Mechanics Department, NITK Surathkal for all the support and encouragement in the preparation of this paper.${contentEle.labelText} NomenclatureS/D Spacing between perforations/diameter of perforations Hi incident wave height D depth of water g acceleration due to gravity T wave period L wave length W weight of QBW per unit length hs height of structure γ weight density d/hs relative water depth Hi /gT2 incident wave steepness parameter W/γHi2 stability parameter -
Figure 1 Longitudinal section of wave flume
Figure 2 Typical cross-section of perforated QBW
Figure 3 Influence of Hi/gT2 on W/γHi2 for S/D = 2
Figure 4 Influence of Hi/gT2 on W/γHi2 for S/D = 2.5
Figure 5 Influence of Hi/gT2 on W/γHi2 for S/D = 3
Figure 6 Influence of Hi/gT2 on W/γHi2 for S/D = 4
Figure 7 Influence of Hi/gT2 on W/γHi2 for S/D = 5
Figure 8 Influence of d/hs on W/γHi2
Figure 9 Influence of S/D values on W/γHi2 for different Hi/gT2
Figure 10 Residuals values of W/γHi2 for perforated QBW
Figure 11 Comparison between measured and predicted values of W/γHi2 for perforated QBW
Table 1 Experimental variables
Parameters Range Wave specific parameters Incident wave height, Hi (m) 0.03, 0.06, 0.09, 0.12, 0.15, 0.18 Water depth, d (m) 0.35, 0.40, 0.45 Time period, T (s) 1.2, 1.4, 1.6, 1.8, 2.0, 2.2 Structure specific parameters Radius of the structure (m) 0.55 S/D ratio 2, 2.5, 3, 4, 5 Diameter of perforation (m) 0.016, 0.020 Table 2 Variation of W/γHi2 with Hi/gT2
S/D ratio Water depth (cm) d/hs Variation of W/γHi2 2 0.45 0.732 3.335–10.532 0.40 0.650 3.236–8.766 0.35 0.569 2.225–7.249 2.5 0.45 0.732 3.198–10.269 0.40 0.650 3.155–8.546 0.35 0.569 2.110–6.967 3 0.45 0.732 3.566–11.223 0.40 0.650 3.385–9.566 0.35 0.569 2.472–7.989 4 0.45 0.732 3.882–11.668 0.40 0.650 3.555–9.711 0.35 0.569 2.729–8.412 5 0.45 0.732 4.056–12.850 0.40 0.650 3.779–10.695 0.35 0.569 3.006–9.355 Table 3 Summary of statistics
Variable Minimum Maximum Mean Standard deviation W/γHi2 1.967 11.668 5.515 1.850 Hi/gT2 0.632 6.371 3.141 1.666 d/hs 0.526 0.732 0.626 0.067 S/D 2.000 5.000 3.298 1.076 Table 4 Fitness of statistics
Observations 1254.000 Degrees of Freedom, DF 1247.000 Regression coefficient, R2 0.909 Sum of squares of the errors, SSE 393.927 Mean of squares of the errors, MSE 0.316 Root mean squares of the errors, RMSE 0.562 Iterations 53.000 Nomenclature
S/D Spacing between perforations/diameter of perforations Hi incident wave height D depth of water g acceleration due to gravity T wave period L wave length W weight of QBW per unit length hs height of structure γ weight density d/hs relative water depth Hi /gT2 incident wave steepness parameter W/γHi2 stability parameter -
Binumol S, Rao S, Hegde AV (2017) Wave reflection and loss characteristics of an emerged quarter circle breakwater with varying seaside perforations. J Inst Eng (India): Ser A Springer 98(3): 311–315 https://doi.org/10.1007/s40030-017-0198-y Chaudhary B, Hazarika H, Nishimura N (2017) Effects of duration and acceleration level of earthquake ground motion on the behavior of unreinforced and reinforced breakwater foundation. Soil Dyn Earthq Eng 98: 24–37 https://doi.org/10.1016/j.soildyn.2017.04.006 Chaudhary B, Hazarika H, Murakami A, Fujisawa K (2018a) Geosynthetic-sheet pile reinforced foundation for mitigation of earthquake and tsunami induced damage of breakwater. Geotext Geomembr 46: 597–610 https://doi.org/10.1016/j.geotexmem.2018.04.011 Chaudhary B, Hazarika H, Murakami A, Fujisawa K (2018b) Countermeasures for enhancing the stability of composite breakwater under earthquake and subsequent tsunami. Acta Geotech 13(4): 997–1017 https://doi.org/10.1007/s11440-017-0615-4 Chaudhary B, Hazarika H, Murakami A, Fujisawa K (2019) Development of resilient breakwater against earthquake and tsunami. Int J Geomech, ASCE 19 (1): 04018188–1 to 17 Hughes SA (1993) Physical models and laboratory techniques in coastal engineering advanced series on Ocean Engineering, World Scientific Singapore Isaacson M (1991) Measurement of regular wave reflection. J Waterw Port Coast Ocean Eng 117(6): 553–569 https://doi.org/10.1061/(ASCE)0733-950X(1991)117:6(553) Jiang XL, Gu HB, Li YB (2008) Numerical simulation on hydraulic performances of quarter-circular breakwater. China Ocean Eng 22(4): 585–594 Luwen Q, Zhang X, Jiang X, Qin Y (2013) Research on partial coefficients for the design of quarter-circular caisson breakwater. J Mar Sci Appl 12: 65–71 https://doi.org/10.1007/s11804-013-1176-7 Misra SC (2001) Uncertainty analysis in hydrodynamic tests. Proceedings, International Conference in Ocean Engineering, 200-207 Shi Y-J, Mi-ling W, Jiang X, Li Y-b (2011) Experimental researches on reflective and transmitting performances of quarter-circular breakwater under regular and irregular waves. China Ocean Eng 25: 469–478 https://doi.org/10.1007/s13344-011-0038-1 Xie SL, Li YB, Wu YQ, Gu HB (2006) Preliminary research on wave forces on quarter circular breakwater. Ocean Eng J 24(1): 14–18