Development of an Energy Efficiency Design Index for Inland Vessels of Bangladesh
https://doi.org/10.1007/s11804-020-00139-1
-
Abstract
More than 10 000 different types of ship ply the waters of Bangladesh all year round, but the performance of these ships in terms of CO2 emission is not known and regulations related to energy efficiency of inland waterway ships remain nonexistent. This paper attempts to assess the present situation of inland class vessels in terms of Energy Efficiency Design Index (EEDI). With the use of a developed database of inland vessels in Bangladesh, EEDI reference lines for different types of inland vessels in Bangladesh were established and then compared with those of other countries. The present EEDI of existing inland vessels was investigated. Results indicate that most of the existing vessels do not meet the current EEDI baseline. Hence, new guidelines are necessary to achieve EEDI compliance in the near future. Some recommendations were proposed for improving CO2 emissions, with the socio-economic and technical factors in Bangladesh taken into consideration.-
Keywords:
- Inland waterways vessel ·
- CO2 emission ·
- IMO ·
- Energy Efficiency Design Index (EEDI)
Highlights• Developed a database of existing different types of ships plying in the inland waterways in Bangladesh• Investigated the influence of design parameters on the EEDI for the inland vessels in Bangladesh• Established Energy Efficiency Design Index (EEDI) references lines for different types of inland vessels in Bangladesh• Assessed the present status of existing inland vessels in terms of EEDI -
1 Introduction
From the global freight transport perspective, maritime transport is still recognized as a more energy-efficient means of transportation compared with road and air transport, due to its large carrying capacity and low fuel consumption per ton cargo transported. Maritime transport is generally considered as the major facilitator of trades among different nations, regions, and continents. Taking the advantages of trade liberalization, telecommunication, and international standardization, maritime transport has increased by 250% following the same rate as global gross domestic product over the past 40 years. According to the first greenhouse gas study by the International Maritime Organization (IMO), ships engaged in international trade emitted 1100 metric tons of CO2 in 2007 (3.5% of global emission). This emission reduced to 938 metric tons of CO2 in 2012. However, considering a business-as-usual scenario with a tripling in world trade and no further mitigation measures taken, future emission is expected to increase by 250% over the period of 2012–2050 (Evert et al. 2017). Even though ships are generally very efficient transport vehicles, further efficiency improvements still have significant potential. Thus, to control emission from shipping, the ship Energy Efficiency Design Index (EEDI) was formulated by the IMO Marine Environment Protection Committee (MEPC) as a CO2 emission performance measure (IMO 2014). The basic formulation of EEDI is based on the ratio of total CO2 emission per ton cargo transported and nautical miles sailed. It can also be regarded as an indicator of energy efficiency of a ship and ship propulsion. The EEDI was made mandatory for new ships for the IMO in 2011 as a means of reducing carbon footprint from shipping. Several attempts have been made to establish a reference values for seagoing vessels with respect to energy efficiency index (Tran 2015; Borkowski et al. 2012; Vladimir et al. 2015; Rehmatulla et al. 2017; Frouws 2016). Recently, European countries have been trying to propose reliable tools for benchmarking efficiency and carbon emissions for their inland vessels similar to the ones that are already accepted for seagoing ships (Simic 2014; Krikkle and Annik 2011; Jain 2012; Hasan 2011).
Bangladesh is criss-crossed with a network of numerous rivers, canals, creeks, and water bodies, which occupy about 11% of the country's total area. This river network has long been regarded in Bangladesh as a safe and cost-effective route. The inland waterways comprise a total length of nearly 6000 km of navigable waterways. More than half of the country's total land area is within a distance of 10 km from navigable waterways. Given that it is the cheapest, safest, and most accessible option, the inland water transportation (IWT) sector has become one of the country's major means of transportation. The IWT sector carries over 50% of all arterial freight traffic and one-quarter of all passenger traffic each year. Moreover, more than 80% of petroleum products are transported all year round through inland tankers (Kaosar 2015). Although more than 10 000 different types of ship ply the waters of Bangladesh all year round, with the addition of 200–300 different types of vessels every year, the performance of these ships in terms of CO2 emission is not known and any regulations related to the energy efficiency of inland waterway remain nonexistent. At the same time, no suggested benchmark could be used to assess the energy efficiency of inland vessels in Bangladesh.
Bangladesh has a very small land area of only 144 000 km2, yet its population is very high (around 160 million). Bangladesh is one of the most densely populated countries in the world, and due to its favorable geographical location, different types of vessels ply close to populated areas all year round using inland waterways. As a result, the population may be adversely impacted by the pollution from these vessels. With the continuous growth of the country's economy, the standard of living has improved with the increase in per capita income (The Dailystar, 2017). Thus, the people of Bangladesh have become more conscious about environment and environmental pollution nowadays. As a result, knowing the status of these inland vessels in terms of emission and proposing necessary guidelines for improving the situation if necessary are essential.
From this perspective, the objective of this paper is to review the present scenario of inland vessels in terms of CO2 emission, analyze the results, and propose and develop a reliable tool for benchmarking energy efficiency and carbon emission of different types of vessels considering the existing socio-economic and technical factors of Bangladesh. Recommendations are also presented to overcome the situation in the long run.
2 Outline of the Methodology
Primary data and information about different types of inland vessels of Bangladesh were collected through structured, unstructured, and open-ended questionnaires distributed among various government shipping organizations and private organization such as shipyards and ship design houses. The main types of inland vessels of Bangladesh such as cargo ships, oil tankers, passenger vessels, ferries, and sand carriers were taken into consideration. A database was developed based on data provided by the Department of Shipping considering the main principal particulars of the ship, its speed, engine type, engine power, and type of the fuel used for more than three thousand vessels plying in inland routes of Bangladesh. The specific fuel consumption (SFC) of engines was collected from engine catalog data and field data. Relevant ship drawings and other documents were collected. Commercial ship design software was used for performance analysis to improve the energy efficiency index. Construction materials, propulsion system, and hull coating along with quality control of shipyard and regulatory authority had been assessed, and collected relevant information were collected. The awareness level of different stake holders including ship designers and design approval authorities, with regard to recent energy efficient regulation, was assessed. Secondary data and information were collected from external and internal sources such as journals, theses, books, reports, ship owner associations, enlisted ship design houses, related private organizations, and web sites.
3 Formulations of EEDI for Inland Vessels
3.1 Development of Reference Line
The reports of MEPC 66 (IMO 2014) were used as the basis for the calculations. The IMO defines the energy efficiency of ships as the ratio of the mass of CO2 emissions from main, auxiliary engines and additional shaft per unit of transport work for a particular ship design.
Hence, EEDI can be defined as follows:
$$ {\mathrm{EEDI}}_{\mathrm{attained}}=\frac{{\mathrm{CO}}_2\ \mathrm{Emission}}{\mathrm{Transport}\ \mathrm{work}}\\ =\frac{\mathrm{Power}\times \mathrm{Specific}\ \mathrm{Fuel}\ \mathrm{Consumption}\times {\mathrm{CO}}_2\ \mathrm{Conversion}\ \mathrm{Factor}}{\mathrm{Capacity}\times \mathrm{Speed}} $$ (1) $$ =\frac{\begin{array}{c}\mathrm{Emission}\ \mathrm{from}\ \mathrm{Main}\ \mathrm{Engine}+\mathrm{Emission}\ \mathrm{from}\ \mathrm{Auxiliary}\ \mathrm{Engine}+\mathrm{Emission}\ \mathrm{for}\ \mathrm{running}\ \mathrm{shaft}\ \mathrm{motor}\\ {}-\mathrm{Efficient}\ \mathrm{Tech}.\mathrm{Reduction}\ \end{array}}{\mathrm{Capacity}\times \mathrm{Reference}\ \mathrm{Speed}} $$ (2) EEDI values for different types of ships were calculated on the basis of developed database for different ships of different capacities. Then, the exponential regression line was drawn from the average index values. The regression line expresses the baseline value, which can be calculated by using the following formula:
$$ \mathrm{Reference}\ \mathrm{line}\ \mathrm{value}=a\times {b}^{-c} $$ (3) The values of a, b, and c of Eq. (3) were determined from the database developed for different types of ship. Gross tonnage (GT) was considered in calculating the EEDI reference lines of passenger vessels and ferries (IMO 2014). As suggested by IMO, 100% of deadweight was used as capacity for other vessels. The EEDI was calculated for 75% of MCR of the engine and with the corresponding evaluated ship speed and the MCR obtained from the power speed curve supplied by the engine manufacturer. The adopted value of carbon emissions factor for diesel fuel was 3.2 t CO2/t fuel, as recommended by IMO.
Figure 1 shows the EEDI values of inland cargo vessels for different cargo capacities (in terms of DWT) where data from 351 cargo ships were used to formulate the reference line. On the basis of the calculated results, a power series regression line was drawn to show the co-relation of the data. R2 describes the correlation of the baseline value, and a value close to 1 or − 1 represents a high degree of correlation. Scatter values that are more than two standard deviations from the regression line are removed, and a new regression line is calculated. This approach ensures that erroneous data are excluded from the calculation. In Table 1, the term "Population" means the number of vessels that were taken in this study and "Excluded" means the number of vessels that were deducted from this study.
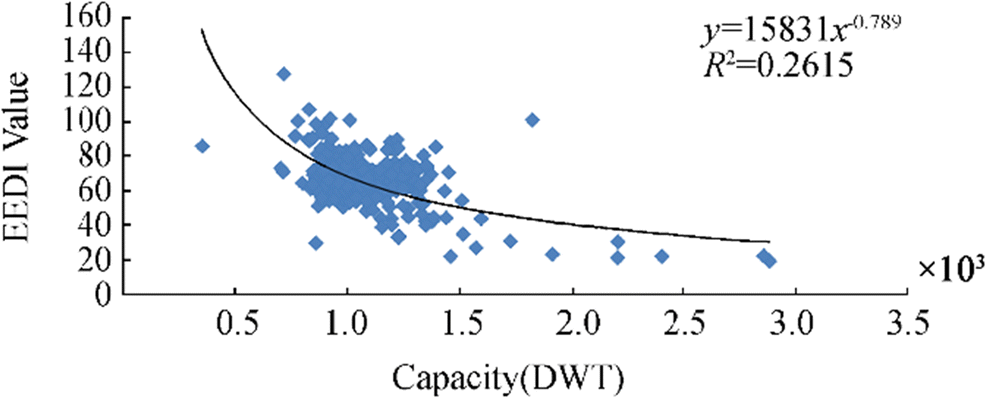 Figure 1 EEDI reference line for inland cargo vessels in BangladeshTable 1 Reference line parameter value for different types of inland vessels
Ship type Parameters R2 a b c Population Excluded General cargo vessel 15 931 DWT 0.789 0.2615 351 16 Oil tanker 950.93 DWT 0.406 0.4132 85 5 Passenger vessel 42 477 GT 1.1015 0.6806 90 13 Passenger ferry 9 × 10⁷ GT 2.204 0.7914 36 2 Sand carrier 2261.7 DWT 0.595 0.2592 2095 18 Figure 1 shows that the range of deadweight for inland cargo vessels is generally smaller than 3000 DWT. The length/breadth (L/B) ratios of these vessels vary from 4.7 to 6.8, and the length/depth (L/D) ratios vary from 10.3 to 15.1. According to the reference line, EEDI values vary from 30 to 120 for the whole range of inland cargo ship in Bangladesh. However, most of the inland ships fall in the 800–1500 DWT range and the corresponding EEDI values are in the range of 50–80. The EEDI can be improved with increased length particularly for ships whose lengths of 55 m and above. The overall correlation of the regression line is low possibly because of different scatter points for the same capacity range.
Figure 2 shows the EEDI reference line for inland oil tankers of Bangladesh which was formulated on the basis of data from 85 oil tanker ships data in the range of 200 DWT to 3200 DWT. The L/B ratios of these vessels vary from 3.9 to 7.3, and the L/D ratios vary from 8.7 to 22.7. According to the formulated reference line, the value of EEDI varies from 20 to 130. The correlation of the regression line is still low mainly due to the many scatter points for the same capacities.
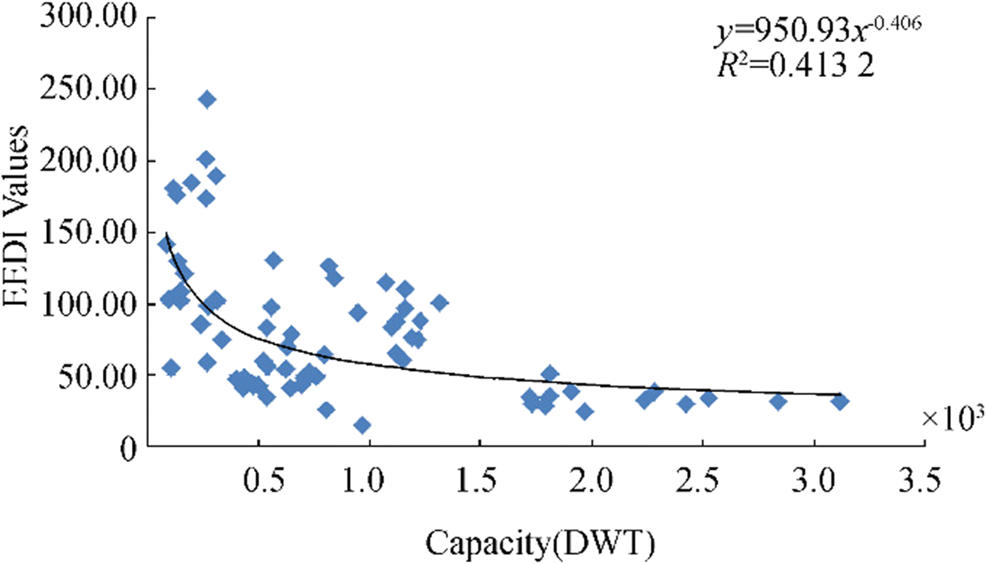 Figure 2 EEDI reference line for inland oil tankers in Bangladesh
Figure 3 shows the EEDI reference line for inland passenger vessels in Bangladesh where 90 ships were used to formulate the reference line. The L/B ratios vary from 4.5 to 7.36, and the L/D ratios vary from 13 to 34. According to the formulated reference line, the value of EEDI varies from 10 to 350. The correlation of the regression line is better than that of cargo ships and oil tankers.
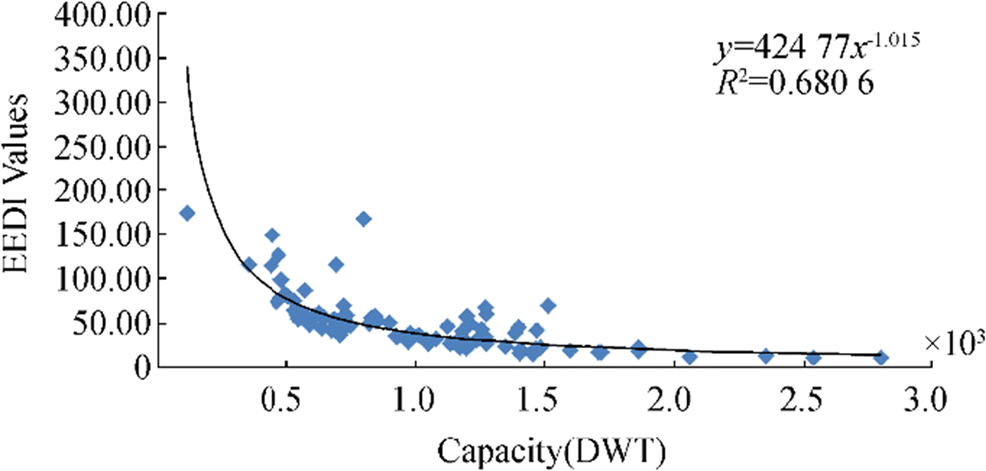 Figure 3 EEDI reference line for inland passenger vessels in Bangladesh
Figure 4 shows the EEDI reference line for the inland passenger ferries in Bangladesh. The passenger ferries are smaller than 550 GT. The L/B ratios vary from 2.0 to 4.9, and the L/D ratios vary from 14.7 to 21.4. The regression line of passenger ferry was plotted on the basis of available data. The correlation of the regression line is relatively high but, the EEDI value is much higher remaining within 500 to 1200. In terms of EEDI value, this type shows the worst performance among different vessel types.
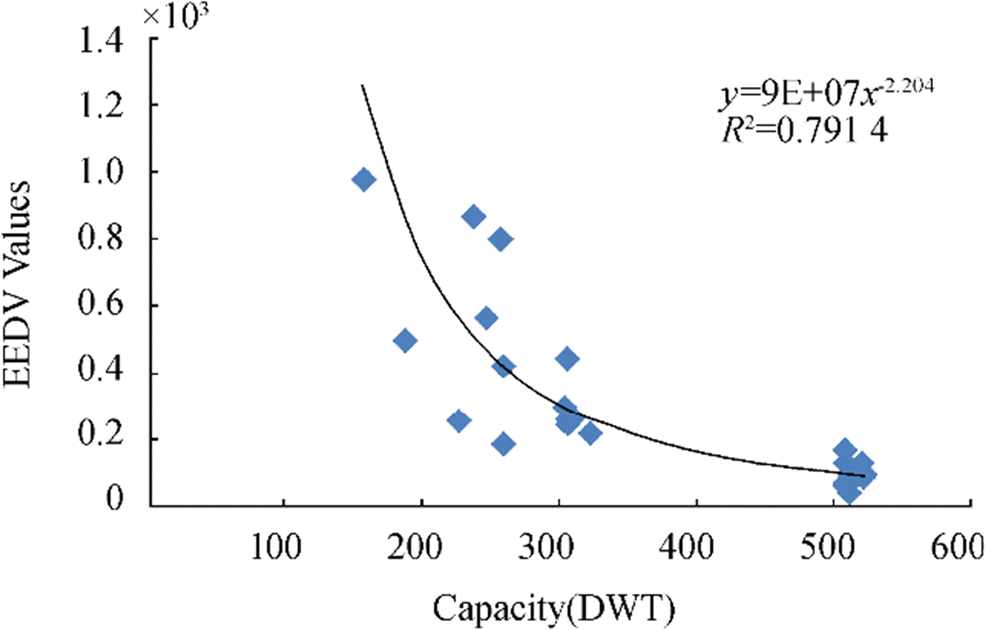 Figure 4 EEDI reference line for inland passenger ferries in Bangladesh
Figure 5 shows the EEDI reference line for the inland sand carriers in Bangladesh. More than 2000 ships were used to formulate the reference line. The L/B ratios vary from 3.25 to 6.9, and the L/D ratios vary from 8.75 to 24.5. The numbers of sand carriers are smaller than 300 DWT, and most inland vessels of this type are indigenous in nature. Moreover, they fall in the range of 20 to 100 DWT, and the EEDI ranges from 50 to 400. The correlation of the regression line is low.
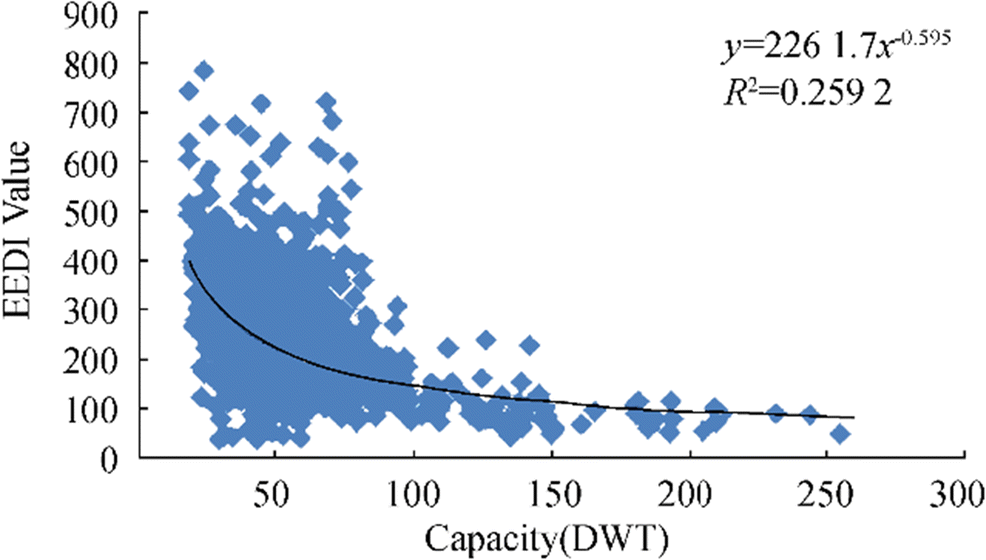 Figure 5 EEDI reference line for inland sand carriers in Bangladesh
According to Eq. (3), the values of a, b, and c for different types of inland vessels are summarized in Table 1. This formulated line provides different values of EEDI (CO2 in g/ton mile) for different capacities and will be used as a reference value so that any vessel should be designed in such a way that the EEDI value should be less than or equal to that particular value.
3.2 Reduction of EEDI Reference Line Value for Different Phases
The EEDI adopted by the IMO in 2011 will affect most of the new ships, and it was decided that more stringent emission factor would come into play phase by phase. This idea implies that in the coming years, the EEDI will be tightened to keep pace with the technological innovations. The planned time period for phase 1 was from January 1, 2015 to December 31, 2019. For phase 2, it is from January 1, 2020 to December 31, 2024 and, for phase 3, it is from January 1, 2025 onwards. The formulated reference lines for different types of inland vessels are considered here as reference line of phase 1. Phases 2 and 3 are assumed to force an EEDI reduction of 20% and 30% respectively from the formulated reference line of phase 1 for different ship types similar to the ocean going ships' EEDI proposed by IMO.
Thus, the attained EEDI shall be calculated for phases 2 and 3 as follows:
$$ \mathrm{Attained}\ \mathrm{EEDI}\leqq \mathrm{Required}\ \mathrm{EEDI}\\ =\left(1-X/100\right)\times \mathrm{Baseline}\ \mathrm{value} $$ (4) where X is the reduction factor to be considered for calculating the EEDI for the reference value of phases 2 and 3.
Figure 6 shows the phase wise EEDI reference line reduction value for inland cargo vessels in Bangladesh as an example. For example, a 1000 DWT cargo vessel that is designed for phase 1 should have a required EEDI value of 68 g CO2/ton mile, whereas for phases 2 and 3, the required EEDI value is 54.4 and 47.6 g CO2/ton mile, respectively.
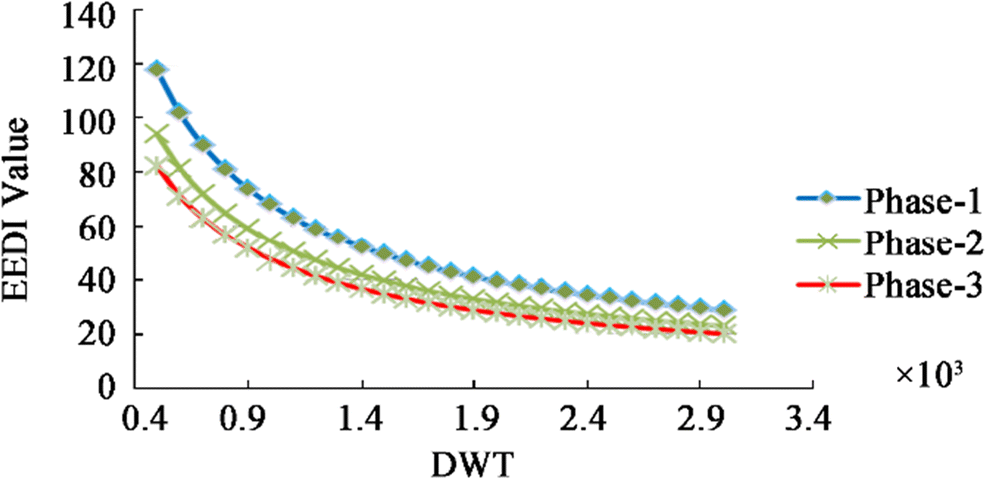 Figure 6 Phase wise EEDI reference lines for inland cargo vessels
4 Comparison Between Various Countries' Inland Vessel EEDI Reference Lines
The field data show that many inland vessels in Bangladesh are indigenous in nature. They are not designed to maintain a proper hull shape. There is a tendency to keep L/B ratios low, and engine power is chosen arbitrarily based purely on the experience of the ship operators. As a result, power is relatively high. By contrast, European countries, particularly Denmark and the Netherlands, have for a long time been concerned about the actual energy efficiency of ship for their inland shipping, for which they have already developed some reference lines. The EEDI reference lines formulated by Denmark and the Netherlands were compared with those of Bangladesh to see the comparative results for cargo ships and oil tankers (Simic 2014; Krikkle and Annik 2011).
Figures 7 and 8 show a comparison between various countries' inland vessel EEDI reference lines for cargo vessels and oil tankers. The EEDI reference lines for cargo vessels and oil tankers of Bangladesh are much higher than those of Denmark and the Netherlands. Moreover, the difference becomes narrow for both cases as capacity increases, that is, a higher capacity ship is more energy efficient than a lower capacity ship according to the data in Figures 7 and 8. For example, the required EEDI value for a 1000 DWT oil tanker designed for Denmark, the Netherlands, and Bangladesh should be 48.88, whereas for 44.09 and 57.56 g CO2/ton mile, respectively.
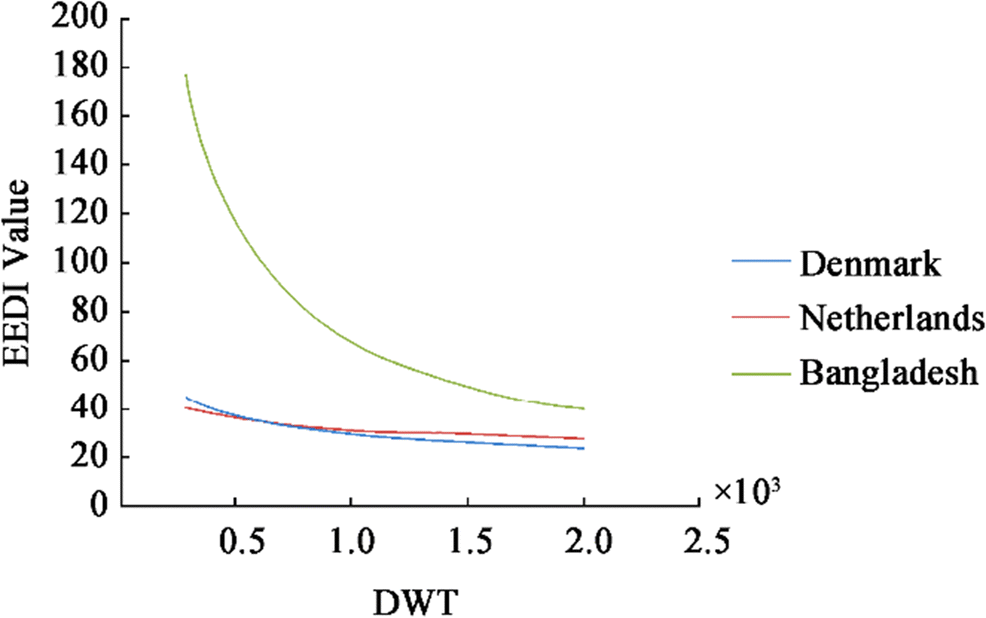 Figure 7 Various countries' inland vessel EEDI reference lines for cargo vessels
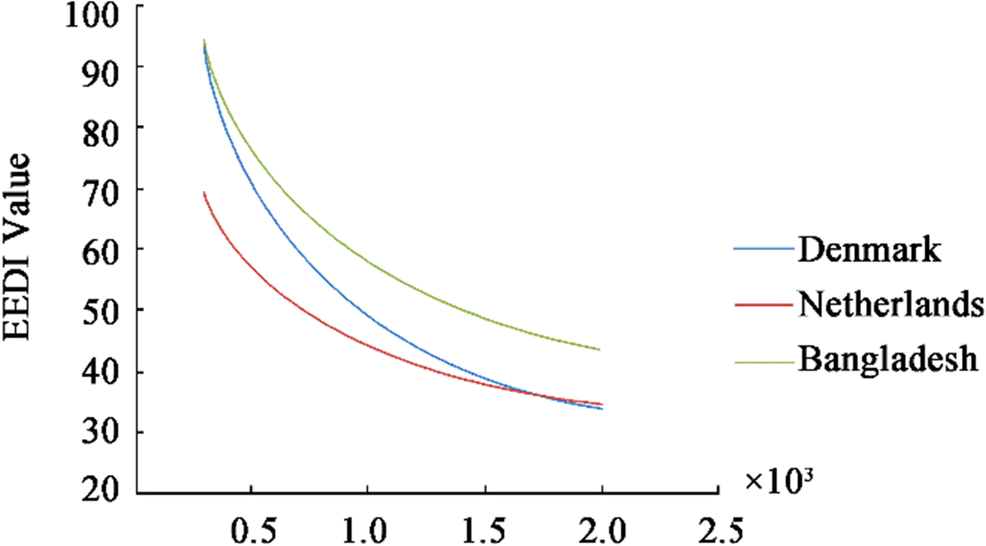 Figure 8 Various countries inland vessel EEDI reference lines for oil tankers
5 Present Status of Inland Vessels of Bangladesh with Respect to EEDI
The previous section confirmed that the EEDI value of Bangladesh has poorer performance than that of other countries. Inland waterways are an important medium for the transportation system of Bangladesh, and more than 10 000 inland vessels ply the waterways, yet the energy efficiency of these vessels remains unregulated. Thus, the overall performance of existing vessels in terms of the formulated EEDI value would be interesting to see. The EEDI reference value will be more stringent in the coming years. Thus, the performance of these vessels in terms of EEDI for phases 2 and 3 was assessed to derive a clear picture of the inland fleet of Bangladesh in case such stringent rule will be enforced in the near future.
5.1 Present Status of EEDI with Respect to Vessel's Length
Figure 9 shows the present status of EEDI with respect to cargo vessels' length. The length of most inland cargo vessels length in Bangladesh is between 51 and 55 m. A total of 262 vessels have a length within this range, and 85 vessels meet the required EEDI, which is 32.5% of the total vessels in that range, and the rest of the vessels exceed the required EEDI value in phase 1. As the phase progresses, more vessels exceed the required EEDI value. Moreover, longer vessels have an EEDI below the reference line. That means longer vessels are more efficient in terms of EEDI.
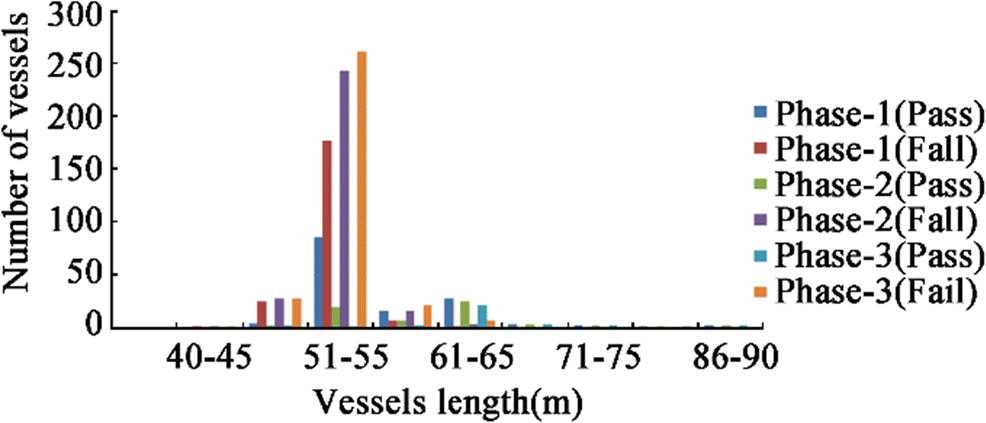 Figure 9 Present status of EEDI with respect to cargo vessel's length
Figure 10 shows the present status of EEDI with respect to oil tankers' length. The length of most of the inland oil tankers length in Bangladesh is between 31 and 50 m. In this range, around 50% of the total vessels have satisfactory EEDI and the rest of the vessels exceed the required EEDI value in phase 1. As the phase progresses, more vessels exceed the required EEDI value. Most of the vessels with a length between 51 and 60 m exceed the reference line. Only those vessels whose length ranges between 61 and 80 m meet the EEDI reference line.
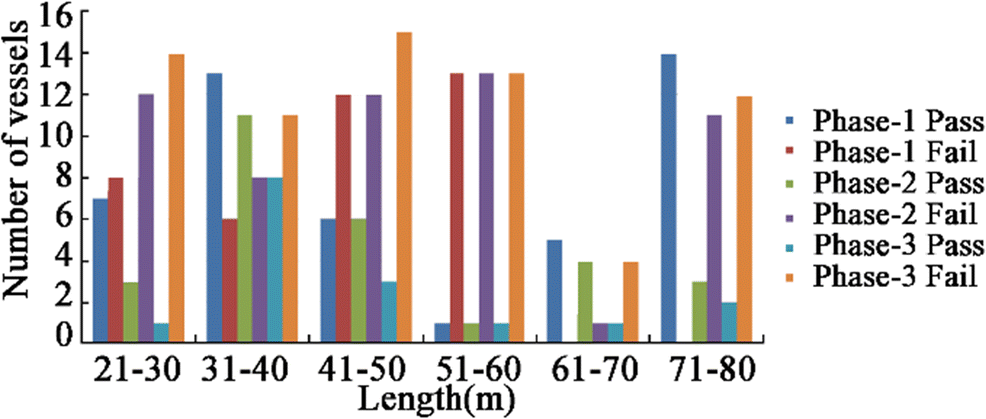 Figure 10 Present status of EEDI with respect to oil tankers length
Figure 11 shows the present status of EEDI with respect to passenger vessel's length. Most of the inland passenger vessels in Bangladesh have a length between 41 and 60 m. Sixty-nine vessels have a length in this range, and 42 of them meet the required EEDI which is 60.8% of the total vessels in that range. And the EEDI of the rest of the vessels exceeds the required value in phase 1. The EEDI of longer vessels lies below the reference line. However, among vessels whose length ranges between 71 and 90 m, only one vessel which meets the EEDI reference line.
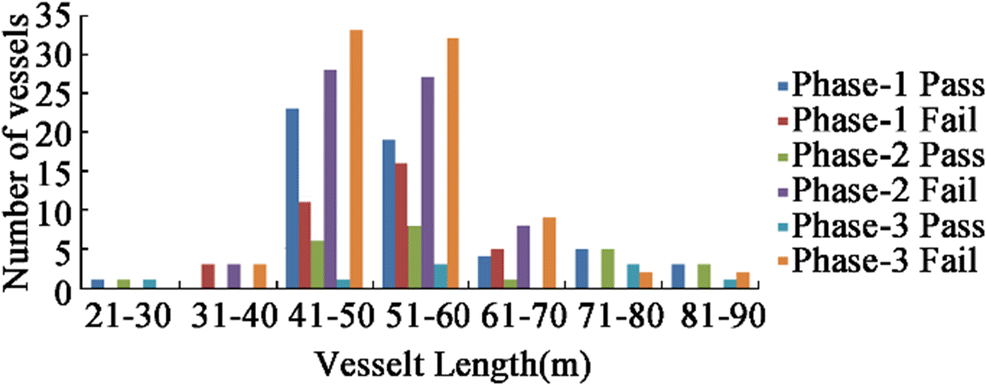 Figure 11 Present status on EEDI with respect to length of passenger vessels
Figure 12 shows the present status of EEDI with respect to the length of passenger ferries. The EEDI of almost all inland passenger ferries in Bangladesh lies above the reference line, thus showing the worst performance in terms of EEDI values.
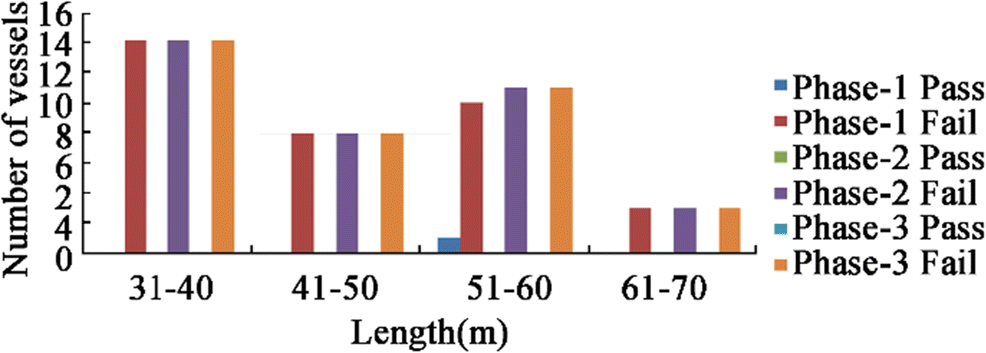 Figure 12 Present status on EEDI with respect to passenger ferries' length
Figure 13 shows the present status of EEDI with respect to sand carrier vessels' length. Most of the inland sand carriers in Bangladesh have a length between 31 and 35 m. Presently, 1729 vessels are within this range and 860 vessels meet the required EEDI which is 49.7% of the total vessels in that range and the EEDI of the rest of the vessels exceed the required value in phase 1. The EEDI of longer vessels lies below the reference line.
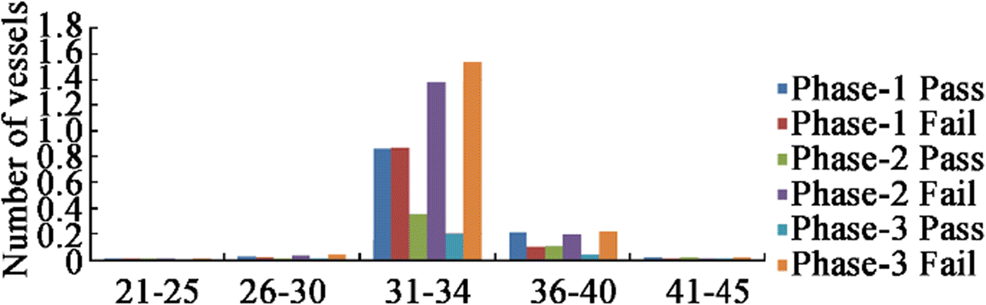 Figure 13 Present status on EEDI with respect to sand carriers' length
Overall, Figures 9, 10, 11, 12, and 13 show that with respect to vessel's length, in phase 1, 40% of the vessels passed in terms of EEDI and 60% of the vessels failed. In phase 2, 17% vessels passed in terms of EEDI and 83% of the vessels failed. In phase 3, 9% of the vessels passed and 91% of the vessels failed.
6 Causes of Poor Performance and Some Remedial Measures
This study confirmed that more than 60% of the vessels failed to meet the required EEDI reference line, thus indicating the poor efficiency of inland vessels in terms of CO2 emission. At present, no regulatory framework exists and designers do not consider EEDI when designing inland vessels. Some case studies show that the generally classed vessels registered for plying in inland routes in Bangladesh do not fulfill EEDI requirements (Rahman 2017).
In the case of Bangladesh, improving the poor EEDI index for existing ships is difficult. The causes of this poor EEDI performance for existing vessels are given below:
– Existence of a high number of indigenous designed ships that have poor performance
– Low L/B ratio
– Low procurement cost main engine which has a relatively high SFC
– Poor propulsion systems
– Relatively high power main engine due to draft restrictions
– Increased hull weight due to the use of scrap steel for construction which is a weakness of these ships compared with more efficient designs.
– Lack of awareness of current rules and regulations regarding energy efficient vessels
Generally, EEDI requirements can be improved or meet through two options, either technical or operational. Technically, reductions potential at the individual measure level can be grouped under five main categories: constructive hull design, power and propulsion, alternative fuels, alternative energy sources, and operations (Evert et al. 2017). From the operational perspective, EEDI requirement could be met by energy optimal operation through adapting voyage optimization, improving logistics and by reducing speed. No single measure alone is sufficient to achieve considerable sector-wide reductions. A significant emission reduction of over 75% can be achieved by swift adoption and combination of a large number of individual dependent and independent measures (Evert et al. 2017).
In case of improving EEDI efficiency for existing ships in Bangladesh, due to the social and economic factors, there is a tendency to construct inland ship by using low-cost materials which can save up to 30%–40% of total construction cost (Zakaria et al. 2012). According to inland shipping ordinance in Bangladesh, scrap plate and structural members collected from scrap ships can be used, and in that case, scantlings of plates needs to be increased by 25% (Julfiqar 2009). When vessels are designed for coastal route trade, scantlings of the plate need to be increased by another 20%. For structural members, when using scrap or old materials, sectional modulus must be increased by 20% and by another 20% for costal route vessels. For local standard shipbuilding, using scrap plates may be economical for the ship owner, but it increases the weight of the ship substantially which ultimately affects the engine power and the fuel consumption. The sample calculation of inland shipping weigh estimation found that the use of scrap plate and structural member results in excess weight, which in turn increases fuel consumption, thereby resulting in the ship having to bear the burden of excessive fuel consumption throughout its lifetime. The field study also found that in addition to the use of scrap plates and structural members from scrap yards, there is a tendency to use other shipbuilding materials collected from scrap yards in Chittagong. Even many ship owners use casting propellers which is made from taking replica from other propeller without sufficient technical know-how. Constructing these types of propeller is cheaper than optimizing an existing one. However, the resultant propulsion system is not efficient, thereby requiring the use of a high power engine without considering the ship's fuel consumption. Therefore, improving of the energy efficiency index of existing and new inland vessels is challenging. Any measure that involves a high initial cost is difficult to implement. Without regulations regarding the energy efficient index, motivating or encouraging ship owners to adopt practices to improve fuel efficiency and become more environment friendly is difficult.
The sample case study of different types of existing vessels as shown in Table 2 indicates that maintaining a constant displacement may improve CO2 emission by adjusting the principal particulars of the vessels particularly by improving L/B ratios, lowering B/T ratios, refining the vessels, and reducing their speed. The power prediction calculation using Holtrop and Mennen's method found that increasing L/B ratios from 10% to 20%, improved the EEDI by only 2% to 10%. Considering the constraints of draft restriction of inland route and keeping the draft of the ship constant, lowering the B/T ratio by around 5% to 10%, it will improve the EEDI by 2.3% to 11%. Again, decreasing CB by around 5% to 10% will increase the EEDI by 8% to 28%, whereas reducing speed from 0.5 to 1.0 knot will improve the EEDI by 8.5% to 29%. This calculation of three different types of inland ships in Bangladesh confirms that speed is the most sensitive parameter that has the greatest impact on EEDI. For new ships, all the parameters can be considered for improving EEDI, but for existing unmodified ships, the scope of modifying principal particulars (e.g., length, breadth, depth) is challenging.
Table 2 Particulars of different types of inland shipsType L/B B/T CB Displacement (ton) EEDI (attained) Tanker 6.10 2.50 0.857 4086 36.35 Cargo 4.86 3.94 0.857 3559 23.09 Passenger 5.97 7.65 0.85 1220 25.32 Moreover, most of the inland standard ships of different types use high-speed low-cost engines, with the fuel consumption for new engines being relatively high. As the engine ages, the fuel consumption of the engine increases further, thereby affecting the EEDI performance in the long run. An engine with relatively low fuel consumption should be chosen which would in turn improve EEDI performance will considerably (Rahman 2017).
The data collection regarding awareness of recent EEDI regulations for international shipping found that some ship designers are not aware that stringent regulations regarding improvement of CO2 emission for ships came into force in 2013, which will have a serious impact on the selection of hull and machineries in future ship design (Rahman 2017).
Among of all the measures, reducing ship speed can be a good option for existing vessels in Bangladesh because it does not require any additional cost or any investment for improving technological development. Other options that may be suitable for inland vessels on a limited scale are the use of renewable energy sources or switching to LNG fuel. However, both options are technically and economically challenging because they involve costs. A case study of existing different types of inland ships found that switching from diesel oil to LNG could improve the EEDI from 12.5% to 18.5% in terms of EEDI (Rahman 2017). In reducing speed, an important detail to note is that inland vessels' already have a low speed, mostly in the range of 8–10 knots. Thus, without strong motivation or adopting some mechanism from regulatory point of view, there is little chance that their speed could be further reduced. A detail that is worth to mentioning here is that many of the ships are already very old. Thus, phasing out all old ships phase by phase by adopting policy guidelines could be a possible alternative. Guidelines for new ships will be added in the near future, thereby ensuring their energy efficiency. Accordingly, some guidelines/regulations have to be prepared and enforced in the future to ensure the construction and use of energy efficient ships in Bangladesh.
7 Conclusions
This study conducted an assessment based on the formulated reference line for inland shipping in Bangladesh to provide better insight regarding the status of CO2 emissions in terms of EEDI for existing operating vessels in Bangladesh. The following conclusions can be made on the basis of this study:
• The EEDI introduced by the IMO for evaluating the energy efficiency of sea going vessels cannot be used to properly evaluate the energy efficiency of inland vessels; the developed EEDI can be used to calculate required EEDI value for different types of inland vessels in Bangladesh.
• A comparison between the formulated EEDI baseline equations for Bangladesh with those of other countries such as Denmark and the Netherlands showed that the EEDI for Bangladesh is much higher than that of other countries.
• An investigation of the developed database of inland vessels found that most of the inland vessels in Bangladesh use higher main engine power than the required power found from the calculation. This arbitrary engine selection leads to higher EEDI value. Thus, inland shipping contributes to the release of a relatively higher amount of CO2 to the environment. Passenger ferries have the worst performance in terms of CO2 emission.
• The use of second hand materials increases the weight of the main hull of the ship and thus increases power requirements fuel consumption. This practice should be discouraged for more energy efficient ship.
• The EEDI is particularly sensitive to service speed as the required power increases by roughly the cube of the variation in service speed. Thus, reducing service speed is the only viable option to improve EEDI for existing ship in Bangladesh from an environmental point of view. However, selecting the optimum propeller may have significant impact.
• The work in this paper could provide more insight on emissions and energy efficiency in the inland shipping of Bangladesh and could be useful for policy makers in assisting the industry to determine cost-effective solutions or develop regulations to reduce the CO2 emission from inland shipping in Bangladesh.
-
Figure 1 EEDI reference line for inland cargo vessels in Bangladesh
Figure 2 EEDI reference line for inland oil tankers in Bangladesh
Figure 3 EEDI reference line for inland passenger vessels in Bangladesh
Figure 4 EEDI reference line for inland passenger ferries in Bangladesh
Figure 5 EEDI reference line for inland sand carriers in Bangladesh
Figure 6 Phase wise EEDI reference lines for inland cargo vessels
Figure 7 Various countries' inland vessel EEDI reference lines for cargo vessels
Figure 8 Various countries inland vessel EEDI reference lines for oil tankers
Figure 9 Present status of EEDI with respect to cargo vessel's length
Figure 10 Present status of EEDI with respect to oil tankers length
Figure 11 Present status on EEDI with respect to length of passenger vessels
Figure 12 Present status on EEDI with respect to passenger ferries' length
Figure 13 Present status on EEDI with respect to sand carriers' length
Table 1 Reference line parameter value for different types of inland vessels
Ship type Parameters R2 a b c Population Excluded General cargo vessel 15 931 DWT 0.789 0.2615 351 16 Oil tanker 950.93 DWT 0.406 0.4132 85 5 Passenger vessel 42 477 GT 1.1015 0.6806 90 13 Passenger ferry 9 × 10⁷ GT 2.204 0.7914 36 2 Sand carrier 2261.7 DWT 0.595 0.2592 2095 18 Table 2 Particulars of different types of inland ships
Type L/B B/T CB Displacement (ton) EEDI (attained) Tanker 6.10 2.50 0.857 4086 36.35 Cargo 4.86 3.94 0.857 3559 23.09 Passenger 5.97 7.65 0.85 1220 25.32 -
Borkowski T, Kasyk L, Kowalak P (2012) Energy efficiency design index of container vessel - operational approach. Journal of KONES Powertrain and Transport 19(4) Evert AB, Elizabeth L, Agathe IR and Anders HT (2017) State-of-the- art technologies, measures and potential for reducing GHG from shipping', Transportation research part D: transport and environment Volume 52, Part A, May 2017, Pages 408–421 Frouws K (2016) Is reducing speed the right mitigating action to limit harmful emissions of sea going RoRo cargo carriers? Journal of Shipping and Trade 1. https://doi.org/10.1186/s41072-016-0014-2 Hasan R (2011) Impact of EEDI on ship design and hydrodynamics, M. Sc Thesis, Chalmers University of Technology, Sweden IMO (2014) Guidelines of the method of calculation of the attained energy efficiency design index for new ships, Resolution MEPC. 245(66) Jain K (2012), Impacts of energy efficiency design index, M. Sc. Thesis, Newcastle University Julfiqar MU (2009) The inland shipping laws and rules. Per capita income rises to $1466, http://www.thedailystar.net/frontpage/capita-income-rises-1466-1204930, accessed on Oct 24, 2017 Kaosar R (2015) Evaluation of environmental pollution in Bangladesh by inland shipping operation, M. Sc. Engg. Thesis. Department of Naval Architecture and Marine Engineering, BUET, April 2015 Krikkle M, Annik D (2011) Analysis of the effect of the new EEDI requirements on Dutch build and flagged ships, CMTI Rahman SM (2017) Development of energy efficiency design index (EEDI) for inland vessels in Bangladesh. M. Sc. Engg. Thesis submitted to the Department of Naval Architecture and Marine Engineering, BUET Rehmatulla N, Calleya J, Smith T (2017) The implementation of technical energy efficiency and CO2 emission reduction measures in shipping. J Ocean Eng 139: 184–197 https://doi.org/10.1016/j.oceaneng.2017.04.029 Simic A (2014) Energy efficiency of inland waterway self-propelled cargo ships, Conference on Influence of EEDI on Ship Design, London, UK Tran T (2015) Calculation and assessing the EEDI index in the field of ship energy efficiency for M/V Jules Garnier. Journal of Marine Science: Research & Development 06. https://doi.org/10.4172/2155-9910.1000212 Vladimir N, Ancic I, Sestan A (2015) Effect of ship size on EEDI requirements for large container ships. J Mar Sci Technol: 017–0453 Zakaria NMG, Ali MT, Hossian KA (2012) Underlying problems of sip recycling industries in Bangladesh and way forward. Published in Journal of Naval Architecture and Marine Engineering (JNAME) 9(2)