Experimental Research of Hull Vibration of a Full-Scale River Icebreaker
https://doi.org/10.1007/s11804-020-00137-3
-
Abstract
A series of tests of a full-scale river icebreaker was conducted to investigate the characteristics of ice-induced hull vibration. The test was conducted when the river icebreaker was operating in an ice-covered river at temperatures of − 4 to 0 ℃ with ice thicknesses of 300 to 400 mm. In the tests, the ice condition and icebreaker speed were chosen as the main influence factors. By analyzing the measured test data, we identified some important points regarding ice-induced hull vibration. When the river icebreaker navigates in an area with complete ice coverage, the peak value of the acceleration amplitude spectrum is highest. Also, the vibration response excited by the icebreaking load in an area with complete ice coverage exhibits more frequencies. With an increase in icebreaker speed, the vibration acceleration response gradually increases. However, habitability of the bow region on the main and driving decks is maintained due to the harmless vibration levels. In addition, the icebreaking operation of the river icebreaker causes violent local vibration of the grillage on the main deck.Article Highlights• The experimental test of ice-induced vibration of a full-scale river icebreaker was conducted.• Acceleration time-domain curves and amplitude spectra of test points on the driving deck and main deck are demonstrated and investigated.• A numerical simulation of the local grillage is performed using commercial FEA software ABAQUS to research the appearance of peak value. -
1 Introduction
With global warming and the growing interest in Arctic shipping (Zhang et al. 2017, 2019), more and more research is being conducted on ice and its interaction with ship hulls. Limited by the experimental environment, most model experiments are conducted in ice basins. Sopper et al. (Sopper et al. 2017) performed a series of ice-crushing experiments inside a cold room to investigate the effects of the external boundary condition and indenter contact geometry on the ice load in crushing conditions. Zhou et al. (2017, 2018) performed a series of tests in a multifunctional ice basin using a model-scale ship to investigate the ice-loading process. The ship model was towed through two different ice sheets at three drift speeds. The aim was to propose a new method for decomposing into different ice components the total ice forces measured in the model tests. Liu et al. (2011) analyzed ship–iceberg collisions based on the continuum mechanics modeling of both bodies. The evolution of contact pressure and the distribution of damage to the foreship were studied comprehensively. Song et al. (2007) conducted model tests in a towing tank to compare icebreaker resistance in pack-ice conditions of refrigerated and synthetic ice.
A number of experiments on full-scale icebreakers have also been conducted.
Edwards et al. (1972) designed an experiment to obtain data on the resistance and loads exerted on an icebreaker's hull during the interaction between the ice and hull. The experiment compared the ice resistances of a 1/48th scale model and a full-scale lakes icebreaker. Kim et al. (2011) described the test procedures of the icebreaking performance of an icebreaking research vessel and presented data gathered from an icebreaking performance test. A series of full-scale ice tests of a multi-purpose icebreaker was conducted in the northernmost Baltic. Riska et al. (2001) recorded the test results and operational characteristics of the vessel. Suyuthi et al. (2011) measured the ship resistance on a full-scale KV Svalbard in the Barents Sea. Lastly, the authors determined the relationship between the ship resistance and ship speed on the basis of measurement data. Bekker et al. (2017) investigated the whole-body vibration level of a polar supply and research vessel when navigating in open and ice-infested polar waters. Noble et al. (1980) conducted a mathematical simulation and physical modeling of an icebreaker and found the results to match well. Belyashov et al. (2008) published ice field tests of a multi-purpose icebreaking vessel in the Kara Sea and discussed the relationship between speed and power in their paper.
Since vibration induces structural fatigue, the vibration characteristic of different structures has also attracted the attention of researchers (Li et al. 2017, Pang et al. 2017a, b, 2018). In addition, vibration of the hull structure inevitably results in passenger discomfort and abnormal working conditions of the ship instruments. Goodman (Goodman 1971) discussed a method for estimating the vibration deflections of large tankers in irregular waves. Jiao et al. (2015) evaluated the structural vibration response of large-ship hulls in extreme seas based on the three-dimensional nonlinear hydroelasticity theory. The authors also conducted experiments using a segmented self-propelled model in a tank for correlation with their computational results.
The abovementioned research has mainly addressed the interaction between ice and hulls. Constrained by the experimental conditions, much of this research was necessarily conducted through theoretical derivations and laboratory tests. Full-scale measurements of icebreakers have mainly focused on resistance data and operational characteristics. Few studies have been conducted on ice-induced vibration when the icebreaker is actually breaking ice.
In this paper, we present data measured during the operation of an icebreaker in an ice-infested river. In addition, we discuss the influences of ice condition and icebreaker speed on ice-induced hull vibration. When the icebreaker navigates in a complete ice coverage area, the peak value of the acceleration amplitude spectrum is greater than those of areas with concentrated drift ice and open areas with little ice. Also, the vibration response excited by the icebreaking load of a complete ice coverage area exhibits more frequencies than the other two ice conditions. We found the maximum peak value of the time-domain curve of the vibration acceleration to differ at different speeds. The acceleration amplitude spectra of an icebreaker traveling at different speeds also differ significantly, especially in the frequency domain between 125 and 250 Hz.
2 Experiment Procedure
This test was conducted in an ice-infested river at the beginning of March 2016. The temperature on that day ranged between − 4 and 0 ℃, and the ice thickness was between 250 and 300 mm. Figure 1 shows photos of the icebreaker as it was breaking ice.
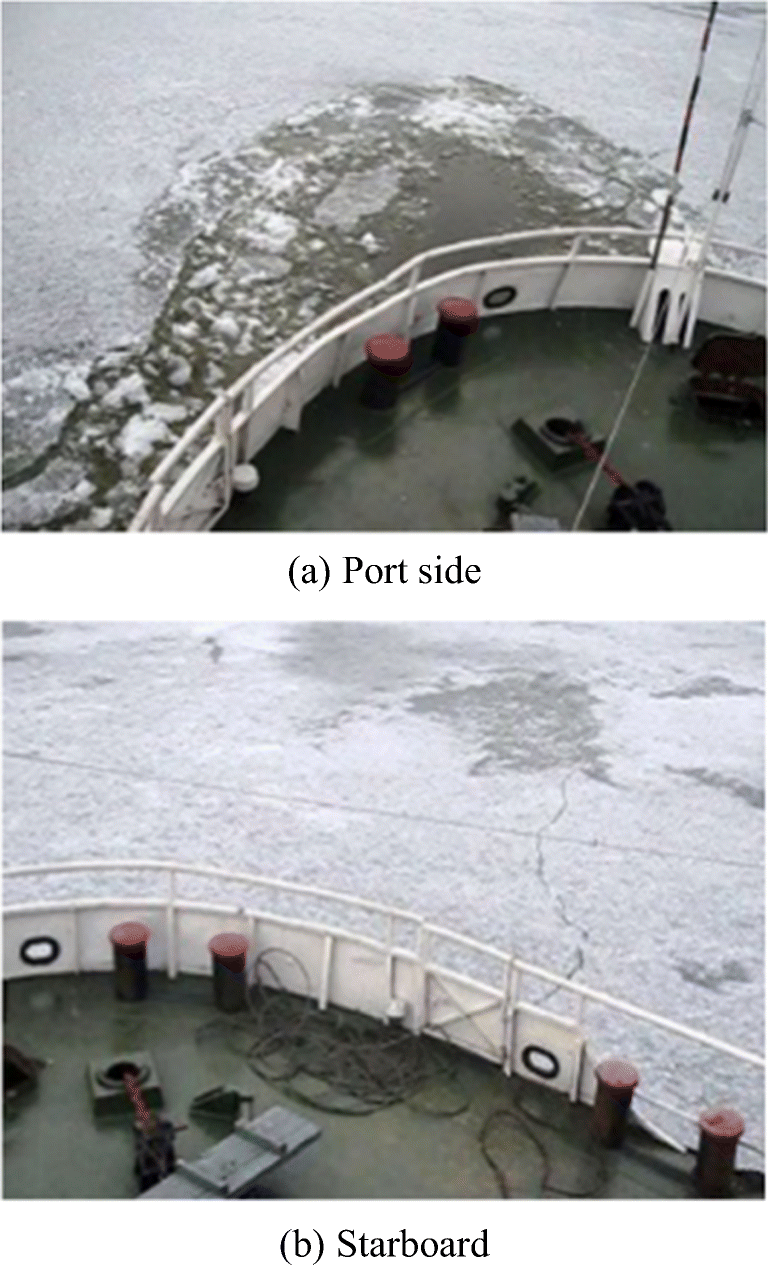 Figure 1 Photos of the icebreaker when breaking ice
The river icebreaker in this test uses a twin propeller and the main engine is a six-cylinder four-stroke diesel engine, the rated power is 136 kW, and the rated speed is 850 r/min. The four-blade propeller has a diameter of 1.327 m and a rated speed of 283 r/min. The hull has a transverse framework, with a frame space of 0.5 m. Table 1 lists the specifications of the river icebreaker.
Table 1 Specifications of the river icebreakerLength (m) 29.70 Length between perpendiculars (m) 28.00 Breadth (m) 7.00 Depth (m) 2.40 Draft (m) 1.15 Displacement weight (t) 145.0 Block coefficient CB 0.83 Maximum speed (kn) 12 Icebreakers mainly break ice in the collision or continuous mode depending on the ice situation. When breaking ice in the collision mode, the icebreaker crashes into the ice at a speed of about 8 kn. A single icebreaking distance in the collision mode is between half and two thirds the vessel length. When the first collision is finished, the icebreaker draws back by a distance of between two to three times the ship length. Then, a second collision point is chosen adjacent to the first collision point. On the third collision, the icebreaker crashes into the ice at the same point as the first collision. By repeating these three steps, a channel is opened that is between one half and two times the vessel breadth.
When the icebreaker breaks ice in the continuous mode, the ice layer is crushed by the weight of the bow and travels through the ice while relying on the thrust generated by the bow engine. Compared with the collision mode, the continuous mode shortens the icebreaking cycle. However, it is constrained by the power of the engine and displacement weight of the vessel, so the continuous mode is mainly used for thin ice sheets. Considering the ice thickness in this test, we chose the collision mode as the main icebreaking approach.
The instruments used in this test included a 16-channel portable dynamic signal-testing analyzer, 15 piezoelectric acceleration sensors, and two digital cameras. The portable dynamic signal-testing analyzer was used for vibration-signal acquisition and storage. When fully charged, this analyzer can be operated continuously for 4 h between temperatures of − 10 to 60 ℃. To ensure the accuracy and stability of the measured data, the sampling time was no less than 10 s for each test condition. The piezoelectric acceleration sensors were attached to the hull structure by a magnetic base. The sensitivity of these acceleration sensors is 100 mV/g and their effective sampling frequency is between 0.5 Hz and 7 kHz. The sampling frequency of the vibration acceleration signal in this test was set to 5 kHz.
Considering the complexity of the ice situation in the test of the river icebreaker, we placed two cameras at the bow and side of the icebreaker to record the interactions of the ice and hull structure. We set the portable dynamic signal-testing analyzer and cameras in synchronous mode to match the ice situation and vibration acceleration signal during the data processing procedure. Figure 2 shows the signal measurement and acquisition instruments used in the icebreaking test.
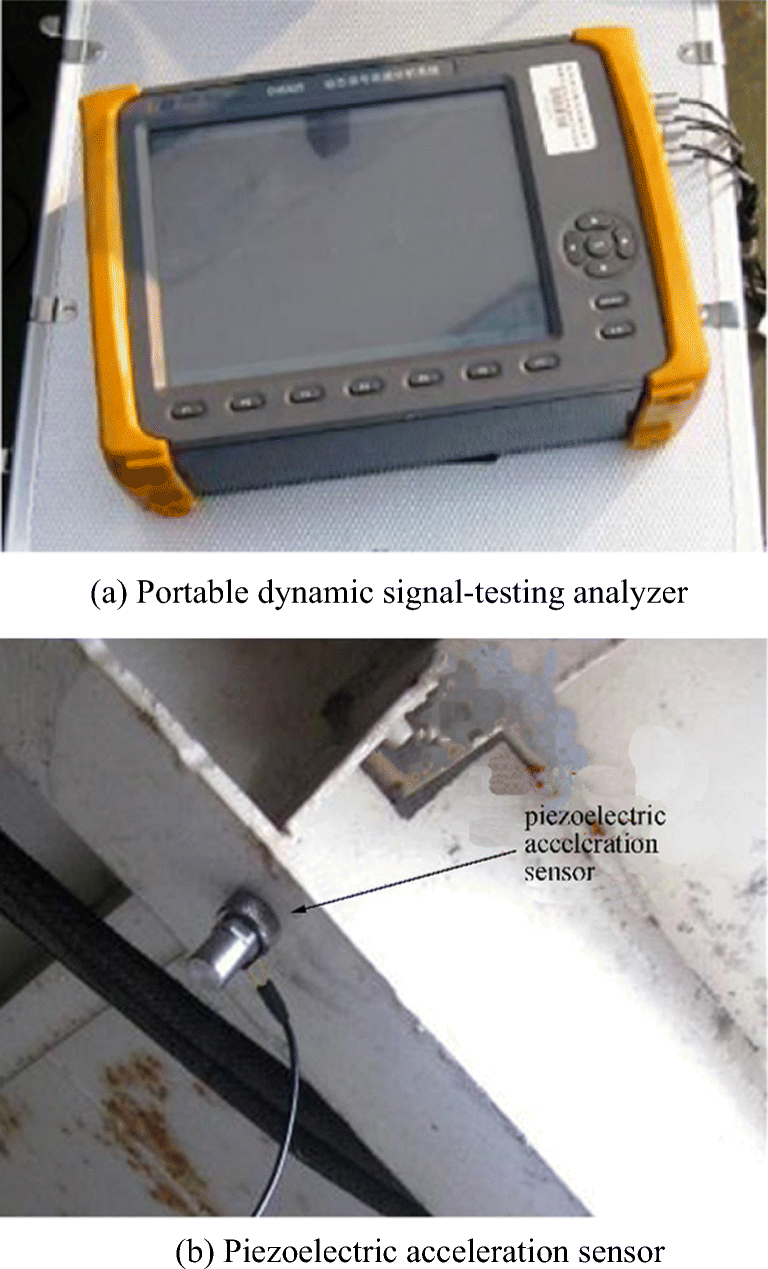 Figure 2 Signal measurement and acquisition test instruments
2.1 Ice Situation
When the river icebreaker was in operation, the interactions between the icebreaker and hull structure varied. Depending on the ice situation on the water surface, we categorized three typical ice conditions: areas with complete ice coverage, those with concentrated drift ice, and open areas with little ice. Table 2 shows the interaction between the icebreaker and ice layer in these three typical ice conditions.
Table 2 Typical ice conditionsThe interactions between icebreaker and ice layer in the test Description 
Complete ice coverage area (Condition 1) 
Concentrated drift ice area (Condition 2) 
Open area with little ice (Condition 3) The magnitude of the icebreaking load is related to the size and thickness of the ice layer, the strength of the ice, and the speed of the icebreaker. However, a random sampling of ice thickness in the testing zone revealed a range of between 250 and 300 mm. This difference is so small that we could not effectively divide ice areas by the thickness of the ice layer. Considering the randomness of the ice size and the interaction area of the ice and hull structure, in this test, we chose the concentration of floating ice and icebreaker speed as the main influence factors. Table 3 shows a summary of the test conditions of the icebreaker.
Table 3 Test conditions of the icebreakerSpeed of icebreaker (kn) 3–4 5–6 7–8 Test conditions Complete ice coverage area with the ice thickness of 250–300 mm (Condition) Concentrated drift ice area (Condition) Open area with little ice (Condition 3) The testing procedure was as follows: first, the icebreaker broke ice at different speeds in a complete ice coverage area. To avoid interference from floating ice produced by the first procedure, the vibration signal was acquired at the start of the interaction between the icebreaker's bow region and the complete ice coverage area. Then, the icebreaker navigated in the concentrated drift ice area at different velocities depending on the distribution of the floating ice. Lastly, when the icebreaking work was almost finished, the icebreaker traveled at different speeds through an open area with little ice. The portable dynamic signal-testing analyzer recorded the vibration acceleration signals obtained by the piezoelectric acceleration sensors.
2.2 Layout of Test Points
The acceleration sensors were mainly arranged on the main-deck bow area and the driving deck of the icebreaker. The panel center, bone cross, and vertical and horizontal bone intersections were chosen as three typical hull structure types. A summary of the placement of the piezoelectric acceleration sensors is as follows:
As shown in Figure 3, on the driving deck, the piezoelectric acceleration sensors were placed at intervals on the cross-point of the deck girder and beam, the middle of the beam between the girders, and at the center of the local plate.
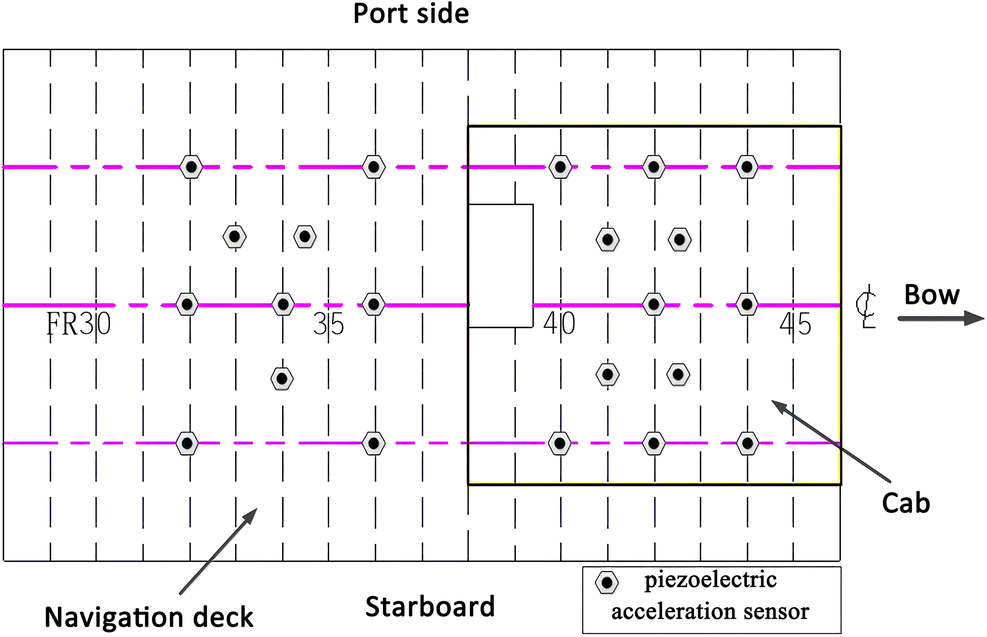 Figure 3 Test point layout on driving deck
Similar to the layout on the driving deck, on the bow area of the main deck, we placed the piezoelectric acceleration sensors as shown in Figure 4.
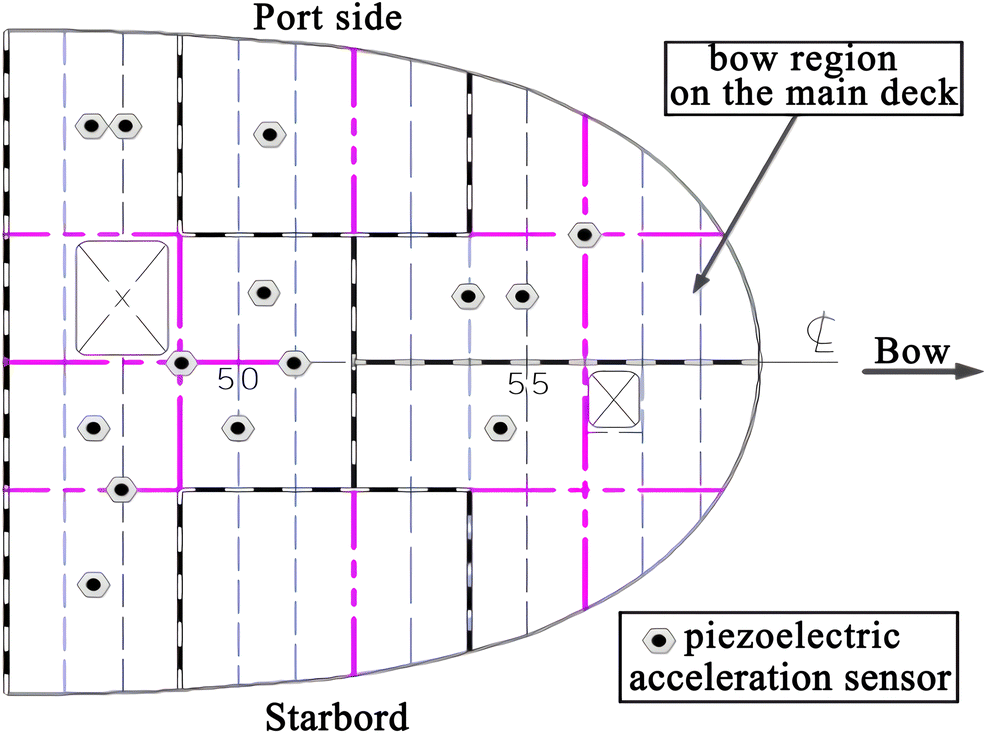 Figure 4 Test point layout of bow area on the main deck
2.3 Process of Dealing with Vibration Acceleration Signal
FFT is a common method for handling stationary signals; however, the vibration acceleration signal in this test was not a non-stationary random signal. As such, we combined wavelet noise reduction and short-time Fourier transform (STFT) to handle non-stationary random signals, a method whose effectiveness was verified in the experiments and simulations conducted by Hu et al. (Hu et al. 2014). We used the fixed time-window function g(t − τ) to intercept and deal with the objective function x(t) and performed the STFT with the local time-domain signal. By changing the starting time of the time-window function, we obtained a series of Fourier transform results with time, which were a collection of time–frequency results from the STFT. The formula is as follows:
$$ {G}_x\left(\omega, \tau \right)={\int}_{-\infty}^{\infty }x(t)g\left(t-\tau \right){\mathrm{e}}^{-\mathrm{i}\omega t}\mathrm{d}t $$ (1) where x(t) is the input signal at time t, ω is the frequency of the signal component, g(t − τ) is the time-window function, τ is the relative to the size of samples between successive discrete-time STFTs, e−iωt is the limited frequency function, and Gx(ω, τ) reflects the signal component in the frequency of ω at time τ.
In summary, the process used to deal with the vibration acceleration signal is as follows:
1) The data in the portable dynamic signal-testing analyzer were transferred to the computer.
2) By reviewing the video recording of the interaction of the ice and hull structure, we made a reasonable division of the vibration acceleration signals in the test.
3) By extracting the mean, filtering, and performing STFT, we obtained the amplitude spectrum of the vibration acceleration signal for different test periods.
As sectional treatment of the time-domain signal in the FT process was inevitable, signal-energy leakage occurred in the frequency domain. We used a Hamming window to compensate for the energy leakage when handling the time-domain signal, as reported by Chen et al. (2010).
3 Results and Discussion
When the river icebreaker navigated at a speed of 3–4 kn in the three typical ice conditions, i.e., complete ice coverage area, concentrated drift ice area, and open area with little ice, we used the vibration acceleration signals of the test points on the driving deck as the research objects to study the influence of ice concentration on ice-induced vibration. Afterwards, the river icebreaker was navigated in the complete ice coverage area at different speeds. We selected the vibration acceleration signals of the test points on the main deck as research objects to study the influence of icebreaker speed on ice-induced vibration.
3.1 Influence of Ice Concentration
As test points, we selected the center of the local plate, the middle of the beam between the girders, and the cross-point of the deck girder and beam on the driving deck. Table 4 describes the locations of the test points on the driving deck.
Table 4 Locations of three typical test points on the driving deckNumber Location Description of test points Longitudinal Lateral 1 FR42 + 250 mm Distance to centerline + 675 mm Center of local plate 2 FR41 Distance to centerline + 675 mm Middle of beam between girders 3 FR42 Centerline Cross-point of deck girder and beam 3.1.1 Center of Local Plate
Figure 5 shows the acceleration time-domain curve of the center of the local plate on the driving deck. It is clear that when the river icebreaker was operating in the complete ice coverage area, the vibration response was non-stationary. The vibration response increased significantly at 0.5 s due to the effect of the icebreaking load. However, due to the icebreaker's structural damping, the vibration response lasted just 0.25 s before weakening. When the river icebreaker navigated in the concentrated drift ice area, the maximum acceleration response was less than that of the complete ice coverage area. Furthermore, the change in the vibration acceleration amplitude in the concentrated drift ice area was slower than that of the former area. Lastly, when the river icebreaker navigated in an open area with little ice, the vibration acceleration amplitude did not change significantly, and the maximum acceleration response was smaller than those of the other conditions.
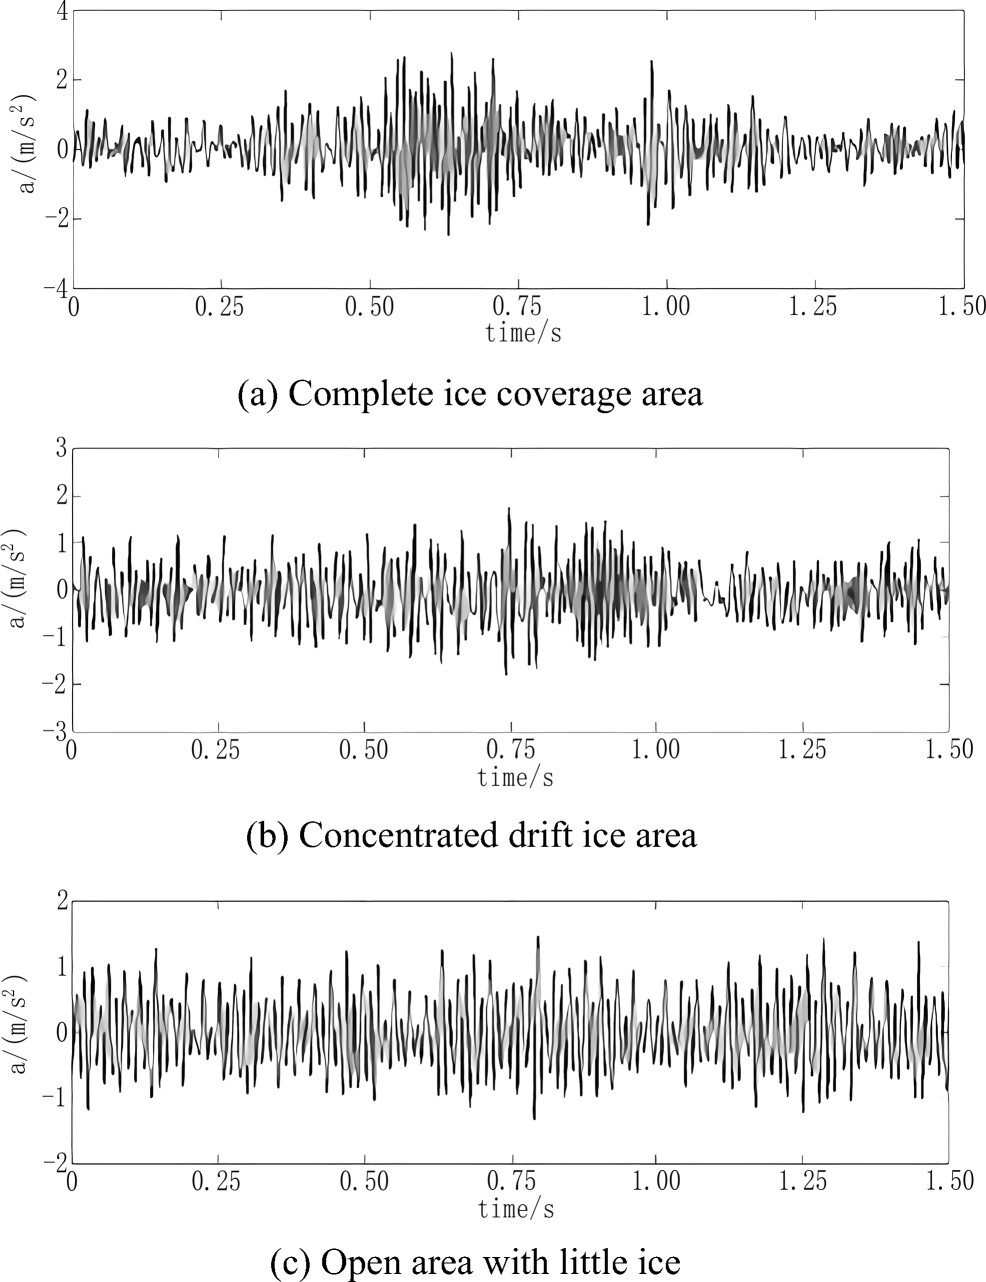 Figure 5 Acceleration time-domain curves of the center of local plate on the driving deck
Figure 6 shows the acceleration amplitude spectrum of the center of the local plate on the driving deck. When the river icebreaker navigated in an open area with little ice, the number of peaks was least, and the peak value of the acceleration amplitude spectrum was smaller than those of the other two ice conditions. Regarding the ice loads in complete ice coverage and concentrated drift ice areas, the peak value of the acceleration amplitude spectrum increased greatly. In addition, some new peaks appeared in other frequencies, as shown below in Table 5.
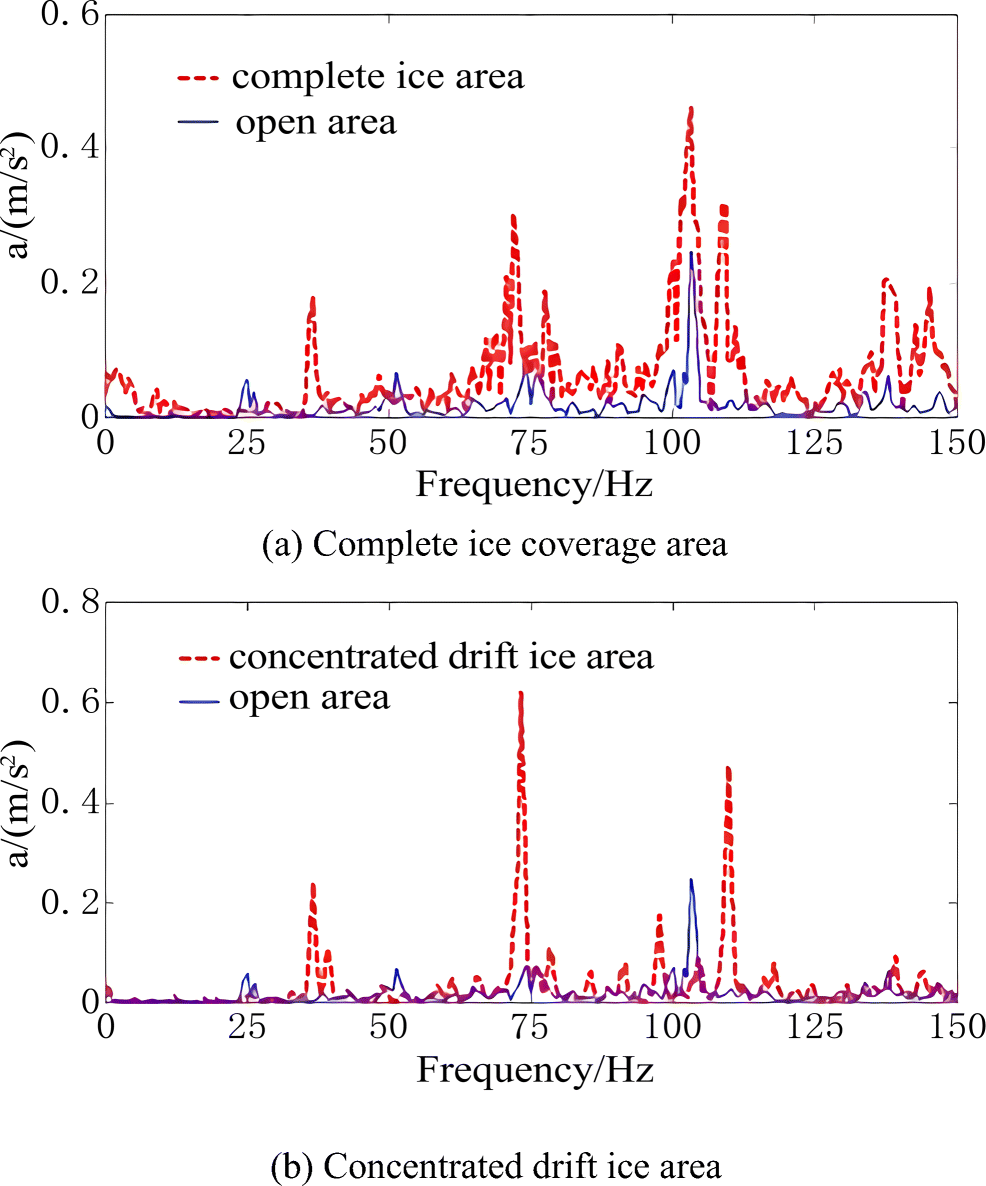 Figure 6 Acceleration amplitude spectra of the center of local plate on the driving deckTable 5 Peak values of vibration acceleration response at the center of the local plate on the driving deck
Open area with little ice Frequency (Hz) 25 51.2 73.8 103.1 137.9 Acceleration (m/s2) 0.057 0.067 0.070 0.248 0.063 Concentrated drift ice area Frequency (Hz) 36.6 72.1 109.9 137.9 Acceleration (m/s2) 0.178 0.621 0.462 0.204 Complete ice coverage area Frequency (Hz) 36.6 73.2 103.1 139.2 Acceleration (m/s2) 0.240 0.311 0.471 0.092 A special observation was made regarding the complete ice coverage and concentrated drift ice areas, whereby the maximum peak value did not increase greatly when the icebreaker navigated in the complete ice coverage area. At a frequency of 73 Hz, the peak value of the complete ice coverage area was 0.31 m/s2, which is even less than that of the concentrated drift ice area.
Compared with the concentrated drift ice area, more peaks appeared in the complete ice coverage area, especially in the frequency domain below 25 Hz and above 125 Hz. Only three obvious and relatively isolated peaks appeared between 25 Hz and 125 Hz when the icebreaker navigated in a concentrated drift ice area. The complete ice coverage area more readily induced vibration in the hull structure.
3.1.2 Middle of the Beam between Girders
Figure 7 shows the acceleration time-domain curve at the middle of the beam between the girders on the driving deck. Compared with the strongly random non-stationary vibration response of the complete ice coverage area, the vibration response of an open area with little ice is more regular. Also, the acceleration magnitude of the complete ice coverage area is obviously larger than those of the other two conditions.
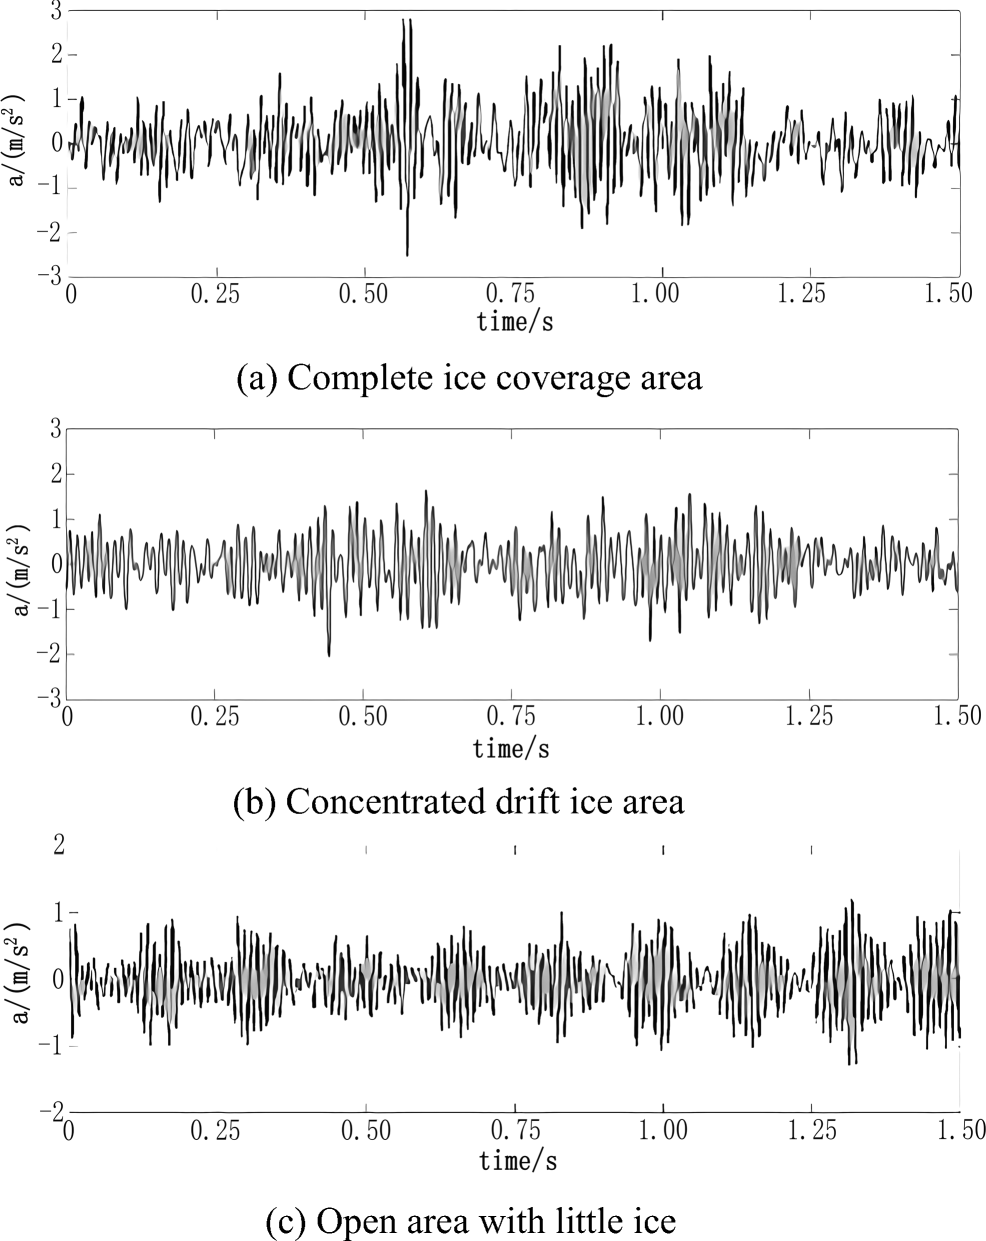 Figure 7 Acceleration time-domain curves of the middle of the beam between girders on the driving deck
The vibration response increased significantly in response to the icebreaking load, and then weakened soon after. When the river icebreaker navigated in the concentrated drift ice area, the change in the vibration acceleration was slower than that of the complete ice coverage area and the acceleration value was lower. Finally, when the river icebreaker navigated in an open area with little ice, the time-domain curve of the vibration acceleration was more regular than that of the other two conditions. The response value when navigating in an open area with little ice was also the smallest of the three ice conditions.
Figure 8 shows the acceleration amplitude spectrum at the middle of the beam between the girders on the driving deck. Similar to the center of the local plate, the vibration acceleration response at this location increased greatly when the river icebreaker navigated in complete ice coverage and concentrated drift ice areas, whereas the peak value of the acceleration amplitude spectrum at the middle of the beam is obviously smaller than that at the center of the local plate.
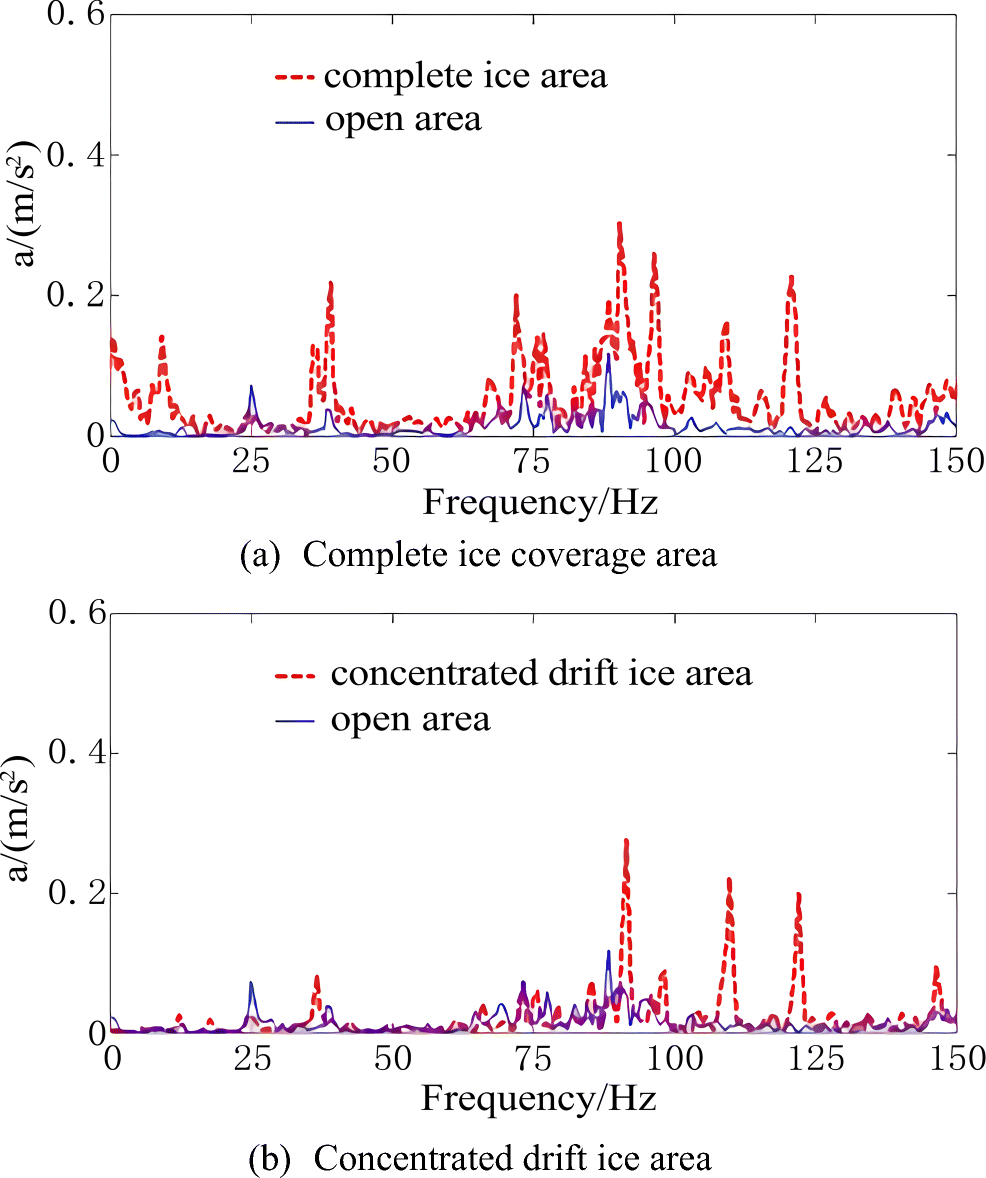 Figure 8 Acceleration amplitude spectra of middle of beam between girders on the driving deck
The maximum values of the vibration acceleration spectra differ slightly for the complete ice coverage and concentrated drift ice areas for the test point at the middle of the beam between the girders.
Table 6 lists the peak values of the vibration acceleration response at the middle of the beam between the girders on the driving deck. Compared with the concentrated drift ice area, more peaks appear in the complete ice coverage area, especially in the frequency domain between 0 and 75 Hz. Also, the peak value of the acceleration spectrum is more isolated when the river icebreaker was navigating in a concentrated drift ice area than in a complete ice coverage area. The vibration response excited by the icebreaking load of a complete ice coverage area exhibited more frequencies and a higher peak value.
Table 6 Peak values of vibration acceleration response of the middle of the beam between girders on the driving deckOpen area with little ice Frequency (Hz) 38.4 73.2 89.7 – – Acceleration (m/s2) 0.038 0.075 0.121 – – Concentrated drift ice area Frequency (Hz) 36.6 73.2 91.5 109.9 122.1 Acceleration (m/s2) 0.080 0.074 0.282 0.223 0.204 Complete ice coverage area Frequency (Hz) 39.1 72.1 90.3 109.3 120.8 Acceleration (m/s2) 0.218 0.201 0.310 0.165 0.092 3.1.3 Cross-Point of Deck Girder and Beam
The acceleration time-domain curve of the cross-point of the deck girder and beam for the three different ice conditions (i.e., complete ice coverage, concentrated ice, and open area with little ice) are as follows:
Figure 9 shows the acceleration time-domain curve of the cross-point of the deck girder and beam on the driving deck. Compared with the regular acceleration time-domain curve in an open area with little ice, the non-stationary vibration response of the complete ice coverage area is strongly random. Also, the acceleration magnitude of the complete ice coverage area increases greatly. When the river icebreaker navigated in the concentrated drift ice area, the peak value of the acceleration was smaller than that of the complete ice coverage area. In an open area with little ice, the peak value of acceleration is the least.
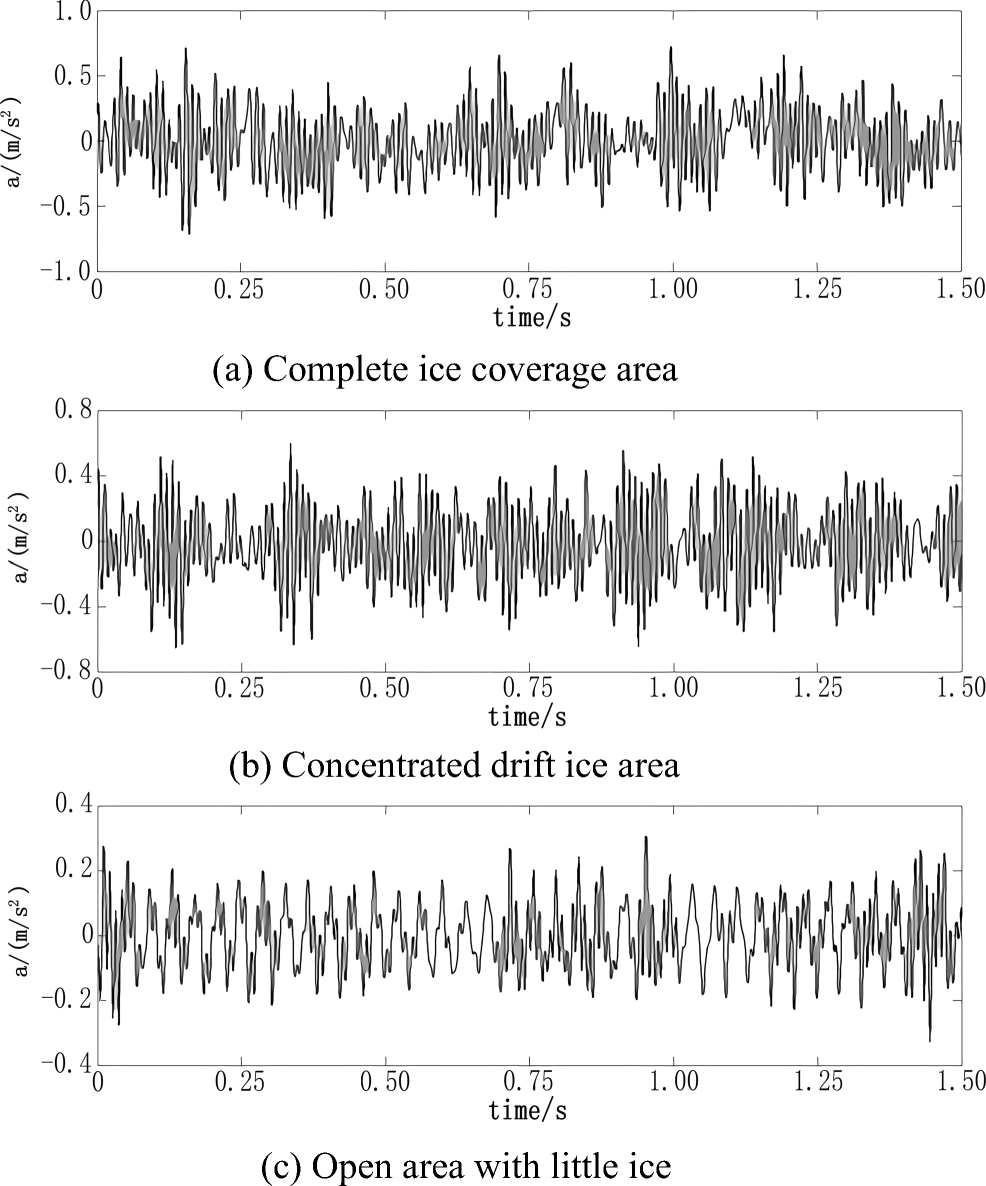 Figure 9 Acceleration time-domain curves of the cross-point of deck girder and beam on the driving deck
Figure 10 shows the acceleration amplitude spectrum at the cross-point of the deck girder and beam on the driving deck. When the river icebreaker navigated in a complete ice coverage area, the acceleration response of the vibration spectrum increased greatly, especially in the frequency domain between 80–110 Hz and 160–200 Hz. Table 7 lists the maximum vibration acceleration responses at the cross-point of the deck girder and beam on the driving deck. Unlike the two test points mentioned earlier, the maximum vibration acceleration response values for the cross-point of the deck girder and beam on the driving deck in different ice conditions are distinctly different.
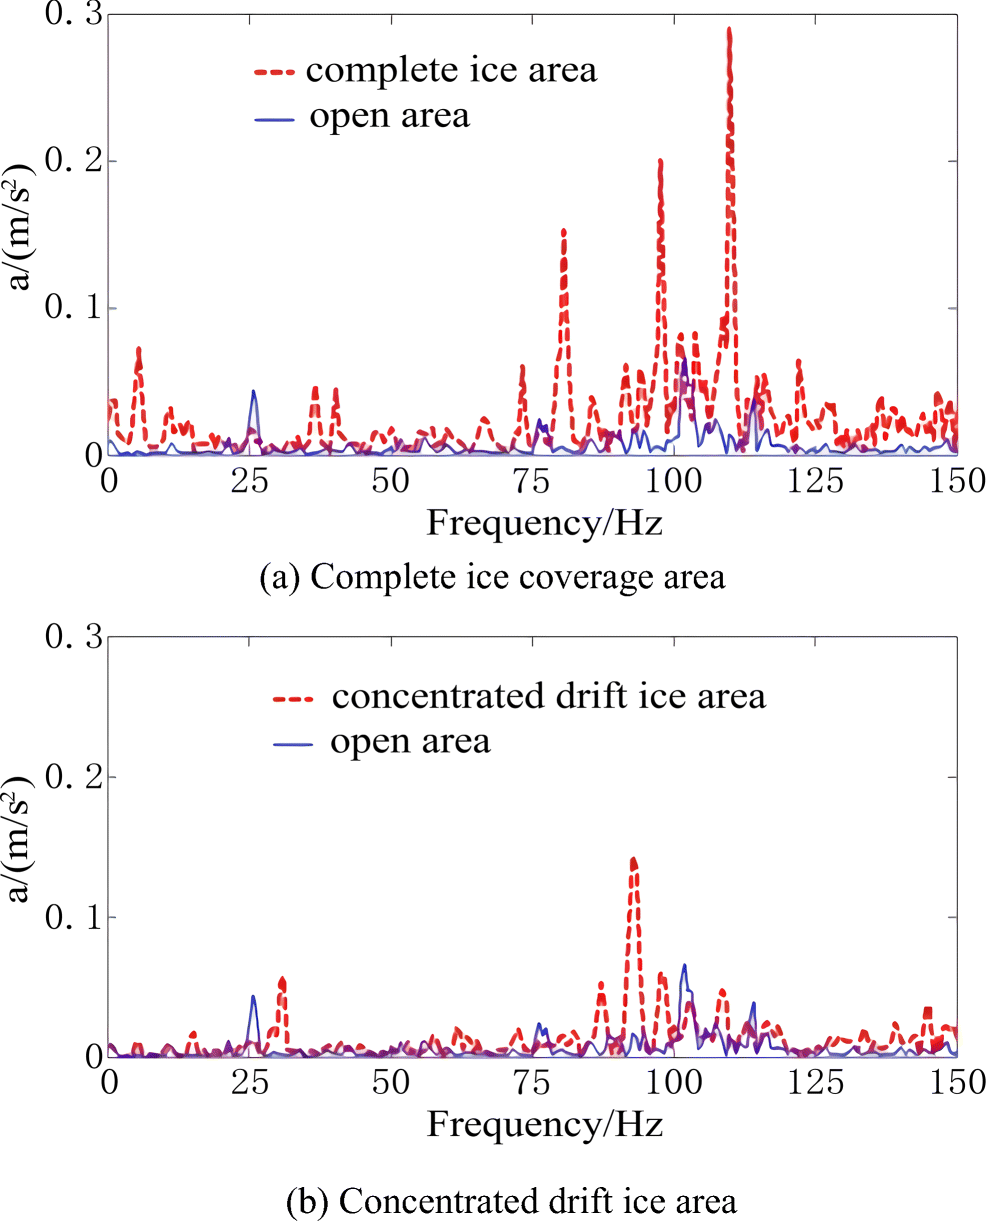 Figure 10 Acceleration amplitude spectra of the cross-point of the deck girder and beam on the driving deckTable 7 Maximum vibration acceleration response value of the cross-point of the deck girder and beam on the driving deck
Condition 1 Condition 2 Condition 3 Frequency (Hz) 108.6 92.8 101.9 Maximum acceleration value (m/s2) 0.29 0.14 0.07 After analyzing the vibration acceleration spectrum at the three different inspection points on the driving deck, we can draw the following three conclusions:
1) Compared to an open area with little ice, when the river icebreaker navigated in complete ice coverage and concentrated drift ice areas, the vibration responses increased at different points on the driving deck. The vibration response at the center of the local plate was greater than other two test points on the driving deck, and the vibration response of the cross-point of the deck girder and beam was smallest.
2) Considering the vibration acceleration spectrum for complete ice coverage and concentrated ice areas, we found that the maximum acceleration value of the spectrum in an area with complete ice coverage did not increase significantly compared to that of a concentrated ice area. When we set the test point at the center of the local plate or the middle of the beam between girders, the maximum value of the spectrum in concentrated ice was even greater than that in an area with complete ice coverage.
3) When the river icebreaker navigated in a complete ice coverage area, there were more spectral lines in the vibration response spectrum than in the concentrated drift ice area. It is clear that the vibration response spectrum of complete ice coverage areas is a typical broadband spectrum. In other words, there are more excitation frequencies of the ice load in a complete ice coverage area than in a concentrated drift ice area.
3.2 Influence of Icebreaker Speed
Two typical points in the bow region on the main deck were chosen as test points to analyze the influence of river icebreaker speed on ice-induced vibration. Table 8 lists the location of the test points.
Table 8 Location of two typical test points on the main deckNumber Location Description of test points Longitudinal Lateral 1 FR50 + 250 mm + 675 mm Center of local plate 2 FR50 −735 mm Middle of beam between girders 3.2.1 Center of Local Plate
Figure 11 shows the time-domain curve of the vibration acceleration of the no. 1 point when the river icebreaker was navigating in a complete ice coverage area at different speeds, i.e., 3–4 kn, 5–6 kn, and 7–8 kn.
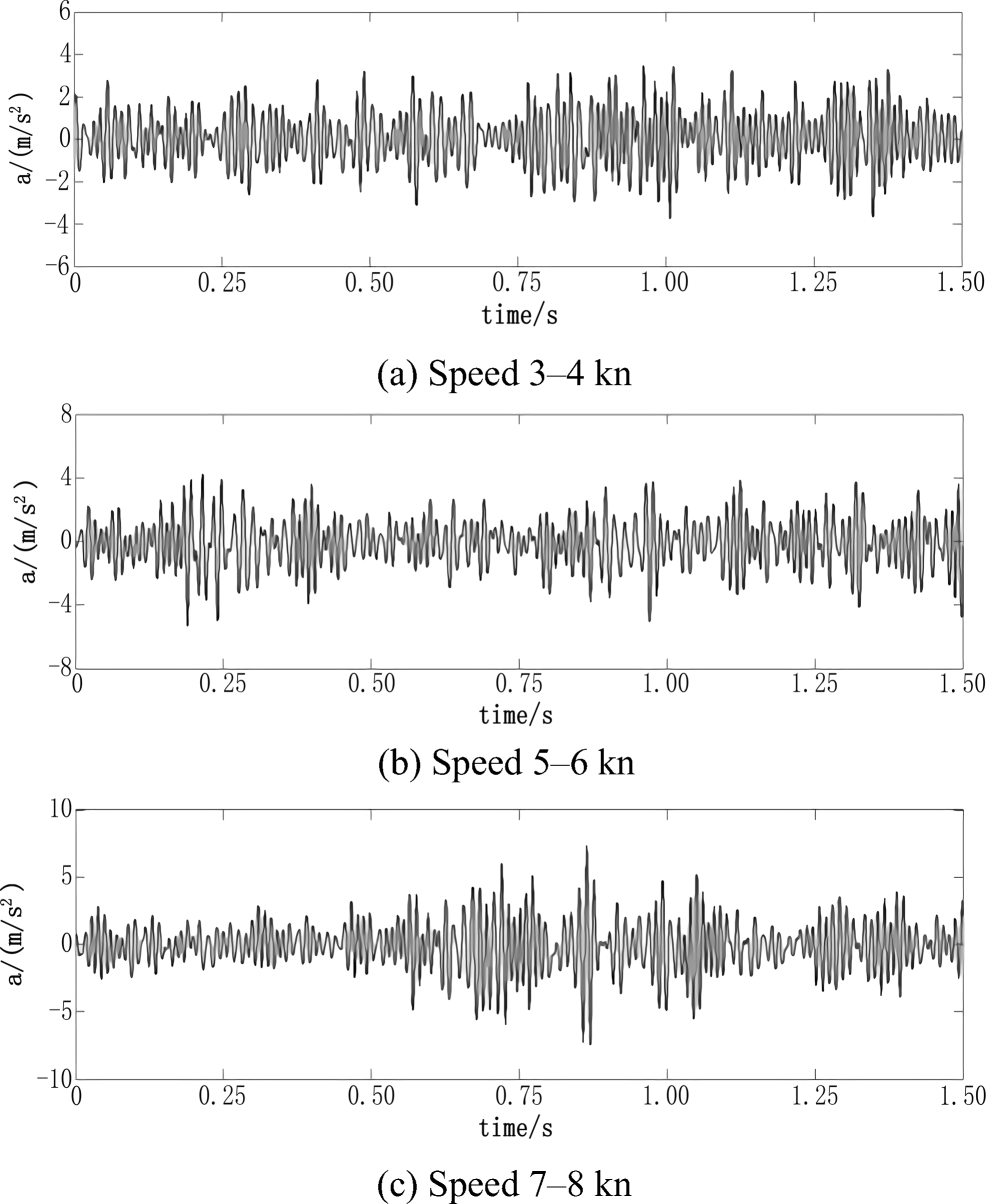 Figure 11 Acceleration time-domain curves at the center of the local plate on the main deck
It is clear that the maximum peak value of the time-domain curve of the vibration acceleration differs with different speeds. When the river icebreaker navigated at high speed, the vibration response increased greatly.
Figure 12 shows the acceleration amplitude spectra at the center of the local plate on the main deck, from which we can draw the following conclusions:
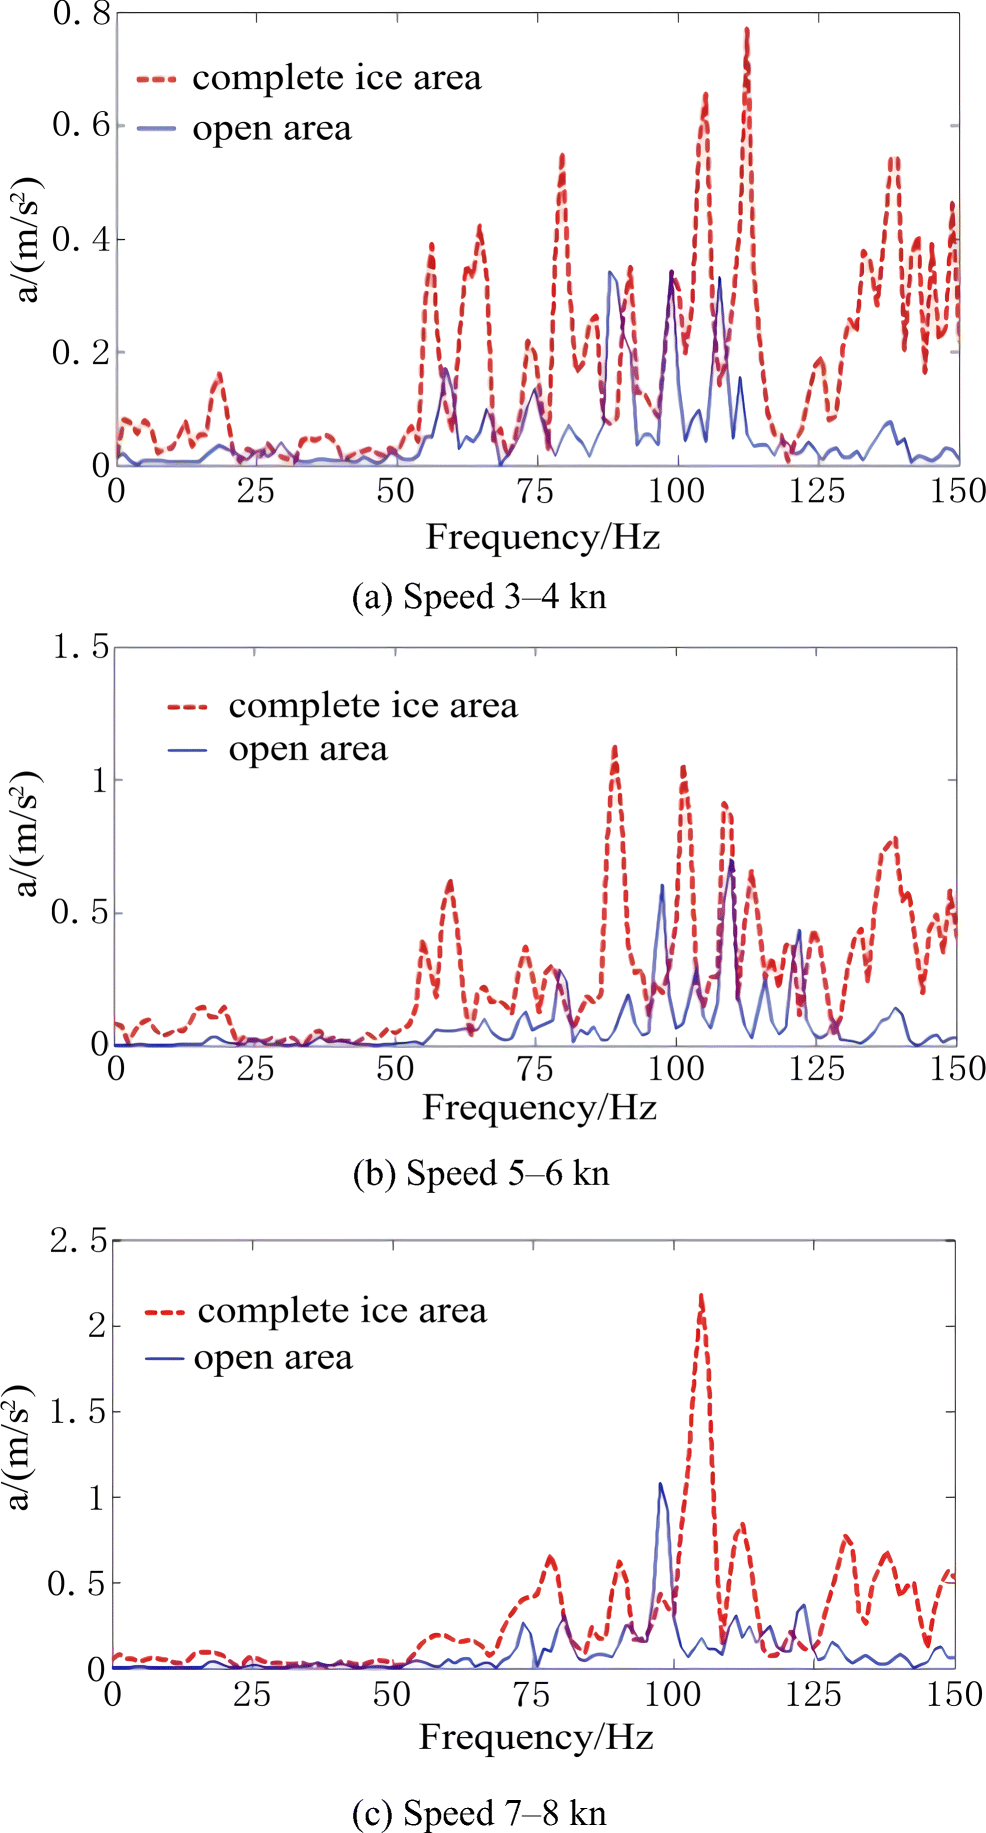 Figure 12 Acceleration amplitude spectra of the center of local plate on the main deck
1) When the river icebreaker navigated in a complete ice coverage area, with increases in navigation speed, the acceleration response gradually increased.
2) Compared to an open area with little ice, the response value of the acceleration amplitude spectrum increased greatly, especially in the frequency domain between 125 Hz and 150 Hz.
3) When the river icebreaker navigated at high speed, it did not excite more vibration responses in the frequency domain than when navigating at low speed.
3.2.2 Middle of Beam between Girders
Figure 13 shows the time-domain curve of the vibration acceleration at the no. 2 point when the river icebreaker navigated in a complete ice coverage area at different speeds, including 3–4 kn, 5–6 kn, and 7–8 kn.
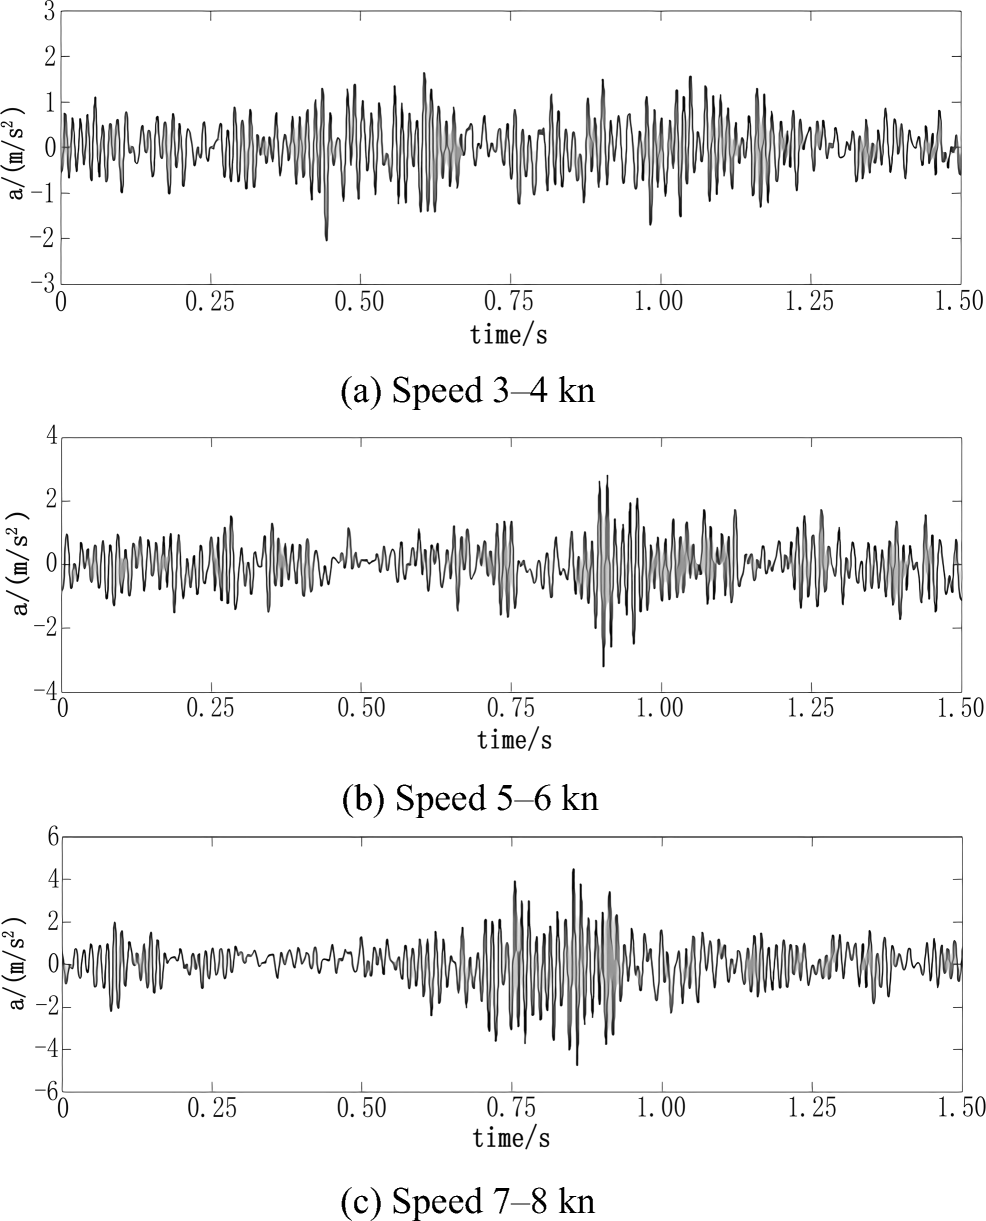 Figure 13 Acceleration time-domain curves of the middle of beam between girders on the main deck
From this figure, we can conclude that the peak values of the time-domain curve of the vibration acceleration differ greatly when the river icebreaker navigates at different speeds.
Figure 14 shows the acceleration amplitude spectrum at the middle of the beam between the girders on the main deck. For the No. 2 point, the vibration acceleration response when the speed of the river icebreaker was between 7 and 8 kn is significantly greater than that at 3–4 kn. However, when the river icebreaker was traveling at a speed of 5–6 kn, the vibration acceleration response did not obviously change, as compared with that at 3–4 kn. When the river icebreaker navigated in a complete ice coverage area, the vibration acceleration spectrum increased mainly in the frequency domain between 150 and 250 Hz.
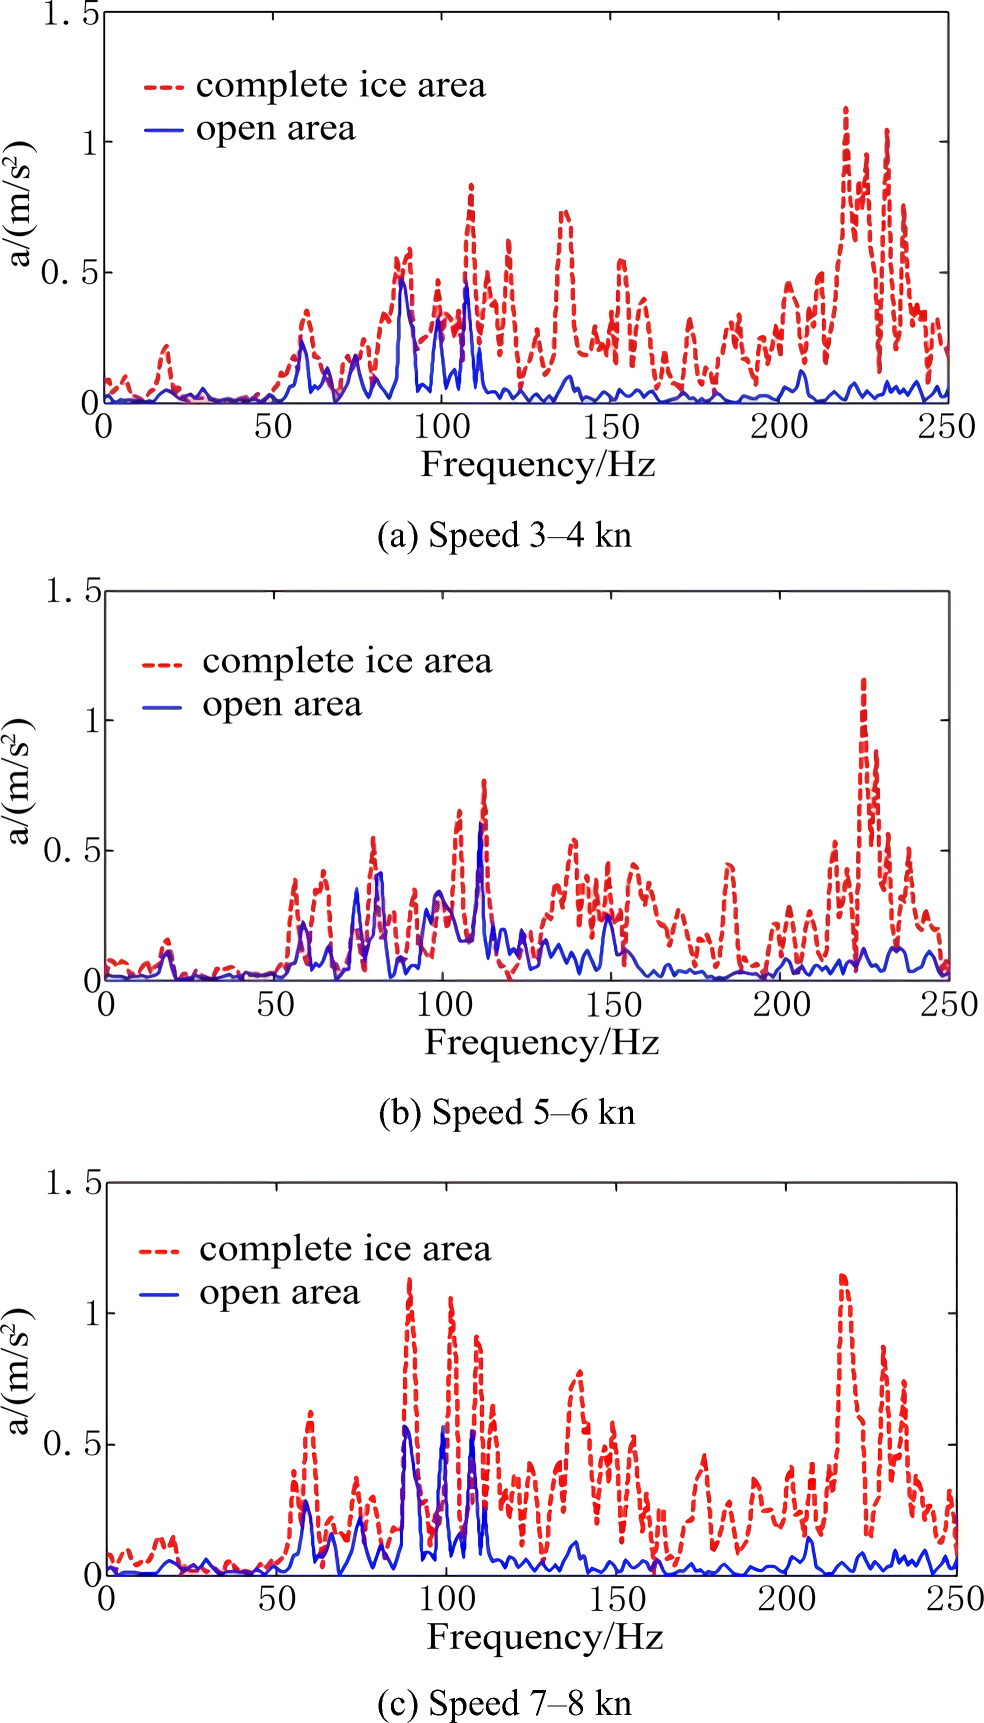 Figure 14 Acceleration amplitude spectra at the middle of the beam between girders on the main deck
3.3 Vibration Characteristics of Icebreaker
As shown in Figures 12 and 14, when the river icebreaker navigated in an open area with little ice, the peak values at the no. 1 and 2 points on the main deck, respectively, correspond to 55–57 Hz. The frequency of the peak value changes little when the river icebreaker was operating in a complete ice coverage area. However, according to the design manual of the river icebreaker, the first natural frequency is 6.5 Hz.
To further investigate the 55-Hz and 57-Hz frequencies in the acceleration amplitude spectra of the No. 1 and 2 points on the main deck, we performed a numerical simulation of the local grillage using commercial FEA software ABAQUS. We obtained the first five natural frequencies (Table 9) and model shapes (Figure 15) of the local grillage. The third-order natural frequency of the local grillage is 56.1 Hz. We can conclude that the icebreaking operation of the river icebreaker causes a violent local vibration of the grillage on the main deck, which can be controlled by changing the structure of the grillage.
Table 9 Natural vibration frequencies of stiffened plates on main deckOrder 1 2 3 4 5 6 7 8 9 10 Frequency (Hz) 45.8 50.7 56.1 63.9 72.1 75.4 77.5 85.6 87.3 92.3 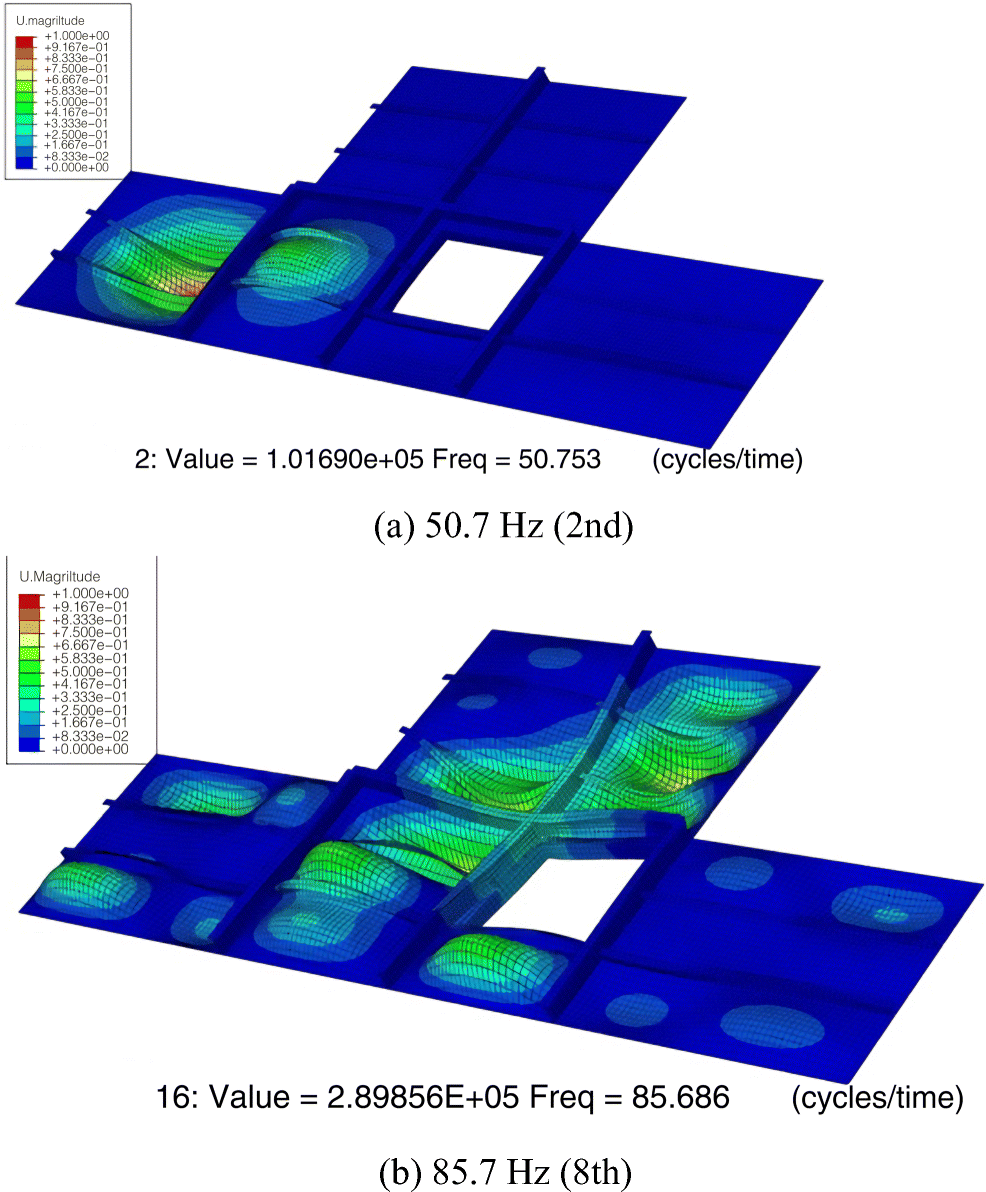 Figure 15 Natural frequencies and model of the stem of the main deck
3.4 Habitability of Icebreaker
When the river icebreaker breaks ice in a complete ice coverage area, the ice load may lead to overall and local vibrations. As such, it is necessary to evaluate the habitability of the icebreaker. In addition, we compared the habitability when navigating in a complete ice coverage area and an open area with little ice. With reference to ISO 6954:2000, the habitability of a ship is roughly the frequency-weighted acceleration (mm/s2).
The overall frequency-weighted acceleration a freq-rms is defined as follows:
$$ {a}_{\mathrm{freq}-\mathrm{rms}}=[\;\sum \limits_i{\left({\omega}_i{a}_i\right)}]^{\frac{1}{2}} $$ (2) In Eq. (2), ωi is the combined frequency weighting in the one-third-octave bands and ai is the corresponding acceleration of the ship.
Table 10 lists the ISO 6954:2000 guidelines for the habitability of different areas on a ship. When the acceleration value is higher than the upper limit, it is considered to be harmful vibration, whereas when it is below the lower limit, it is regarded as harmless vibration. Vibration values between the upper and lower limits are generally considered to be acceptable. Based on the acceleration data obtained by the sensors, the habitability of the river icebreaker can be determined from Eq. (2) and Table 10. For the sake of simplicity, in Table 11, we only list the habitability of the bow area on the main and driving decks.
Table 10 Guidelines of new ISO 6954 for habitability of different areas on a shipArea classification (mm/s2) Overall frequency-weighted values A B C Upper limit 143 186 253 Lower limit 71 107 143 Table 11 Evaluation results of habitability on different areas of icebreakerLocation Area classification Open area (mm/s2) Complete ice area acceleration (mm/s2) Evaluation result Bow region on the main deck C 26.9 74.1 Harmless vibration Driving deck C 33.8 46.2 Harmless vibration 4 Conclusion
When handling a non-stationary random signal of an ice-induced vibration acceleration recorded during the icebreaking process, we combined wavelet noise reduction and STFT to obtain the vibration acceleration spectra that met our accuracy requirements. To investigate the influence of ice on the hull vibration of an icebreaker when breaking ice, we selected as research objects the center of the local plate, the middle of the beam between girders, and the cross-point of the deck girder and beam on the driving and main decks. Lastly, we determined the influence of the concentration of ice and the speed of the icebreaker on the hull vibration by analyzing the vibration acceleration amplitude spectra and acceleration time-domain curves. Our conclusions are as follows:
1) When the icebreaker navigates in a complete ice coverage area, the peak value of the acceleration amplitude spectrum is higher than those of the other two conditions. Also, the vibration response excited by the icebreaking load of the complete ice coverage area exhibits more frequencies. However, when the icebreaker navigates in a concentrated drift ice area, the peak value of the acceleration amplitude spectrum is smaller than that of a complete ice coverage area. Also, the vibration response excited by the icebreaking load of a concentrated drift ice area is sparser than that of a complete ice coverage area. When the icebreaker navigates in a complete ice coverage area at different speeds, the influence of hull vibration on the icebreaker is mainly concentrated in the low and middle frequencies. With an increase in icebreaker speed, the vibration acceleration response gradually increases.
2) When the icebreaker is breaking ice, the area of interaction of the ice load is mainly focused outside the bow region. The strength of the grillage structure in the bow region of the icebreaker is strong enough at a higher natural frequency. As a result, a steady-state forced vibration rarely occurs, which can be seen in the acceleration time-domain curve. When the icebreaker navigates in complete ice coverage and concentrated drift ice areas, its hull vibration is unsteady and random.
3) The icebreaking operation of the river icebreaker causes violent local vibration of the grillage on the main deck. This local vibration can be controlled by changing the grillage structure.
4) The vibration acceleration of the river ice breaker obviously increases when the river ice breaker breaks ice. However, the habitability of the bow region on the main and driving decks is maintained at harmless vibration levels.
Data Availability The study data was obtained in the Songhua River of Heilongjiang province in China during March of 2016. The manuscript is based on the processing results of the original data transferred from the portable dynamic signal-testing analyzer. The volume of original data is large, and it could only be opened using professional software matched with the signal-testing analyzer. -
Figure 1 Photos of the icebreaker when breaking ice
Figure 2 Signal measurement and acquisition test instruments
Figure 3 Test point layout on driving deck
Figure 4 Test point layout of bow area on the main deck
Figure 5 Acceleration time-domain curves of the center of local plate on the driving deck
Figure 6 Acceleration amplitude spectra of the center of local plate on the driving deck
Figure 7 Acceleration time-domain curves of the middle of the beam between girders on the driving deck
Figure 8 Acceleration amplitude spectra of middle of beam between girders on the driving deck
Figure 9 Acceleration time-domain curves of the cross-point of deck girder and beam on the driving deck
Figure 10 Acceleration amplitude spectra of the cross-point of the deck girder and beam on the driving deck
Figure 11 Acceleration time-domain curves at the center of the local plate on the main deck
Figure 12 Acceleration amplitude spectra of the center of local plate on the main deck
Figure 13 Acceleration time-domain curves of the middle of beam between girders on the main deck
Figure 14 Acceleration amplitude spectra at the middle of the beam between girders on the main deck
Figure 15 Natural frequencies and model of the stem of the main deck
Table 1 Specifications of the river icebreaker
Length (m) 29.70 Length between perpendiculars (m) 28.00 Breadth (m) 7.00 Depth (m) 2.40 Draft (m) 1.15 Displacement weight (t) 145.0 Block coefficient CB 0.83 Maximum speed (kn) 12 Table 2 Typical ice conditions
The interactions between icebreaker and ice layer in the test Description Complete ice coverage area (Condition 1) Concentrated drift ice area (Condition 2) Open area with little ice (Condition 3) Table 3 Test conditions of the icebreaker
Speed of icebreaker (kn) 3–4 5–6 7–8 Test conditions Complete ice coverage area with the ice thickness of 250–300 mm (Condition) Concentrated drift ice area (Condition) Open area with little ice (Condition 3) Table 4 Locations of three typical test points on the driving deck
Number Location Description of test points Longitudinal Lateral 1 FR42 + 250 mm Distance to centerline + 675 mm Center of local plate 2 FR41 Distance to centerline + 675 mm Middle of beam between girders 3 FR42 Centerline Cross-point of deck girder and beam Table 5 Peak values of vibration acceleration response at the center of the local plate on the driving deck
Open area with little ice Frequency (Hz) 25 51.2 73.8 103.1 137.9 Acceleration (m/s2) 0.057 0.067 0.070 0.248 0.063 Concentrated drift ice area Frequency (Hz) 36.6 72.1 109.9 137.9 Acceleration (m/s2) 0.178 0.621 0.462 0.204 Complete ice coverage area Frequency (Hz) 36.6 73.2 103.1 139.2 Acceleration (m/s2) 0.240 0.311 0.471 0.092 Table 6 Peak values of vibration acceleration response of the middle of the beam between girders on the driving deck
Open area with little ice Frequency (Hz) 38.4 73.2 89.7 – – Acceleration (m/s2) 0.038 0.075 0.121 – – Concentrated drift ice area Frequency (Hz) 36.6 73.2 91.5 109.9 122.1 Acceleration (m/s2) 0.080 0.074 0.282 0.223 0.204 Complete ice coverage area Frequency (Hz) 39.1 72.1 90.3 109.3 120.8 Acceleration (m/s2) 0.218 0.201 0.310 0.165 0.092 Table 7 Maximum vibration acceleration response value of the cross-point of the deck girder and beam on the driving deck
Condition 1 Condition 2 Condition 3 Frequency (Hz) 108.6 92.8 101.9 Maximum acceleration value (m/s2) 0.29 0.14 0.07 Table 8 Location of two typical test points on the main deck
Number Location Description of test points Longitudinal Lateral 1 FR50 + 250 mm + 675 mm Center of local plate 2 FR50 −735 mm Middle of beam between girders Table 9 Natural vibration frequencies of stiffened plates on main deck
Order 1 2 3 4 5 6 7 8 9 10 Frequency (Hz) 45.8 50.7 56.1 63.9 72.1 75.4 77.5 85.6 87.3 92.3 Table 10 Guidelines of new ISO 6954 for habitability of different areas on a ship
Area classification (mm/s2) Overall frequency-weighted values A B C Upper limit 143 186 253 Lower limit 71 107 143 Table 11 Evaluation results of habitability on different areas of icebreaker
Location Area classification Open area (mm/s2) Complete ice area acceleration (mm/s2) Evaluation result Bow region on the main deck C 26.9 74.1 Harmless vibration Driving deck C 33.8 46.2 Harmless vibration -
Bekker A, Soal KI, McMahon KJ (2017) Whole-body vibration exposure on board a polar supply and research vessel in open water and in ice. Cold Reg Sci Technol 141: 188–200. https://doi.org/10.1016/j.coldregions.2017.06.008 Belyashov VA, Grozdov AV, Sazonov KE, Tumashik AP (2008) Yury Topchev and Vladislav Strizhov multipurpose ice-breaking vessels for Prirazlomnaya platform maintenance: field and model tests. International Conference and Exhibition on Performance of Ship and Structures in Ice Chen WZ, Wang BW, Hu XY(2010) Acceleration signal processing by numerical integration. J Huazhong Univ Sci Technol (Nat Sci Ed) 38: 1–4. https://doi.org/10.13245/j.hust.2010.01.015 Edwards Jr RY, Lewis JW, Wheaton JW, Coburn Jr JL (1972) Full-scale and model tests of a Great Lakes icebreaker. Society of Naval Architects and Marine Engineers Goodman RA (1971) Wave-excited main hull vibration in large tankers and bulk carriers. Nav Archit Hu Z, Xu M, Jiang G, Zhang D (2014) Analysis of non-stationary signal of a sudden unbalanced spindle based on wavelet noise reduction and short-time Fourier transformation. J Vibration Shock 33(5): 20–23. https://doi.org/10.13465/j.cnki.jvs.2014.05.004 Jiao JH, Ren, Adenya CA (2015) Experimental and numerical analysis of hull girder vibrations and bow impact of a large ship sailing in waves. Shock Vib 2015: 1–10. https://doi.org/10.1155/2015/706163 Kim HS, Lee CJ, Choi KS, Kim MC (2011) Study on icebreaking performance of the Korea icebreaker ARAON in the arctic sea. Int J Naval Architect Ocean Eng 3(3): 208–215. https://doi.org/10.2478/IJNAOE-2013-0064 Li L, Li H, Pang F, Wang X, Du Y, Li S (2017) The modified Fourier-Ritz approach for the free vibration of functionally graded cylindrical, conical, spherical panels and shells of revolution with general boundary condition. Math Probl Eng 2017: 1–32. https://doi.org/10.1155/2017/9183924 Liu ZJ, Amdahl, Løset S (2011) Integrated numerical analysis of an iceberg collision with a foreship structure. Mar Struct 24(4): 377–395. https://doi.org/10.1016/j.marstruc.2011.05.004 Noble PW Tam B, Menon, Bayly I (1980) Ice forces and accelerations on a polar class icebreaker. POAC 79, Proceedings of the 5th International Conference on Port and Ocean Engineering under Arctic Conditions Pang F, Li H, Choe K, Shi D, Kim K (2017a). Free and forced vibration analysis of airtight cylindrical vessels with doubly curved shells of revolution by using Jacobi-Ritz method. Shock and Vibration 2017. https://doi.org/10.1155/2017/4538540 Pang F, Li H, Miao X, Wang X (2017b) A modified Fourier solution for vibration analysis of moderately thick laminated annular sector plates with general boundary conditions, internal radial line and circumferential arc supports. Curved Layered Structures 4(1): 189–220. https://doi.org/10.1515/cls-2017-0014 Pang F, Li H, Wang X, Miao X, Li S (2018) A semi analytical method for the free vibration of doubly-curved shells of revolution. Comput Math Appl 75:3249–3268. https://doi.org/10.1016/j.camwa.2018.01.045 Riska K, Leiviskä T, Nyman T, Fransson L, Lehtonen J, Eronen H, Backman A (2001) Ice performance of the Swedish multi-purpose icebreaker Tor Viking II. Proceedings of the International Conference on Port and Ocean Engineering Under Arctic Conditions Song Y-Y, Kim M-C, Chun H-H (2007) A study on resistance test of icebreaker with synthetic ice. J Soc Naval Archit Korea 44(4): 389–397. https://doi.org/10.3744/SNAK.2007.44.4.389 Sopper R, Daley C, Colbourne B, Bruneau S (2017) The influence of water, snow and granular ice on ice failure processes, ice load magnitude and process pressure. Cold Reg Sci Technol 139:51–64. https://doi.org/10.1016/j.coldregions.2017.04.006 Suyuthi A, Leira BJ, Riska K (2011) Full scale measurement on level ice resistance of icebreaker. Proceedings of the ASME 30th International Conference on Ocean, Offshore and Arctic Engineering (OMAE2011), Rotterdam, The Netherlands. Rotterdam: The American Society of Mechanical Engineers (ASME), OMAE2011-50066, Citeseer. https://doi.org/10.1115/OMAE2011-50066 Zhang M, Zhang D, Fu S, Yan X, Goncharov V (2017) Safety distance modeling for ship escort operations in Arctic ice-covered waters. Ocean Eng 146:202–216. https://doi.org/10.1016/j.oceaneng.2017.09.053 Zhang M, Zhang D, Goerlandt F, Yan X, Kujala P (2019) Use of HFACS and fault tree model for collision risk factors analysis of icebreaker assistance in ice-covered waters. Saf Sci 111:128–143. https://doi.org/10.1016/j.ssci.2018.07.002 Zhou L, Chuang Z, Bai X (2017) Ice forces acting on towed ship in level ice with straight drift. Part II: numerical simulation. Int J Naval Architect Ocean Eng 10:119–128. https://doi.org/10.1016/j.ijnaoe.2017.06.001 Zhou L, Chuang ZJ, Ji CY (2018) Ice forces acting on towed ship in level ice with straight drift. Part I: analysis of model test data. Int J Naval Architect Ocean Eng 10(1): 60–68. https://doi.org/10.1016/j.ijnaoe.2017.03.008