Sensitive Resource and Traffic Density Risk Analysis of Marine Spill Accidents Using Automated Identification System Big Data
https://doi.org/10.1007/s11804-020-00138-2
-
Abstract
This study developed a new methodology for analyzing the risk level of marine spill accidents from two perspectives, namely, marine traffic density and sensitive resources. Through a case study conducted in Busan, South Korea, detailed procedures of the methodology were proposed and its scalability was confirmed. To analyze the risk from a more detailed and microscopic viewpoint, vessel routes as hazard sources were delineated on the basis of automated identification system (AIS) big data. The outliers and errors of AIS big data were removed using the density-based spatial clustering of applications with noise algorithm, and a marine traffic density map was evaluated by combining all of the gridded routes. Vulnerability of marine environment was identified on the basis of the sensitive resource map constructed by the Korea Coast Guard in a similar manner to the National Oceanic and Atmospheric Administration environmental sensitivity index approach. In this study, aquaculture sites, water intake facilities of power plants, and beach/resort areas were selected as representative indicators for each category. The vulnerability values of neighboring cells decreased according to the Euclidean distance from the resource cells. Two resulting maps were aggregated to construct a final sensitive resource and traffic density (SRTD) risk analysis map of the Busan–Ulsan sea areas. We confirmed the effectiveness of SRTD risk analysis by comparing it with the actual marine spill accident records. Results show that all of the marine spill accidents in 2018 occurred within 2 km of high-risk cells (level 6 and above). Thus, if accident management and monitoring capabilities are concentrated on high-risk cells, which account for only 6.45% of the total study area, then it is expected that it will be possible to cope with most marine spill accidents effectively.Article Highlights• Performance of the proposed methodology is studied with a case study conducted in Busan, Republic of Korea.• Vulnerability of marine environment is evaluated by the Euclidean distance from the sensitive resource cells.• A new methodology is presented for analyzing the risk level of marine spill accidents using marine traffic density and sensitive resources.• Marine traffic density is mapped by combining all gridded routes derived from AIS big data, which were preprocessed using a big data mining algorithm. -
1 Introduction
Although the number of spill accidents and the amount of spilled oils/chemicals have decreased over the past 40 years (International Tanker Owners Pollution Federation 2016), marine spill accidents have been a primary cause for concern because of their considerable impact on marine systems. Major spill accidents can damage the marine ecosystems and coastal resources, affect important socioeconomic assets, and increase costs, including cleanup costs (Shahidul Islam and Tanaka 2004). In light of this, there is an increasing interest in developing scientific risk analysis of marine spill accidents to mitigate the damage of spills, prepare for accidents in advance, and improve maritime safety (International Maritime Organization 2010).
Recent quantitative marine risk assessment studies have been based either on a simulation approach or an index approach. The simulation approach computes accident probability and/or post-event forecasts with assumed variables and conditions. Lee and Jung (2015) developed a simulation method to estimate various spill patterns based on past accidents. Sormunen et al. (2014) proposed a meta model to evaluate the collision probability of a given scenario. Olita et al. (2012) measured the risk of an oil slick using a 3D finite element model. Goerlandt and Montewka (2015) used Bayesian network modeling to quantify the spill risk from a vessel collision. The simulation approach is advantageous in estimating the size of the event and determining the formation mechanism. However, simulations involve many assumptions and simplifications because it is difficult to reflect all of the variables in the real world. If an assumption is wrong or biased, then the simulation results could be misleading.
The index approach involves selecting parameters that are considered to affect risk factors as indicators and aggregating the results of each set of indicators. This approach can include quantitative indicators and qualitative indicators such as expert judgment, legislation, training plans, and surveys. Result scores are mapped through geographic analysis tools and can be used by decision-makers to establish a comprehensive plan. Lan et al. (2015) developed a marine oil spill risk mapping methodology that consists of risk source indicators and risk receptor indicators. Fernández-Macho et al. (2016) obtained the marine spill risk index from accident records in the European coastal region. In most of these studies, the target sea area is divided into several zones, and each zone is individually evaluated using the index system. Thus, every cell in each zone has the same risk score, which is unrealistic because the score is discretely changed at the boundary of the zone, which does not exist in the actual sea area. It is also difficult to apply the assessment results to the field because of the large size of the assessed zone or coastline. Moreover, it is difficult to cover all risky areas with limited resources. In addition, when selecting indicators, there are discrepancies among researchers because of subject interference and the lack of theoretical justification.
Several key points were addressed to improve the conventional approaches and develop a better risk analysis methodology. The developed method should be (1) based on solid rationale, (2) generic enough to be replicated in other scenarios, (3) evaluated from an accessible database, and (4) interpretable by decision-makers and stakeholders (Sepp Neves et al. 2015; Landquist et al. 2013). From this perspective, this study proposes a new risk analysis method that combines a big data technique and a mapping tool based on an index approach. Furthermore, this study attempts to assess risk using a more micro viewpoint instead of the existing mapping methodology that divides the sea area into large zones. The analysis results can be interpreted both quantitatively and qualitatively. The Busan coastal area is used for this case study to demonstrate the effectiveness of the approach.
2 Framework of Risk Analysis
The marine spill risk system is complex and has many uncertainties. Thus, it is difficult to describe the relationship between each component with a single term. To ensure the scalability of the analysis model, the risk system should be adequately simplified. In this study, we assume that the risk system is determined using two factors, namely, hazard of risk sources and the vulnerability of sensitive resources.
2.1 Hazard of Risk Sources
The risk source includes all of the risk factors that may cause a spill accident. For example, the condition of wharves, average wave height, annual foggy days, and distance of oil reserve base were considered the risk factors for marine spill accidents in previous studies (Lan et al. 2015). This study proposed marine traffic density as a comprehensive risk factor that can encompass many other detailed risk factors. Given that nearly all vessel activities or accidents occurred on the transit route, the areas with high route density can be reasonably inferred to have a high hazard level. Marine traffic density also has the advantage of being assessable through public data from the automated identification system (AIS).
Many studies have already been conducted to measure marine safety using the AIS data. Silveira et al. (2013) and Kujala et al. (2009) used the marine traffic statistics from the AIS data to create a model to predict the frequency of marine spill accidents in sea areas. Akhtar et al. (2011) distinguished the size and type of vessels (i.e., chemical carriers, gas tankers, and oil carriers) from the AIS data for oil spill risk analysis and derived the route from the traffic data. Using the derived route and vessel information, Akhtar et al. (2011) calculated the frequency and amount of oil spills caused by the accidents. Renner and Kuletz (2015) used the traffic distribution from the AIS data to measure the risk level of ecosystem degradation due to oil spills. These studies confirmed that the risk of marine spill accidents, such as collision or grounding, might increase in areas where multiple routes overlap. Even if the occurrence of major spill accidents is rare, the marine traffic density from the AIS data could be used as a meaningful indicator for risk analysis.
However, analyzing the AIS data is challenging because its size is large. For example, the AIS data records collected on the East Coast of the USA reach 25 × 109 per year (Breithaupt et al. 2016). Furthermore, the AIS data records are often inaccurate or missing. Thus, proper preprocessing is required before analysis (Kujala et al. 2009). In this study, the outliers and errors of the AIS data are filtered using the big data preprocessing technique. After preprocessing the AIS data of oil/chemical tankers, the vessel routes were interpolated and the marine traffic density was calculated.
2.2 Vulnerability of Sensitive Resources
The literature on the vulnerability of the environment to hazardous events is extensive. According to Mitchell (1989), vulnerability can be defined as the probability of loss. Cutter (1993) considered vulnerability as an interactive and dynamic process that links risk and the community. In general, vulnerability refers to the susceptibility of people, communities, and the environment to the impacts of hazardous events (De Andrade et al. 2010).
Gundlach and Hayes (1978) first proposed a "vulnerability index" scale to quantify environmental vulnerability on the basis of the potential impacts of oil spill damage. Weslawski et al. (1997) proposed a metric to assess coastal vulnerability to oil spills on the basis of topographic data. In 2002, the National Oceanic and Atmospheric Administration (NOAA) developed an environmental sensitivity index (ESI) map to assess the vulnerability of shoreline resources (Peterson et al. 2002). The ESI map considered not only physical features but also biological information and socioeconomic resources, such as water intake facilities of power plants, recreational beaches, and aquaculture sites. Similar to the NOAA ESI approach, the Korea Coast Guard (KCG) created two categories of sensitive resource maps (Roh and Kim 2016; Korea Hydrographic and Oceanographic Agency Korea Hydrographic and Oceanographic Agency 2011; Korea Coast Guard 2010), namely, aquaculture resources and socioeconomic resources. Socioeconomic resources have two subcategories, namely, industrial resources, such as water intake facilities of power plants, ports, docks, and shipyards, and tourism resources, such as beaches, resorts, and campsites. In this study, the three most representative resources of each category in the KCG map, i.e., aquaculture sites, water intake facilities of power plants, and beach/resort areas, were selected as vulnerability indicators (Table 1).
Table 1 Mapping index system for marine spill accidentsObjective Medium Parameter Marine spill risk (R) Hazard (H) Marine traffic density (H) Vulnerability (V) Aquaculture sites (VAC) Water intake facilities of Power plants (VI) Beach/resort areas (VT) 2.3 Risk Analysis
It is widely agreed that risk is the product of a hazard and its impact. If an accidental spill occurs in a vulnerable region, even a moderate amount of spilled oil/chemical may cause considerable damage. Thus, these two components determine risk. In its simplest form, the empirical formula is expressed as follows (United Nations Department of Humanitarian Affairs 1993; United Nations Development Programme 2004; Astiaso Garcia et al. 2013):
$$ \mathrm{Risk}=\mathrm{Hazard}\times \mathrm{Vulnerability} $$ (1) As mentioned in the "Introduction" section, many studies have divided target sea areas into several zones by geographical, ecological, and legal criteria and assessed risk systems on the basis of statistics or census data collected over a long period of time. In such an approach, the size of the evaluated zone is relatively large to effectively distribute spill response resources or monitoring capabilities. In addition, given that the data update period is long, the risk assessment results are static and unsuitable for a dynamic marine situation. For these reasons, existing risk maps are used for reference purposes only and are inappropriate for onsite response and resource allocation.
The sensitive resource and traffic density (SRTD) risk analysis procedure in this study consists of three steps (Figure 1): (1) The target area is divided into grid cells (1 km × 1 km) rather than large zones. (2) The routes of oil/chemical tankers are derived from the AIS big data and gridded on the map. The marine traffic density is evaluated by combining all of the gridded routes. According to the sensitive resource map of the KCG, the locations of aquaculture sites, water intake facilities of power plants, and beach/resorts areas are identified, and the corresponding cells are assigned to have maximum vulnerability values. The vulnerability values of adjacent cells decrease with the distance from resource cells. (3) The hazard and vulnerability values of each cell are normalized and multiplied to obtain the risk values. The evaluated risk values are mapped to the target sea area. The details are presented in the next section.
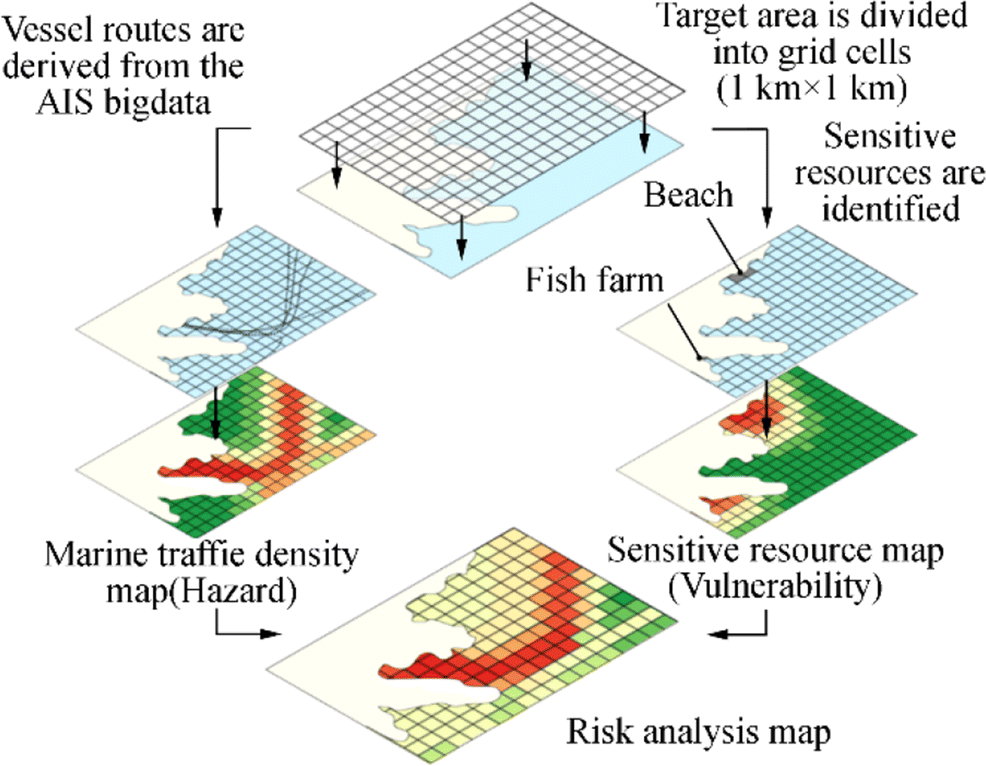 Figure 1 Conceptual framework scheme of SRTD risk analysis developed in this study
3 Case Study: Methodology and Results
The goal of the SRTD risk analysis in this study is to make the existing mapping approach more detailed so that decision-makers can utilize the assessment results for accident prevention and preparation. In this section, each procedure of risk assessment is demonstrated in detail through a case study.
3.1 Study Area
Busan, the second largest city and the largest port city, and Ulsan, the largest industrial city, are both located in the southeastern coastal area of Korea. Busan is the closest port city to Japan and has historically been one of the most important trading centers in Asia. The port of Busan handles 40% of the total maritime import and export cargoes, 80% of container cargoes, and 42% of marine products of Korea. In 2017, it handled more than 20 million TEU container cargoes, which is the sixth largest cargo volume and the third largest transshipment volume in the world, following Singapore and Hong Kong. Although the port of Busan does not specialize in petrochemical transportation, it ranks fourth in terms of the volume of chemical products in Korea. Ulsan is Korea's representative for chemical industrial city adjacent to Busan and has the largest industrial port. In 2017, the total trade volume of Ulsan exceeded 200 million tons, of which liquid chemicals accounted for 166.66 million tons (National Logistics Information Center 2018).
Over 3.5 million people live in Busan and 27 million people visited the city in 2017 (Korean Statistical Information Service 2018). There are seven major beaches and coastal tourism resources, including Haeundae Beach. There is a large laver farm near Gadeokdo, west of Busan. There is a nuclear power plant complex with a total installed capacity of 653 700 kW between Busan and Ulsan. Thus, if major oil/chemical spills occur, then it is expected that it will cause serious socioeconomic damage. Therefore, considerable spill response equipment and labor have to be properly organized to deal with an accident. Nevertheless, there are still many marine spill accidents because of the large trade volume. Of the total 305 marine spill accidents that occurred in 2017, 104 cases occurred in the Busan–Ulsan sea areas, which comprise approximately 34% of the total (Korean Maritime Safety Tribunal 2018). The worst marine spill accident since 2010 was the collision of M/T MARITIME MAISIE, a chemical tanker of approximately 30 000 GT, offshore from Busan in late 2013 (Ryu et al. 2016). The fire continued for approximately 3 weeks, and the ship floated to Tsushima Island in Japan.
This study evaluates the risk of the southeastern coast of Korea centered on Busan, which is considered to be most sensitive to spill accidents. The study area is the intermediate zone of the Busan–Ulsan sea areas, which is under the jurisdiction of the KCG, Busan. The range is up to 24 nautical miles from the baseline determined according to the United Nations Convention on the Law of the Sea (Figure 2).
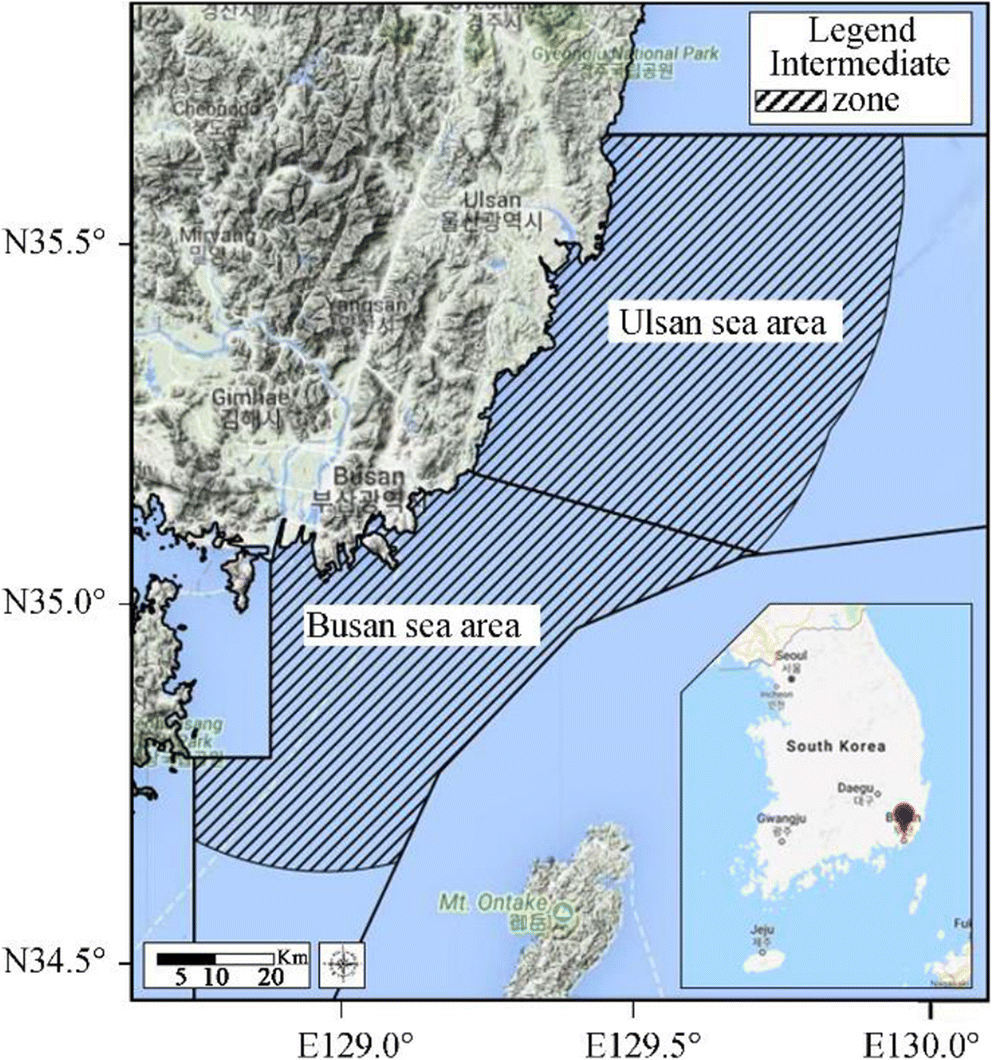 Figure 2 Study area of SRTD risk analysis of marine spill accidents in coastal areas of Busan–Ulsan. Maps are retrieved from Google Maps
3.2 Hazard Assessment Using AIS Big Data
The higher the marine traffic density, the higher the probability that accidents such as collision and stranding, will occur, i.e., the hazard will be higher. To calculate the marine traffic density, the study used the AIS data. An AIS transceiver sends navigational status data such as position, true heading, timestamp, and speed over ground, in every 2 to 180 s depending on the speed of the vessel. In addition, the ship identification number, type of ship/cargo, dimension of the ship, and destination are in sent every 6 min. The size of the AIS data is large. Therefore, analyzing the AIS data that extend over large areas is challenging. In this study, data of the vessels entering and leaving Busan for 3 months from February 15, 2018, to May 15, 2018, were collected from Marinetraffic.com. A total of 23 370 vessel information items and over 15.5 million records were obtained. Of these, except for small carrier vessels below 1000 GT and overlapping vessels, the position records of eight crude oil carriers, 409 oil product carriers, and 109 chemical carriers were extracted.
Given that the collected AIS data contain many missing values and inconsistencies, it is necessary to eliminate outliers and out-of-range errors (Hadzagic et al. 2013). Pallotta et al. (2013) proposed a knowledge-discovery methodology that predicts vessel routes from the AIS data. In their study, density-based spatial clustering of applications with noise (DBSCAN) (Ester et al. 1996) was used to derive a representative route of normal traffic pattern and remove noise. As a result of DBSCAN, noise points that deviate from the normal pattern are filtered out. Given that DBSCAN is an unsupervised clustering algorithm, it is unnecessary to set the number of clusters in advance. Moreover, it is suitable for identifying long polygon-type clusters such as vessel routes, because it is a density-based algorithm, and it is possible to identify clusters of various geometric types.
Similarly, this study applied DBSCAN to the AIS data to detect and eliminate outlier points. Figure 3 shows the sample preprocessed AIS data of OCEAN STAR, an oil product carrier of approximately 1036 GT. The circle points in the cluster are valid, and the "x" marks outside the cluster are the outliers. After preprocessing, the trajectories of the vessel were drawn on the grid cells using the methodology proposed by Kim et al. (2014). Given that the AIS data are discrete, interpolation was performed between each trajectory to convert the trajectories into a route on the grid cells. Subsequent to the AIS big data of 526 vessels being preprocessed and gridded, all of the results were combined to create a marine traffic density map. Figure 4 illustrates the process of constructing a marine traffic density map, and Figure 5 shows the resulting marine traffic density map of the Busan–Ulsan sea areas derived from the AIS big data of 526 vessels with 10 equal intervals. The results indicate that the maximum number of gridded routes in one cell was 517 and there exist some cells with a zero route.
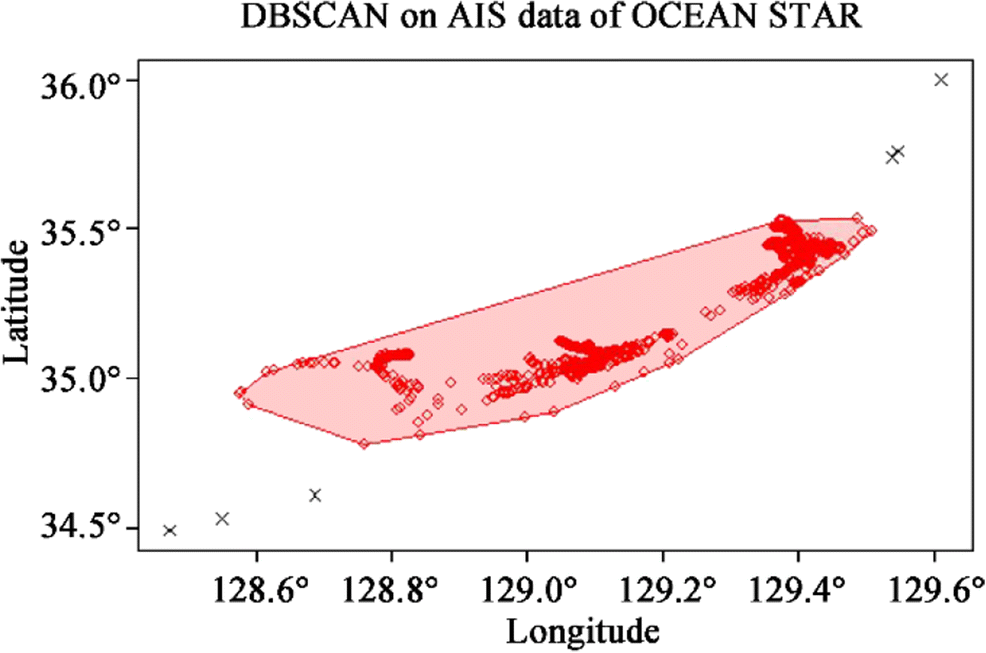 Figure 3 DBSCAN-preprocessed AIS data of OCEAN STAR. The circle points in the cluster are valid, and the "x" marks outside the cluster are outliers
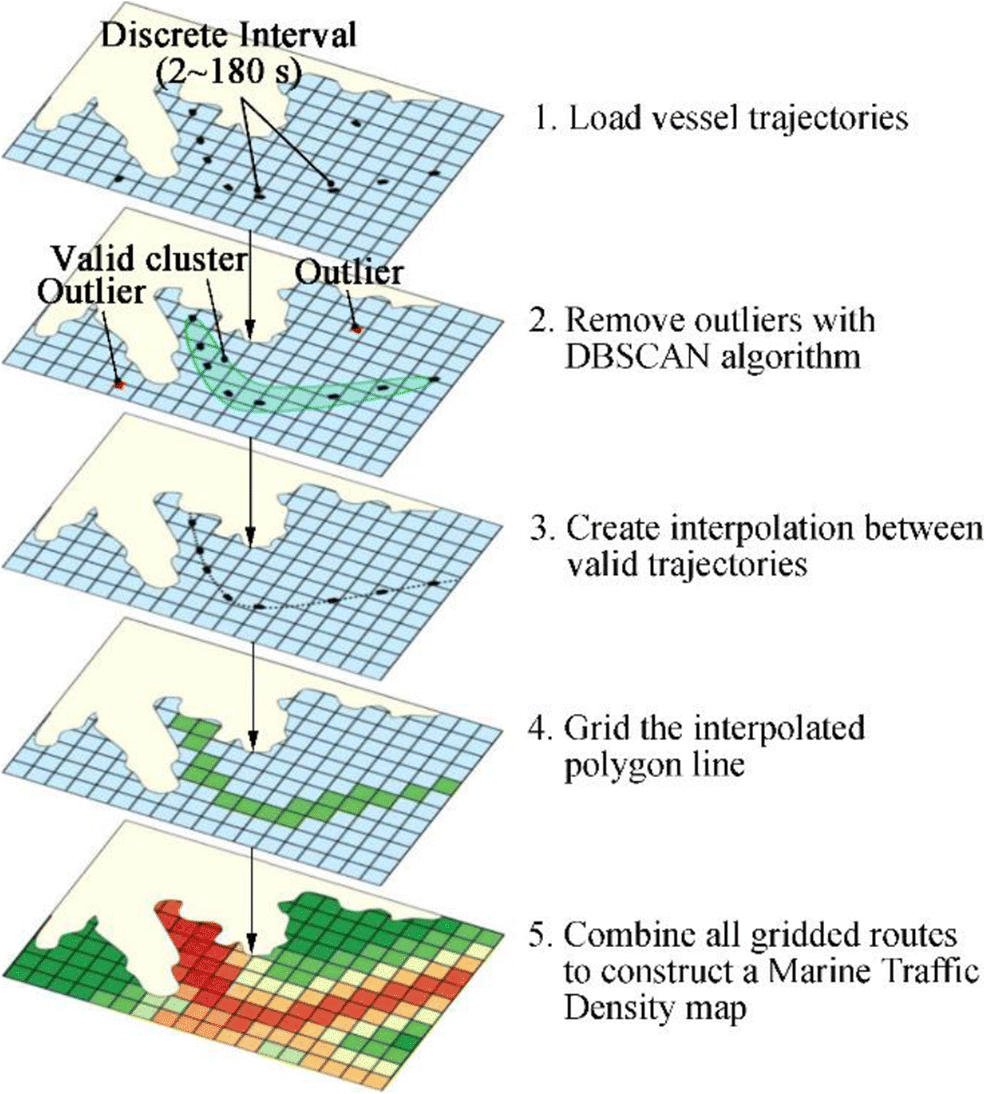 Figure 4 Procedure of constructing a marine traffic density map. Steps 3 and 4 are adopted from the study of Kim et al. (2014)
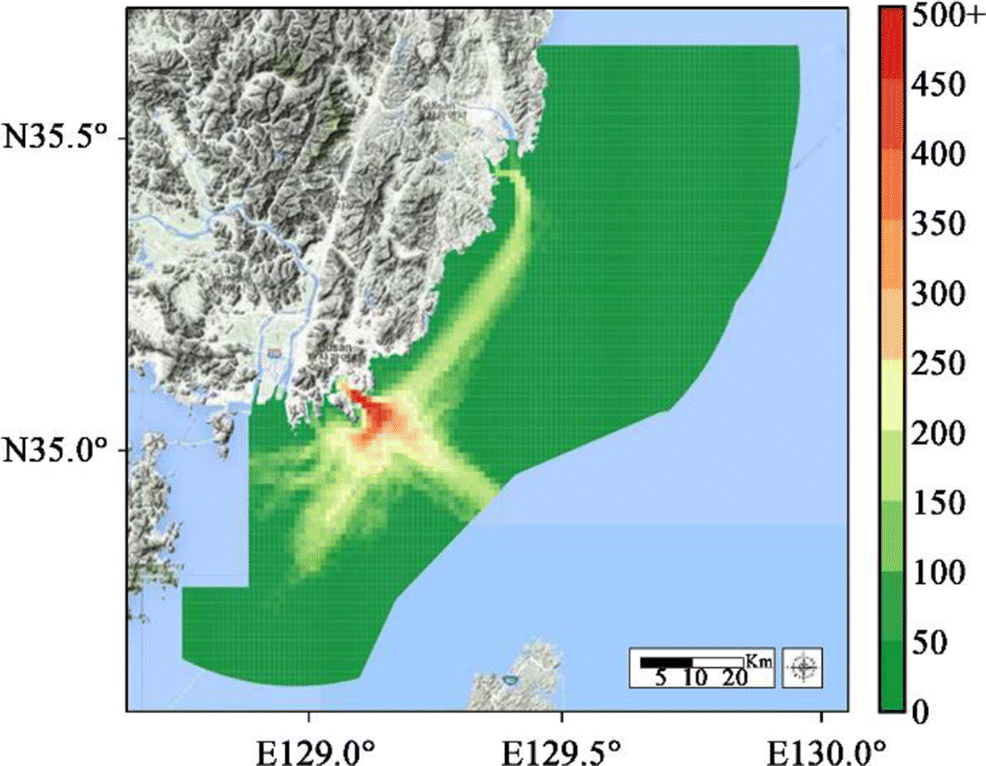 Figure 5 Resulting marine traffic density map of the Busan–Ulsan sea areas (number of gridded routes/km2)
3.3 Vulnerability Assessment Using the Sensitive Resource Map
In the KCG's spill response manual, aquaculture sites and water intake facilities of power plants are considered the most sensitive resources; thus, they take top priority action when an accident occurs. According to the statistics, most of the economic costs in the case of major spill accidents were incurred in the aquaculture industry; thus, the KCG is striving to protect this industry from any harm. The KCG also focuses on tourism resources, which is a subcategory of socioeconomic resources. In general, damage to tourism resources is rare. However, there are cases in which the tourism industry and local economy significantly decreased because of environmental damage caused by a massive spill, such as the 2007 Hebei oil spill (Cheong 2010). Busan is the largest marine tourism city in Korea. Seven major beaches and resort areas are concentrated on a narrow coastline, and these should be protected from spill accidents.
This study enlisted the large-sized aquaculture sites, water intake facilities of power plants, and major beaches in the Busan–Ulsan sea areas retrieved from the KHOA (Table 2) All of the corresponding cells were identified and assigned the highest vulnerability value of 10. Subsequently, in the case of other neighboring cells, the vulnerability value (Vx) is decreased by one every 1 km of Euclidean distance (Dx, i) from the resource cell (Li). Thus, the cell has a vulnerability value of up to 10 km from the source cell. If multiple resource cells exist within 10 km, then the value is calculated based on the nearest resource.
$$ {V}_x=\mathrm{argmax}\left({V}_i-\left[{D}_{x, i}\right]\right)\ \mathrm{for}\ i\le N, {D}_{x, i}=\left\Vert {L}_i-{L}_x\right\Vert $$ (2) Table 2 Representative sensitive resources in the Busan–Ulsan sea areasID Name Main products Category Longitude Latitude VAC1 Nakdong Estuary Delta Aquaculture Laver, seaweed Aquaculture resource 128.87404 35.02433 VAC2 Gijang-gun Aquafarm Zone 1 Seaweed Aquaculture resource 129.23567 35.21112 VAC3 Gijang-gun Aquafarm Zone 2 Seaweed Aquaculture resource 129.26301 35.28400 VAC4 Ulju-gun Aquafarm Shellfish, seaweed Aquaculture resource 129.36500 35.35522 VAC5 Ulsan Dong-gu Aquafarm Yellow tail, sea squirt Aquaculture resource 129.44509 35.49518 VAC6 Ulsan Buk-gu Aquafarm Yellow tail, sea squirt Aquaculture resource 129.45672 35.57402 VI1 Busan Natural Gas Power Station Electricity Industrial resource 129.00067 35.08669 VI2 Gori Nuclear Power Plant Electricity Industrial resource 129.29369 35.32359 VT1 Gwangalli Beach Tourism Tourism resource 129.11758 35.15182 VT3 Haeundae Beach Tourism Tourism resource 129.16048 35.15878 VT3 Songjeong Beach Tourism Tourism resource 129.20003 35.17851 The reason for using 10 km as the maximum range of vulnerability of sensitive resources is that the maximum distance of acute pollution from spill accidents without external information is 10 km according to the KCG's standard operating procedures manual. Long-term chronic contamination is not considered in vulnerability mapping because of the mapping's high uncertainty and complexity (KCG 2009). Figure 6 shows the final vulnerability map of the Busan–Ulsan sea areas.
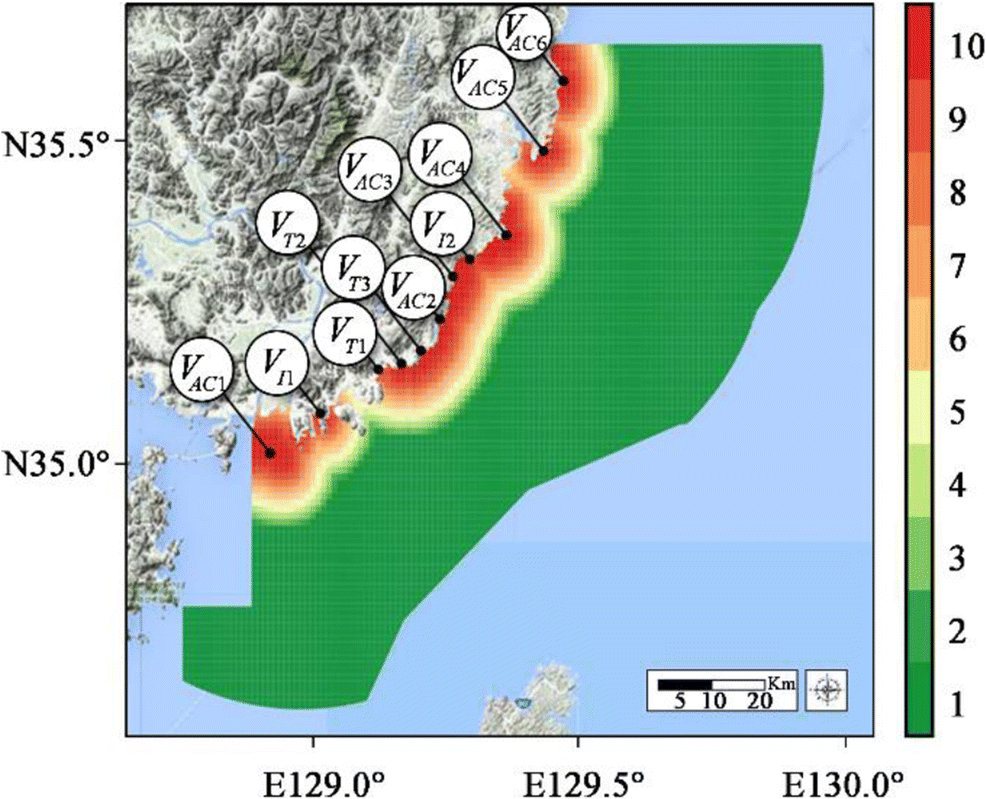 Figure 6 Vulnerability map of sensitive resources in Busan–Ulsan sea areas (vulnerability value)
3.4 SRTD Risk Analysis Results and Discussion
The SRTD results are obtained by multiplying the vulnerability and marine traffic density values of each cell derived from the two maps. Prior to aggregation, the marine traffic density values are normalized to a scale of 1 to 10. Subsequent to the aggregation, the risk values are normalized as well. Figure 7 shows the resulting SRTD risk analysis map of the Busan–Ulsan sea areas.
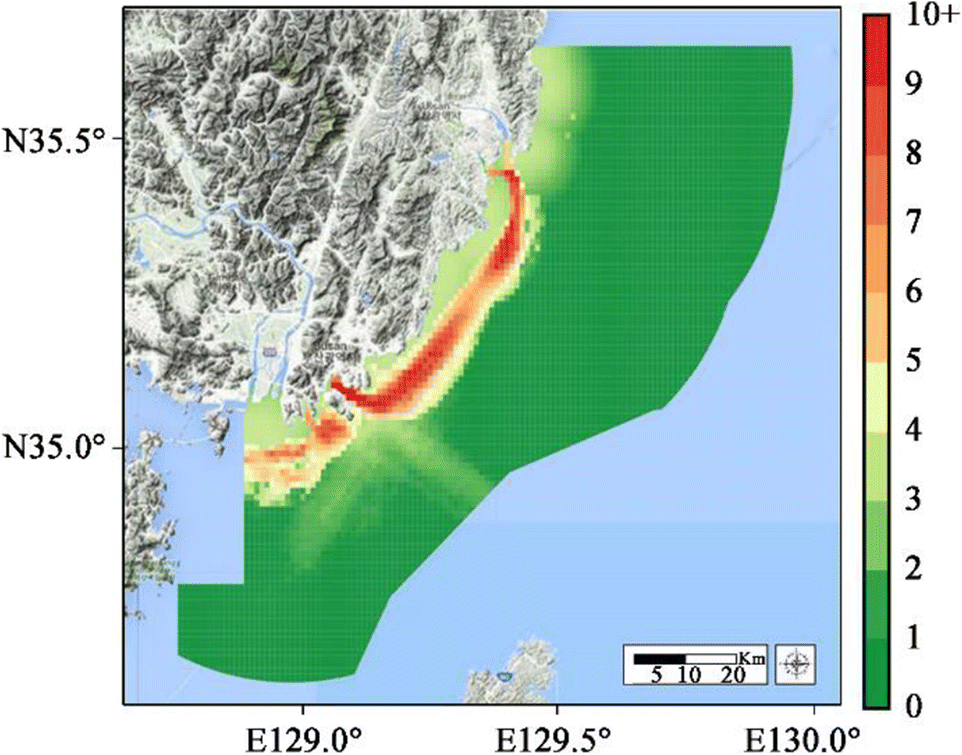 Figure 7 Final SRTD risk analysis map of the Busan–Ulsan sea areas (risk level)
The results indicate that the coastal route between Busan and Ulsan appeared to show a high risk level. The risk level of coastal areas is generally higher than that of oceanic areas. In particular, sea areas 7–10 km from Haeundae Beach and Songjeong Beach and 5 km from Ulju-gun Aquafarm showed the highest risk levels. The reasons for the high risk levels of the former areas were the high marine traffic density and three beaches along the coastline within short distances. The reasons for the latter areas were the large-scale aquafarm and nuclear power plant located within short distances. The coastal route between Busan and Gadeokdo was also evaluated to have an intermediate risk level. Although the traffic density in those areas is low, the large-scale aquafarm near Gadeokdo increases the risk level. For the ocean route toward Japan and the Pacific Ocean, the route density is high; however, the risk level is rather low because there are only a few sensitive resources nearby.
The existing risk map used by the KCG is derived from evaluating hazard, exposure, vulnerability, and resilience through approximately 35 indicators. Given that the map was intended to reflect various aspects of local community and capability of disaster management, as many indicators as possible were selected. However, those indicators are usually based on the census or long-period statistics, i.e., the resulting map was static and unsuitable for the detailed plan. In this study, the concept of traffic density was introduced to the risk analysis to provide a more microscopic point of view and scientifically improve the existing monitoring method, which was heavily dependent on human experience. Of the total 5599 cells in the study area, 5074 (90.6% of the total) were low-risk cells (levels 0–3), 253 were medium-risk cells (levels 3–6), and 273 were high-risk cells (level 6+) (Figure 8).
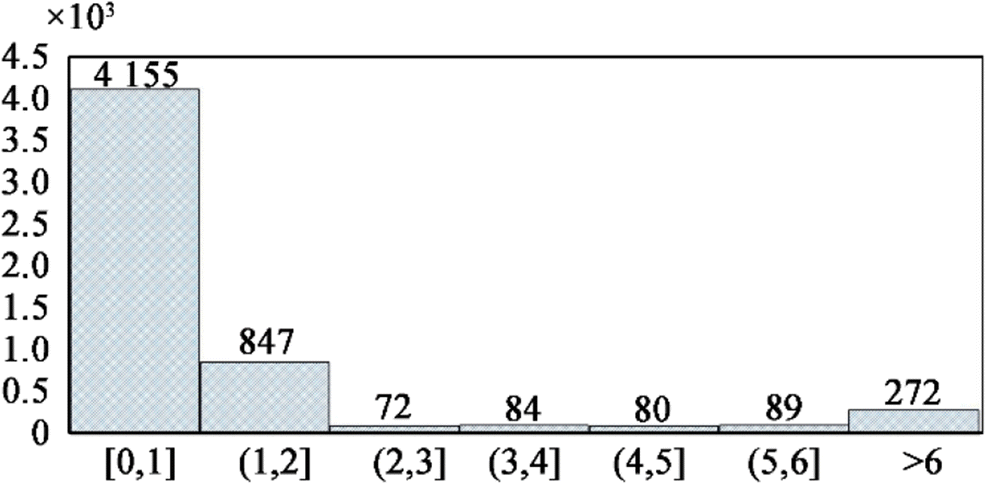 Figure 8 Cell distribution of risk level in the Busan–Ulsan sea areas
Through the analysis of the actual marine spill accidents that occurred in the Busan–Ulsan sea areas in 2018, the effectiveness of SRTD risk analysis was confirmed. From January 2018 to July 2018, there were a total of 11 marine spill accidents, i.e., two collisions, one stranding, two fires, one crew injury, two engine failures, and three simple spills, in the Busan–Ulsan sea areas (Figure 9).
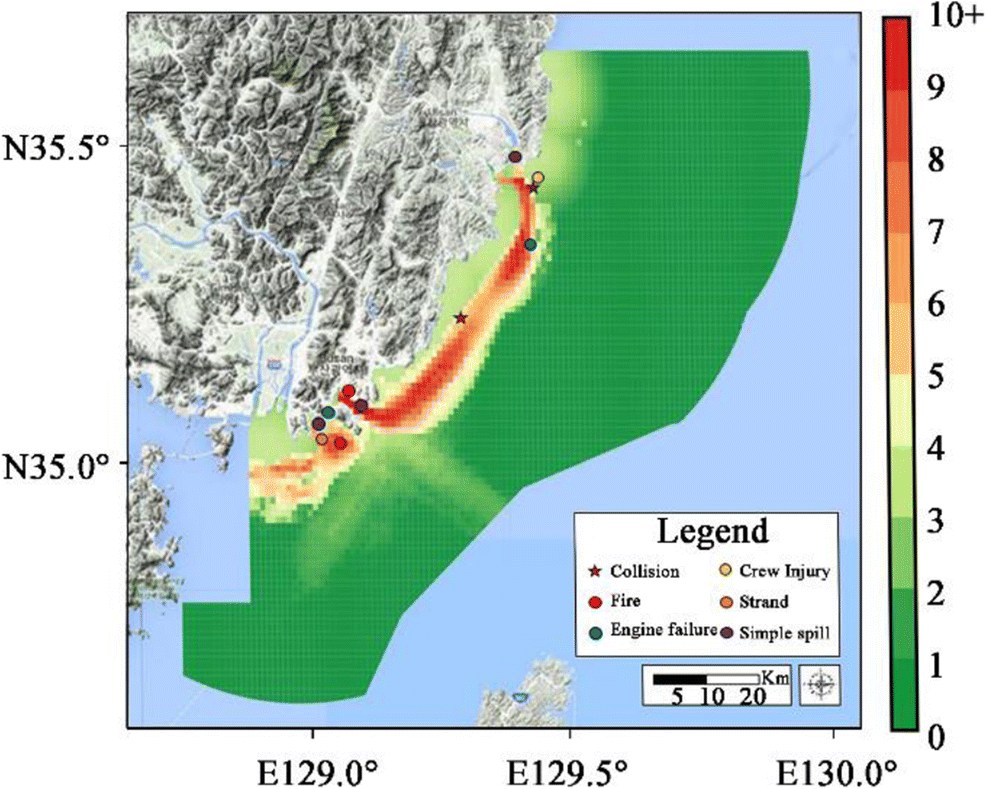 Figure 9 Mapping of the marine spill accidents that occurred in the Busan–Ulsan sea areas in 2018
According to the SRTD risk analysis, the average risk level of the entire Busan–Ulsan sea areas was 1.03, whereas the risk level of the cells where those marine spill accidents occurred was 4.27. An analysis of the risk level within a 1-km radius of the accidents showed an average of maximum neighbor risk level of 6.06. If the radius is further increased to 2 km, then the average of maximum neighbor risk level increases to 8.58, with a minimum level of 6. This means that all accidents occurred within a distance of up to 2 km from the cell analyzed at or above the high risk level (6+) (Table 3). Thus, it was able to nearly cover all of the accidents that occurred this year if the monitoring capability was concentrated in the area with high risk level (6+), which is only 6.45% of the total Busan–Ulsan sea areas. From the SRTD risk analysis conducted in this study, it is expected that the KCG can effectively prevent and prepare for marine spill accidents if they can concentrate their accident management and resource utilization capabilities on the basis of the results.
Table 3 Analysis of the maximum risk level of neighboring cells of the accident locationRadius(km) 0 1 2 Average 3.87 6.06 8.58 Minimum 2 2 6 4 Conclusion
This study developed a methodology for SRTD risk analysis that can analyze the microscopic risk level by combining a vulnerability map based on sensitive resources and a marine traffic density map through AIS big data analysis. The scalability of SRTD risk analysis was confirmed through a case study conducted in Busan. A comparative analysis of actual accident locations showed that the SRTD risk analysis can effectively assess and demonstrate risk level. The results obtained through this methodology are expected to become the scientific rationale for decision-makers to efficiently allocate limited resources and monitor capacity.
This methodology particularly showed how to analyze marine traffic density on the basis of AIS big data and using a preprocessing algorithm. The DBSCAN algorithm can effectively eliminate the outliers from large and inconsistent AIS big data and derive a vessel route. All of the procedures of this methodology can be automated and customized. The analysis period of the AIS big data can be adjusted according to the purpose and intention of the analyst. For example, in this study, the marine traffic density for 3 months was evaluated by collecting AIS big data from February 15, 2018, to May 15, 2018. However, if we analyzed the AIS big data for each month, the results may show how the monthly traffic density changes. From this perspective, the SRTD risk analysis can be used to conduct a dynamic analysis.
However, several limitations of the methodology proposed in this study should be noted. First, the number of indicators used is small. In fact, not only marine traffic density but also the actual amount of oil/chemical transported by each vessel, age of the vessel, and condition of the crew may affect the risk level as a hazard. Ocean climate will also play a key role with regard to hazard. To develop a dynamic and realistic risk analysis, further studies should consider other indicators proposed in this methodology. Second, there were many simplifications for sensitive resources used as vulnerability indicators. In this study, only the aquaculture sites, water intake facilities of power plants, and beach/resort areas in the KCG's sensitive resource categories were used as vulnerability indicators. However, in reality, there are many other sensitive resources. Furthermore, vulnerability levels are expected to be different for each resource. For example, a fish farm that is sensitive to environmental changes will have a considerable impact on accidents, which leads to a high vulnerability value. If the resources can resist pollution, then their vulnerability level should be low. In this study, all of the sensitive resources were assumed to have the same level of vulnerability, and the vulnerability value was assumed to decrease at the same rate according to the Euclidean distance from the resource cells. A detailed study of this topic needs to be conducted in the future.
In this study, the risk of the Busan–Ulsan sea areas was measured using only the AIS big data of the vessels entering and leaving Busan. To conduct a more accurate and comprehensive analysis of target sea areas, vessel data of Busan, Ulsan, Changwon, Geoje, and Japan should be applied altogether. Furthermore, if we can collect the AIS big data of every port and identify the future sensitive resources of the entire coastline, then the overall marine spill risk level of the Korean coastal region can be analyzed.
-
Figure 1 Conceptual framework scheme of SRTD risk analysis developed in this study
Figure 2 Study area of SRTD risk analysis of marine spill accidents in coastal areas of Busan–Ulsan. Maps are retrieved from Google Maps
Figure 3 DBSCAN-preprocessed AIS data of OCEAN STAR. The circle points in the cluster are valid, and the "x" marks outside the cluster are outliers
Figure 4 Procedure of constructing a marine traffic density map. Steps 3 and 4 are adopted from the study of Kim et al. (2014)
Figure 5 Resulting marine traffic density map of the Busan–Ulsan sea areas (number of gridded routes/km2)
Figure 6 Vulnerability map of sensitive resources in Busan–Ulsan sea areas (vulnerability value)
Figure 7 Final SRTD risk analysis map of the Busan–Ulsan sea areas (risk level)
Figure 8 Cell distribution of risk level in the Busan–Ulsan sea areas
Figure 9 Mapping of the marine spill accidents that occurred in the Busan–Ulsan sea areas in 2018
Table 1 Mapping index system for marine spill accidents
Objective Medium Parameter Marine spill risk (R) Hazard (H) Marine traffic density (H) Vulnerability (V) Aquaculture sites (VAC) Water intake facilities of Power plants (VI) Beach/resort areas (VT) Table 2 Representative sensitive resources in the Busan–Ulsan sea areas
ID Name Main products Category Longitude Latitude VAC1 Nakdong Estuary Delta Aquaculture Laver, seaweed Aquaculture resource 128.87404 35.02433 VAC2 Gijang-gun Aquafarm Zone 1 Seaweed Aquaculture resource 129.23567 35.21112 VAC3 Gijang-gun Aquafarm Zone 2 Seaweed Aquaculture resource 129.26301 35.28400 VAC4 Ulju-gun Aquafarm Shellfish, seaweed Aquaculture resource 129.36500 35.35522 VAC5 Ulsan Dong-gu Aquafarm Yellow tail, sea squirt Aquaculture resource 129.44509 35.49518 VAC6 Ulsan Buk-gu Aquafarm Yellow tail, sea squirt Aquaculture resource 129.45672 35.57402 VI1 Busan Natural Gas Power Station Electricity Industrial resource 129.00067 35.08669 VI2 Gori Nuclear Power Plant Electricity Industrial resource 129.29369 35.32359 VT1 Gwangalli Beach Tourism Tourism resource 129.11758 35.15182 VT3 Haeundae Beach Tourism Tourism resource 129.16048 35.15878 VT3 Songjeong Beach Tourism Tourism resource 129.20003 35.17851 Table 3 Analysis of the maximum risk level of neighboring cells of the accident location
Radius(km) 0 1 2 Average 3.87 6.06 8.58 Minimum 2 2 6 -
Akhtar J, Bjørnskau T, Jean-Hansen V (2011) Oil spill risk analysis of routing heavy ship traffic in Norwegian waters. WMU J Marit Aff 11(2): 233–247 Astiaso Garcia D, Bruschi D, Cumo F, Gugliermetti F (2013) The oil spill hazard index (OSHI) elaboration. An oil spill hazard assessment concerning Italian hydrocarbons maritime traffic. Ocean & Coastal Management 80: 1–11 Breithaupt SA, Copping A, Tagestad J, Whiting J (2016) Maritime route delineation using AIS data from the Atlantic Coast of the US. J Navig 70(2): 379–394 Cheong S (2010) A social assessment of the Hebei-Spirit oil spill. GeoJournal 76(5): 539–549 Cutter SL (1993) Living with risk: the geography of technological hazards. E. Arnold, London De Andrade MM, Szlafsztein CF, Souza-Filho PW, Araújo AD, Gomes MK (2010) A socioeconomic and natural vulnerability index for oil spills in an Amazonian harbor: a case study using GIS and remote sensing. J Environ Manag 91(10): 1972–1980 https://doi.org/10.1016/j.jenvman.2010.04.016 Ester M, Kriegel HP, Sander J, Xu X (1996) A density-based algorithm for discovering clusters in large spatial databases with noise. Paper presented at Kdd Fernández-Macho J, González P, Virto J (2016) An index to assess maritime importance in the European Atlantic economy. Mar Policy 64: 72–81 https://doi.org/10.1016/j.marpol.2015.11.011 Goerlandt F, Montewka J (2015) Maritime transportation risk analysis: review and analysis in light of some foundational issues. Reliability Engineering & System Safety 138: 115–134 Gundlach ER, Hayes MO (1978) Vulnerability of coastal environments to oil spill impacts. Mar Technol 12(4): 18–27 Hadzagic M, St-Hilaire MO, Webb S, Shahbazian E (2013) Maritime traffic data mining using R. In Information Fusion (FUSION), 2013 16th International Conference, IEEE. pp. 2041-2048 International Maritime Organization (2010). Formal safety assessment. Report of the Working Group on Environmental Risk Evaluation Criteria within the context of Formal Safety Assessment International Tanker Owners Pollution Federation (2016). The International Tanker Owners Pollution Federation Limited oil tanker spill statistics. http://www.itopf.com/fileadmin/data/Documents/Company_Lit/Oil_Spill_Stats_2016.pdf Kim K, Jeong JS, Park G (2014) A study on near-miss incidents from maritime traffic flow by clustering vessel positions. Journal of Korean Institute of Intelligent Systems 24(6): 603–608 https://doi.org/10.5391/JKIIS.2014.24.6.603 Korea Coast Guard (2009) Standard operating procedures manual Korea Coast Guard (2010) Research on the construction of coast guard system Korea Hydrographic and Oceanographic Agency (2011) Construction of coastal disaster vulnerability assessment system Korean Maritime Safety Tribunal (2018) Accidents Data. https://www.kmst.go.kr/ Korean Statistical Information Service (2018) Statistics Data. http://kosis.kr/ Kujala P, Hänninen M, Arola T, Ylitalo J (2009) Analysis of the marine traffic safety in the Gulf of Finland. Reliability Engineering & System Safety 94(8): 1349–1357 Lan D, Liang B, Bao C, Ma M, Xu Y, Yu C (2015) Marine oil spill risk mapping for accidental pollution and its application in a coastal city. Mar Pollut Bull 96(1–2): 220–225 Landquist H, Hassellöv I, Rosén L, Lindgren J, Dahllöf I (2013) Evaluating the needs of risk assessment methods of potentially polluting shipwrecks. J Environ Manag 119: 85–92 https://doi.org/10.1016/j.jenvman.2012.12.036 Lee M, Jung J (2015) Pollution risk assessment of oil spill accidents in Garorim Bay of Korea. Mar Pollut Bull 100(1): 297–303 https://doi.org/10.1016/j.marpolbul.2015.08.037 Mitchell JK (1989) Hazards research. In: Gaile GL, Willmott CJ (eds) Geography in America. Merill, Columbus, pp 410–424 National Logistics Information Center (2018) Statistics Data. http://www.nlic.go.kr/ Olita A, Cucco A, Simeone S, Ribotti A, Fazioli L, Sorgente B, Sorgente R (2012) Oil spill hazard and risk assessment for the shorelines of a Mediterranean coastal archipelago. Ocean & Coastal Management 57: 44–52 Pallotta G, Vespe M, Bryan K (2013) Vessel pattern knowledge discovery from AIS data: a framework for anomaly detection and route prediction. Entropy 15(12): 2218–2245 https://doi.org/10.3390/e15062218 Peterson J, Michel J, Zengel S, White M, Lord C, Park C (2002) Environmental sensitivity index guidelines: Version 3.0. Seattle, WA: US Dept. of Commerce, National Oceanic and Atmospheric Administration, National Ocean Service, Office of Ocean Resources Conservation and Assessment Hazardous Materials Response and Assessment Division Renner M, Kuletz KJ (2015) A spatial–seasonal analysis of the oiling risk from shipping traffic to seabirds in the Aleutian archipelago. Mar Pollut Bull 101(1): 127–136 https://doi.org/10.1016/j.marpolbul.2015.11.007 Roh Y, Kim C (2016) Methodology for selection and sensitivity index of socio-economic resources for marine oil spill incidents. Journal of Environmental Impact Assessment 25(6): 402–413 https://doi.org/10.14249/eia.2016.25.6.402 Ryu J, Kim J, Shin S, Park H (2016) The need of early response system to HNS accident based on case analysis. Engineering Challenges for Sustainable Future 143-146 Sepp Neves AA, Pinardi N, Martins F, Janeiro J, Samaras A, Zodiatis G, De Dominicis M (2015) Towards a common oil spill risk assessment framework–adapting ISO 31000 and addressing uncertainties. J Environ Manag 159: 158–168. https://doi.org/10.1016/j.jenvman.2015.04.044 Shahidul Islam M, Tanaka M (2004) Impacts of pollution on coastal and marine ecosystems including coastal and marine fisheries and approach for management: a review and synthesis. Mar Pollut Bull 48(7–8): 624–649 Silveira P, Teixeira A, Guedes Soares C (2013) Use of AIS data to characterise marine traffic patterns and ship collision risk off the coast of Portugal. J Navig 66(6): 879–898 https://doi.org/10.1017/S0373463313000519 Sormunen OE, Goerlandt F, Häkkinen J, Posti A, Hänninen M, Montewka J, Kujala P (2014) Uncertainty in maritime risk analysis: extended case study on chemical tanker collisions. Proceedings of the Institution of Mechanical Engineers, Part M. J Eng Marit Environ 229(3): 303–320 United Nations Department of Humanitarian Affairs (1993) Glossary: internationally agreed glossary of basic terms related to disaster management. United Nations, Geneva United Nations Development Programme (2004) Reducing disaster risk: a challenge for development. United Nations Development Programme. Bureau for Crisis Prevention and Recovery, New York Weslawski J, Wiktor J, Zajaczkowski M, Futsaeter G, Moe K (1997) Vulnerability assessment of Svalbard intertidal zone for oil spills. Estuar Coast Shelf Sci 44: 33–41 https://doi.org/10.1016/S0272-7714(97)80005-4