Formal Safety Assessment of a Marine Seismic Survey Vessel Operation, Incorporating Risk Matrix and Fault Tree Analysis
https://doi.org/10.1007/s11804-020-00136-4
-
Abstract
In maritime safety research, risk is assessed usually within the framework of formal safety assessment (FSA), which provides a formal and systematic methodology to improve the safety of lives, assets, and the environment. A bespoke application of FSA to mitigate accidents in marine seismic surveying is put forward in this paper, with the aim of improving the safety of seismic vessel operations, within the context of developing an economically viable strategy. The work herein takes a close look at the hazards in North Sea offshore seismic surveying, in order to identify critical risk factors, leading to marine seismic survey accidents. The risk factors leading to undesirable events are analysed both qualitatively and quantitatively. A risk matrix is introduced to screen the identified undesirable events. Further to the screening, Fault Tree Analysis (FTA) is presented to investigate and analyse the most critical risks of seismic survey operation, taking into account the lack of historical data. The obtained results show that man overboard (MOB) event is a major risk factor in marine seismic survey operation; lack of training on safe work practice, slippery deck as a result of rain, snow or water splash, sea state affecting human judgement, and poor communication are identified as the critical risk contributors to the MOB event. Consequently, the risk control options are focused on the critical risk contributors for decision-making. Lastly, suggestions for the introduction and development of the FSA methodology are highlighted for safer marine and offshore operations in general.Article Highlights• A cost-benefit assessment technique offered a practical and economical means to choose the optimum control measure in preventing and reducing the most critical hazard event in the studied area.• Knowledge from the literature review and expert's first-hand experience were incorporated in the study to identify all critical risk factors related to marine seismic survey operation in the North Sea.• Experts' knowledge aided in providing risk data and in the construction of failure paths. -
1 Introduction
Despite the latest efforts to encourage the use of renewable energy sources, the world at large still relies on crude oil and petroleum-based products (Patel et al. 2015). The world's rising demand on natural oil and gas, combined with the continued exhaustion of its reserves onshore, has prompted mariners inter alia to come up with a fit-for-purpose geodata acquisition, engineering pragmatism, and skills to carry out offshore developments.
These developments have advanced beyond the immediate continental shelf into water depths in excess of 3000 m (Schuler 2016; OET 2016). These developments also commonly require the use of sophisticated seismic vessels navigating about the surface of open water bodies, which let off small explosions to create seismic waves. These waves travel through into the earth and are reflected by subsurface formations, which then return to the surface where they are recorded by hydrophones.
The use of a seismic vessel in offshore surveys is the first and main step in oil and gas exploration and production (E & P) investment, and failure to carry out data acquisition is far too expensive than the potential gains. As an example, in 1982, the priciest dry hole in history was drilled in the Mukluk region, offshore Alaska, owing to the fact that explorations relied on prediction rather than carrying out a seismic survey of the area. In this futile exploration, approximately 1.5 billion USD was spent on a fruitless operation (Westwood 2006).
Seismic vessels come in various lengths and widths, stretching up to 100 m long and up to 40 m wide (Marine-Insight 2011). They tow streamers, sound detectors (hydrophones), and other various sensor technology equipment. On operation, seismic vessels tow streamers at a speed of 4 to 5 knots (approximately 9 km/h). At this rate, the survey vessel could possibly cover some 216 km in a day and nearly 6500 km in 1 month. As survey sizes are not usually greater than 200 km, the seismic vessel must turn at the end of each line before commencing the next in a grid pattern (IAGC 2011), making its navigation more challenging than other vessels (CHIRP-Maritime 2014). The seismic cables or streamers are towed behind the survey vessel, in order to transmit seismic data. The cables are spread by diverters, which can be pictured as a type of mid-water trawl door and can extend to over 500 m in width. It shows a schematic diagram of the towed instruments by a seismic vessel in Figure 1.
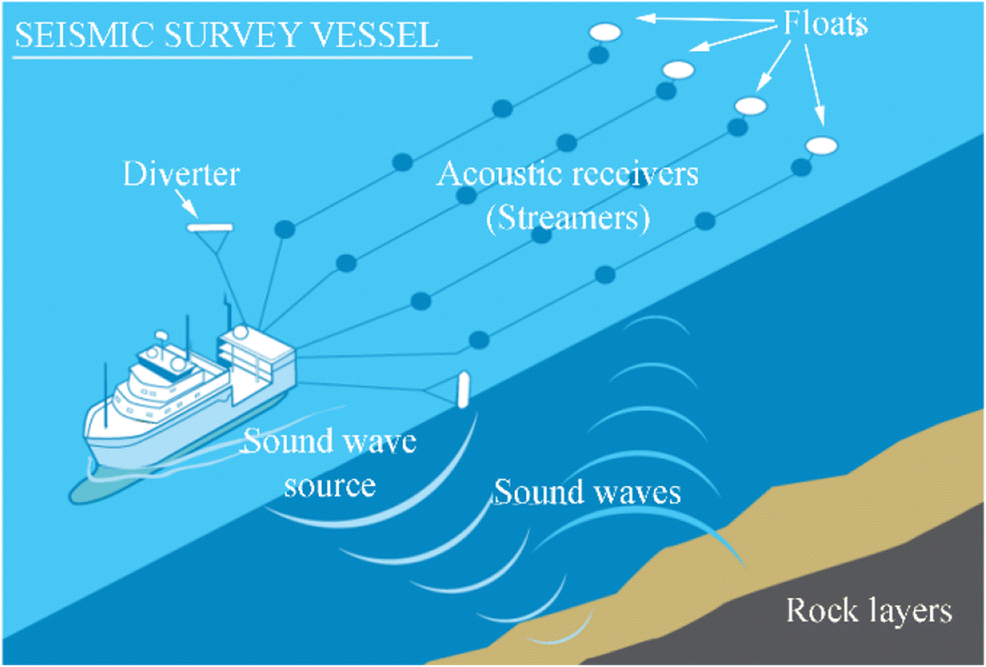 Figure 1 Seismic survey vessel with labelled instrument (Buchanan 2016)
The survey activity takes place with the rest of the other ocean activities in the area of oil field developments, namely, intense shipping and fishing operations. This last point underlines a significant threat to the safety of the crew and the on-/in-water seismic equipment (especially if the environment is not well investigated or assessed). Rough weather conditions have hampered huge exploration work in the past; for example, the Royal Dutch Shell Company failed to complete their exploration and production operation off the Alaska coast in 2015, partly because of the harsh environmental conditions after a few years of exploration (Eilperin and Mufson 2015).
In addition to weather conditions, location, timing, and duration of the survey can primarily affect the safety of marine seismic operation. Offshore Nigeria, for example, has better weather conditions compared to North Sea conditions in the UK. Hence, two identically sized surveys in these two regions could have significantly different durations and safety plans (IAGC 2011).
Apart from rough weather conditions, the likelihood of having other major hazard events in shipping such as rudder, propeller, and associated machinery damage leading to MOB, collision, and grounding are common and significant to marine seismic survey operations (Emmerson and Lahn 2012). Human error as a contributing factor leading to accidents has also largely contributed to seismic survey vessel accidents and near misses; an example that can be highlighted is the M/S Explorer, which sank in 2007 after reportedly striking ice in benign conditions due to a sequence of errors caused by the crew (JHC 2012). With the prevalence of major hazard events, different stakeholders and national regulators are proposing additional safety measures to reduce the high risk in marine seismic survey operation and shipping activities in general to a tolerable level.
This paper utilises notable risk analysis techniques such as risk matrix and FTA in assessing the risk in marine seismic survey operation. However, the outcome from the risk matrix technique will be further analysed and classified using an FTA technique. An FTA shows graphically basic causes of occurrence of an unwanted event (qualitatively), and estimates the occurrence likelihood or probability (quantitatively), and highlights the contribution of several causes leading to an unwanted top event (Ferdous et al. 2011). An FTA can analyse risks of a complex system with little or no historical accident data, by incorporating event probability estimates from experts. This is evident in its application in the nuclear, aerospace, and petrochemical industry (Suresh et al. 1996; Yuhua and Datao 2005; Hu 2016).
1.1 Formal Safety Assessment (FSA)
FSA methodology is incorporated in this study in order to achieve a reliable risk management structure. The idea of FSA was initially established in the 1990s, after the occurrence of a sequence of ship accidents. The first use of the FSA guidelines took place after the adoption of the 'Interim Guidelines' (IMO 1997); shortly after, the use of FSA was termed 'trial application'. The trial application of FSA and the test case of FSA for helicopter landing area (HLA) on cruise ships did not get consensus acceptance, this, leading to a series of amendments. The case of FSA for HLA carried out by Det Norske Veritas (DNV) for the first time led to the introduction of cost-benefit assessment (CBA) (Vassalos 2009), which was later accepted by the IMO and formed part of the FSA decision-making process.
Generally, the principles of FSA include identifying hazards, evaluating the risk related to the identified hazards, controlling the significant risks, and making a decision centred on CBA. The main aim of FSA methodology is the development of a framework of safety requirements for shipping, in which risks are tackled in an understandable and cost-effective manner (Ikeagwuani and John 2013).
However, there are criticisms that FSA studies confuse 'cause' and 'effect' and failing to determine the root cause of a hazard event (Psaraftis 2012); this setback was revealed in Germany in MSC 86 (Parsons 2016). Collision and grounding, fires, and explosions, for example, are the product of an accident; if these are wrongly categorised as initiating events in a hazard identification (HAZID) stage, the HAZID process and, of course, the entire FSA study would be at a fault. Hence, the entire focus of FSA being a proactive practice of preventing and controlling risk might be invalid. Methods to circumvent this FSA drawback have been suggested; possible methods include the use of Bayesian network (BN) modelling (Haapasaari et al. 2015) and the use of the human reliability assessment (HRA) model (Redmill 2002). Another method is also suggested which involves the use of the failure modes and effect analysis (FMEA) and FTA technique. These both initially identify and list all the possible failures (cause) that could happen subjectively and then make an assessment of the consequences (effect) of each failure (Long and Hillman 2014). These techniques offer a full picture of the problem in a wider context.
Nevertheless, the FSA process is dependent upon subjective judgement, that is, the expert(s) conducting the risk assessment (IMO 2018). There exist lapses on the side of expert utilising any method they can to justify a particular FSA portion, as current FSA guidelines permit FSA expert considerable leeway in their choice of which FSA methodologies to utilise (Parsons 2016). If there are no guidelines put in place to curtail this, then the role of the entire FSA could be weakened and arguably negated.
The use of expert judgement is considered to be an important element within the FSA methodology (IMO 2018); however, the heavy reliance on expert's input (Kontovas and Psaraftis 2009) could potentially lead to a biased judgement. This, coupled with the possibility of data manipulation, could compromise both the FSA's goal of being transparent and the integrity of the whole process.
Despite these shortcomings of FSA, it on its own has gone through critical scrutiny and has been used as a successful tool in various projects. For example, a European Commission project, 'Design, Operation and Regulatory Project for Safety' (SAFEDOR, 2005–2009), produced a case study, and the demonstration of an FSA study has been presented in a published book 'Risk-Based Ship Design' (Papanikolaou 2016).
Since 2009, several researchers have successfully carried out the application of FSA methodology to different aspects of safety in shipping while consolidating the drawbacks with modern risk analysis techniques. Zhang et al. (2011) successfully applied FSA to navigational risk evaluation of the Yangtze River. In order to improve the navigational safety in the Yangtze River, the author estimated the navigational risk of the Yangtze River using the FSA concept and incorporated BN technique to address the issue of cause and effect confusion while tackling the issue with expert judgement. Vidmar and Perkovič (2018) applied FSA methodology in the systematic risk assessment of crude oil tankers, potential hazards were analysed with structured methods such as HAZID and HAZOP, and the author finalised the assessment using event trees to decipher the confusion of cause and effect in the application of FSA methodology. Other researchers who addressed the issue of cause and effect and the issues with expert judgement include Görçün and Burak (2015), Sniegocki (2014), and Hakan et al. (2013).
Since the adoption of FSA in the 1990s and the approval in 2002, an increasing number of publications relating to FSA applications have been published but with limited literature on the application of the FSA methodology on marine seismic survey vessel operation. The dovetailing of the two quantitative risk analysis methods (risk matrix and FTA) with the FSA framework as employed in this paper contributes to both the risk analysis literature and the concerned industry. In addition to the significance of this paper, a complex marine seismic survey operation with dynamic risk is simplified, using the two aforementioned quantitative risk analysis methods.
1.2 Handling Uncertainty in Risk Matrix and Fault Tree
Risk matrix and FTA require event data (frequency and consequence severity for risk matrix), as input to carry out a comprehensive quantitative risk assessment (QRA) for a process system. This input can be categorised into two types in the uncertainty analysis, namely, the aleatory and the epistemic uncertainty. The former refers to the uncertainty of input arising from randomness due to inherent variability in the system, while the latter refers to the uncertainty of input arising from lack of knowledge/information, such as event data from expert judgement (Sun et al. 2018).
When input data is readily available, a probability distribution can be correctly used to represent the aleatory uncertainty, but when input data is very scarce, a probabilistic representation of epistemic uncertainty from expert knowledge could be misleading (Zio 2008). To overcome the probabilistic representation of epistemic uncertainty arising from expert knowledge, most researchers have in recent times incorporated Bayesian subjective probability in their risk analysis studies. Nevertheless, an alternative method has recently been proposed that involves evidential reasoning (ER) with fuzzy sets (Yang et al. 2018; Aven 2016) or a combination of Bayesian network (BN) with Fuzzy ER (Yazdi and Kabir 2018). The fuzzy sets are associated with the interval distribution of probabilistic data, whose elements have degrees of membership to represent the strength of an expert's opinion, to enlighten the risk analyst or decision-maker. The risk analysis outcomes are then summarised in not only risk or probability P but likewise the pair (P, DoB), where DoB offers some qualitative measures of the strength of the opinion supporting the risk probability, P. Fuzzy set approach might offer a useful way to solve the impression of input data regarding the fluctuation of parameters (Alyami et al. 2019; Suresh et al. 1996).
Most risk matrix and FTA studies utilise a single value probability estimate in risk analysis, which contradicts the suggestions of handling input data uncertainties. However, in the application of single value probability estimate using the risk matrix and FTA techniques in this research, much effort has been made in the careful selection of experts with a reasonable wealth of experience in the subject. The careful selection of experts offers the confidence that hazard event data are judged with care. In the event of the non-existence of data or incompleteness in hazard event data, experts assign a 'zero' value. This idea of scoring 'zero' for incomplete data has been attempted in several risk analysis and decision-making studies such as Xu and Yang (2001) and Lee and Yang (2017).
The above idea of utilising a single value risk probability estimate in risk matrix and FTA has been criticised in the past, but recently, in a marine risk assessment study, authors found out that the calculated fuzzy risk values were consistent with the results of a single value estimate using the risk matrix technique (Abdussamie et al. 2018). Despite this finding, a number of alternative representation structures to deal with the probabilistic representation of epistemic uncertainty are presented, but not discussed herein; they are the following: Bayesian network (Cai et al. 2019), evidence theory (Curcurù et al. 2012), fuzzy set theory (Komal 2015), possibility theory (Roger Flage et al. 2013), and interval analysis (Oliveira et al. 2016).
1.3 Research Hypothesis
This research is carried out in response to the assumption that the shortage of statistical accident data poses a challenge to analyse risks in a marine seismic survey operation. The research is also carried out in response to the assumption that operational risk control strategy in the form of training and retraining of crew members on how to avoid accidents is not an effective risk control measure to mitigate risks in a marine seismic survey operation. However, the above assumptions presented before the research enabled an opening to further research, and hence, the initial assumptions may be overruled in favour of a more convincing risk analysis approach and a more practical risk control strategy. Consequently, the study's reproductive logic has been modified, and it is based finally on the hypothesis that risk matrix and FTA techniques can address risk by taking risk data from specialists with the first-hand experience in marine seismic survey operation. In addition, both operational and engineering risk control strategies have a role to play in mitigating risks of a marine seismic survey operation.
2 Formal Safety Assessment
As described previously, FSA is a structured and systematic methodology, aimed at enhancing maritime safety, including protection of lives, marine environment, and assets, by using risk analysis and cost-benefit evaluation. FSA can be used as a tool to help in the evaluation of new and existing regulations for maritime safety and protection of the marine environment (Carlos Guedes 2010). It serves as a tool for making a comparison between existing and possibly improved regulations, with a view to achieving a balance between the various technical and operational issues, including human element, and the inherent costs in carrying out safety plans (IMO 2015a).
Any risk assessment approach to maritime safety regulation is often faced with four challenges, and an effective approach should hold these in focus:
1 Systematic: the ability to be implemented using a formal and structured process
2 Proactive: the ability to identify envisaged hazards rather than respond after accidents have happened
3 Transparent: the ability to be clear in the safety level achieved
4 Cost-effective: the ability to find a balance between risk reduction and economic benefits, for the key stakeholders of the proposed risk control measures
The FSA framework provides a platform to conform to the above four maritime safety standards. The steps in FSA are:
1 Identification of hazards
2 Risk estimation
3 Identification of risk control options
4 Cost-benefit analysis (CBA)
5 Recommendation for decision-making
From the above FSA steps, a functional component in an FSA technique is shown in Fig. 2 as presented by IACS in MSC's 75th session in 2002. This risk management approach employs a risk-based technique, which looks quite similar to the offshore QRA procedures, but the actual contents, methods (Bai and Jin 2016), and tools of each FSA step can be quite different (Yong and Wei-Liang 2016).
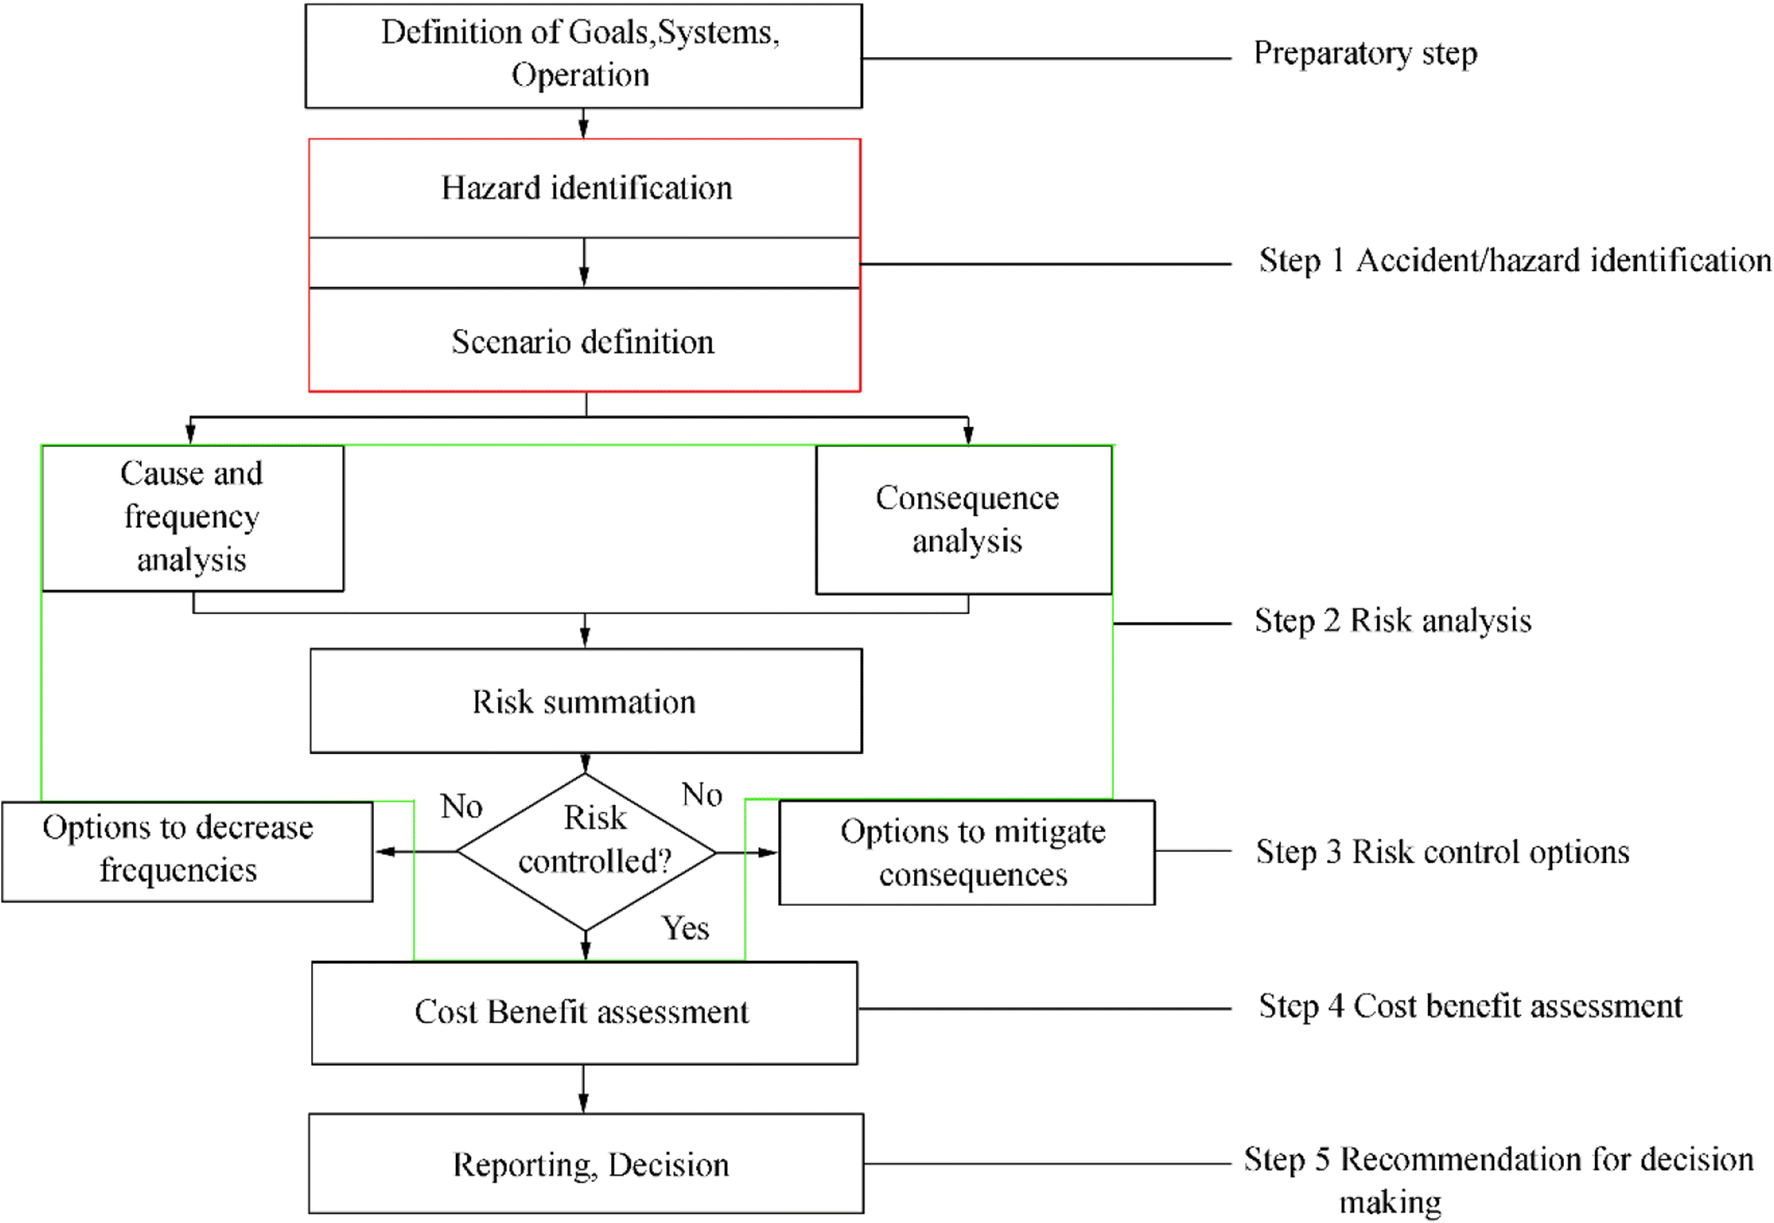 Figure 2 FSA flow chart (MSC 2002)
3 Risk Assessment and Management of a Seismic Survey Vessel Operation
3.1 Preparatory Step
Before initiating the FSA process, the definition of the problem is elaborated with respect to the system, goal, and operation. The purpose of defining the problem is to access the problem carefully with respect to the regulations under review; this in return will assist in determining the extent and depth of the FSA application. This preparatory step is given to all FSA applications; this is important because a misguided definition on a system such as a vessel operation may lead to insufficient recommendations, which in turn may eliminate major risk categories from the system being assessed. This step helps to simplify the goal of the assessment. The goal of the present study will include the consideration of major accidents that have occurred in the North Sea during a marine seismic survey operation.
3.2 Step 1 Hazard Identification
Hazard Identification (HAZID) is a systematic process of identifying hazards and their related events, which could give rise to a significant consequence to personnel, environment, or asset. The focus in HAZID is to ensure that the process is proactive and not confined only to hazards that have materialised in the past (IMO 2012).
This process typically consists of structured group reviews, and experience has proved that the group of experts involved in the HAZID can apply any technique to identify the causes and effects of accidents and the relevant hazard events (Loughran et al. 2002).
The expert judgement methodology, as used in this paper, is divided into three stages:
• Choosing experts
• Elicitation
• Aggregation
The elicitation stage refers to the process of proposing opinions or expert judgements through different means. This is typically supplied through interviews and/or questionnaires. The aggregation phase is the means of taking the average or converging of the different expert opinions offered in the study (Endrina et al. 2018).
3.2.1 List of Hazards
In many cases of identifying marine seismic survey operation hazards and its leading events, a huge amount of information is either incomplete or totally lacking; thus, it is often difficult to identify all hazard events. Consequently, after a pre-elicitation meeting with the co-authors of this study, five sufficiently experienced North Seafarers and managers of marine seismic survey companies in the UK were contacted. These experts contributed their knowledge and opinions through telephone interview on developing the risk matrix approach used in this paper and determining the hazard category and subcategory. Table 1 shows the significant hazard category in a marine seismic survey operation.
Table 1 Hazard event categoryHazard category Source Man overboard Telephone interview Fires and explosion Telephone interview Loss of hull integrity Telephone interview Collision/contact Telephone interview Towed array entanglement Telephone interview Heavy weather damage Telephone interview The data sets obtained from the HAZID process related to hazard events in a marine seismic survey vessel operation are converted into quantitative values. In order to prioritise the risk level of the identified hazard events, a hazard screening process is conducted to quantify the occurrence and the severity of the consequences of each hazard event in Table 1.
3.2.2 Hazard Screening
Risk Matrix The risk matrix approach, which prioritises hazards, is used in the hazard screening process. This risk-based technique appeals to both non-professionals and risk specialists to stress the uncertainty in risk statements. A risk matrix describes risk in a graphical manner and belongs to the set of probability consequence diagrams (Ale et al. 2015). It is used in risk assessment to define the level of risk by considering the category of likelihood (or probability or frequency), against the category of consequence (or severity). Risk matrices are globally used in risk management and often a regular feature in different risk management standards and guidelines. Risk matrix remains popular and often utilised in the informative sections of several international standards such as IEC (2006) and ISO (2010). They are also being used as formal corporate risk acceptance criteria, and only recently, risk specialists have highlighted some drawbacks of the risk matrix utilisation (Duijm 2015) such as risk ties (Ni et al. 2010). Despite the drawbacks of the risk matrix approach, Ruge (2004) depicts how a single risk matrix technique gained the status of a corporate framework, leading to a risk management decision-making methodology throughout a large business enterprise. Risk matrix still serves as a simple tool to increase the viewer's perception of risks and assist in management decision-making.
The risk matrix approach provides a traceable structure for a clear consideration of the consequence and frequency of the identified hazard events. This approach uses a matrix, which divides the dimension of frequency (F) of the hazard events and the consequence (C) into categories. F and C categories are provided for each hazard event, in order to have a clear evaluation.
In the risk matrix hazard screening, a five-scale dimension is used for the frequency and consequence assignments as shown in Tables 2 and 3.
Table 2 Frequency assignment (Lois et al., 2004)Assigned rating If the frequency is: 1 Remote = might occur once in a lifetime 2 Occasional = might occur once every 1 to 5 years 3 Likely = might occur up to 5 times per year 4 Probable = might occur monthly or weekly 5 Frequent = might occur daily Table 3 Consequence severity assignment (Lois et al., 2004)Assigned rating If the impact could be: 1 Negligible = injury not requesting first-aid 2 Minor = injury requesting first-aid 3 Significant = injury requesting more than first-aid 4 Critical = severe injury 5 Catastrophic = loss of life, vessel, extreme environmental impact The combination of frequency and the consequence in Table 4 will help to provide a risk ranking number (RRN) for each identified hazard event (Loughran et al. 2002), thus prioritising risks according to their importance. In the risk matrix formulation, it is logical that the discrete 'C' and 'F' categories are placed in order along the ordinates (sides) of the risk matrix, that is, the frequency categories should be ranked from F1 (remote) to F5 (frequent), and the consequence category should be ranked from C1 (negligible) to C5 (catastrophic). See Table 4 for clarification.
Table 4 Risk matrix (Wang and Pillay 2003)Consequences Frequency F1 F2 F3 F4 F5 C1 Negligible 1 2 3 4 5 C2 Minor 2 3 4 5 6 C3 Significant 3 4 5 6 7 C4 Critical 4 5 6 7 8 C5 Catastrophic 5 6 7 8 9 The combination of Cn and Fn amounts to the risk estimate:
$$ R{\rm{ = }}{C_n} \times {F_n} $$ where n = 1, 2, 3, 4, 5.
Because of the consequent shortage of statistical data of hazard events in marine seismic survey operation, expert opinion will be relied on for the actual evaluation of the frequency and consequence of each hazard event category given in Table 1. See Table 5 for a summary of the experts' background.
Table 5 Expert backgroundExpert Industry Experience A UK marine geophysical services company 20 years of industrial experience, charter engineer status B UK marine geophysical service company 20 years of industrial experience, charter engineer status C UK marine geophysical services company 20 years of industrial experience, charter engineer status D UK marine geophysical services company 24 years of industrial experience, HND status E UK marine geophysical services company 21 years of industrial experience, HND status The Delphi method is utilised herein to obtain information from the experts through a developed questionnaire. This method of getting input data has also been used by several researchers such as Nyman et al. (2010). Since there were no huge discrepancies in the collected questionnaire results, an integer input was recorded from their converged judgements. Tables 6, 7, 8, 9, 10, and 11 are established to give a clear representation of the final expert judgement for the identified hazard event categories.
Table 6 Man overboard ranking using risk matrix table (converged expert judgement)Accident: man overboard Operational subcategory Crew embarking Manoeuvring (harbour) At sea (coastal) Manoeuvring in a grid pattern at sea Crew disembarking Slippery deck F2/C2 = 3 F2/C3 = 4 F3/C4 = 6 F5/C5 = 9 F2/C2 = 3 Fatigue F2/C2 = 3 F2/C3 = 4 F3/C4 = 6 F4/C5 = 8 F4/C3 = 6 Corroded railing F3/C2 = 4 F3/C2 = 4 F3/C3 = 5 F3/C5 = 7 F3/C2 = 4 Breaking waves F1/C1 = 1 F2/C1 = 2 F4/C3 = 6 F4/C4 = 7 F1/C1 = 1 Poor communication F2/C2 = 3 F2/C3 = 4 F2/C3 = 4 F2/C4 = 5 F2/C2 = 3 Table 7 Fire ranking using risk matrix table (converged expert judgement)Hazard: fire Operational subcategory Crew embarking Manoeuvring (harbour) At sea (coastal) Manoeuvring in a grid pattern at sea Crew disembarking Navigational bridge F1/C1 = 1 F1/C1 = 1 F1/C1 = 1 F1/C1 = 1 F1/C1 = 3 Engine room F2/C2 = 3 F2/C2 = 3 F4/C4 = 7 F4/C4 = 8 F2/C2 = 3 Storage space F2/C3 = 4 F2/C3 = 4 F3/C4 = 6 F3/C4 = 6 F1/C3 = 4 Back deck F1/C1 = 1 F2/C1 = 2 F4/C3 = 6 F4/C4 = 7 F1/C1 = 1 Crew accommodation F2/C2 = 3 F3/C3 = 4 F2/C3 = 4 F2/C3 = 4 F2/C2 = 3 Table 8 Loss of hull integrity ranking using risk matrix table (converged expert judgement)Hazard: loss of hull integrity Operational subcategory Crew embarking Manoeuvring (harbour) At sea (coastal) Manoeuvring in a grid pattern at sea Crew disembarking Hull plating F3/C1 = 3 F3/C2 = 4 F3/C2 = 4 F3/C2 = 4 F3/C1 = 3 Framing F3/C1 = 3 F3/C2 = 4 F3/C2 = 4 F3/C2 = 4 F3/C1 = 3 Bulkheads F3/C1 = 3 F3/C2 = 4 F3/C2 = 4 F3/C3 = 5 F3/C1 = 3 Welds and joints F4/C1 = 4 F3/C2 = 4 F4/C2 = 5 F4/C2 = 5 F4/C1 = 4 Doors F4/C1 = 4 F4/C2 = 5 F4/C2 = 5 F4/C3 = 6 F4/C1 = 4 Penetrations F5/C1 = 5 F5/C1 = 5 F5/C2 = 6 F5/C2 = 6 F5/C1 = 5 Windows F4/C1 = 4 F4/C1 = 4 F4/C2 = 5 F4/C2 = 5 F4/C1 = 4 Table 9 Collision/contact ranking using risk matrix table (converged expert judgement)Hazard: collision/contact Operational subcategory Crew embarking Manoeuvring (harbour) At sea (coastal) Manoeuvring in a grid pattern at sea Crew disembarking Berthing F3/C2 = 4 Departure F4/C2 = 5 Manoeuvring F5/C2 = 6 F3/C4 = 6 Seismic exploration F2/C2 = 3 F5/C3 = 7 Entering harbour F5/C2 = 4 Manoeuvring close to berth F5/C2 = 6 Shutdown F4/C2 = 5 Abnormal operation F4/C2 = 5 F4/C2 = 5 F4/C3 = 6 F4/C3 = 6 F4/C1 = 4 Anchored F5/C2 = 6 Table 10 Towed array entanglement rankings using risk matrix table (converged expert judgement)Hazard: towed array entanglement Operational subcategory Crew embarking Manoeuvring (harbour) At sea (coastal) Manoeuvring in a grid pattern at sea Crew disembarking Launching of equipment F3/C2 = 4 F4/C3 = 6 Seismic full exploration F3/C2 = 4 F5/C4 = 8 Retrieving seismic equipment F4/C2 = 5 F4/C4 = 7 Table 11 Heavy weather damage ranking using risk matrix table (converged expert judgement)Hazard: heavy weather damage Operational subcategory Crew embarking Manoeuvring (harbour) At sea (coastal) Manoeuvring in a grid pattern at sea Crew disembarking Berthing F1/C1 = 1 F1/C1 = 1 Departure F1/C1 = 1 F1/C1 = 1 Manoeuvring F2/C1 = 2 Seismic exploration F2/C2 = 6 F4/C4 = 7 Entering harbour F1/C2 = 2 Abnormal operation F1/C1 = 1 F2/C2 = 3 F3/C3 = 5 F4/C3 = 6 F1/C1 = 1 Anchored F1/C1 = 1 F1/C1 = 1 Risk levels are assessed by the RRNs ranging from 1, which is the lowest risk level having least frequency and least consequence, to 9 which is the highest risk level having the most frequent risk and the most severe consequence. Table 12 depicts the number of times each RRN appears within a hazard event category. For instance, RRN 4 appears 7 times for the MOB hazard category.
Table 12 Number of occurrences of each ranking score (six accident categories)RRN No. of occurrence for hazard category Man overboard Heavy weather damage Towed array entanglement Contact and collision Loss of hull integrity Fire 4 7 – 2 3 16 6 5 2 1 1 4 10 – 6 4 2 1 6 – 3 7 2 1 1 1 – 2 8 1 – 1 – – 1 9 1 – – – – – 3.2.3 Equivalent Total
The RRN is considered for each hazard event category at different generic locations; this consideration leads to the formulation of the equivalent total (ET) to give the accident category an index number, which will later be employed to rank the hazard event categories. The outcome of the ET will help to determine allocation of resources to prevent or reduce the risk associated to each hazard event. According to MSC (1997), the ET calculation makes use of the fact that both the severity and frequency bands of the risk matrix are approximately logarithmic (e.g., a risk level of 8 is treated as 104, if the risk level 4 is used as the base). Therefore, using 4 as the base:
$$ \begin{array}{l} {\rm{Man\;overboard\;ET}}\\ \;\;\;\;\;{\rm{ = }}4{\rm{ + log}}\left( {7{\rm{ + }}20{\rm{ + }}400{\rm{ + }}2000{\rm{ + }}10000{\rm{ + }}100000} \right){\rm{ }}\\ \;\;\;\;\;{\rm{ = }}9.05 \end{array} $$ $$ \begin{array}{c} {\rm{Heavy\;weather\;damage\;ET}} = 4 + {\rm{log}}\left( {0 + 10 + 200 + 1000} \right)\\ = 7.08 \end{array} $$ $$ \begin{array}{l} {\rm{Towed\;array\;entanglement\;ET}}\\ \;\;\; = 4 + {\rm{log}}\left( {2 + 10 + 100 + 1000 + 10000} \right) = 8.05 \end{array} $$ $$ \begin{array}{c} {\rm{Contact\;and\;collision\;ET}} = 4 + {\rm{log}}\left( {3 + 40 + 600 + 1000} \right)\\ = 7.22 \end{array} $$ $$ {\rm{Loss\;of\;hull\;integrity\;ET = }}4 + {\rm{log}}\left( {16 + 100} \right) = 6.06 $$ $$ {\rm{Fire\;ET = }}4 + {\rm{log}}\left( {6 + 300 + 2000{\rm{ + }}10000} \right) = 8.09 $$ A summary of the above calculation is presented in Table 13.
Table 13 Equivalent totalHazard category Man overboard Heavy weather damage Towed array entanglement Contact and collision Loss of hull integrity Fire Equivalent total 9.05 7.08 8.05 7.22 6.06 8.09 From the above hazard screening, the 'man overboard' hazard is seen as the most significant hazard event with an equivalent total of 9.05 followed by 'Fire' (see Table 13). Further risk estimation will prioritise 'man overboard', followed by 'fire', 'towed array entanglement', 'contact and collision', 'heavy weather damage', and lastly 'loss of hull integrity'. A full-scale risk estimation of all the hazard events would be too large in volume; hence, further analysis will only focus on the 'man overboard'. Safety engineers can use the preceding analysis on 'man overboard' as a reference to analyse other risks in other shipping operations.
3.3 Step 2 Risk Estimation
The main objective of carrying out risk estimation is to provide an explicit investigation of the causes and the consequences (effect) of the most significant hazard event identified in Table 13. The purpose of this is to give proper attention to high-risk areas and focus on factors, which affect the level of risk (IMO 2002).
In risk estimation, fault tree analysis (FTA) is considered one of the most important probabilistic and logical techniques, which operates with either expert knowledge or historical data inputs (Ahmed Ali et al. 2013). Further analysis will involve the application of the FTA technique.
3.3.1 Fault Tree Analysis
FTA is a safety/risk analysis technique that has been used in handing both quantitative and qualitative risk assessment problems. FTA is a top-down approach that systemically considers the contributing events at levels below the top level (Lavasani 2010). It is a logical reasoning approach and can be applied to a system of any size for risk assessment purposes (Godaliyadde et al. 2009).
FTA is constructed with 'AND' or 'OR' gate logic to depict the causes of failure of an event. The 'AND' gate is used to connect the causes of failure of an event if the causes happen simultaneously, while the 'OR' gate is employed if the causes of failure of an event happen directly (i.e. not simultaneously). The logic gates determine the addition or multiplication of probabilities to obtain the values for the top event (Lavasani 2010).
A fault tree (FT) computer application can aid in carrying out calculations in FTA, and this can be used in addressing probabilities of event occurrence associated with risk assessment of a system. Isograph (2015) incorporating fault tree+ will be used to analyse the risk of MOB considering the important initiating events.
FTA has gained popularity in the nuclear, aerospace, and petrochemical industry in comprehending system reliability (Yuhua and Datao 2005). FTA can analyse risks from a complex system by combining expert knowledge with its use. Although it has some drawbacks, it is also preferred over some risk analysis techniques in the sense that it shows graphically basic causes of occurrence of a hazard event (qualitatively), estimates the likelihood or probability (quantitatively), and highlights the contribution of several causation factors leading to the top event. The graphical representation of events in FTA appeals to both non-professionals and risk specialists.
A major setback with the application of the FTA technique is in its inability to show or analyse the dependencies of dynamic events. This limitation has led to the extension of the FTA technique with a model-based dependability analysis. Kabir (2017) reveals a more detailed insight concerning the working mechanism of this extension. Nevertheless, in this research, FTA technique fits better than other techniques mainly because it provides a logical hierarchy for analysing the risk factors influencing marine seismic survey vessel operation. The FTA technique also allows experts to understand the relationship between their judgements to provide useful insights when executing their hazard event probability judgement.
Expert Judgement in the FTA Construction: a Case Study The five experts mentioned in Section 3.2.2 and in Table 5 were also interviewed to share their first-hand experience and provide hazard event input for the MOB FT construction of a prospect project in the North Sea area. From the telephone interview session, a consensus was reached: the MOB incident could occur because of human error, insufficient organisation policy, or uncontrollable reasons. Human error contribution could occur because of the lack of experience of a new crew member, sea state affecting human judgement, and fatigue from prolong working hours or because of poor communication. Insufficient organisation policy could occur because of either lack of strict use of alcohol on board ship and/or lack of training on safe work practice and/or congested workspace. Uncontrollable reasons could be in the form of entangled in-water cable, slip/fall, or sea state causing violent ship movement. Slip/fall could occur because of a slippery deck as a result of rain, snow or water splash, or poor lighting conditions. The construction of the FT diagram also agrees to a seismic survey MOB accident reported by IAGC (2013).
The average probabilities of the 11 basic events can be obtained. For example, to obtain the probability of 'slippery deck as a result of rain, snow, or water splash' happening during a seismic survey operation, the average probability would be calculated using the subjective data provided by the five experts and represented in Table 14. Note that some concerns regarding the single value probability estimate utilised in this section have been dealt with and discussed in Section 1.2.
Table 14 A sample of the subjective data utilised in analysing the risk of MOB in the North SeaBasic event Expert Probability of a basic event happening per 1000 ships in a year (probability scale = 0–10) Slippery deck as a result of rain, snow, or water splash A 3.35 B 6 C 3.5 D 5 E 4.65 Average prior probability 4.5 or 4.5×10⁻³ The average prior probabilities of the remaining 10 basic events occurring in the North Sea per 1000 ships in a year as provided by the five experts are presented in Table 15.
Table 15 Expert judgement of the probability of basic eventsCut set abbreviation Basic event Probability of a basic event happening per 1000 ships in a year (probability scale = 0–10) X1 Lack of experience of a new crew member 2.5×10−5 X2 Sea state affecting human judgement 1.5×10−3 X3 Fatigue from prolong working hours 3.0×10−4 X4 Poor communication 5.0×10−4 X5 Lack of strict use of alcohol on board ship 8.0×10−4 X6 Lack of training on safe work practice 9.0×10−3 X7 Congested workspace 2.5×10−5 X8 Entangled in-water cable 9.0×10−4 X9 Slippery deck as a result of rain, snow or water splash 4.5×10−3 X10 Poor lighting facilities 9.0×10−4 X11 Sea state causing violent ship movement 1.7×10⁻³ These hazard event data are recorded in the isograph computer application (Isograph 2017) to analyse the risk of MOB. With the given data from the experts, the result of the FTA is represented in Fig. 3.
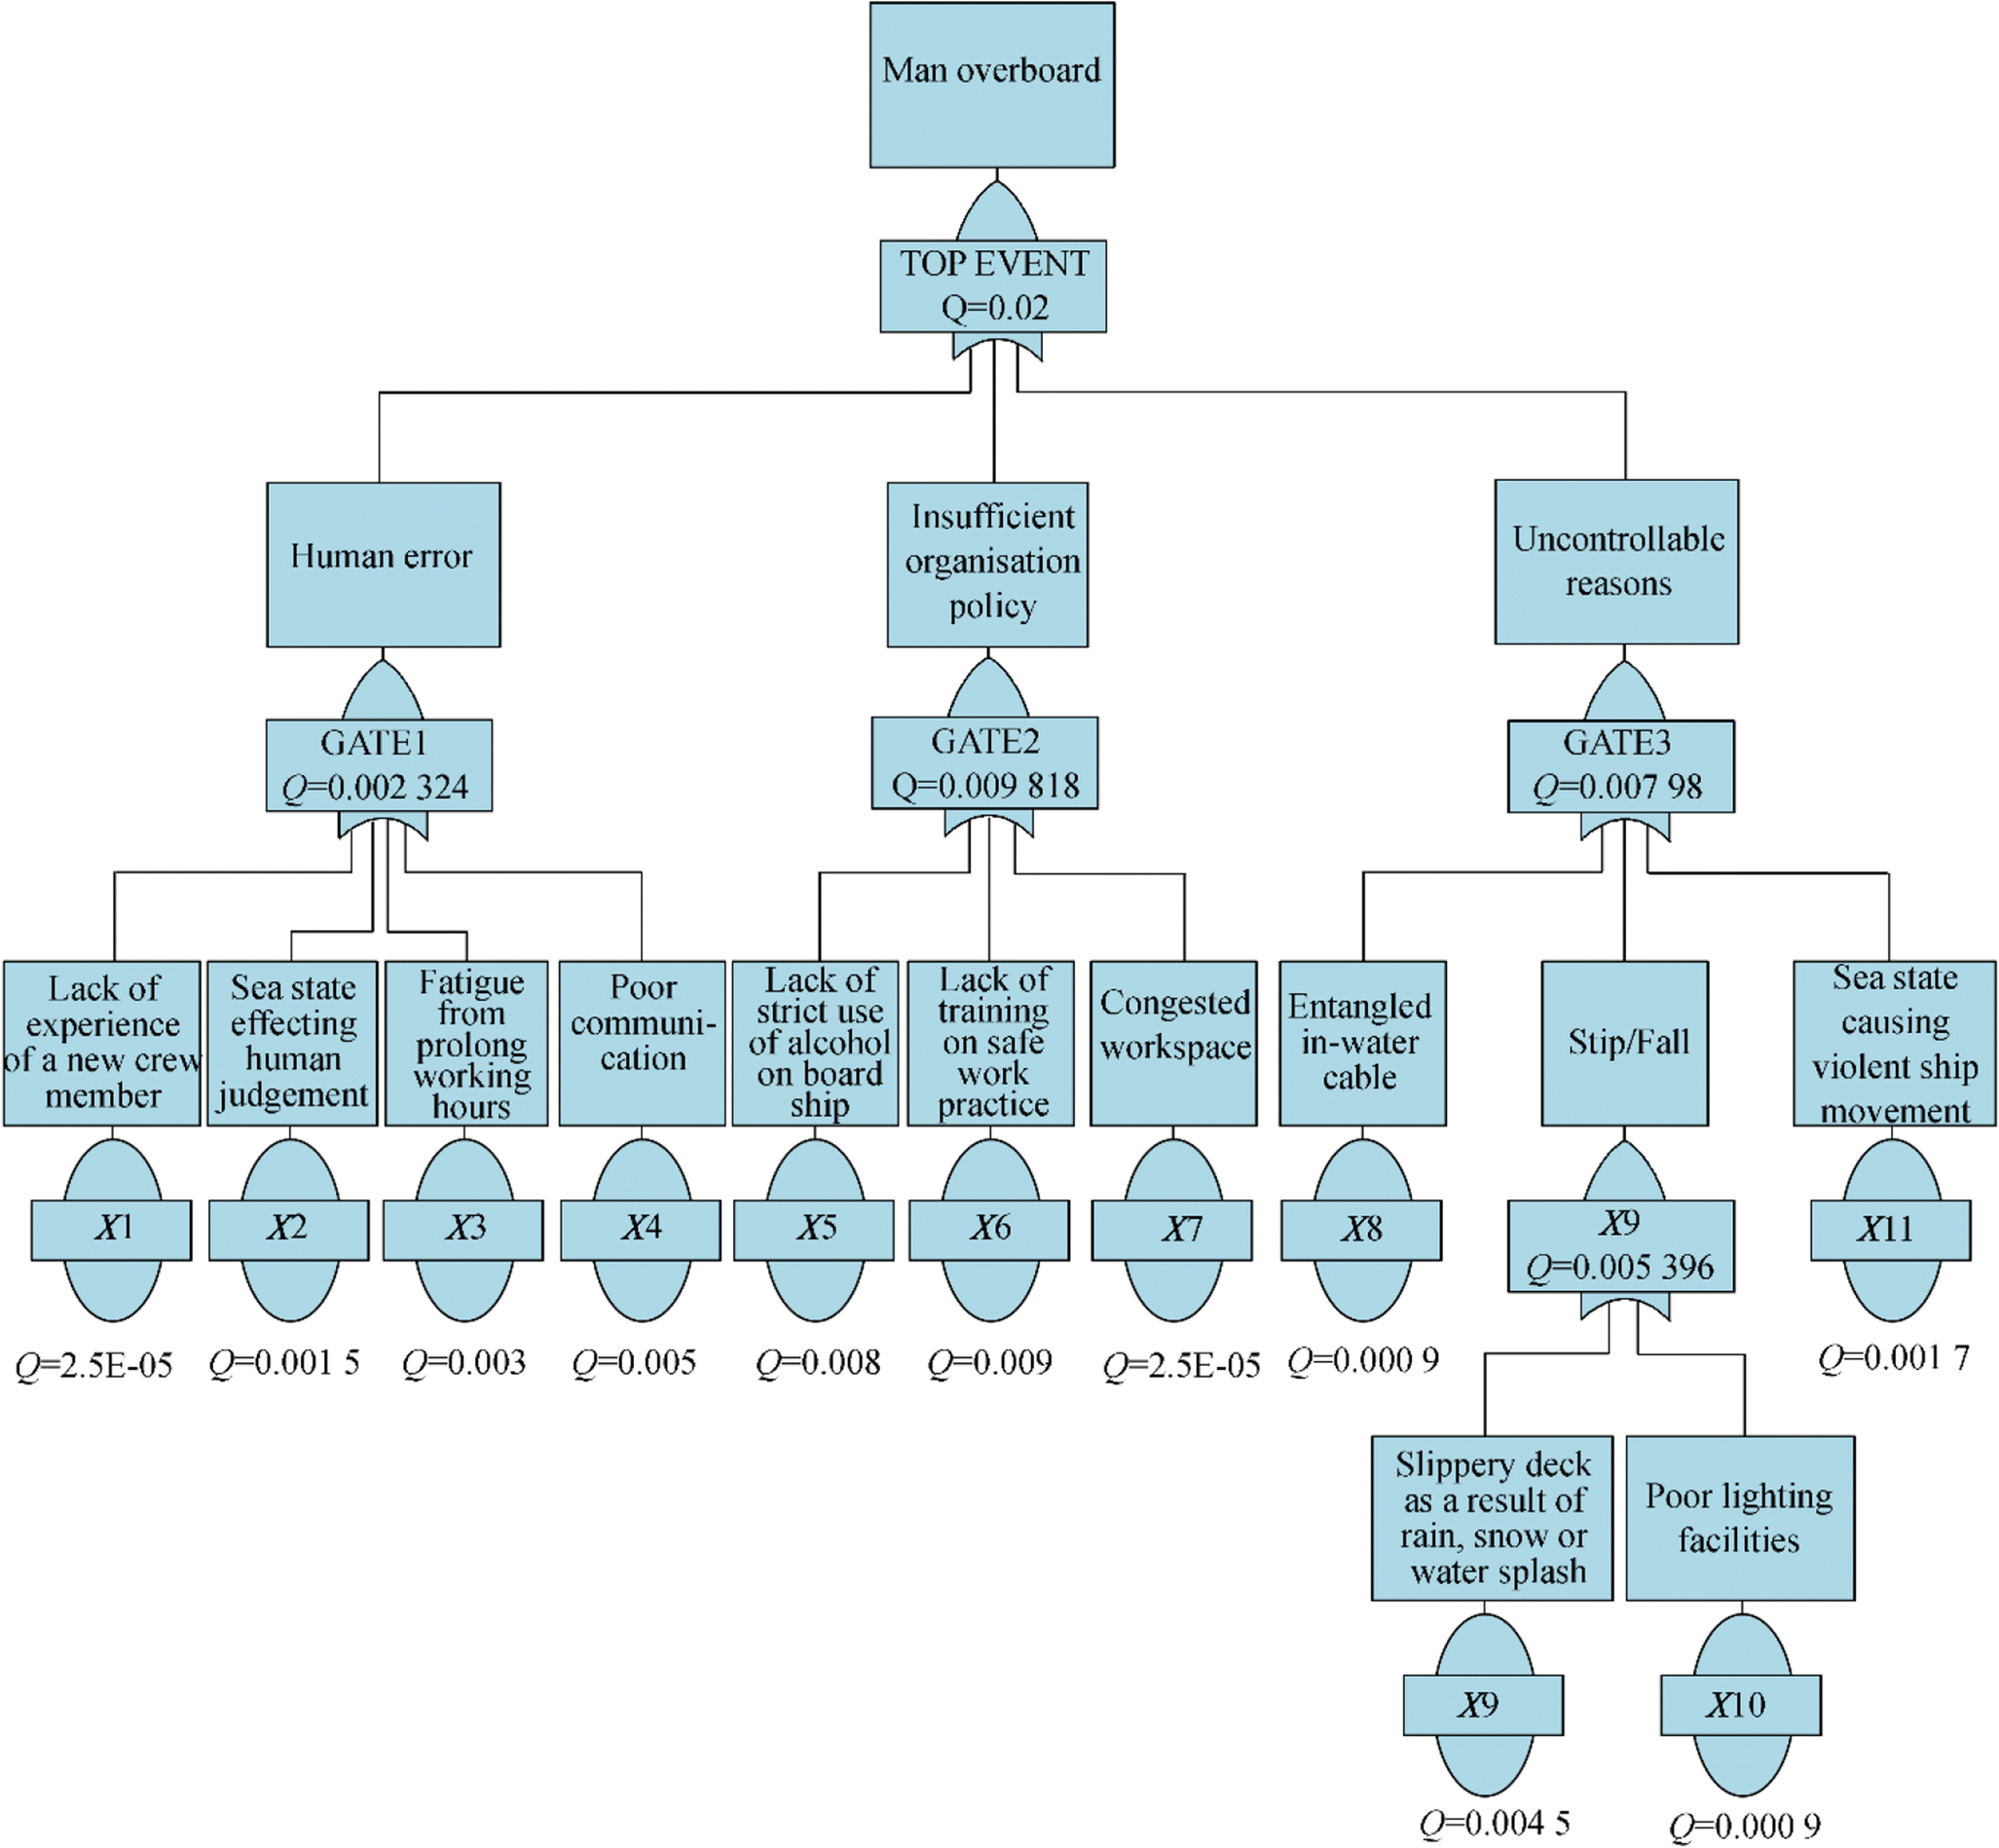 Figure 3 Fault tree analysis of man overboard
3.3.2 Results from the FTA
The minimum cut set is X1 + X2 + X3 + X4 + X5 + X6 + X7 + X8 + X9 + X10 + X11.
Once this has been derived, the quantification of the FTA becomes straightforward.
The results from the FTA show that the probability of the top event occurring is 2.0 × 10⁻²/year, meaning on a scale of 1 to 10, the probability of having a MOB accident is '2' for every 100-ship operating in the North Sea per year. In addition, the results reveal that the lack of training on safe work practice is the most significant basic event with a risk rank index (RRI) of 1, followed by slippery deck as a result of rain, snow, or water splash with RRI of 2. See Table 16 for other basic event's prioritisation.
Table 16 Basic event prioritisationCut set abbreviation Meaning Importance [(Fussell-Vasley (1 year)] Risk rank index (RRI) X1 Lack of experience of a new crew member 0.0106 10 X2 Sea state affecting human judgement 0.6452 3 X3 Fatigue from prolong working hours 0.1290 7 X4 Poor communication 0.2151 4 X5 Lack of strict use of alcohol on board ship 0.0814 9 X6 Lack of training on safe work practice 0.9160 1 X7 Congested workspace 0.00255 11 X8 Entangled in-water cable 0.1120 8 X9 Slippery deck as a result of rain, snow or water splash 0.8330 2 X10 Poor lighting facilities 0.1667 6 X11 Sea state causing violent ship movement 0.2126 5 The results from the FTA in Table 16 reveal that the human factor contribution to accidents is still a major concern in the risk management of maritime projects. Sea state in the form of bad weather is also shown to be in the first three critical events, and this affects seafarers/operators' performance. Sea state or bad weather conditions affect human performance and influence seafarers/operators to make unwanted errors (Islam et al. 2017).
3.3.3 FTA Results Validation
Although the process of validating an FTA result can be challenging, it is, in several cases, very important to carry out. This process is not often tackled in textbooks or papers. Validating a fault tree result is difficult since the quantitative outcome of the FT is a probability, which is not at all tangible (Stamatelatos et al. 2002). However, the FTA result can be validated at least indirectly by checking the probability of the top event for its rationality and comparing it to results obtained for similar types of assessments that have been done in the past. Although there is a limited marine MOB risk assessment carried out in the past, however, the probability value estimated in this study agrees to a high degree with the yearly averages of MOB reported cases in the North Sea from 1991 to 2004 (MAIB 2005) and 2016 (MAIB 2016).
In addition to the FTA result validation, the top major basic events leading to MOB risk have also been identified by a report from the Government of Western Australia Department of Commerce—as the lack of training on safe work, slippery decks, and breaking waves (sea state) (GWADC 2010). Similarly, SFS (2018) identified slippery deck as a major cause of MOB accident, and Bell and Healey (2006) similarly identified lack of work training as a major cause of marine accidents including MOB. The aforementioned reports, however, validate the application of FTA of MOB case in this study.
3.3.4 Model Validation
A possible way to validate the FTA model is by carrying out an authentication of the knowledge-based model. Nevertheless, the most frequently used techniques for this are (1) data validation; (2) validation by testing; (3) field tests; (4) subsystem validation, and (5) sensitivity analysis (Mokhtari et al. 2012). Among these techniques, sensitivity analysis is a preferred option in systems relying on probability and uncertainty management (Gonzalez and Dankel 1993; Hoops et al. 2016).
Sensitivity analysis of the developed FTA model proposes an analytical value judgement for the conclusions of risk ordering. However, two possible axioms can be used in this paper as a mechanism to validate the FTA model, and these axioms are based on the system of logic, which requires no proof. In order to validate the certainty of the FTA model, the sensitivity analysis must at least agree to the following two axioms if the technique is reasonable and logical.
Axiom 1 A slight increase in a basic event's subjective prior probabilities should certainly result in a relative increase of the top event probability value. The sensitivity of the application of Axiom 1 is presented in Table 17.
Table 17 Model validationChange in prior probability Top event (MOB) probability value No change 2.0 × 10⁻² 20% increase in the prior probability of X6 2.15 × 10⁻² 20% decrease in the prior probability of X6 1.85 × 10⁻² Axiom 2 A slight decrease in a basic event's subjective prior probabilities should certainly result in a relative decrease in the top event probability value. The sensitivity of the application of Axiom 2 is also presented in Table 17.
3.4 Step 3 Risk Control Options (RCOS)
To investigate risk control options, it is necessary to first identify high-risk areas that need to be controlled (Wang and Ruxton 1998) (Wang and Pillay 2003) and later identify the risk reduction options otherwise known as RCOs. The purpose of RCOs is to present effective and practical options having the following stages:
I Targeting areas having high risks
J Identifying possible risk control measures
The expert opinions are summed up here to deduce methods of mitigating the probability of occurrence and/or the consequence of the top event. The options in controlling the most significant basic events to a tolerable limit are done with all or a combination of the methods below with reference to the work of Wang and Pillay (2003).
I Management activities – related to the smooth running of an organisation that helps to develop a safety culture
J Operational strategy – involving the introduction of appropriate procedure to perform risk critical tasks and also improving the skills of personnel involved in the operation of the system by training and retraining them to observe safe working ethics, contingency plans, etc.
K Engineering strategy – involving the design and construction of a ship and its equipment or activities related to the installation of new facilities or devices, to reduce or eliminate hazards after vessel design
The RCOs identified in mitigating the MOB basic events is further described and weighed in the following section.
3.5 Step 4 Cost-Benefit Analysis (CBA)
The selected RCO must be attractive in terms of cost-effectiveness, so that gain can outweigh the financial loss incurred from the implementation (IMO 2015b). In estimating cost-benefits, an equivalent of a typical value of human life according to ICAF (Implied Cost of Averting a Fatality) used by the offshore industry is assumed to be £2 000 000 (IMO 2015b). This ICAF value is contained in Annex D of the first revision of NORSOK standard Z-013 (Skjong et al. 2007), developed for the Norwegian offshore region. Though this assumption is believed to be void in the second and current revision of the standard annex, the approach to environmental risk acceptance criteria is nevertheless believed to still be relevant (Skjong et al. 2007).
3.5.1 CBA Calculation
The most important basic events selected from the FTA result are:
• Lack of training on safe work practice
• Slippery deck as a result of rain, snow, or water splash
• Sea state affecting human judgement
• Poor communication
Engineering preventive strategy as option 1 is chosen to mitigate a MOB accident/incident. This method covers the provision of slip-resistant flooring on board, retrofitted railings, constructing appropriate drainage, keeping working areas (especially back deck and walkways) well lit, using anti-skid adhesive tape in work areas, and selecting proper footwear during work. Engineering preventive strategy might only mitigate the effect of 'slippery deck as a result of rain, snow, or water splash'.
Operational strategy as option 2 is chosen to mitigate a MOB accident/incident. This method covers training and retraining of staff to improve their communication skills such as spoken English language and their safe work practices including how to work safely in bad weather conditions. This method might only mitigate the chance of having 'poor communication', 'the effect of sea state affecting human judgement', and the effect of having 'lack of training on safe work practice'.
For demonstrating the applicability of the CBA calculation, assumptions will be made on the cost of introducing engineering and operational strategies on the vessel per year to mitigate the risk of having the four (4) most important basic events selected from the FTA result. Logically, engineering strategy is assumed not to have any effect on reducing lack of training on safe work practice, sea state affecting human judgement, and poor communication. While operation strategy is assumed not to have any effect on reducing the slippery deck, the actual time spent to train crew and to install retrofit equipment is not considered in this paper, as it is only a simple demonstration of CBA calculation. The inflation rate is also not considered since the risk assessment demonstrated is calculated per year.
Engineering Strategy for RCO1 The amount spent to ensure that there is no slippery deck is assumed to be £8500. This amount covers all expenses to supply slip-resistant flooring on board, constructing appropriate drainage, keeping working areas especially back deck and walkways well lit, using anti-skid adhesive tape in work areas, and selecting proper footwear for 30 crew members. The application of engineering strategy (RCO1) means adjusting the probability of slippery deck to a near zero value. Upon re-running the FTA computer application, the probability of having a MOB accident was reduced to 1.45 × 10⁻²/year.
Therefore, the top event happened at a probability of 2.0 × 10⁻²/year. With the introduction of RCO1, the occurrence probability of the top event is reduced to 1.45 × 10⁻²/year.
$$ \begin{array}{l} {\rm{Reduction}}\\ \;\;\;{\rm{ = }}2.0 \times {10^{ - 2}} - 1.45 \times {10^{ - 2}}/{\rm{year}} = 0.0055 \end{array} $$ $$ \begin{array}{l} {\rm{Cost\;that\;would\;be\;incurred\;if\;top\;event\;happened}}\\ \;\;\; = \mathit{£}2\;{\rm{ }}\;000\;{\rm{ }}000 \end{array} $$ $$ \begin{array}{l} {\rm{Benefit\;derived}}\\ \;\;\; = \mathit{£}2{\rm{ }}\;000{\rm{ }}\;000 \times 0.0055 = \mathit{£}11{\rm{ }}\;000 \end{array} $$ $$ \begin{array}{l} {\rm{Cost\;of\;RCO1}}\\ \;\;\; = \mathit{£}8500 \end{array} $$ By comparing the cost of RCO1 with the benefit derived, it shows that RCO1 is effective.
The Operational Strategy for RCO2 To mitigate the risk of having unsafe working practices, sea state affecting human judgement, and poor communication, proper training of staff will be carried out in order for them to communicate properly, to react appropriately to rough weather conditions, and to perform risk critical tasks safely. Here, 30 seismic crew members are budgeted to be trained, and the cost to train all concerned personnel is calculated to be £7000. The application of operational strategy (RCO2) means adjusting the probability of lack of training on safe work practice, sea state affecting human judgement, and poor communication to a near zero value. Upon re-running the FTA computer application, the probability of having MOB hazard was reduced to 1.40 × 10⁻²/year.
Therefore, the top event happened at a probability of 2.0 × 10⁻²/year. With the introduction of RCO2, the occurrence probability of top event reduced to 1.40 × 10⁻²/year.
$$ \begin{array}{l} {\rm{Reduction}}\\ \;\;\;{\rm{ = }}2.0 \times {10^{ - 2}} - 1.40 \times {10^{ - 2}}/{\rm{year}} = 0.006 \end{array} $$ $$ \begin{array}{l} {\rm{Cost\;that\;would\;be\;incurred\;if\;top\;event\;happened}}\\ \;\;\; = \mathit{£}2{\rm{ }}\;000{\rm{ }}\;000 \end{array} $$ $$ \begin{array}{l} {\rm{Benefit\;derived}}\\ \;\;\; = \mathit{£}2{\rm{ }}\;000{\rm{ }}\;000 \times 0.006 = \mathit{£}12{\rm{ }}\;000 \end{array} $$ $$ \begin{array}{l} {\rm{Cost\;of\;RCO2}}\\ \;\;\; = \mathit{£}7000 \end{array} $$ By comparing the cost of RCO2 with the benefit derived, it shows that RCO2 is also cost-effective.
From the CBA calculation, RCO2 is more cost-effective than RCO1; this information will be passed onto decision-makers to make the final decision to assess the effectiveness of the RCOs as it improves safety in the system under investigation.
Note that the £2 million estimated costs of human life (IMO 2015b) may vary; hence, the variation might affect the above CBA calculation.
3.6 Step 5 Decision-Making
Decision-making is carried out to select the most cost-effective RCO, which truly addresses the most effective way to improve safety, taking assessment back from step 1 to step 4.
From the RCOs and CBA calculation, it is revealed that the application of RCO2 reduced the top event probability by nearly 40% (i.e. from 2.0 × 10⁻² to 1.40 × 10⁻² /year), and the benefit derived was more cost-effective compared to RCO1. Hence, the decision of training of the 30 crew members in order for them to communicate properly, to react appropriately to rough weather conditions, and to perform risk critical tasks safely is the preferred option for the decision-maker to enforce to ensure that risk level of marine seismic survey operation is reduced to as low as reasonably practicable (ALARP) levels.
4 Discussion
Risk matrix and FTA have been selected in this study to evaluate the risk of a marine seismic survey operation. These two notable techniques have been selected in a complementary manner simply because they both provide a quick method to graphically recognise the risks of the marine seismic survey operation. The lack of thoroughness is a major concern in a risk matrix, and this is because if the tool is employed as the only method of risk evaluation, the complexities of the hazard event could be oversimplified. Both the risk matrix and FTA techniques used in this paper incorporated single value failure inputs from the expert judgement in analysing the risks in the studied area. In handling the imprecision of data arising from expert opinion in the application of the risk matrix and FTA in this research, efforts have made in the careful selection of experts with a reasonable wealth of experience in the subject (marine seismic survey vessel operation). The exclusion of fuzzy set methodology in this research does not necessarily contradict the effectiveness of the traditional single value probability estimation in risk matrix and FTA techniques, as they are still very much effective and in use presently. It is noteworthy that Abdussamie et al. (2018) compared the calculated fuzzy risk values with a single value estimate in a risk matrix assessment study and found consistency between the calculated fuzzy risk estimate and a single probability value risk estimate.
FTA has many computer aids, and a large number of safety engineers use these widely. One of the major advantages of the method is the complementary data delivered from the qualitative and quantitative analysis of the FT. However, the key weakness of the classical FTA technique is in its inability to model the dynamic behaviour of a process system (Kalantarnia et al. 2009). To overcome this, Bucci et al. (2008) recently presented a methodology that uses Markov modelling to construct dynamic FT and tackled the key weakness with the classical FTA.
Computer aids is gradually replacing human calculations in most risk assessment studies—with a high likelihood of error in manual calculations—possibly rendering the whole risk assessment studies void. However, the use of a computer software application should practically eliminate human calculation errors.
Errors made by humans are responsible for over 70% of most marine accidents (Anyanwu and Okoroji 2014). To this concern, the IMO guidelines recommend the application of human error assessment and reduction technique (HEART), to address the problem of human error especially with regard to quantitative risk analysis of marine and offshore operations (Islam et al. 2017).
5 Recommendation for Further Research
This paper has revealed the efficacy of the application of the risk matrix and FTA to mitigate risk in marine seismic survey operations. The former revealed that MOB when compared with other hazard events is a major risk factor in marine seismic survey operation. The latter represented and analysed the significant basic events that could lead to the MOB accident. Lack of training on safe work practice; slippery deck as a result of rain, snow, or water splash; sea state affecting human judgement and poor communication were the top significant risk factors leading to a MOB incident.
With the poor record of accidents and 'near misses' cases in the marine seismic survey sector, an attempt was made to compare the probability of the studied MOB case with a real-life report. The comparison reached coincided with the yearly averages of MOB reported cases in the North Sea from 1991 to 2004 (MAIB 2005) and 2016 (MAIB 2016).
The best RCO to minimise the four most critical risk factors in this research was analysed against its cost and benefit. The decision to provide proper training for the 30 crew members in order for them to communicate properly, to react appropriately to rough weather conditions, and to perform risk critical tasks safely was identified as the most cost-effective RCO.
The final decision that represents the FSA last step has proved a traceable and justifiable means to minimise the risk of the MOB incident in marine seismic survey operation. Hence, the application of FSA guidelines in identifying hazards and analysing the risk associated with the identified hazards and the risk control options alongside the CBA calculation has proved to be:
• Systematic
• Proactive
• Transparent
• Cost-effective
It is revealed from this study that human element contributes greatly to the MOB case study. Therefore, it can be concluded that the human factors' contribution to marine accidents is still a major concern in the maritime industry. The best way to reduce the number of incidents/accidents is with proactive safety culture in place, highlighting safety and providing preventative measures. Training and retraining of the crew members is an effective preventive measure to mitigate incidents/accidents.
With the relentless demand for offshore hydrocarbon resources, it is possible that in years to come, there will be increased activities and traffic in the offshore environment leading to new risks; with this prediction, the marine seismic survey companies presently should focus more on human resources and enhancing training to crew members. The maritime industry will need to open doors to training opportunities and more recruitment, in order to boost confidence in marine and offshore operations.
The main limitation of this research is the fact that expert judgement was solely relied upon. Here, there is a lack of formal quantification or rating of expert opinion, and a case can be cited when an expert might overlook a safety aspect of a system under review, while other experts from a different background might not overlook such safety aspects; this confusion might result in a deadlock. To narrow the disagreement between expert judgements from different backgrounds, a mathematical evaluation such as 'consistency ratio' could be incorporated in further study. However, from the questionnaires received in this study, there was no much disagreement between the expert's judgement.
The CBA technique as demonstrated in this study utilised fictitious values instead of real-life values; however, it should be noted that the CBA technique, as adopted for use in FSA, is not an exact science, and it should only be taken as a means to provide a guide in risk management decision-making process. Further research will focus on case studies that are more practical.
The extension of FTA and evidence theory-based formulations such as fuzzy evidential reasoning (FER) and BN formulations, addressing the issue of uncertainties in hazard data and the lack of interdependencies of dynamic hazard events, not previously addressed in the application of FTA technique will further be looked into, in future research. Nevertheless, this article is of an explorative nature; further research will be required to address data uncertainty and event dependencies in the risk analysis context.
Open Access This article is licensed under a Creative Commons Attribution 4.0 International License, which permits use, sharing, adaptation, distribution and reproduction in any medium or format, as long as you give appropriate credit to the original author(s) and the source, provide a link to the Creative Commons licence, and indicate if changes were made. The images or other third party material in this article are included in the article's Creative Commons licence, unless indicated otherwise in a credit line to the material. If material is not included in the article's Creative Commons licence and your intended use is not permitted by statutory regulation or exceeds the permitted use, you will need to obtain permission directly from the copyright holder. To view a copy of this licence, visit http://creativecommons.org/licenses/by/4.0/. -
Figure 1 Seismic survey vessel with labelled instrument (Buchanan 2016)
Figure 2 FSA flow chart (MSC 2002)
Figure 3 Fault tree analysis of man overboard
Table 1 Hazard event category
Hazard category Source Man overboard Telephone interview Fires and explosion Telephone interview Loss of hull integrity Telephone interview Collision/contact Telephone interview Towed array entanglement Telephone interview Heavy weather damage Telephone interview Table 2 Frequency assignment (Lois et al., 2004)
Assigned rating If the frequency is: 1 Remote = might occur once in a lifetime 2 Occasional = might occur once every 1 to 5 years 3 Likely = might occur up to 5 times per year 4 Probable = might occur monthly or weekly 5 Frequent = might occur daily Table 3 Consequence severity assignment (Lois et al., 2004)
Assigned rating If the impact could be: 1 Negligible = injury not requesting first-aid 2 Minor = injury requesting first-aid 3 Significant = injury requesting more than first-aid 4 Critical = severe injury 5 Catastrophic = loss of life, vessel, extreme environmental impact Table 4 Risk matrix (Wang and Pillay 2003)
Consequences Frequency F1 F2 F3 F4 F5 C1 Negligible 1 2 3 4 5 C2 Minor 2 3 4 5 6 C3 Significant 3 4 5 6 7 C4 Critical 4 5 6 7 8 C5 Catastrophic 5 6 7 8 9 Table 5 Expert background
Expert Industry Experience A UK marine geophysical services company 20 years of industrial experience, charter engineer status B UK marine geophysical service company 20 years of industrial experience, charter engineer status C UK marine geophysical services company 20 years of industrial experience, charter engineer status D UK marine geophysical services company 24 years of industrial experience, HND status E UK marine geophysical services company 21 years of industrial experience, HND status Table 6 Man overboard ranking using risk matrix table (converged expert judgement)
Accident: man overboard Operational subcategory Crew embarking Manoeuvring (harbour) At sea (coastal) Manoeuvring in a grid pattern at sea Crew disembarking Slippery deck F2/C2 = 3 F2/C3 = 4 F3/C4 = 6 F5/C5 = 9 F2/C2 = 3 Fatigue F2/C2 = 3 F2/C3 = 4 F3/C4 = 6 F4/C5 = 8 F4/C3 = 6 Corroded railing F3/C2 = 4 F3/C2 = 4 F3/C3 = 5 F3/C5 = 7 F3/C2 = 4 Breaking waves F1/C1 = 1 F2/C1 = 2 F4/C3 = 6 F4/C4 = 7 F1/C1 = 1 Poor communication F2/C2 = 3 F2/C3 = 4 F2/C3 = 4 F2/C4 = 5 F2/C2 = 3 Table 7 Fire ranking using risk matrix table (converged expert judgement)
Hazard: fire Operational subcategory Crew embarking Manoeuvring (harbour) At sea (coastal) Manoeuvring in a grid pattern at sea Crew disembarking Navigational bridge F1/C1 = 1 F1/C1 = 1 F1/C1 = 1 F1/C1 = 1 F1/C1 = 3 Engine room F2/C2 = 3 F2/C2 = 3 F4/C4 = 7 F4/C4 = 8 F2/C2 = 3 Storage space F2/C3 = 4 F2/C3 = 4 F3/C4 = 6 F3/C4 = 6 F1/C3 = 4 Back deck F1/C1 = 1 F2/C1 = 2 F4/C3 = 6 F4/C4 = 7 F1/C1 = 1 Crew accommodation F2/C2 = 3 F3/C3 = 4 F2/C3 = 4 F2/C3 = 4 F2/C2 = 3 Table 8 Loss of hull integrity ranking using risk matrix table (converged expert judgement)
Hazard: loss of hull integrity Operational subcategory Crew embarking Manoeuvring (harbour) At sea (coastal) Manoeuvring in a grid pattern at sea Crew disembarking Hull plating F3/C1 = 3 F3/C2 = 4 F3/C2 = 4 F3/C2 = 4 F3/C1 = 3 Framing F3/C1 = 3 F3/C2 = 4 F3/C2 = 4 F3/C2 = 4 F3/C1 = 3 Bulkheads F3/C1 = 3 F3/C2 = 4 F3/C2 = 4 F3/C3 = 5 F3/C1 = 3 Welds and joints F4/C1 = 4 F3/C2 = 4 F4/C2 = 5 F4/C2 = 5 F4/C1 = 4 Doors F4/C1 = 4 F4/C2 = 5 F4/C2 = 5 F4/C3 = 6 F4/C1 = 4 Penetrations F5/C1 = 5 F5/C1 = 5 F5/C2 = 6 F5/C2 = 6 F5/C1 = 5 Windows F4/C1 = 4 F4/C1 = 4 F4/C2 = 5 F4/C2 = 5 F4/C1 = 4 Table 9 Collision/contact ranking using risk matrix table (converged expert judgement)
Hazard: collision/contact Operational subcategory Crew embarking Manoeuvring (harbour) At sea (coastal) Manoeuvring in a grid pattern at sea Crew disembarking Berthing F3/C2 = 4 Departure F4/C2 = 5 Manoeuvring F5/C2 = 6 F3/C4 = 6 Seismic exploration F2/C2 = 3 F5/C3 = 7 Entering harbour F5/C2 = 4 Manoeuvring close to berth F5/C2 = 6 Shutdown F4/C2 = 5 Abnormal operation F4/C2 = 5 F4/C2 = 5 F4/C3 = 6 F4/C3 = 6 F4/C1 = 4 Anchored F5/C2 = 6 Table 10 Towed array entanglement rankings using risk matrix table (converged expert judgement)
Hazard: towed array entanglement Operational subcategory Crew embarking Manoeuvring (harbour) At sea (coastal) Manoeuvring in a grid pattern at sea Crew disembarking Launching of equipment F3/C2 = 4 F4/C3 = 6 Seismic full exploration F3/C2 = 4 F5/C4 = 8 Retrieving seismic equipment F4/C2 = 5 F4/C4 = 7 Table 11 Heavy weather damage ranking using risk matrix table (converged expert judgement)
Hazard: heavy weather damage Operational subcategory Crew embarking Manoeuvring (harbour) At sea (coastal) Manoeuvring in a grid pattern at sea Crew disembarking Berthing F1/C1 = 1 F1/C1 = 1 Departure F1/C1 = 1 F1/C1 = 1 Manoeuvring F2/C1 = 2 Seismic exploration F2/C2 = 6 F4/C4 = 7 Entering harbour F1/C2 = 2 Abnormal operation F1/C1 = 1 F2/C2 = 3 F3/C3 = 5 F4/C3 = 6 F1/C1 = 1 Anchored F1/C1 = 1 F1/C1 = 1 Table 12 Number of occurrences of each ranking score (six accident categories)
RRN No. of occurrence for hazard category Man overboard Heavy weather damage Towed array entanglement Contact and collision Loss of hull integrity Fire 4 7 – 2 3 16 6 5 2 1 1 4 10 – 6 4 2 1 6 – 3 7 2 1 1 1 – 2 8 1 – 1 – – 1 9 1 – – – – – Table 13 Equivalent total
Hazard category Man overboard Heavy weather damage Towed array entanglement Contact and collision Loss of hull integrity Fire Equivalent total 9.05 7.08 8.05 7.22 6.06 8.09 Table 14 A sample of the subjective data utilised in analysing the risk of MOB in the North Sea
Basic event Expert Probability of a basic event happening per 1000 ships in a year (probability scale = 0–10) Slippery deck as a result of rain, snow, or water splash A 3.35 B 6 C 3.5 D 5 E 4.65 Average prior probability 4.5 or 4.5×10⁻³ Table 15 Expert judgement of the probability of basic events
Cut set abbreviation Basic event Probability of a basic event happening per 1000 ships in a year (probability scale = 0–10) X1 Lack of experience of a new crew member 2.5×10−5 X2 Sea state affecting human judgement 1.5×10−3 X3 Fatigue from prolong working hours 3.0×10−4 X4 Poor communication 5.0×10−4 X5 Lack of strict use of alcohol on board ship 8.0×10−4 X6 Lack of training on safe work practice 9.0×10−3 X7 Congested workspace 2.5×10−5 X8 Entangled in-water cable 9.0×10−4 X9 Slippery deck as a result of rain, snow or water splash 4.5×10−3 X10 Poor lighting facilities 9.0×10−4 X11 Sea state causing violent ship movement 1.7×10⁻³ Table 16 Basic event prioritisation
Cut set abbreviation Meaning Importance [(Fussell-Vasley (1 year)] Risk rank index (RRI) X1 Lack of experience of a new crew member 0.0106 10 X2 Sea state affecting human judgement 0.6452 3 X3 Fatigue from prolong working hours 0.1290 7 X4 Poor communication 0.2151 4 X5 Lack of strict use of alcohol on board ship 0.0814 9 X6 Lack of training on safe work practice 0.9160 1 X7 Congested workspace 0.00255 11 X8 Entangled in-water cable 0.1120 8 X9 Slippery deck as a result of rain, snow or water splash 0.8330 2 X10 Poor lighting facilities 0.1667 6 X11 Sea state causing violent ship movement 0.2126 5 Table 17 Model validation
Change in prior probability Top event (MOB) probability value No change 2.0 × 10⁻² 20% increase in the prior probability of X6 2.15 × 10⁻² 20% decrease in the prior probability of X6 1.85 × 10⁻² -
Abdussamie N, Daboos M, Elferjani I, Shuhong C, Alaktiwi A (2018) Risk assessment of LNG and FLNG vessels during manoeuvring in open sea. J Ocean Eng Sci 3: 56–66. https://doi.org/10.1016/j.joes.2017.12.002 Ahmed Ali B, Risza R, Azizul B (2013) Reliability analysis using fault tree analysis: a review. Int J Chem Eng Appl 4: 173. https://doi.org/10.18178/IJCEA Ale B, Burnap P, Slater D (2015) On the origin of PCDS - (probability consequence diagrams). Saf Sci 72: 229–239. https://doi.org/10.1016/j.ssci.2014.09.003 Alyami H, Yang Z, Riahi R, Bonsall S, Wang J (2019) Advanced uncertainty modelling for container port risk analysis. Accid Anal Prev 123: 411–421. https://doi.org/10.1016/j.aap.2016.08.007 Anyanwu JO, Okoroji L (2014) The causes and minimization of maritime disasters on passenger vessels. Global J Res Eng. https://www.engineeringresearch.org/index.php/GJRE/article/view/1131/1063 Aven T (2016) Risk assessment and risk management: review of recent advances on their foundation. Eur J Oper Res 253: 1–13. https://doi.org/10.1016/j.ejor.2015.12.023 Bai Y, Jin W (2016) Introduction to marine structural design. In: Naomi R (ed) Marine Structural Design, 2nd edn. Elsevier Ltd, Oxford Bell J, Healey N (2006) The causes of major hazard incidents and how to improve risk control and health and safety management: a review of the existing literature, Health and Safety Laboratory Bucci P, Kirschenbaum J, Mangan LA, Aldemir T, Smith C, Wood T (2008) Construction of event-tree/fault-tree models from a Markov approach to dynamic system reliability. Reliab Eng Syst Saf 93: 1616–1627. https://doi.org/10.1016/j.ress.2008.01.008 Buchanan C (2016) Seismic Survey Vessel [online]. USA: content graphics. Available: http://www.contentgraphics.com/category/illustration/ [accessed 26th May 2017] Cai B, Kong X, Liu Y, Lin J, Yuan X, Xu H, Ji R (2019) Application of Bayesian networks in reliability evaluation. IEEE Trans Ind Inf 15: 2146–2157. https://doi.org/10.1109/TII.2018.2858281 Carlos Guedes S (2010) Safety and reliability of industrial products, Systems and Structures. CRC Press, London Chirp-Maritime (2014) Seismic Vessel and Yacht [Online]. UK: CHIRP MARITIME. Available: https://www.chirpmaritime.org/seismic-vessel-and-yacht/ [Accessed 16th May 2017] Curcurù G, Galante GM, La Fata CM (2012) Epistemic uncertainty in fault tree analysis approached by the evidence theory. J Loss Prev Process Ind 25: 667–676. https://doi.org/10.1016/j.jlp.2012.02.003 Duijm NJ (2015) Recommendations on the use and design of risk matrices. Saf Sci 76: 21–31. https://doi.org/10.1016/j.ssci.2015.02.014 Eilperin J, Mufson S (2015) Royal Dutch Shell Suspends Arctic Drilling Indefinitely. Energy and Environment [online]. Available from: https://www.washingtonpost.com/news/energy-environment/wp/2015/09/28/royal-dutch-shell-suspends-arctic-drilling-indefinitely/?utm_term=.8e4e9ff291ae [Accessed 5th Mar 2017] Emmerson C, Lahn G (2012) Enhanced Marine Risks in the Arctic [online]. London, UK: Lloyd's and Chatham house. Available: http://www.arctis-search.com/Enhanced+Marine+Risks+in+the+Arctic [Accessed 5th Jun 2018] Endrina N, Rasero JC, Konovessis D (2018) Risk analysis for RoPax vessels: a case of study for the strait of Gibraltar. Ocean Eng 151: 141–151. https://doi.org/10.1016/j.oceaneng.2018.01.038 Ferdous R, Khan F, Sadiq R, Amyotte P, Veitch B (2011) Fault and event tree analyses for process systems risk analysis: uncertainty handling formulations. Risk Anal 31: 86–107. https://doi.org/10.1111/j.1539-6924.2010.01475.x Flage R, Baraldi P, Zio E, Aven T (2013) Probability and possibility-based representations of uncertainty in fault tree analysis. Risk Anal 33: 121–133 https://doi.org/10.1111/j.1539-6924.2012.01873.x Godaliyadde D, Phylip-Jones G, Yang ZL, Batako AD, Wang J (2009) An analysis of ship hull vibration failure data. J Saf Reliab 29: 15–26. https://doi.org/10.1080/09617353.2009.11690871 Gonzalez AJ, Dankel DD (1993) The engineering of knowledge-based systems: theory and practice, Prentice-Hall, Inc. Görçün ÖF, Burak SZ (2015) Formal safety assessment for ship traffic in the Istanbul Straits. Procedia Soc Behav Sci 207: 252–261. https://doi.org/10.1016/j.sbspro.2015.10.094 Gwadc (2010) Government of Western Australia Department of Commerce. Code of practice, Man overboard prevention and response [Online]. Perth, Australia: Government of Western Australia Department of Commerce. [Accessed 18th May 2019] Haapasaari P, Helle I, Lehikoinen A, Lappalainen J, Kuikka S (2015) A proactive approach for maritime safety policy making for the Gulf of Finland: seeking best practices. Mar Policy 60: 107–118. https://doi.org/10.1016/j.marpol.2015.06.003 Hakan A, Ayhan M, Ismail Hakki H (2013) Formal Safety Assessment of Cargo ships at coast and open seas of Turkey. International Conference on Offshore Mechanics and Arctic Engineering, Rio de Janeiro, Brazil America Society of Mechanical Engineering, 9. doi: https://doi.org/ 10.1115/OMAE2012-83315 Hoops S, Hontecillas R, Abedi V, Leber A, Philipson C, Carbo A, Bassaganya-Riera J (2016) Ordinary differential equations (ODEs) based modeling. Computational Immunology. Elsevier Hu Y-N (2016) Research on the application of fault tree analysis for building fire safety of hotels. Procedia Eng 135: 524–530 https://doi.org/10.1016/j.proeng.2016.01.092 IAGC (2011) International Association of Oil and Gas Producers. An Overview of Marine Seismic Operations [online]. International Association of oil and gas Producers. Available: https://www.norskoljeoggass.no/contentassets/ae812078242441fb88b75ffc46e8f849/an-overview-of-marine-seismic-operations.pdf [Accessed 5th May 2018] IAGC (2013) International Association of Geophysical Contractors. Man Lost Overboard from Streamer Deck IEC (2006) Analysis techniques for system reliability – procedure for failure mode and effect analysis (FMEA). BSI, Brussels Ikeagwuani U, John G (2013) Safety in maritime oil sector: content analysis of machinery space fire hazards. Saf Sci 51: 347–353 https://doi.org/10.1016/j.ssci.2012.08.003 IMO (1997) Interim guidelines and the application of formal safety assessment (FSA) to the IMO rule-making process. International Maritime Organisation, London IMO (2002) Guidelines for formal safety assessment (FSA) for use in the IMO rule-making process. International Maritime Organisation, London IMO (2012) Revised guidelines for formal safety assessment (FSA) for use in the IMO rule-making process. International Maritime Organisation, London IMO (2015a) Formal Safety Assessment [Online]. International Maritime Organisation, London Available: http://www.imo.org/en/OurWork/Safety/SafetyTopics/Pages/FormalSafetyAssessment.aspx [Accessed 6th Jun 2018] IMO (2015b) Revised guidelines for formal safety assessment (FSA) for use in the Imo rule-making process. International Maritime Organisation, London IMO (2018) Revised guidelines for formal safety assessment (FSA) for use in the IMO rule-making process. International Maritime Organisation, London Islam R, Abbassi R, Garaniya V, Khan F (2017) Development of a human reliability assessment technique for the maintenance procedures of marine and offshore operations. J Loss Prev Process Ind 50: 416–428. https://doi.org/10.1016/j.jlp.2017.10.015 ISO (2010) Risk management – risk assessment techniques. CENELEC, Brussels ISOGRAPH (2015) Reliability workbench 12. Incorporating FaultTree+, Isograph ISOGRAPH 2017. Fault tree +. 2017 ed. : Isograph JHC (2012) Joint Hull committee. The Northern Sea route. Joint Hull Committee, London Kabir S (2017) An overview of fault tree analysis and its application in model based dependability analysis. Expert Syst Appl 77: 114–135. https://doi.org/10.1016/j.eswa.2017.01.058 Kalantarnia M, Khan F, Hawboldt K (2009) Dynamic risk assessment using failure assessment and Bayesian theory. J Loss Prev Process Ind 22: 600–606. https://doi.org/10.1016/j.jlp.2009.04.006 Komal S (2015) Fuzzy fault tree analysis for patient safety risk modeling in healthcare under uncertainty. Appl Soft Comput 37: 942–951. https://doi.org/10.1016/j.asoc.2015.08.005 Kontovas CA, Psaraftis HN (2009) Formal safety assessment: a critical review. Mar Technol 46: 45–59 Lavasani SMM (2010) Advanced Quantitative Risk Assessment of Offshore Gas Pipeline Systems. PhD Thesis, Liverpool John Moores University, UK Lee PTW, Yang Z (2017) Multi-Criteria Decision Making in Maritime Studies and Logistics: Applications and Cases, Springer Lois P, Wang J, Wall A, Ruxton T (2004) Formal safety assessment of cruise ships. Tour Manag 25: 93–109 https://doi.org/10.1016/S0261-5177(03)00066-9 Long D, Hillman M (2014) Introduction: medical engineering design, regulations, and risk management. Clinical Engineering. Elsevier Loughran CG, Pillay A, Wang J, Wall A, Ruxton T (2002) A preliminary study of fishing vessel safety. J Risk Res 5: 3–21. https://doi.org/10.1080/136698702753329135 MAIB (2005) Persons Reported Overboard From 1991 to 2004 To The UK Marine Accident Investigation Branch (MAIB) [online]. UK: marine accident investigation branch. Available: http://www.manoverboard-mob.com/9.html [accessed 5th Aug 2018] MAIB (2016) Marine accident investigation branch annual report. Marine Accident Investigation Branch, Southampton MARINE-INSIGHT (2011) Ramform Sovereign – The Most Advanced 3D Seismic Vessel in the World. Available: http://www.marineinsight.com/types-of-ships/ramform-sovereign-the-most-advanced-3d-seismic-vessel-in-the-world/ [Accessed 20th May 2017] Mokhtari K, Ren J, Roberts C, Wang J (2012) Decision support framework for risk management on sea ports and terminals using fuzzy set theory and evidential reasoning approach. Expert Syst Appl 39: 5087–5103. https://doi.org/10.1016/j.eswa.2011.11.030 MSC (1997) FSA "trial application to high speed passenger catamaran vessel". Maritime Safety Committee, International Maritime Organization, London MSC (2002) Formal safety assessment. Overview and IACS Experience. International Maritime Organisation, London Ni H, Chen A, Chen N (2010) Some extensions on risk matrix approach. Saf Sci 48: 1269–1278. https://doi.org/10.1016/j.ssci.2010.04.005 Nyman T, Sassi J, Porthin M, Sonnimen S (2010) Aaland Sea FSA Study. VTT Technical Research Centre of Finalnd (VTT) OET (2016) First offshore well in years breaks world record. Uruguay: Offshore Energy Today. Available: http://www.offshoreenergytoday.com/uruguay-first-offshore-well-in-years-breaks-world-record/ [Accessed 16th Dec 2016] Oliveira LW, Seta FDS, De Oliveira EJ (2016) Optimal reconfiguration of distribution systems with representation of uncertainties through interval analysis. Int J Electr Power Energy Syst 83: 382–391. https://doi.org/10.1016/j.ijepes.2016.04.020 Papanikolaou A (2016) Tanker design and safety: historical developments and future trends. In: Orszulik S (ed) Environmental Technology in the oil Industry, 3rd edn. Springer International Publishing Switzerland, Wantage Parsons JR (2016) Application of formal safety assessment in polar maritime transportation: namely routeing, emergency procedures and human factors (FORSASS. POMARTRA), IAMU Patel J, Borgohain S, Kumar M, Rangarajan V, Somasundaran P, Sen R (2015) Recent developments in microbial enhanced oil recovery. Renew Sust Energ Rev 52: 1539–1558. https://doi.org/10.1016/j.rser.2015.07.135 Psaraftis HN (2012) Formal safety assessment: an updated review. J Mar Sci Technol 17: 390–402. https://doi.org/10.1007/s00773-012-0175-0 Redmill F (2002) The significance to risk analysis of risks posed by humans. Eng Manag J: 12 Ruge B (2004) Risk matrix as tool for risk assessment in the chemical process industries. In: Spitzer CSU, Dang VN (eds) Probabilistic Safety Assessment and Management. Springer, London Schuler M (2016) Maersk Drillship Spuds World's Deepest Well [online]. Available: http://www.gcaptain.com/maersk-venturer-begins-drilling-worlds-deepest-well/ [Accessed 18th May 2017] SFS (2018) Safety for Sea. Emergency Procedures: "Man overboard" [Online]. Safety For Sea. Available: https://www.safety4sea.com/cm-emergency-procedures-man-overboard/ [Accessed 11th Feb 2019] Skjong R, Vanem E, Endresen Ø (2007) Design, Operation and Regulation for Safety [online]. Norway: Det Norske Veritas AS. Available: http://www.transport-research.info/sites/default/files/project/documents/20130130_135847_22756_SAFEDOR-D-04.05.02-2005-10-21-DNV-RiskEvaluationCriteria-rev-3.pdf [Accessed 13th Aug 2016 2016] Sniegocki H (2014) Application of formal safety assessment in the legal activity of international maritime. J Kones Powertrain Transp 21. https://doi.org/10.5604/12314005.1130510 Stamatelatos M, Vesely W, Dugan J, Fragola J, Minarick J, Railsback J (2002) Fault Tree Handbook with Aerospace Application [online]. Washington: NASA. Available: https://www.elibrary.gsfc.nasa.gov/_assets/doclibBidder/tech_docs/Fault%20Tree%20Handbook.pdf [Accessed 1st Aug 2018] Sun M, Zheng Z, Gang L (2018) Uncertainty analysis of the estimated risk in formal safety assessment. Sustainability 10: 321 https://doi.org/10.3390/su10020321 Suresh PV, Babar AK, Raj VV (1996) Uncertainty in fault tree analysis: a fuzzy approach. Fuzzy Sets Syst 83: 135–141. https://doi.org/10.1016/0165-0114(95)00386-X Vassalos D (2009) Risk-Based Ship Design. Springer–Verlag, Berlin Vidmar P, Perkovič M (2018) Safety assessment of crude oil tankers. Saf Sci 105: 178–191 https://doi.org/10.1016/j.ssci.2018.02.009 Wang J, Pillay A (2003) Technology and safety of marine system. Elsevier Ocean Engineering Series, London Wang J, Ruxton T (1998) A design-for-safety methodology for large engineering systems. J Eng Des 9: 159–170. https://doi.org/10.1080/095448298261606 Westwood D (2006) World Offshore Drilling Spend Forecast 2006–2010 [online]. Available: http://www.offshorecenter.dk/log/bibliotek/Spending%20surge%20for%20offshore%20drilling.PDF [Accessed 18th May 2017] Xu L, Yang J-B (2001) Introduction to multi-criteria decision making and the evidential reasoning approach, Manchester School of Management Manchester Yang Z, Maistralis L, Bonsall S, Wang J (2018) Use of fuzzy evidential reasoning for vessel selection under uncertainty. Multi-Criteria Decision Making in Maritime Studies and Logistics. Springer Yazdi M, Kabir S (2018) Fuzzy evidence theory and Bayesian networks for process systems risk analysis. Human and Ecological Risk Assessment: An International Journal, 1–30. doi: https://doi.org/ 10.1080/10807039.2018.1493679 Yuhua D, Datao Y (2005) Estimation of failure probability of oil and gas transmission pipelines by fuzzy fault tree analysis. J Loss Prev Process Ind 18: 83–88. https://doi.org/10.1016/j.jlp.2004.12.003 Zhang D, Yan X, Yang Z, Wang J (2011) Application of formal safety assessment to navigational risk evaluation of Yangtze River. International Conference on Ocean, Offshore and Arctic Engineering Rotterdam: America Society of Mechanical Engineering Zio E (2008) Risk-informed regulation: handling uncertainty for a rational management of safety. Nucl Eng Technol 40: 327–348 https://doi.org/10.5516/NET.2008.40.5.327