Interference between horizontally reflected and the direct path of acoustic waves in anisotropic shallow water waveguides has been verified experimentally (Badiey et al., 2002; 2005; 2007) and theoretically (Katsnelson and Pereslkov, 2000; Oba and Finette, 2002; Finette and Oba, 2003). This effect is pronounced when the direction of an acoustic track is almost parallel to the wave front of a Nonlinear Internal Wave (NLIW). Focusing and defocusing of signal occur in the horizontal plane resulting in temporal intensity fluctuations. Acoustic normal modes can become highly irregular or completely extinguished (Badiey et al. 2002; Lin et al., 2009). Higher order modes refract more than lower order modes in some NLIW events (Lynch et al., 2010). Double arrival of the signal intensity has also been shown before (DeFerrari et al., 2008; Duda et al., 2012; Rubenstein and Bril, 1991; Collis et al., 2008). Recently, a three-dimensional (3D) NLIW reconstruction method (Badiey et al., 2013; 2016) was introduced to extract the NLIW parameters from the measured environmental data. Here, we are motived to study the evolution of the acoustical normal modes due to the NLIW by applying this reconstruction method to one simultaneously measured environmental and acoustic dataset. The results of this paper using the reconstructed 3D NLIW environment will improve the understanding of NLIW effects on 3D sound propagation in shallow water.
In this paper, we demonstrate the evolution of the acoustic field in terms of normal modes when the NLIW is moving with respect to the acoustic track. Both the measured acoustic data and the numerical simulations with the reconstructed NLIW inputs are processed and analyzed. While detailed data-model comparison is not feasible due to the lack of adequate environmental measurements, the results from numerical simulations can phenomenologically explain the observed modal behavior.
First three waveguide modes are extracted from 100 Hz M-sequences data received by an L-shaped array located 20 km from the source. The interplay between these modes and the double arrival for selected modes due to the NLIW are observed in both vertical and horizontal modal behavior. Using the theory of vertical modes and horizontal rays (Burridge and Weinberg, 1997), the formation mechanism of the out of plane signal caused by horizontal acoustic ray refraction is shown. While all modes encounter refraction in the presence of NLIW, the higher order modes exhibit pronounced arrival time fluctuations and uneven distribution of modal energy over the horizontal receiver array.
In section 2, the environmental data from a shallow water continental shelf with NLIW are shown and the data processing technique is applied to obtain the acoustic channel impulse response. In section 3, the individual modes are obtained through mode filtering and the modal behavior is explained by vertical modes and horizontal ray calculations. Finally, in section 4, a summary of the paper is provided.
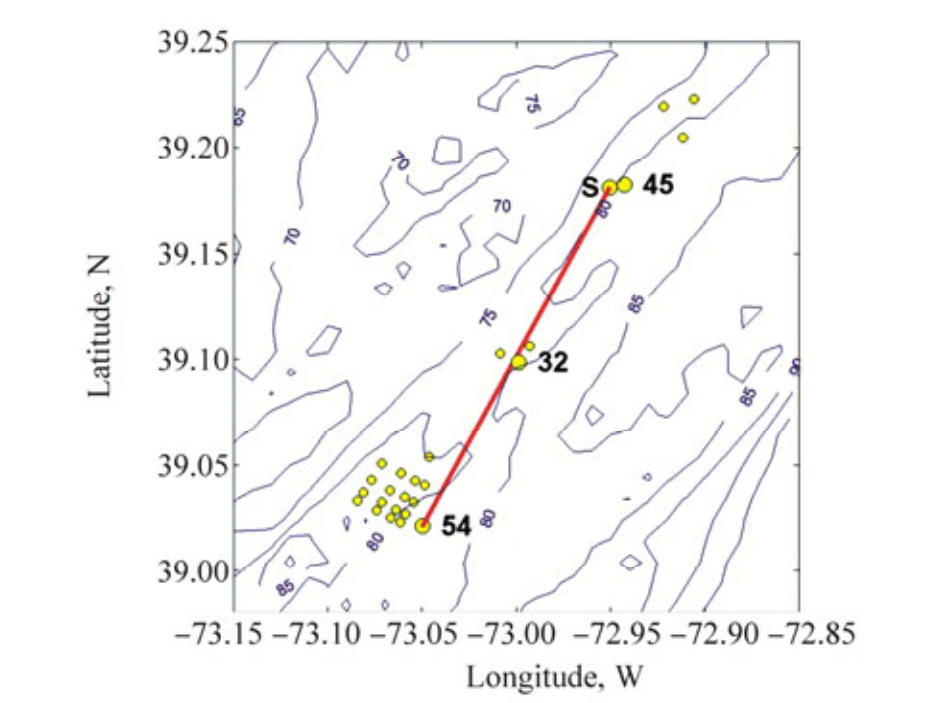
2 MeasurementsDuring the SW06 experiment, the water column temperature profile was monitored through a large number of thermistor strings during transmissions of a number of acoustic sources in a shallow water region (Newhall et al., 2007). Here we examine the acoustic transmission from the Miami Sound Machine (MSM) and the reception recorded at the SHARK L-shape array on August 17, 2006. The water depth was about 79 m at the SHARK receiver array. The acoustic source (MSM) was deployed at site S, which was close to the mooring position #45. The receiver array (SHARK) was deployed at the mooring position #54. The SW06 map with bathymetric contour (Fig. 1) shows the locations of moorings by yellow dots. The red line in Fig. 1 marks the fixed source-receiver track.
|
Figure 1 SW06 map with mooring locations and fixed source-receiver track. Thermistor arrays are shown by yellow dots |
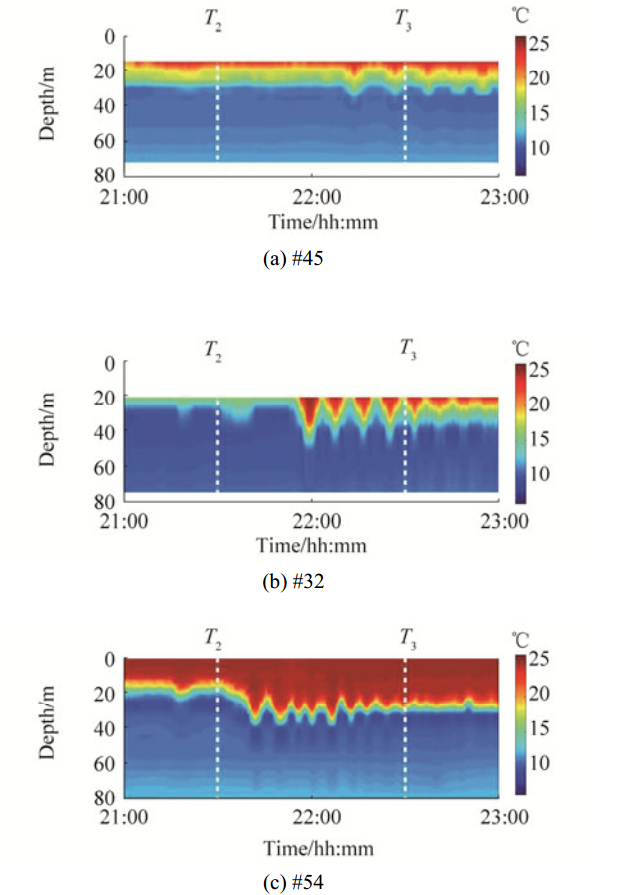
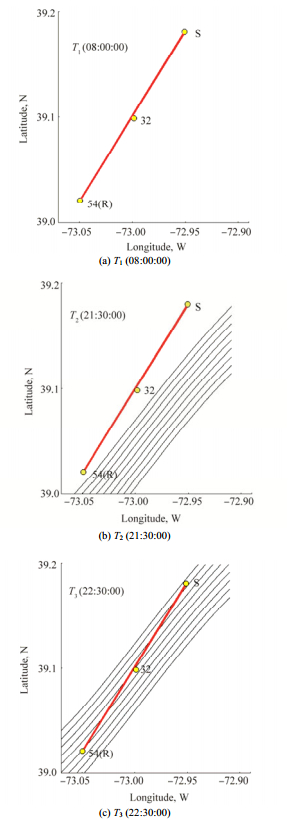
As shown in Fig. 2, the temperature profile exhibits spatial and temporal variability due to the presence of internal waves. The three images in Fig. 2 show the temperature profile evolution over time at the three locations: (a) close to the source (#45), (b) middle-way (#32), and (c) receiver (#54) positions. Note that there were no temperature measurements in the upper water column at the mooring locations #45 and #32. Three geo-times (T1, T2, and T3) are selected in this paper. T1, 08:00:00 GMT on August 17, is chosen to show the modal structure in a quiescent environment, which have no major water column perturbations. T2 (21:30:00 GMT on August 17) and T3 (22:30:00 GMT on August 17) indicated by white vertical dashed dotted lines in Fig. 2 are selected to investigate the acoustic fluctuations for onset and within the internal wave presence. Through the use of a three-dimensional mapping technique (Badiey et al., 2013; 2016), the temperature field of the NLIW was reconstructed by interpolating temperature data at these three positions. As shown in Fig. 2, the NLIW fronts at each thermistor string can be clearly identified. The leading wave front with the maximum amplitude was used to determine the arrival times of NLIW at all the mooring locations of the thermistor strings. To obtain the interpolated field, 26 triangles were formed using the thermistor strings shown as yellow dots in Fig. 1. The vertexes of each triangle correspond to three neighboring thermistor strings. Then, a Barycentric interpolation method (Shirley and Marschner, 2005) was utilized to obtain the arrival time and the time-evolving temperature field at any point within each triangle. The resulting NLIW fronts at these three patches of ocean (i.e. close to source, middle-way, and receiver positions) were smoothly connected by the fourth order polynomial fitting. The three subplots of Fig. 3 show the reconstructed internal wave fronts, indicated by multiple parallel curves, at three aforementioned geo-times. As shown, the angle between the acoustic track and NLIW front was about 5°. The NLIWs propagated across the acoustic track at a speed of 0.8 m/s.
|
Figure 2 Measured temperature profiles as a function of geo-time at three locations (a) #45, (b) middle point (#32), and (c) Shark receiver position (#54). No temperature measurements in the upper water column at #45 and #32. T1 (08:00:00), T2 (21:30:00) and T3 (22:30:00) are three different geo-times used in this paper. The white vertical dashed dotted lines indicate the two different geo-times (T2 and T3) |
|
Figure 3 Internal wave fronts (black curves) obtained by matching the internal wave propagation around three ocean patches within the SW06 experimental area. The acoustic source and receivers were deployed at positions S and #54 respectively; the red line marks the acoustic propagation track |
During the SW06 experiment, M-sequences at multiple acoustic frequencies were transmitted from the MSM. The source depth was 56 m. Here we processed the M-sequence centered at the frequency of 101.725 3 Hz. The symbol rate of the 63-digit M-sequence was a quarter of the center frequency, about 25 Hz. The nominal bandwidth of the signal, thus, was 25 Hz. The 63-digit M-sequence repeated itself every 2.48 seconds. The total M-sequence duration was 89.18 seconds. The source level was 186 dB re 1 μPa.
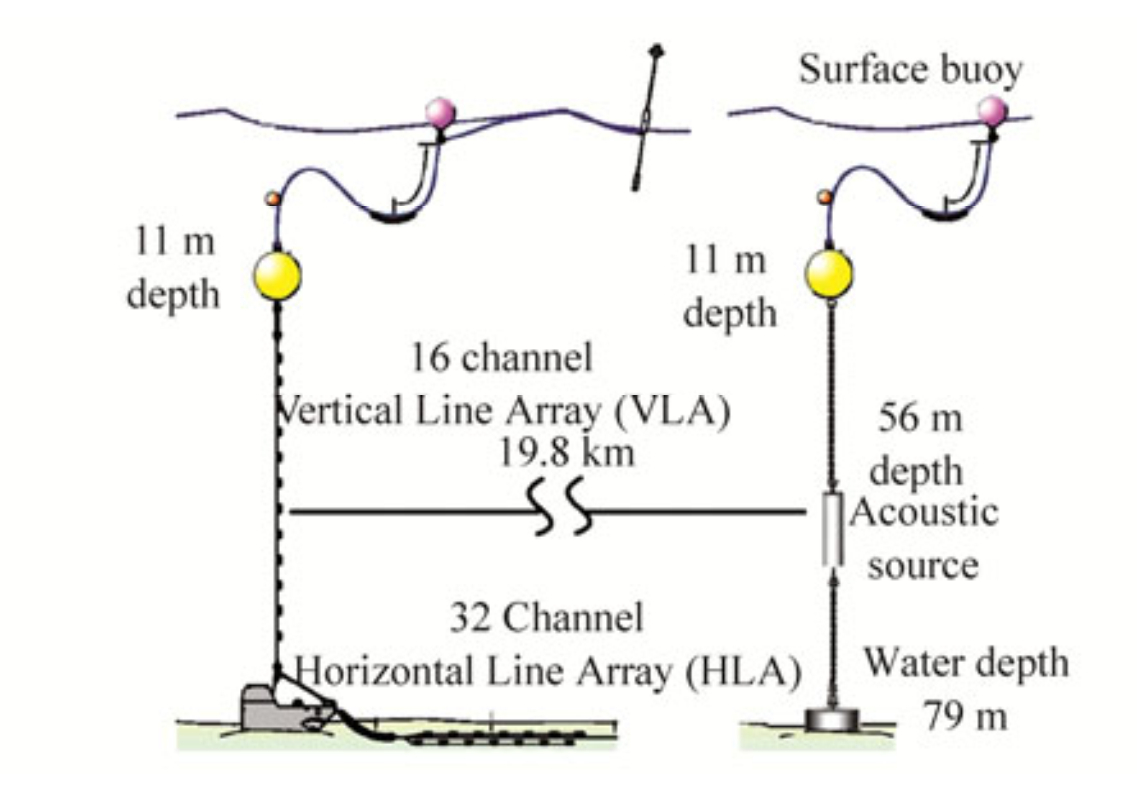
The SHARK array had 16 elements as its vertical component distributed over the water column and 32 elements at its horizontal component laid at the seafloor. The vertical line array covered the water column from 13.5 m to 77.25 m, with uneven element spacing. Its Horizontal Line Array (HLA) started its first element at 3 m, extended northward, and ended with the last element at 468 m, away from the anchor of vertical line array. The horizontal element spacing was 15 m. The experimental set-up of the SHARK array and the acoustic source is shown in Fig. 4. The HLA and the acoustic track formed an angle of 26°, with the MSM located at the eastern side. The impulse responses between the source and the SHARK array, both its vertical and horizontal elements, were obtained after matched filter pulse compression of the received m-sequence transmissions (DeFerrari et al., 2008).
|
Figure 4 The set-up of SHARK receiver array and acoustic source (Newhall et al., 2007) |
The acoustic mode behaviors during the interval wave event are shown in this section. Ray-mode simulations are provided to explain the observed modal fluctuations.
Figs. 5–7 show the evolution of acoustic modal behavior, when the packet of strong internal waves passed through the acoustic track. In Figs. 5–7 (a) shows the modal decomposition results for three geo-times T1−T3, respectively. The first three modes were identified using the reduced rank pseudo-inverse mode filter (Buck et al., 1998). It is noted that the value of the modal amplitude is relative. (b) and (c) show the impulse responses at the vertical and horizontal line arrays, respectively, obtained by pulse compression of the received m-sequences. Especially, (b) shows the impulse responses at the vertical line array, with the shallowest element shown at the top. (c) shows the impulse responses at the horizontal array, with the furthest element away the vertical line array shown at the bottom. The color indicates the intensity, with the same scale for all the plots. Based on the horizontal line array element positions (Newhall et al., 2007), the impulse responses at the HLA were shifted by their arrival time differences with the vertical line array. This was to identify the modal structure on the HLA and the potential arrival delays due to the water column activities. As shown in Figs. 5–7, variations of the relative modal arrival times across the HLA was small. This justifies the use of vertical model structure to identify the individual modes across the HLA.

|
Figure 5 Acoustic modal behavior at T1 |

|
Figure 6 Acoustic modal behavior at T2 |

|
Figure 7 Acoustic modal behavior at T3 |
During the quiescent environment at geo-time T1, three modes are well separated, as shown by the modal decomposition results in Fig. 5(a). Such mode separation is clear at both the vertical and horizontal line arrays. The arrival time difference between the first two modes is 70 ms. The third mode arrives 200 ms later than the first mode. Across the HLA, all three modes have stable and almost even distribution of intensity.
At geo-time T2, the leading front of the internal wave packet comes close to the acoustic track as shown in Fig. 3(b). The second mode becomes weaker. Multiple returns show up for the second mode, as shown in Fig. 6(a). The first return of the second mode overlaps the first mode. The third mode arrival's width is broadened, likely as a result of multiple returns. At the horizontal line array, additional returns from the second and third modes are shown. Interestingly, all of the returns from the second and third modes both concentrate at the first half of the horizontal line array.
At geo-time T3, when the internal wave packet completely covers the source-receiver track, the first two modes collapse into a single return. As shown in Fig. 7(a), the amplitude of the first mode drops significantly. The second mode becomes the strongest instead. The third mode drops to about half level compared to T1 and T2. It also arrives only 60 ms later than the first two modes. In comparison, the third mode arrives more than 200 ms later than the first mode during geo-time T1. At the horizontal line array, only one strong, focused return appears as the combination from the first two modes.
Multiple features of the modal fluctuations are shown at the horizontal line array in the interval wave field: mainly including 1) multiple returns for the second and third modes and 2) drastic reduction of the relative arrival time for the third mode. Mechanism of both behaviors can be illustrated by the acoustic ray-mode simulations (Burridge and Weinberg, 1997). The complex sound field generated by a point source with unit amplitude has the form
| $ \psi \left({r, z} \right) = \sum\limits_l {{a_l}\left(r \right){\psi _l}\left({r, z} \right)} $ | (1) |
where r = (x, y), ψl (r, z) is the local normal modes and al (r) is the modal amplitudes. The modal amplitude can be denoted by Eq. (2) in terms of modulus Al (r) and phase θl (r), both parametrically depending on r in the horizontal plane.
| $ {a_l}\left(r \right) = {A_l}\left(r \right){{\rm{e}}^{{\rm{i}}\theta _l\left(r \right)}} $ | (2) |
The quantities Al (r) and θl (r) are the amplitude and phase incursions (eikonal) of the lth vertical mode. One can obtain 2D equations of ray acoustics for these quantities. In particular, the eikonal equation in the horizontal plane has the form (Katsnelson et al., 2012)
| $ {\left({{\nabla _r}{\theta _l}} \right)^2} = {\left({q_l^0} \right)^2}n_l^2\left(r \right) $ | (3) |
where
The quantities Al (r) satisfies
| $ 2{\nabla _r}{A_l}{\nabla _r}{\theta _l} + {A_l}\nabla _r^2{\theta _l} + {q_l}{\gamma _l}{A_l} = 0 $ | (4) |
where
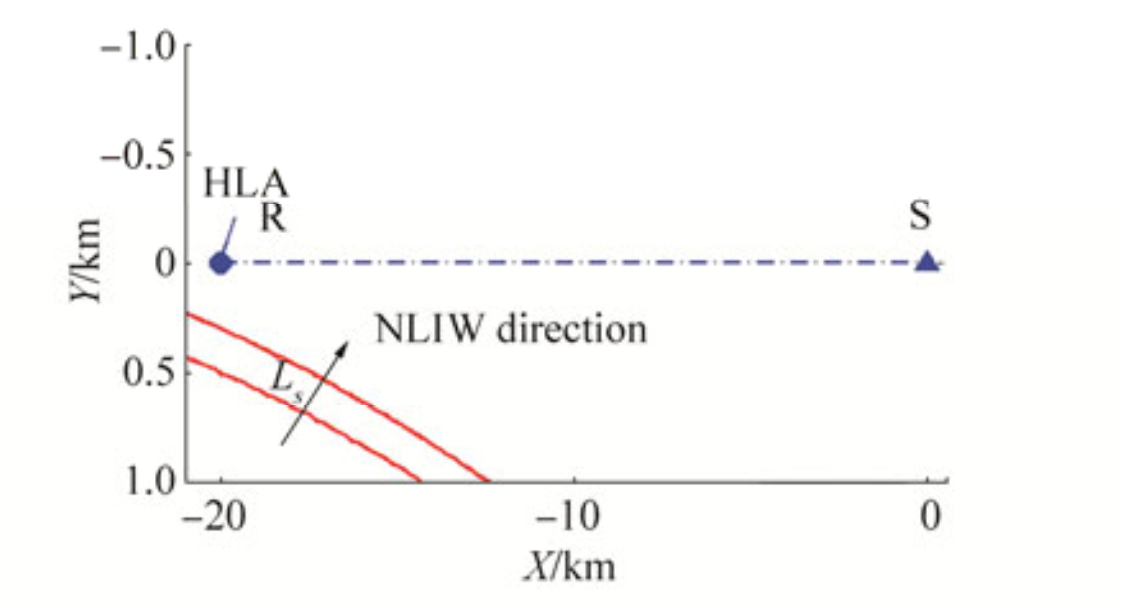
In this paper, we design and perform a numerical experiment based on the acoustic ray-mode simulations. In our simulations, the SW06 source-receiver geometry and SHARK array configuration were adopted. In Fig. 8, the SW06 geometry was rotated clockwise so that the source-receiver track aligns with the x-axis. The solid blue line shows the position of the horizontal line array. A circle (marked as R) and a triangle (marked as S) indicate the vertical line array anchor position and the source position, respectively. The source-receiver track is marked as the blue dashed line. An arc-shaped internal wave front (black dashed dotted curve in Fig. 8. radius of arc = 200 km) was utilized as the environment input for the simulation. It is noted the x and y axes are not equal scale.
|
Figure 8 The set-up of the numerical experiment based on the acoustic ray-mode simulations. A circle (marked as R) and a triangle (marked as S) indicate the VLA anchor position and the source position, respectively |
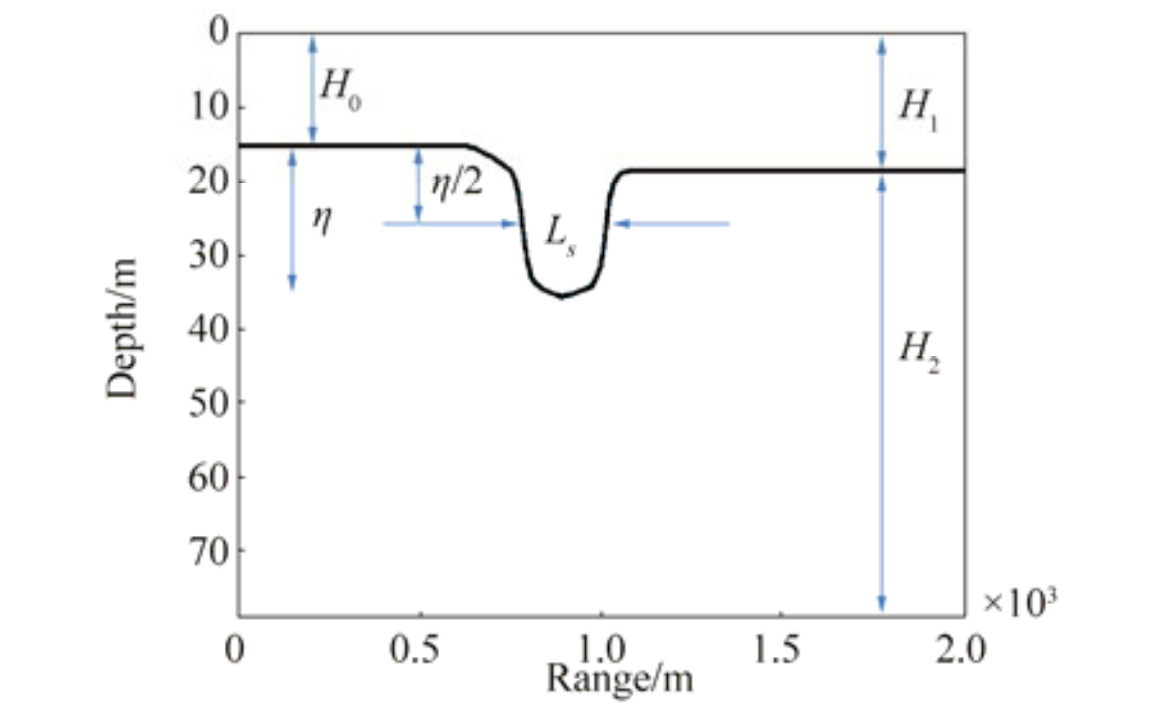
The numerical simulations used a water depth of 79 m and a flat seafloor. The interval wave event observed on August 17, 2006 was simulated to perturb the water column. Only the first soliton (shown in Fig. 9) of the internal wave packet was utilized in the simulations to study the deterministic effect of NLIW when its leading front approaches the acoustic track at a small angle (around 5o). Following Apel's notation (Apel et al., 2007) in choosing the soliton parameters, the extracted parameters are the soliton amplitude (η=20.3 m), the half-width length (Ls=235.9 m), and layer depths (H0=15.3 m, H1=18.6 m, and H2=60.4 m).
|
Figure 9 The first soliton of the NLIW event observed on August 17, 2006. The black curve represents the temperature contour at 17 oC, which was the temperature at the middle of the thermocline. The extracted soliton parameters are the soliton amplitude (η=20.3 m), the half-width length (Ls= 235.9 m), and layer depths (H0=15.3 m, H1=18.6 m, and H2=60.4 m) |
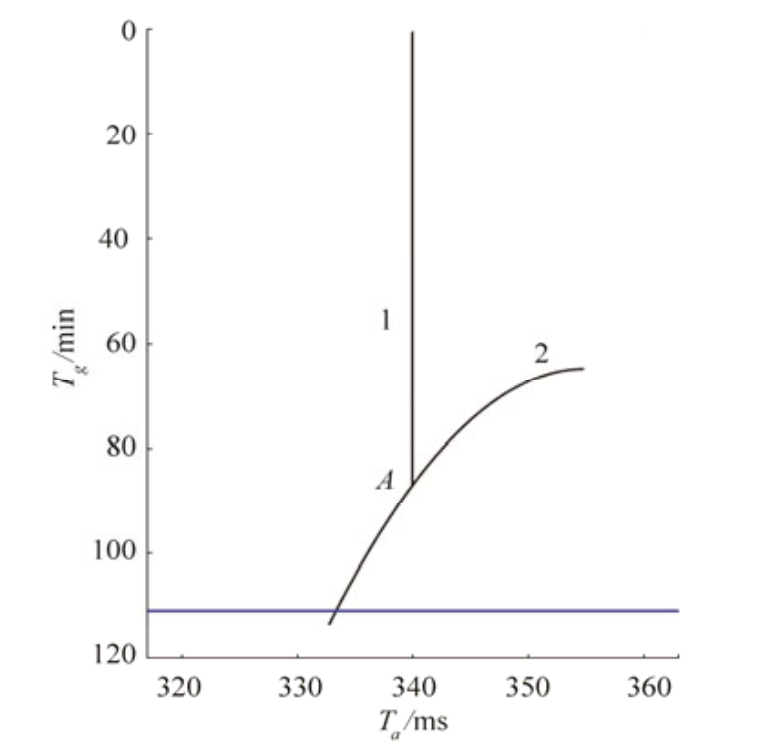
Fig. 10 shows the horizontal ray plots for the first three modes, when the front of the NLIW just passes R, the beginning of the HLA. Two red lines indicate the leading and back edges of the NLIW, whose front has the shape of an arc (radius = 200 km). The horizontal rays arrive at the HLA are shown as thick lines in Fig. 10. Due to the presence of the NLIW, i.e., warmer water, the three modes show refraction at the horizontal plane, but at different extents. While ray bending of the first mode is barely noticeable, both the second and third modes show stronger refraction around the internal wave front and at the HLA. Especially for the third mode, a large bundle of the rays enters the NLIW, refracts off its center (crest) and is bent away from R at such a great degree. It overshoots the direct path and creates a large focusing zone. The combination of the internal wave parameters (radius=200 km, η=12 m, Ls=235.9 m, H0=15.3 m, H1=18.6 m, H2=60.4 m, and the angle between S-R track and NLIW propagation direction is 7°) are chosen so that the horizontal rays of mode 2 and 3 are concentrated on the first half of the HLA. For calculation of the sound field of a given mode, one needs sum over all the mode rays. In this case, the uneven distribution of the density of the second and third mode rays over the HLA corresponds to the uneven distribution of their mode energy, which is very similar to the experiment observation. Using a ray-tracing model, the intensity of modes 1–3 can be calculated and the results are shown in the top, middle and bottom panels of Fig. 11, respectively. The uneven distribution of the second and third mode intensity at the HLA are consistent with their results of horizontal rays. It is noticed that we use the simplified 3D NLIW inputs to the Ray-Mode calculation. The range dependency of the NLIW front is omitted due to the lack of adequate environmental measurements. Only the first soliton of the observed NLIW is utilized and some NLIW parameters (e.g. soliton amplitude and the angle between S-R track and NLIW propagation direction) are adjusted from the measurement data. Strictly speaking, this paper does not provide the feasible data-model comparison, however the results from numerical simulations can phenomenologically explain the observed modal behavior. Fig. 12 shows the averaged arrival time fluctuations for mode 3, observed at position R. The horizontal axis represents the relative arrival time in milliseconds and the vertical axis shows the geo-time in minutes, during which the NLIW pass through the region. The arrival time plot consists of two segments. Segment 1 represents the direct path arrivals with little fluctuation in the arrival time until 86 minutes (marked as A). Segment 2, which represents the averaged arrival time of the refracted paths, starts at 65-minute mark and converges with segment 1 at 86-minute mark. Between 65–86 minutes, when both direct and refracted paths co-exist, they create the environmental condition of horizontal interference. Beyond the point A (86-minute mark), although the refracted path is longer than the direct path, mode 3 travels faster along the refracted path with the warmer water between the leading and back edges of the NLIW, thus the arrivals of direct and refracted paths are overlapped.

|
Figure 10 Modal dependence of horizontal ray in an ocean environment with a curved NLIW front. Two red lines indicate the leading and back edges of the NLIW, whose front has the shape of an arc (radius = 200 km). A short blue line shows the position of HLA. The horizontal rays of modes 1–3 are shown respectively, with the ones arrived at HLA drawn as thick lines |

|
Figure 11 Modal intensity of modes 1–3 |
|
Figure 12 Averaged arrival time of direct ray path (1) and refracted ray path (2) for horizontal ray of mode 3. The blue line (at time of 111 minutes) indicates the geo-time of Figs. 10 and 11 |
In this paper, the modal arrival time curves are obtained from the vertical modes and horizontal ray-tracing model. A theoretical and computational explanation of this phenomenon is also provided using the approach of vertical modes and horizontal parabolic equation by (Badiey et al., 2005; 2011). In their paper, a single modal arrival for mode 4 at 300 Hz is initially seen, then one also sees a second arrival for this mode. Using a simplified NLIW with curved front, the modal arrival patterns shown in the modeled results are comparable with those observed in the data.
4 Summary and conclusionsThe evolution of acoustic normal modes along the HLA was observed before, onset, and within the presence of internal wave during a NLIW event in SW06 experiment. The impulse response of 100 Hz M-sequences signals received at a distance of about 20 km is analyzed to study the internal wave effects on the first three normal modes. The modal behavior is summarized. 1) the first mode arrival is stable throughout the internal wave event. 2) the uneven distribution of modal intensity over the HLA is observed. These experimental observation is explained by the acoustic ray mode simulation. 3) the arrival time difference between the first and the higher order modes becomes smaller in the presence of internal waves. Especially, the arrivals of the first two modes are overlapped when the internal wave completely covers the acoustic source-receiver track (i.e. the bottom panel of Fig. 3), because the higher order modes travel faster when the thermocline (or warm water) is pushed down by the NLIW. 4) for the case when the angle between the acoustic track (S-R) and NLIW front was small (i.e. about 5° as shown in the middle panel of Fig. 3), the additional returns of the second and third modes, indicating their refractions by the internal wave, are explained by the acoustic ray mode simulation. It is noted that all modes encounter refraction in the presence of NLIW, the modal arrival time curves and the distribution of modal energy over the HLA depend on the mode number and frequency of the acoustic signal. For a given frequency (i.e. 100 Hz in this paper), the higher order modes exhibit more pronounced arrival time fluctuations and the uneven energy distribution. In addition, the numerical study based on the acoustic ray-mode simulations indicates that the modal arrival time curves (e.g. the arrival times of mode 3 as a function of geo-time shown in Fig. 12) are related to the NLIW parameters. The continuation of this research may focus on the feasibility of estimating NLIW parameters by matching the measured and modeled modal arrival time curves, which can be a very important application of this research.
AcknowledgmentsThis research was supported by the Office of Naval Research, Ocean Acoustics Program (322OA) through grants N00014-11-1-0701 and N00014-13-1-0306 in parts by the Multidisciplinary University Research Initiative and the Integrated Ocean Dynamics and Acoustics. Authors are grateful for the support and wish to thank the members of the SW06 research program who attended the field experimentation.
Apel J, Ostrovsky L, Stepanyants Y, Lynch JF. Internal solitons in the ocean and their effect on underwater sound[J]. Journal of the Acoustical Society of America, 2007, 121(2): 695-722. DOI:10.1121/1.2395914 ( 0) 0)
|
Badiey M, Katsnelson BG, Lynch JF, Pereselkov S, Siegmann WL. Measurement and modeling of three-dimensional sound intensity variations due to shallow-water internal waves[J]. Journal of the Acoustical Society of America, 2005, 117(2): 613-625. DOI:10.1121/1.1828571 ( 0) 0)
|
Badiey M, Katsnelson BG, Lin YT, Lynch JF. Acoustic multipath arrivals in the horizontal plane due to approaching nonlinear internal waves[J]. Journal of the Acoustical Society of America, 2011, 129(4): EL141-147. DOI:10.1121/1.3553374 ( 0) 0)
|
Badiey M, Katsnelson BG, Lynch JF, Pereselkov S. Frequency dependence and intensity fluctuations due to shallow water internal waves[J]. Journal of the Acoustical Society of America, 2007, 122(2): 747-760. DOI:10.1121/1.2722052 ( 0) 0)
|
Badiey M, Mu Y, Lynch JF, Apel JR, Wolf S. Temporal and azimuthal dependence of sound propagation in shallow water with internal waves[J]. IEEE Journal of Oceanic Engineering, 2002, 27: 117-129. DOI:10.1109/48.989898 ( 0) 0)
|
Badiey M, Wan L, Lynch JF. Statistics of nonlinear internal waves during the shallow water 2006 experiment[J]. Journal of Atmospheric and Oceanic Technology, 2016, 33: 839-846. DOI:10.1175/JTECH-D-15-0221.1 ( 0) 0)
|
Badiey M, Wan L, Song AJ. Three-dimensional mapping of evolving internal waves during the shallow water 2006 experiment[J]. Journal of the Acoustical Society of America, 2013, 134(1): EL7-13. DOI:10.1121/1.4804945 ( 0) 0)
|
Buck JR, Preisig JC, Wage KE. A unified framework for mode filtering and the maximum a posteriori mode filter[J]. Journal of the Acoustical Society of America, 1998, 103(4): 1813-1824. DOI:10.1121/1.421334 ( 0) 0)
|
Burridge R, Weinberg H, 1977, Wave propagation and underwater acoustics. Springer, New York. http://www.springerlink.com/content/n50721178423/
( 0) 0)
|
Collis JM, Duda TF, Lynch JF, DeFerrari HA. Observed limiting cases of horizontal field coherence and array performance in a time-varying internal wavefield[J]. Journal of the Acoustical Society of America, 2008, 124(3): EL97-103. DOI:10.1121/1.2947630 ( 0) 0)
|
DeFerrari HA, Lynch JF, Newhall AE. Temporal coherence of mode arrivals[J]. Journal of the Acoustical Society of America, 2008, 124(3): EL104-109. DOI:10.1121/1.2968304 ( 0) 0)
|
Duda TF, Collis JM, Lin YT, Newhall AE, Lynch JF, DeFerrari HA. Horizontal coherence of low-frequency fixed-path sound in a continental shelf region with internal-wave activity[J]. Journal of the Acoustical Society of America, 2012, 131(2): 1782-1797. DOI:10.1121/1.3666003 ( 0) 0)
|
Finette S, Oba R. Horizontal array beamforming in an azimuthally anisotropic internal wave field[J]. Journal of the Acoustical Society of America, 2003, 114: 131-144. DOI:10.1121/1.1582441 ( 0) 0)
|
Katsnelson BG, Pereselkov S. Low frequency horizontal acoustic refraction caused by internal wave solitons in a shallow sea[J]. Acoustical Physics, 2000, 46: 684-691. DOI:10.1134/1.1326723 ( 0) 0)
|
Katsnelson BG, Petnikov V, Lynch JF, 2012. Fundamentals of shallow water acoustics. Springer, New York, 127. http://www.springerlink.com/content/978-1-4419-9777-7
( 0) 0)
|
Lin YT, Duda TF, Lynch JF. Acoustic mode radiation from the termination of a truncated nonlinear internal gravity wave duct in a shallow ocean area[J]. Journal of the Acoustical Society of America, 2009, 126: 1752-1765. DOI:10.1121/1.3203268 ( 0) 0)
|
Lynch JF, Lin YT, Duda TF, Newhall AE. Acoustic ducting, reflection, refraction, and dispersion by curved nonlinear internal waves in shallow water[J]. IEEE Journal of Oceanic Engineering, 2010, 35: 12-27. DOI:10.1109/JOE.2009.2038512 ( 0) 0)
|
Newhall AE, Duda TF, Von der Heydt K, Irish JD, Kemp JN, Lemer SA, Liberatore SP, Lin YT, Lynch JF, Maffei AR, Morozov AK, Shmelev A, Sellers CJ, Witzell WE, 2007. Acoustic and oceanographic observations and configuration information for the WHOI moorings from the SW06 experiment. Woods Hole Oceanographic Institution, Woods Hole, Massachusetts, United States, Report No. WHOI-2007-04.
( 0) 0)
|
Oba R, Finette S. Acoustic propagation through anisotropic internal wave fields:transmission loss, cross-range coherence, and horizontal refraction[J]. Journal of the Acoustical Society of America, 2002, 111: 769-784. DOI:10.1121/1.1434943 ( 0) 0)
|
Rubenstein D, Bril MN, 1991. Ocean variability and acoustic propagation. Kluwer Academic, Dordrecht, 215-228.
( 0) 0)
|
Shirley P, Marschner S, 2005. Fundamentals of computer graphics. 2nd ed. , A K Peters, Wellesley, United States, 43-46, 63-67.
( 0) 0)
|
 2017, Vol. 16


