2. College of Underwater Acoustic Engineering, Harbin Engineering University, Harbin 150001, China
1 Introduction
The study of acoustic scattering mechanisms and characteristics of underwater target echoes is essential in the detection of underwater passive and quiet target. The basic structure and characteristics of target echo have been obtained by research on simple structure targets such as spherical shell and cylinder (Fan, 2001). To accurately describe the complex scattering properties of underwater targets in engineering application, Tang (1994) proposed the highlight model of underwater targets. Fan et al. (2001) proposed a modified geometrical highlight model of a nonridged surface sonar target.
In accordance with acoustic propagation characteristics, acoustic scattering echoes mainly include rigid components and elastic components (Tang, 1994). The rigid scattering wave is related to target size and shape, which can be used in target classification. The elastic scattering wave is related with the elastic nature of the target and depends on the material and internal structure of the target. The acoustic scattering components alias both in time domain and frequency domain, thereby limiting the extraction of echo characteristics. In addition, the energy of elastic scattering waves is weak and easily submerged by rigid scattering waves. Thus, exploring suitable signal processing methods is necessary. Anderson (2012) applied a time frequency analysis method to differentiate a man-made target such as elastic spherical shell or a cylinder from a natural arterial of similar shape. The research investigated the enhancement effect and benefits of bistatic measurements as well. Li and Meng (2015) extracted the characteristics of rigid scattering components in the Fractional Fourier Transform (FRFT) domain and established an all-direction model in optimal fractional Fourier transform domain. Considering the complex mechanism and important properties of elastic waves, Xia and Li (2015) further proposed a method of mapping the acoustic scattering signal of an target to a single frequency signal and separated elastic scattering components by a narrow-band filter.
The cepstrum, as a signal processing method, was introduced by Bogert et al (1963). Since then, it has been widely used in the field of earth seismology, speech, radar, and sonar, among others. As a nonlinear transformation, cepstrum centralizes spectral energy by logarithm operation and regards the log spectrum as a new signal. When continuing to perform the inverse Fourier transform to log spectrum, the periodic components of the spectrum are extracted, Given this particular ability, cepstrum has seen widespread use in pitch detection of seismic echoes (Sajid and Ghosh, 2014) and speech signal processing (Kobayashi and Shimamura, 1998). By taking the logarithm operation to a spectrum, cepstrum has deconvolution capacity, which converts a product to the sum of two components. Many scholars applied cepstrum in the extraction of formant information (Banerjee et al, 2015) and channel estimation (Fjell, 1976; Fu et al., 2015). In recent years, in the field of underwater acoustic, cepstrum has also been used in the analysis of ship-radiated noise (Tian et al., 2005), time delay estimation (Jantti et al., 2014), and target recognition (Parisi, et al., 2012; Wang et al., 2014).
This paper mainly focuses on the relative delay characteristics of rigid acoustic scattering signal. For the rigid scattering signal of narrow band, cepstrum is used to solve the problem of time delay estimation, which cannot be processed efficiently by conventional correlation methods. The relative delay between specular reflection waves and corner waves of rigid scattering waves from target is estimated effectively. For the problem in which the time delay accuracy of cepstrum is easily influenced by interference such as the similarity of signal waveform or signal-to-noise ratio (SNR), the method of wavelet enhancement in the cepstrum domain is introduced. Simulation results and experiment data illustrate that the anti-interference ability and time delay accuracy of cepstrum significantly increased. Thus, cepstrum can be used as an effective means to extract the echo characteristics of an target.
2 Model of underwater target acoustic scatteringThe analysis of acoustic scattering echo component has been greatly simplified, since the proposal of the highlight model. The highlight model divides a complex target into multiple highlights, and the acoustic scattering echoes of each highlight coherently superimpose, thereby constituting a target echo signal. The highlight model is regarded as a linear system with a transfer function to obtain the expression of the echo signal. Highlights are divided into two types of rigidity and elasticity. Rigid scattering echoes mainly include specular reflection echoes on smooth surfaces and corner echoes, which are related to target size, incident angle, and other factors. Elastic scattering echoes are results of sound wave response on the media boundary surface due to the elastic nature of the target, and it depends on the material and internal structure of the target. Assuming that the expression of transmission signal in frequency domain is Pi(ω), then the acoustic scattering signal generated by a single highlight is
| ${P_o}\left( \omega \right) = \frac{{{{\rm{e}}^{{\rm{j}}kr}}}}{r}H\left( {\mathit{\boldsymbol{r}},\omega } \right){P_i}\left( \omega \right)$ | (1) |
where
| $H\left( {\mathit{\boldsymbol{r}},\omega } \right) = A\left( {\mathit{\boldsymbol{r}},\omega } \right){{\rm{e}}^{{\rm{j}}\omega \tau }}{{\rm{e}}^{{\rm{j}}\varphi }}$ | (2) |
where A(r, ω) is an amplitude factor; for some corners, edge highlights, and elastic highlights, it is related with signal frequency, but for specular reflection highlights, it is only approximately the size of the target. τ denotes delay factor decided by the sound path of the highlight with respect to reference point. φ denotes the phase factor related with the nature of the highlight.
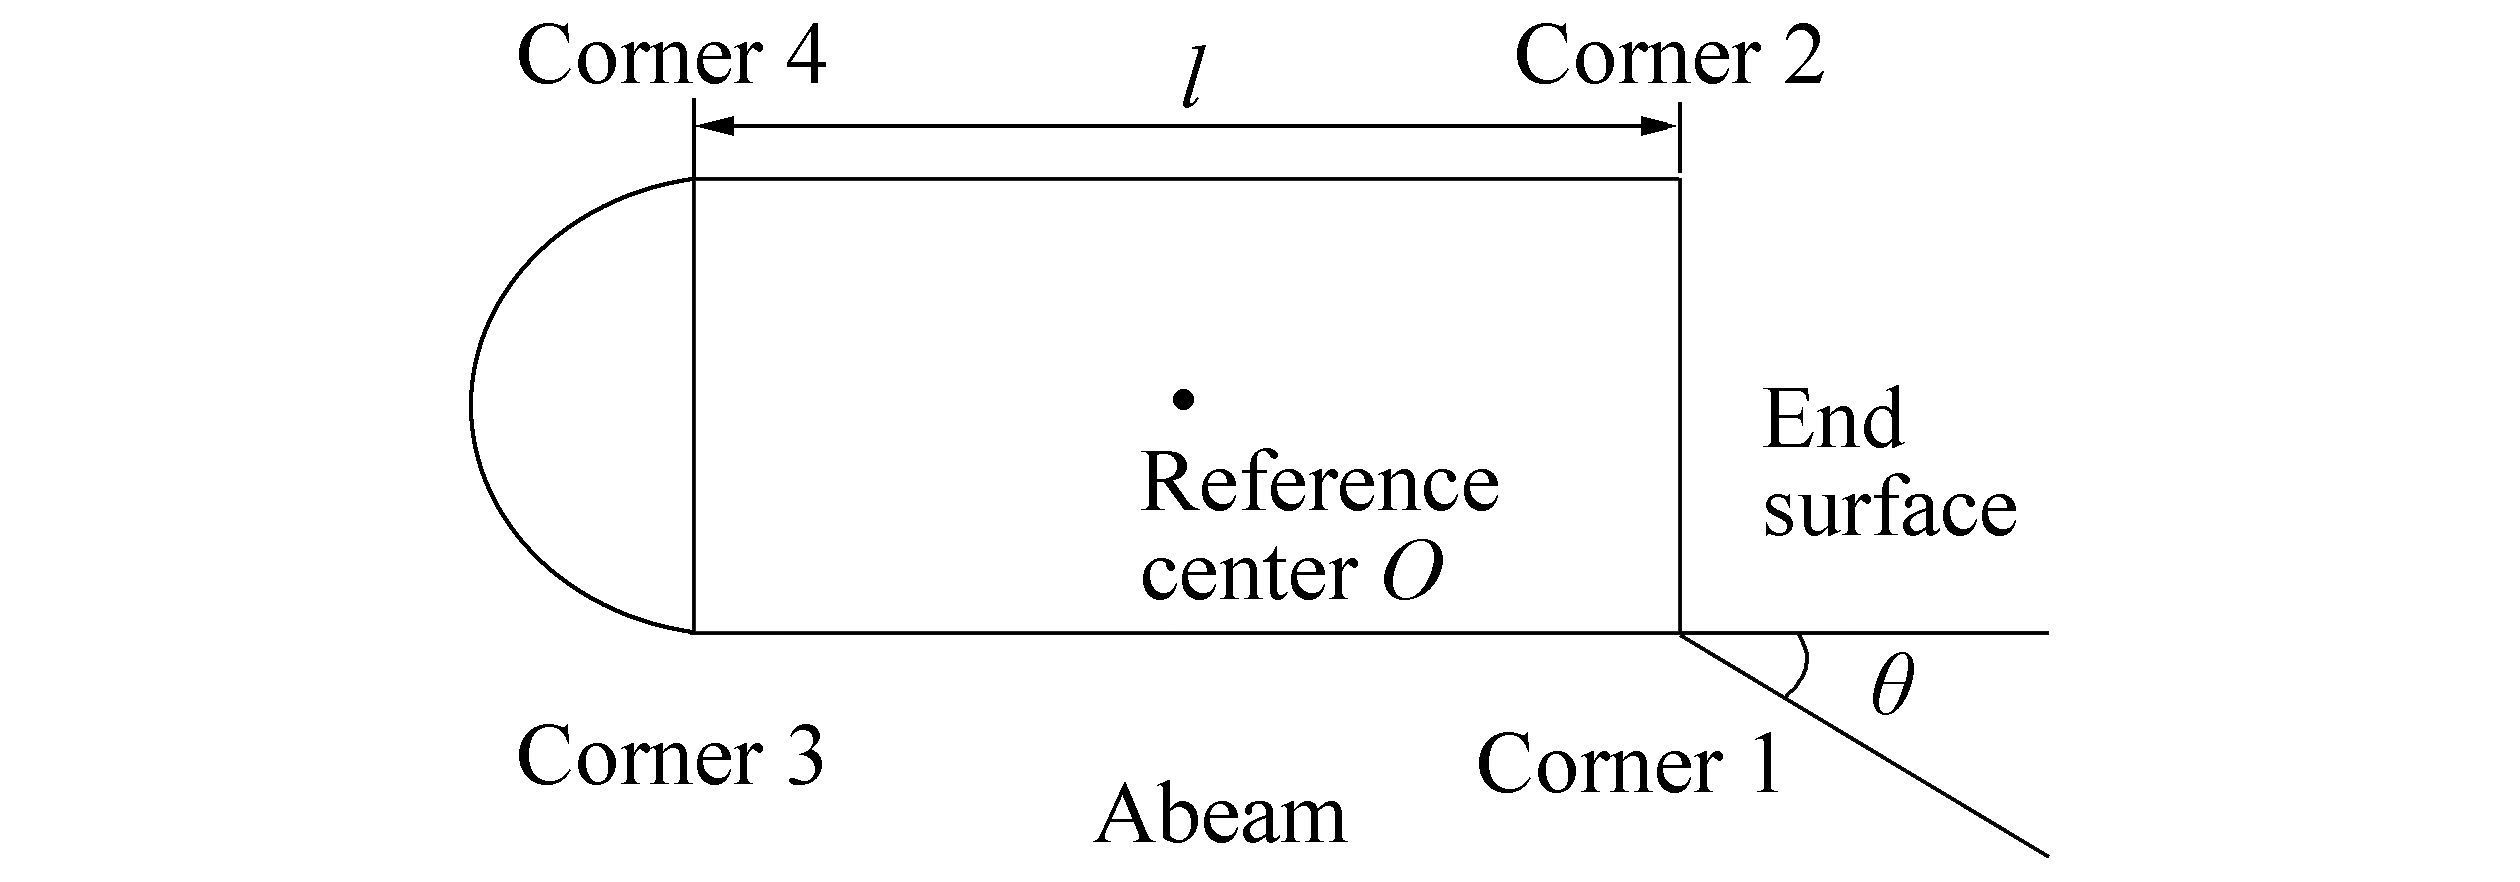
The rigid acoustic scattering component of underwater target echo is often used as a major contributor in actual underwater target detection and recognition. Particularly in the case of marine environment noise and reverberation interference, this echo may provide relatively stable characteristic information. Thus, the rigid scattering wave of the cylindrical body model with a spherical cap is studied. Fig. 1 shows the model schematic diagram; the incident wave is the plane wave, and the incident angle is θ. Ois set as the reference center. The relative delays of each highlight with respect to the reference center that provides a reference for determining the basic structure of geometry scattering echoes is shown in Fig. 2.
|
| Figure 1 Target model schematic diagram |

|
| Figure 2 Relative delay of each highlight with respect to the reference center |
In terms of time delay estimation combined with deconvolution capacity, cepstrum is not influenced by the type of signal. Thus, it can be used to solve the problem of time delay estimation of narrow-band echoes. The definition, signal processing effect, and application conditions of cepstrum are discussed in detail in the following section.
3.1 Definition and basic properties of cepstrumThe cepstrum is defined as the Inverse Discrete Fourier Transform (IDFT) of the logarithm of the magnitude of the Discrete Fourier Transform (DFT) of a signal. Different cepstrum definitions exist, such as complex cepstrum, real cepstrum, and power cepstrum. The complex cepstrum has inverse transform, and it is defined as
| ${c_c}\left( n \right) = {F^{ - 1}}\left\{ {\log \left[ {F\left\{ {x\left( n \right)} \right\}} \right]} \right\}$ | (3) |
The real cepstrum was applied in practice first. It can capture relevant information of signals of interest and is defined as follows:
| ${c_r}\left( n \right) = {F^{ - 1}}\left\{ {\log \left| {F\left\{ {x\left( n \right)} \right\}} \right|} \right\}$ | (4) |
where x(n) is the received signal, n denotes the discrete time index, log denotes the natural logarithm, and F and F-1 denote the DFT and IDFT, respectively. In the next sections, cc(n) and cr(n) are unified as c(n). Fig. 3 shows the block diagram of the cepstrum process.

|
| Figure 3 Cepstrum analysis block diagram |
The time delay estimation capacity of cepstrum originated, from the study of the deconvolution capacity of cepstrum. Signals and channel impulse response can be separated by deconvoluting to the received multi-path signals. In speech signal processing, cepstrum has been used to estimate soundtrack and extract formant information. Cepstrum is also used to estimate channel and acquire time delay information for underwater acoustic channel. Assume that the acoustic signal comes from the sound source and reach receivers along different paths. The transmitted signal is set as x(n), and the acoustic scattering model is regarded as a multi-path channel. Then, the received signal s(n) can be expressed as
| $s\left( n \right) = x\left( n \right) \otimes h\left( n \right)$ | (5) |
where h(n) is the impulse response of the multi-path channel,
| $h\left( n \right) = \sum\limits_{i = 1}^N {{a_i}} \delta \left( {n - {n_i}} \right)\left( n \right) = \sum\limits_{i = 1}^N {{a_i}} \delta \left( {n - {n_i}} \right)$ | (6) |
where ai and ni denote the amplitude and delay of received signal from the ith path, respectively. The cepstrum of received signal c(n) is as follows:
| $\begin{array}{l} C\left( n \right) = {F^{ - 1}}\left\{ {\log F\left\{ {s\left( n \right)} \right\}} \right\} = \\ {F^{ - 1}}\left\{ {\log F\left\{ {h\left( n \right) \otimes x\left( n \right)} \right\}} \right\} = {F^{ - 1}}\left\{ {\log H\left( z \right) \cdot X\left( z \right)} \right\} = \\ {F^{ - 1}}\left\{ {\log H\left( z \right)} \right\} + {F^{ - 1}}\left\{ {\log X\left( z \right)} \right\} = \\ {C_h}\left( n \right) + {C_x}\left( n \right) \end{array}$ | (7) |
where H(z) and X(z) denote the z-transform of h(n) and x(n), and Ch(n), Cx(n) are the cepstrum of h(n) and x(n).
| $H\left( z \right) = Z\left\{ {h\left( n \right)} \right\} = Z\left\{ {\sum\limits_{i = 1}^N {{a_i}} \delta \left( {n - {n_i}} \right)} \right\} = \sum\limits_{i = 1}^N {{a_i}} {z^{ - {n_i}}}$ | (8) |
| $\begin{array}{l} \log \left\{ {H\left( z \right)} \right\} = \log \left( {\sum\limits_{i = 1}^N {{a_i}} {z^{ - {n_i}}}} \right) \approx \\ \left( {\frac{{{a_2}}}{{{a_1}}}{z^{{n_1} - {n_2}}} + \cdots + \frac{{{a_n}}}{{{a_1}}}{z^{{n_1} - {n_N}}}} \right) - \\ \frac{1}{2}{\left( {\frac{{{a_2}}}{{{a_1}}}{z^{{n_1} - {n_2}}} + \cdots + \frac{{{a_n}}}{{{a_1}}}{z^{{n_1} - {n_N}}}} \right)^2} + \\ \frac{1}{3}{\left( {\frac{{{a_2}}}{{{a_1}}}{z^{{n_1} - {n_2}}} + \cdots + \frac{{{a_n}}}{{{a_1}}}{z^{{n_1} - {n_N}}}} \right)^3} + \cdots \end{array}$ | (9) |
Only the first three powers of Eq. (9) are considered and divided into three parts.
The first part:
| $\frac{{{a_2}}}{{{a_1}}}{z^{{n_1} - {n_2}}} + \cdots + \frac{{{a_n}}}{{{a_1}}}{z^{{n_1} - {n_N}}}$ | (10) |
The second part:
| $\begin{array}{l} - \frac{1}{2}{\left( {\frac{{{a_2}}}{{{a_1}}}{z^{{n_1} - {n_2}}} + \cdots + \frac{{{a_N}}}{{{a_1}}}{z^{{n_1} - {n_N}}}} \right)^2} = \\ - \frac{1}{2}\left( {{{\left( {\frac{{{a_2}}}{{{a_1}}}} \right)}^2}{z^{2\left( {{n_1} - {n_2}} \right)}} + \cdots + {{\left( {\frac{{{a_N}}}{{{a_1}}}} \right)}^2}{z^{2\left( {{n_1} - {n_N}} \right)}}} \right) - \\ \sum\limits_{i = 2,j = 2,i \ne j}^N {\frac{{{a_i}{a_j}}}{{a_1^2}}{z^{\left( {2{n_1} - {n_i} - {n_j}} \right)}}} \end{array}$ | (11) |
The third part:
| $\begin{array}{l} \frac{1}{3}{\left( {\frac{{{a_2}}}{{{a_1}}}{z^{{n_1} - {n_2}}} + \cdots + \frac{{{a_N}}}{{{a_1}}}{z^{{n_1} - {n_N}}}} \right)^3} = \\ \frac{1}{3}\left( {{{\left( {\frac{{{a_2}}}{{{a_1}}}} \right)}^3}{z^{3\left( {{n_1} - {n_2}} \right)}} + \cdots + {{\left( {\frac{{{a_N}}}{{{a_1}}}} \right)}^3}{z^{3\left( {{n_1} - {n_N}} \right)}}} \right) + \\ \sum\limits_{i = 2,j = 2,i \ne j}^N {\frac{{a_{_i}^2{a_j}}}{{a_1^3}}{z^{\left( {3{n_1} - 2{n_i} - {n_j}} \right)}}} + \\ \frac{1}{3}\sum\limits_{i = 2,j = 2,k = 2,i \ne j \ne k}^N {\frac{{{a_i}{a_j}{a_k}}}{{a_1^3}}{z^{\left( {3{n_1} - {n_i} - {n_j} - {n_k}} \right)}}} \end{array}$ | (12) |
Then, the inverse z-transform of Eq. (9) is approximately expressed as
| $\begin{align} & {{C}_{h}}\left( n \right)\approx \left\{ \frac{{{a}_{2}}}{{{a}_{1}}}\delta \left( n+{{n}_{1}}-{{n}_{2}} \right)+\cdots +\frac{{{a}_{n}}}{{{a}_{1}}}\delta \left( n+{{n}_{1}}-{{n}_{N}} \right) \right\}- \\ & \frac{1}{2}\left( {{\left( \frac{{{a}_{2}}}{{{a}_{1}}} \right)}^{2}}\delta \left( n+2\left( {{n}_{1}}-{{n}_{2}} \right) \right)+\cdots +{{\left( \frac{{{a}_{N}}}{{{a}_{1}}} \right)}^{2}}\delta \left( n+2\left( \cdots \right) \right) \right)- \\ & \sum\limits_{i=2,j=2,i\ne j}^{N}{\frac{{{a}_{i}}{{a}_{j}}}{a_{1}^{2}}\delta \left( n+2{{n}_{1}}-{{n}_{i}}-{{n}_{j}} \right)}+ \\ & \frac{1}{3}\left( {{\left( \frac{{{a}_{2}}}{{{a}_{1}}} \right)}^{3}}\delta \left( n+3\left( {{n}_{1}}-{{n}_{2}} \right) \right)+\cdots +{{\left( \frac{{{a}_{N}}}{{{a}_{1}}} \right)}^{3}}\delta \left( n+3\left( \cdots \right) \right) \right)+\cdots \\ & \sum\limits_{i=2,j=2,i\ne j}^{N}{\frac{a_{i}^{2}{{a}_{j}}}{a_{1}^{3}}}\delta \left( n+3{{n}_{1}}-2{{n}_{i}}-{{n}_{j}} \right)+ \\ & \frac{1}{3}\sum\limits_{\begin{smallmatrix} i=2,j=2,k=2 \\ \quad i\ne j\ne k \end{smallmatrix}}^{N}{\frac{{{a}_{i}}{{a}_{j}}{{a}_{k}}}{a_{1}^{3}}\delta \left( n+3{{n}_{1}}-{{n}_{i}}-{{n}_{j}}-{{n}_{k}} \right)} \\ \end{align}$ | (13) |
The result of Eq. (13) shows that the cepstrum of channel impulse response
This finding means the peaks will appear periodically at the time delay between each received signals from different paths and direct wave. In addition, peaks at the time of linear combination of these points above occur. a1 is the amplitude of the direct signal. Thus, ai i=2, 3, …, N should be smaller than a1, and a1/ai < 1, that is, the amplitude of peaks shows a general trend of attenuation.
3.2 Cepstrum of CW pulse signalFor the cepstrum of transmitted signal x(n), the line spectrum signal of ω0 is taken as the example, and the transmitted signal is set as
| $x\left( n \right) = \exp \left( {{\rm{j}}{\omega _0}n} \right)u(n)$ | (14) |
Then, the DFT of x(n) is
| $X\left( z \right) = \frac{1}{{1 - \exp \left( {{\rm{j}}{\omega _0}} \right){z^{ - 1}}}},\quad \left| z \right| > 1$ | (15) |
| $\log \left[ {X\left( z \right)} \right] = \log \left[ {\frac{1}{{1 - \exp \left( {{\rm{j}}{\omega _0}} \right){z^{ - 1}}}}} \right],\quad \left| z \right| > 1$ | (16) |
To calculate the inverse z-transform of Eq. (16), the differential of Eq. (16) is calculated first. The following is set:
| $D\left( z \right) = - z\frac{{{\rm{d}}\log \left[ {X\left( z \right)} \right]}}{{{\rm{d}}z}}$ | (17) |
Then,
| $\begin{array}{l} D\left( z \right) = - z\left( {1 - \exp \left( {{\rm{j}}{\omega _0}} \right){z^{ - 1}}} \right)\left[ { - \frac{{\exp \left( {{\rm{j}}{\omega _0}} \right){z^{ - 2}}}}{{{{\left( {1 - \exp \left( {{\rm{j}}{\omega _0}} \right){z^{ - 1}}} \right)}^2}}}} \right] = \\ \frac{{\exp \left( {{\rm{j}}{\omega _0}} \right){z^{ - 1}}}}{{1 - \exp \left( {{\rm{j}}{\omega _0}} \right){z^{ - 1}}}} \end{array}$ | (18) |
| $\begin{array}{l} d\left( n \right) = {Z^{ - 1}}\left[ {D\left( z \right)} \right] = \\ \left[ {\exp \left( {{\rm{j}}{\omega _0}} \right)\exp \left( {{\rm{j}}{\omega _0}n} \right)u\left( n \right)} \right] \otimes \delta \left( {n - 1} \right) \end{array}$ | (19) |
According to the basic properties of z-transform,
| ${{C}_{x}}\left( n \right)=d\left( n \right)d\left( n \right)/n$ | (20) |
Thus,
| ${C_x}\left( n \right) = \frac{{\exp \left( {{\rm{j}}{\omega _0}n} \right)u\left( {n - 1} \right)}}{n}$ | (21) |
The derivation result of Eq. (21) indicates that the cepstrum expression of the line spectrum signal is the transmitted signal with attenuation amplitude of 1/n. Next, a systematic simulation is given to show the properties of cepstrum.
Simulation conditions:
Set the transmitted signal x(n)=sin (2πf0n) where f0=1000 Hz, n=1:1000, and sampling frequency fs=50 kHz. For a qualitative description of the acoustic scattering model, the amplitude of the signal of the received echoes will be given a certain degree of attenuation in the simulation, does not consider actual parameters, and ignores noise temporarily.
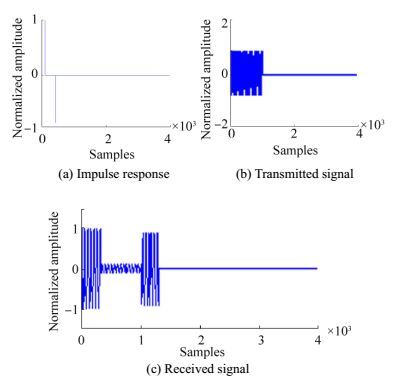
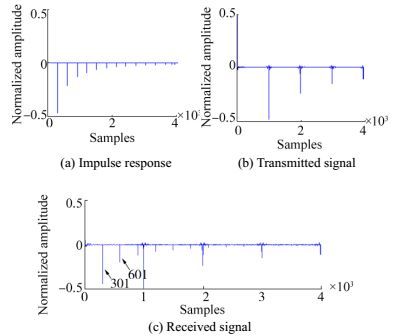
1) First case: Only one inverting echo exists at the receiver aside from the direct wave. The relative delay N1=301. Fig. 4 shows the simulation waves of the impulse response of the multi-path channel, transmitted signal, and received signal. Fig. 5 shows the simulation results of the cepstrum of the impulse response of the multi-path channel, transmitted signal, and received signal.
|
| Figure 4 Simulation signal wave-one echo |
|
| Figure 5 Cepstrum simulation result-one echo |
Combining Eq. (13) and Fig. 3(a), obvious peaks are found at the point of N1=301 and the integer multiples of N1. The cepstrum of transmitted signal decays rapidly at a low time period with an apparent peak at the point of 1000, which represents the length of the transmitted signal. The cepstrum of the received signal is the sum of the cepstrum of the impulse response and the transmitted signal. According to the simulation results, the delay value can be estimated accurately.
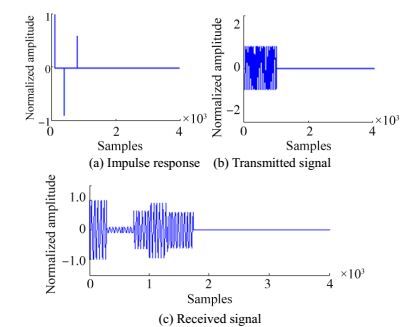
2) Second case: Two echoes of in-phase and anti-phase at the receiver exist aside from the direct wave. The relative delay N1=301, N2=741. Fig. 6 and Fig. 7 show the time domain waveforms and cepstrum results of second case.
|
| Figure 6 Simulation signal wave-two echoes |

|
| Figure 7 Cepstrum simulation result-two echoes |
Fig. 7 shows that obvious peaks exist at the point of N1=301, N2=741, which represent the delay values between two echoes and direct wave, respectively. Moreover, some small-amplitude peaks exist, and they are caused by linear combination of N1 and N2 in different ways. However, an obvious peak also exists at point 1041, which is the sum of N1 and N2, thereby causing a strong interference to delay estimation.
3) Third case: Three echo signals exist at the receiver aside from the direct wave. The relative delay N1=301, N2=741, N3=1901. Fig. 8 and Fig. 9 show the time domain waveforms and cepstrum results of third case.

|
| Figure 8 Simulation signal wave-three echoes |

|
| Figure 9 Cepstrum simulation result-three echoes |
With the increase of the number of received echoes, an increasing number of interfering peaks exist in the cepstrum simulation result. Some interfering peaks whose amplitude is stronger than the one of the delay peak that we need to estimate, such as points 1041 and 1601 in Fig. 9, strongly influence N3=1901 and affect the estimation result. According to the simulation result, as the number of signal increases, the effect of cepstrum decreases. Therefore, to obtain a good estimation effect, the number of analyzed signals needs to be restricted to a certain extent.
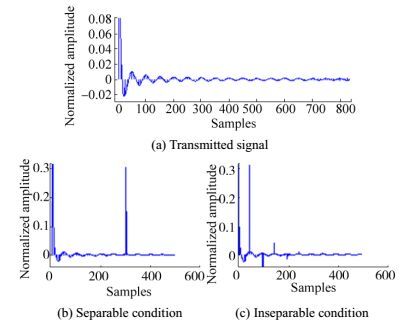
3.3 Delay resolution of cepstrumThe delay resolution of cepstrum can be discussed in two aspects. First, according to Eq. (13), the delay value will appear in the form of δ function, which indicates the best delay resolution. The other factor is the attenuation property of the cepstrum of the transmitted signal. Eq. (21) shows the cepstrum expression of the transmitted signal. As the value of n increases, the amplitude of Cx(n) decays rapidly. If the first delay value we need, i.e. N1, is inside the range where Cx(n) does not attenuate completely, then the delay peak will be influenced to a certain extent. In homomorphic filtering, Cs(n)=Cx(n)+Ch(n), the deconvolution to h(n) and x(n) can be achieved unless Cx(n) and Ch(n) occupy different ranges in the cepstrum domain. Thus, the attenuation property of a signal in the cepstrum domain is a key factor in the ability to estimate minimum delay value. Fig. 10 shows the separable and inseparable schematics of Cx(n) and Ch(n) in the cepstrum domain. The simulation is under an ideal condition without noise. Thus, the delay estimation ability of inseparable situation is not seriously affected. However, in an actual situation, noise exists all the time, which will obviously interfere with the process results. In this case, the effect of inseparable schematic cannot be ignored.
|
| Figure 10 Separable and inseparable schematic in the cepstrum domain |
In this section, the anti-interference capability of cepstrum is considered from two aspects. First, noise resistance capability and the delay estimation effect are analyzed varying with SNR. Second, the influence of signal waveform and envelope modulation is discussed.
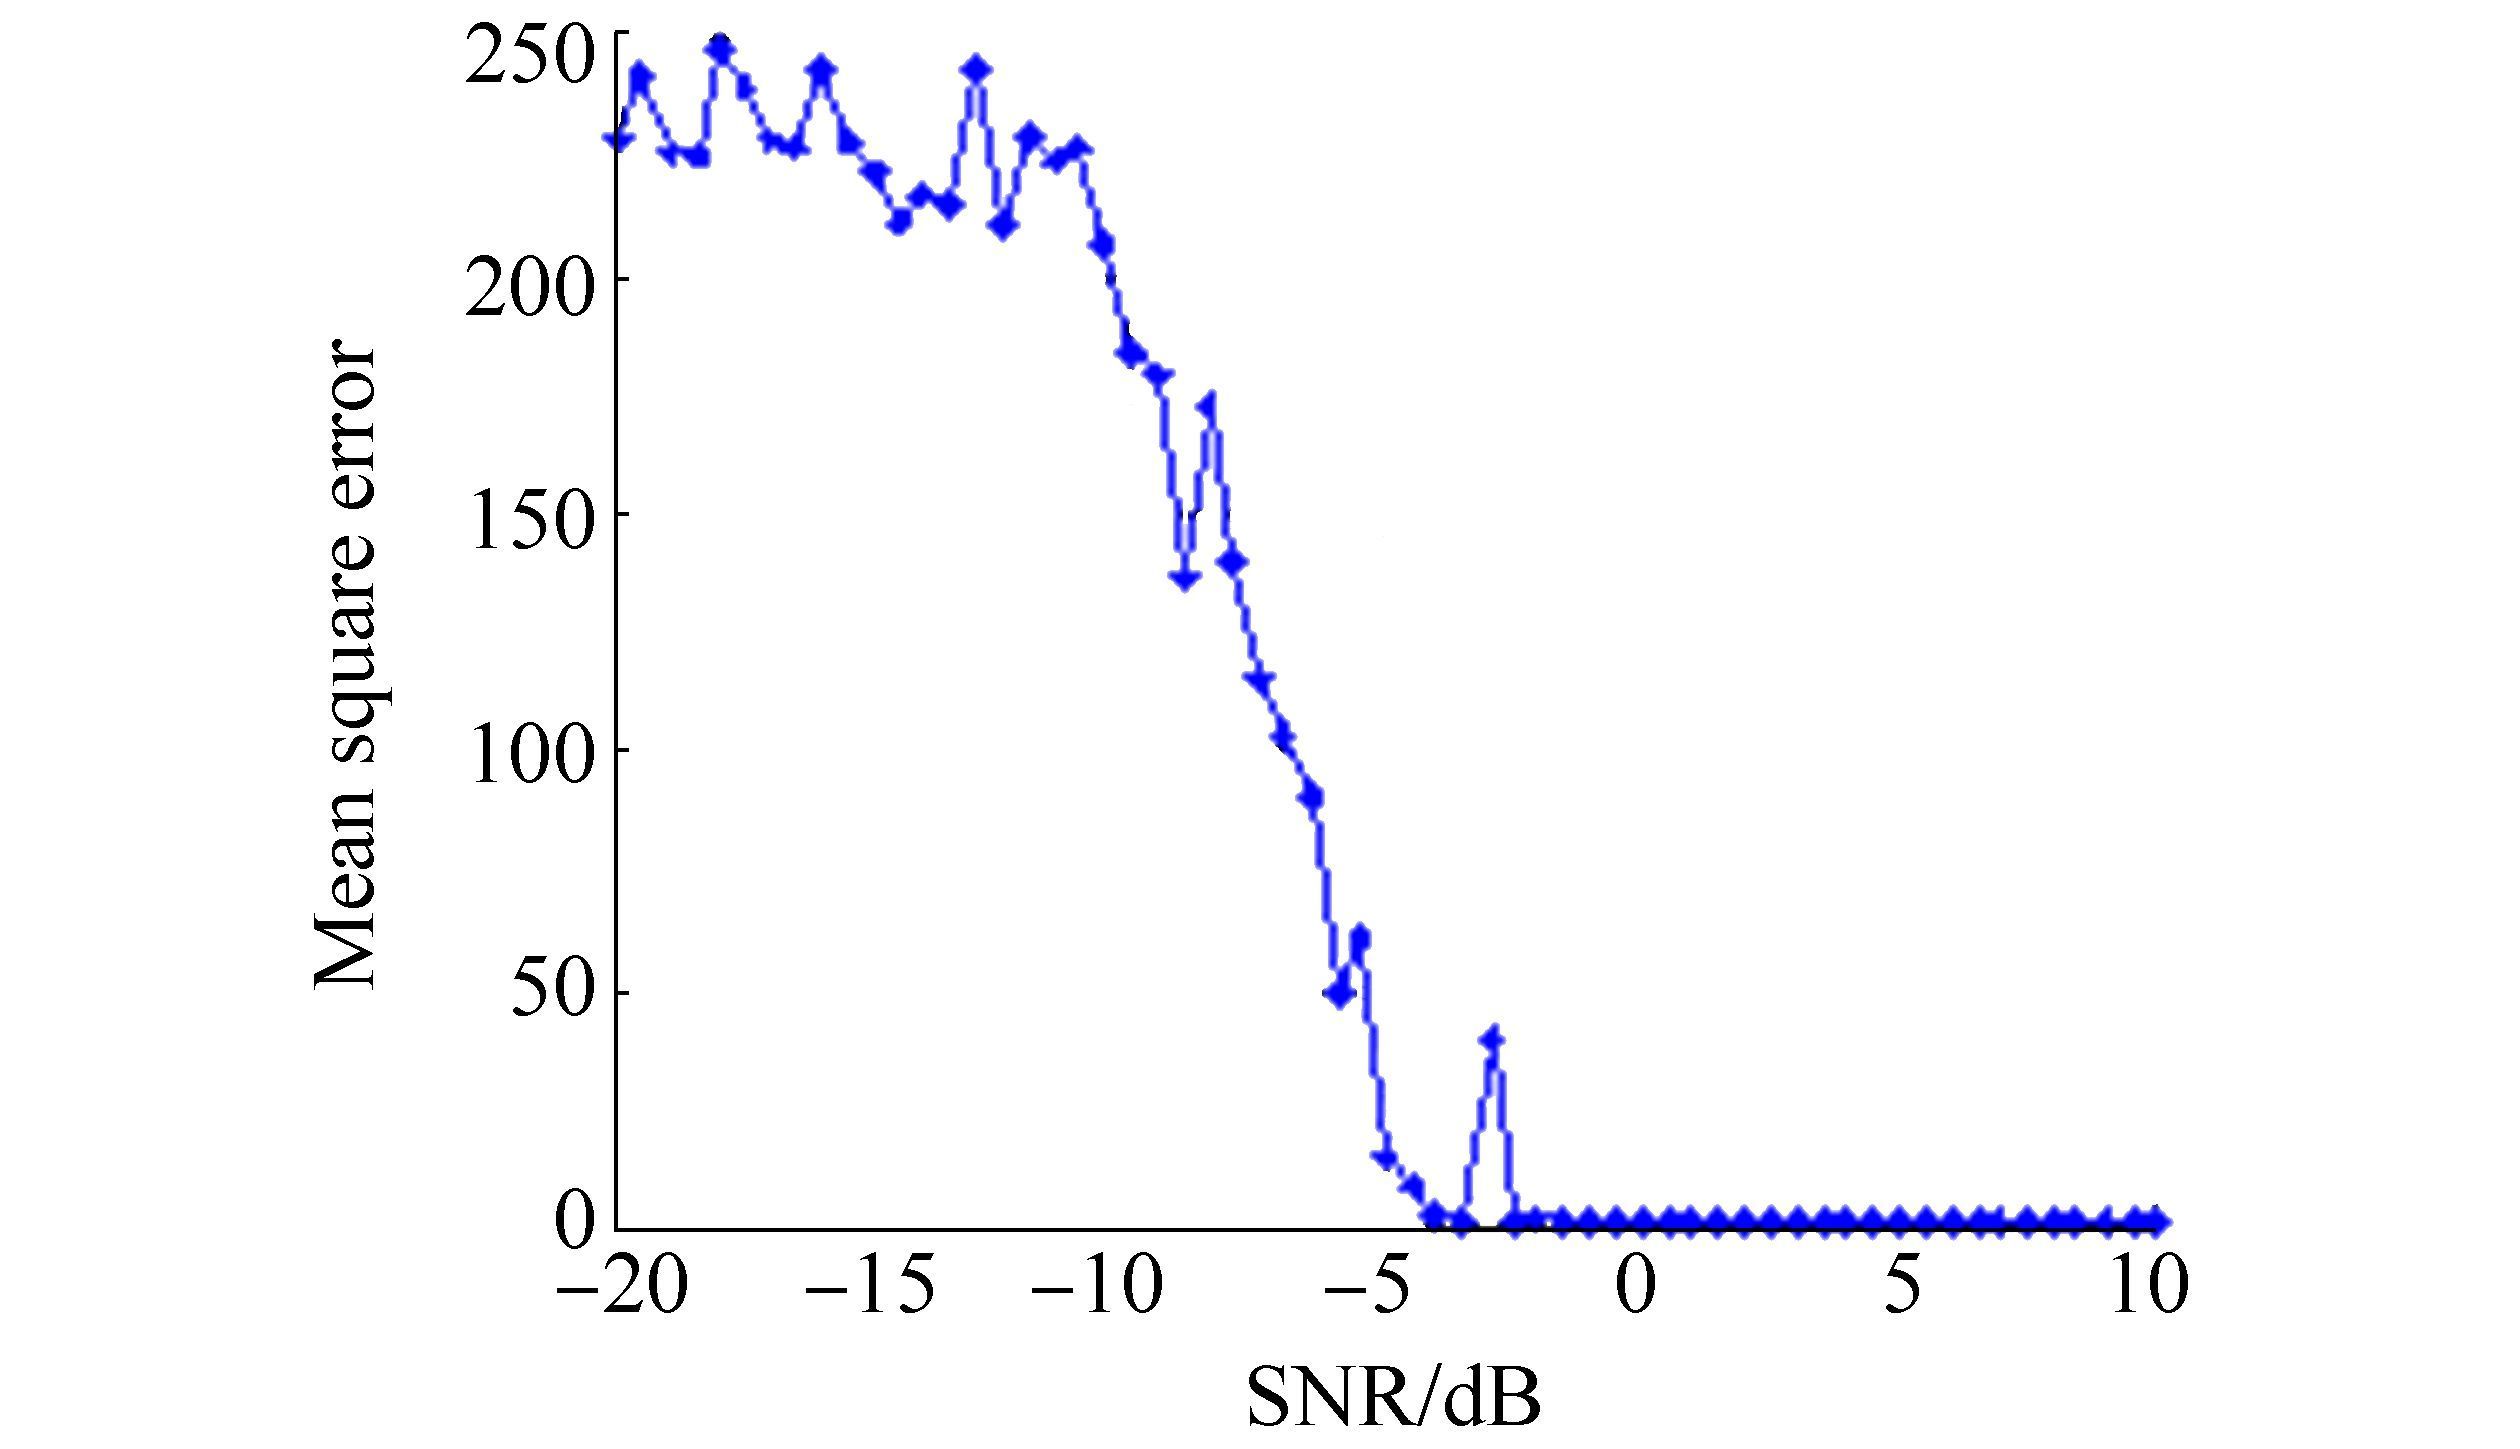
3.4.1 Noise resistance capacityIn practical engineering application, noise as a common interference cannot be ignored. On the basis of the simulation case in Section 3.2, the noise resistance capacity of cepstrum is analyzed by simulating the cepstrum of signals in the first case varying with SNR. The mean square error of delay peak estimation is calculated and shown in Fig. 11. Monte Carlo simulation is conducted 100 times to obtain a stable and average estimation result.
|
| Figure 11 Mean square error of cepstrum varying with SNR |
Simulation results show that a lower SNR corresponds to a larger mean square error, but the cepstrum performance is stable in a certain range of SNR like-2 dB or greater, as shown in Fig. 11. Once SNR is out of this range, estimation performance drops sharply, thereby revealing the low noise resistance and application limitation of cepstrum. Thus, further processing operations are necessary.
3.4.2 Signal waveformAside from noise, the similarity of signal waveforms also has an effect on delay estimation capacity of cepstrum. Several studies show that the steepness of the signal edge will influence the estimation effect; a steeper edge corresponds to a better estimation effect (Liang et al., 2014). Thus, a rectangular envelope signal is the best. The change in signal edge can be seen as envelope modulation of the rectangular envelope signal. Usually, the envelope of the received signal will be modulated by the transducer frequency response. In a practical situation, obtaining received signals with a steep edge is not easy. This paper found that the similarity of the signal waveform plays an important role even though the edge is not steep. If signals can maintain a similar waveform, then the delay estimation result is hardly affected, and the simulation result reveals that the cepstrum of the modulated signal is only different with an unmodulated signal at a low time period. According to Eq. (14), the modulated signal can be expressed as
| ${x_m}\left( n \right) = a\left( n \right) \cdot x\left( n \right)$ | (22) |
Then, the received signal is
| ${s_m}\left( n \right) = {x_m}\left( n \right) \otimes h\left( n \right) = \left[ {a\left( n \right) \cdot {x_m}\left( n \right)} \right] \otimes h\left( n \right)$ | (23) |
where
| $h\left( n \right) = \sum\limits_{i = 1}^N {{a_i}} \delta \left( {n - {n_i}} \right)$ | (24) |
The cepstrum of sm(n) is
| ${C_{{s_m}}}\left( n \right) = {C_{{x_m}}}\left( n \right) + {C_h}\left( n \right)$ | (25) |
where
| ${C_{{x_m}}}\left( n \right) = {F^{ - 1}}\left\{ {\log F\left\{ {{x_m}\left( n \right)} \right\}} \right\} = {F^{ - 1}}\left\{ {\log F\left\{ {a\left( n \right) \cdot x\left( n \right)} \right\}} \right\}$ | (26) |
The cepstrum of the modulation signal with rectangular, cosine, Gauss, and exponent envelope are simulated in Fig. 12. Simulation results show that the low-frequency modulation signal a(n) does not generate false peaks in the cepstrum domain, which means delay estimation capacity is hardly affected, and it only works obviously at a low time period. Thus, the abovementioned results show that the delay can still be acquired when signals maintain a similar waveform even if no steep edge exists.

|
| Figure 12 Waveform and cepstrum of modulation signal |
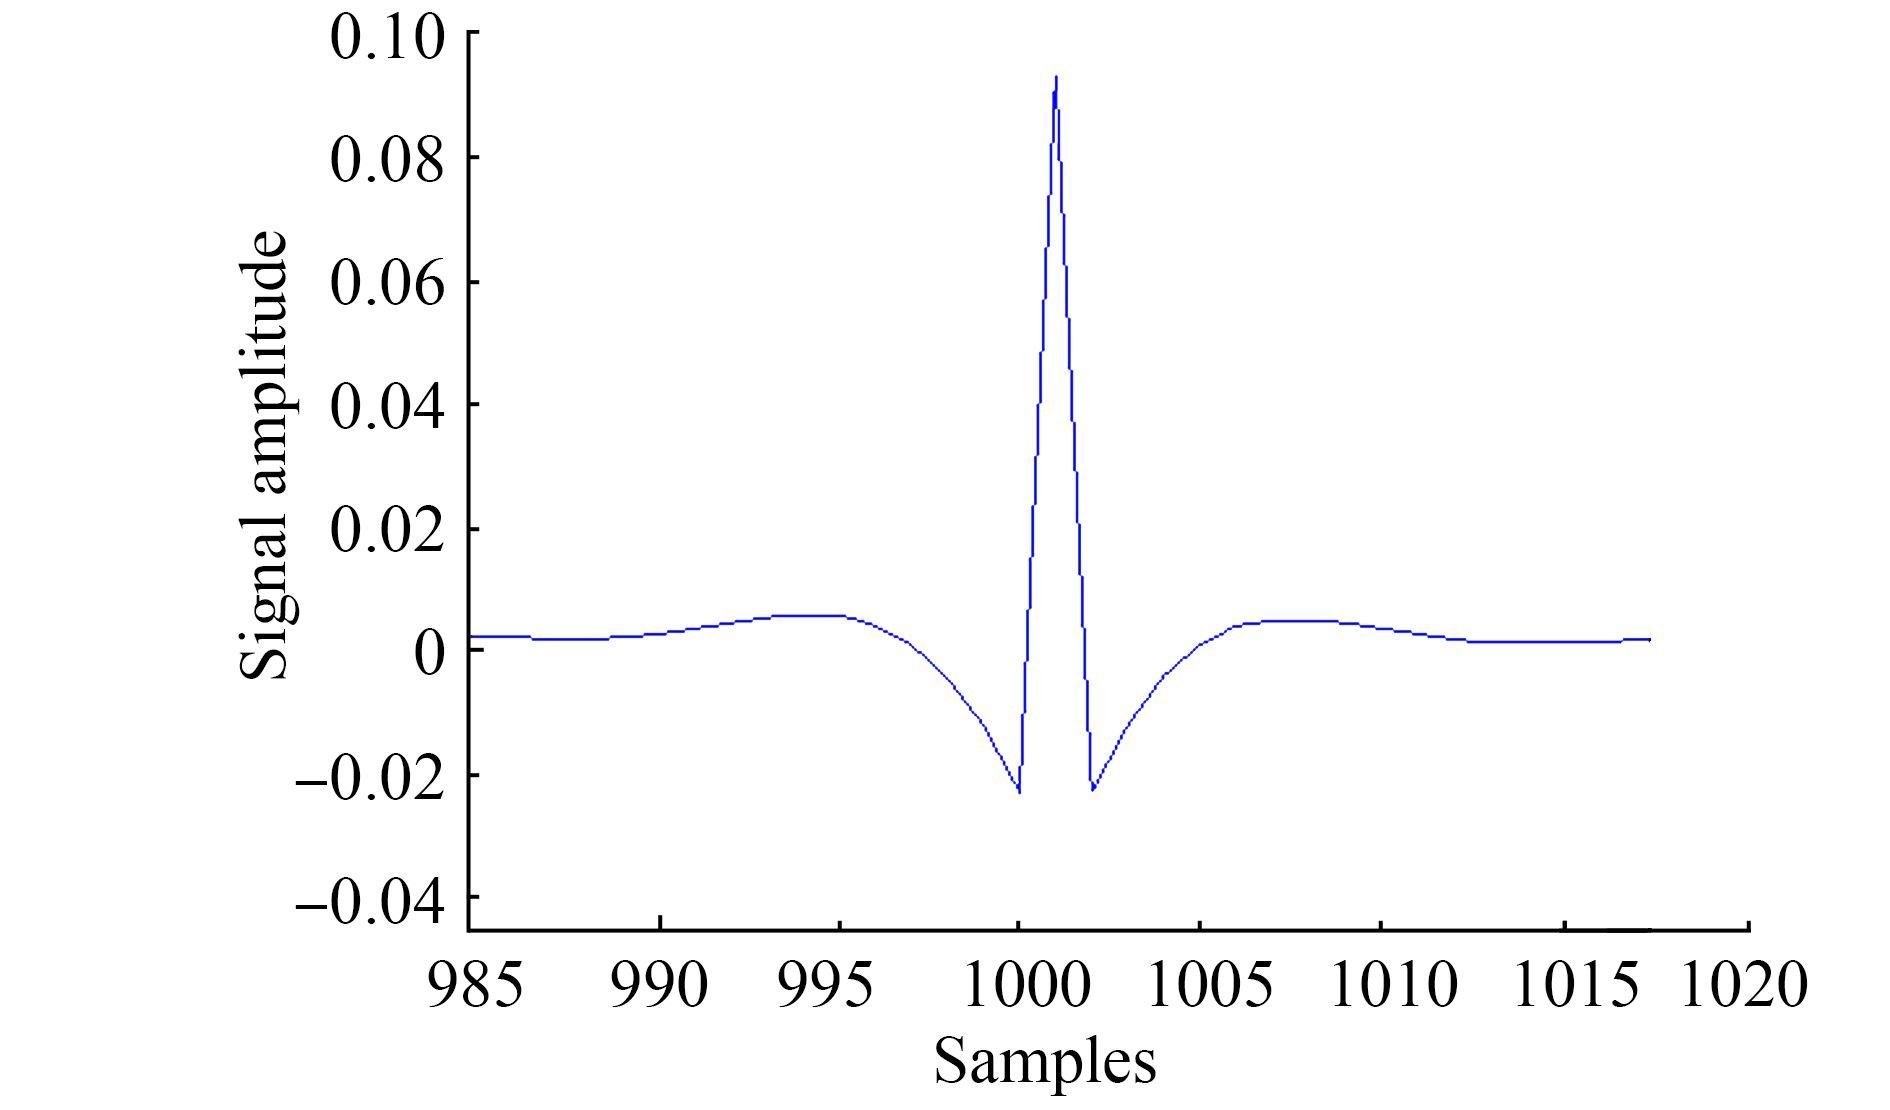
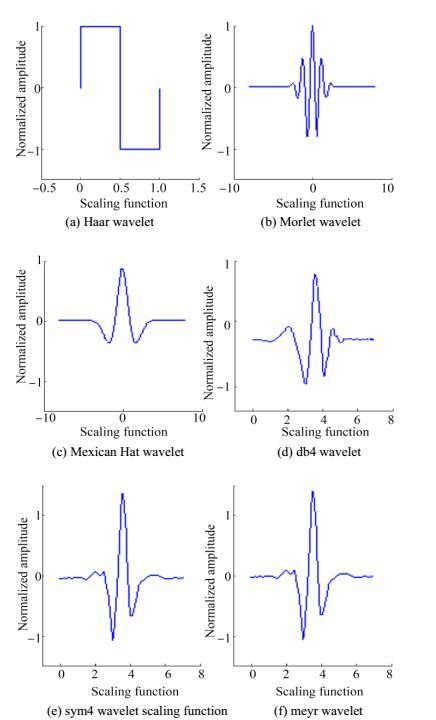
The abovementioned findings indicate that the amplitude of the delay peak is weak and easily submerged by interference. Thus, an enhancement operation in the cepstrum domain is needed. Fig. 13 shows the partially enlarged portion of the delay peak of a single rectangular signal. The waveform of the delay peak is similar to a wavelet function. Therefore, according to the waveform matching principle of Wavelet Transform, the delay peak can be enhanced by a certain wavelet. The enhancement effect depends on the choice of the wavelet type. The commonly used wavelet function is shown in Fig. 14.
|
| Figure 13 Enlarged portion of the delay peak |
|
| Figure 14 Commonly used wavelet function |
In Section 3.4.1, the noise resistance capacity of cepstrum is analyzed. When SNR decreases to a certain range, the delay estimation error will increase rapidly, thereby limiting the usability of cepstrum. Thus, the signal of the first case in Section 3.2 is enhanced in the cepstrum domain with the Mexican hat wavelet; the result is shown in Fig. 15. Simulation result shows that this method has an enhancement effect. Compared with the unenhanced version shown in Fig. 11, noise resistance can be improved by nearly 6 dB.

|
| Figure 15 Mean square error of wavelet enhancement and unenhancement cepstrum varied with SNR |
To research the scattering properties of an underwater target, the acoustic scattering echoes of an target model are acquired by an active sonar system in an anechoic tank.
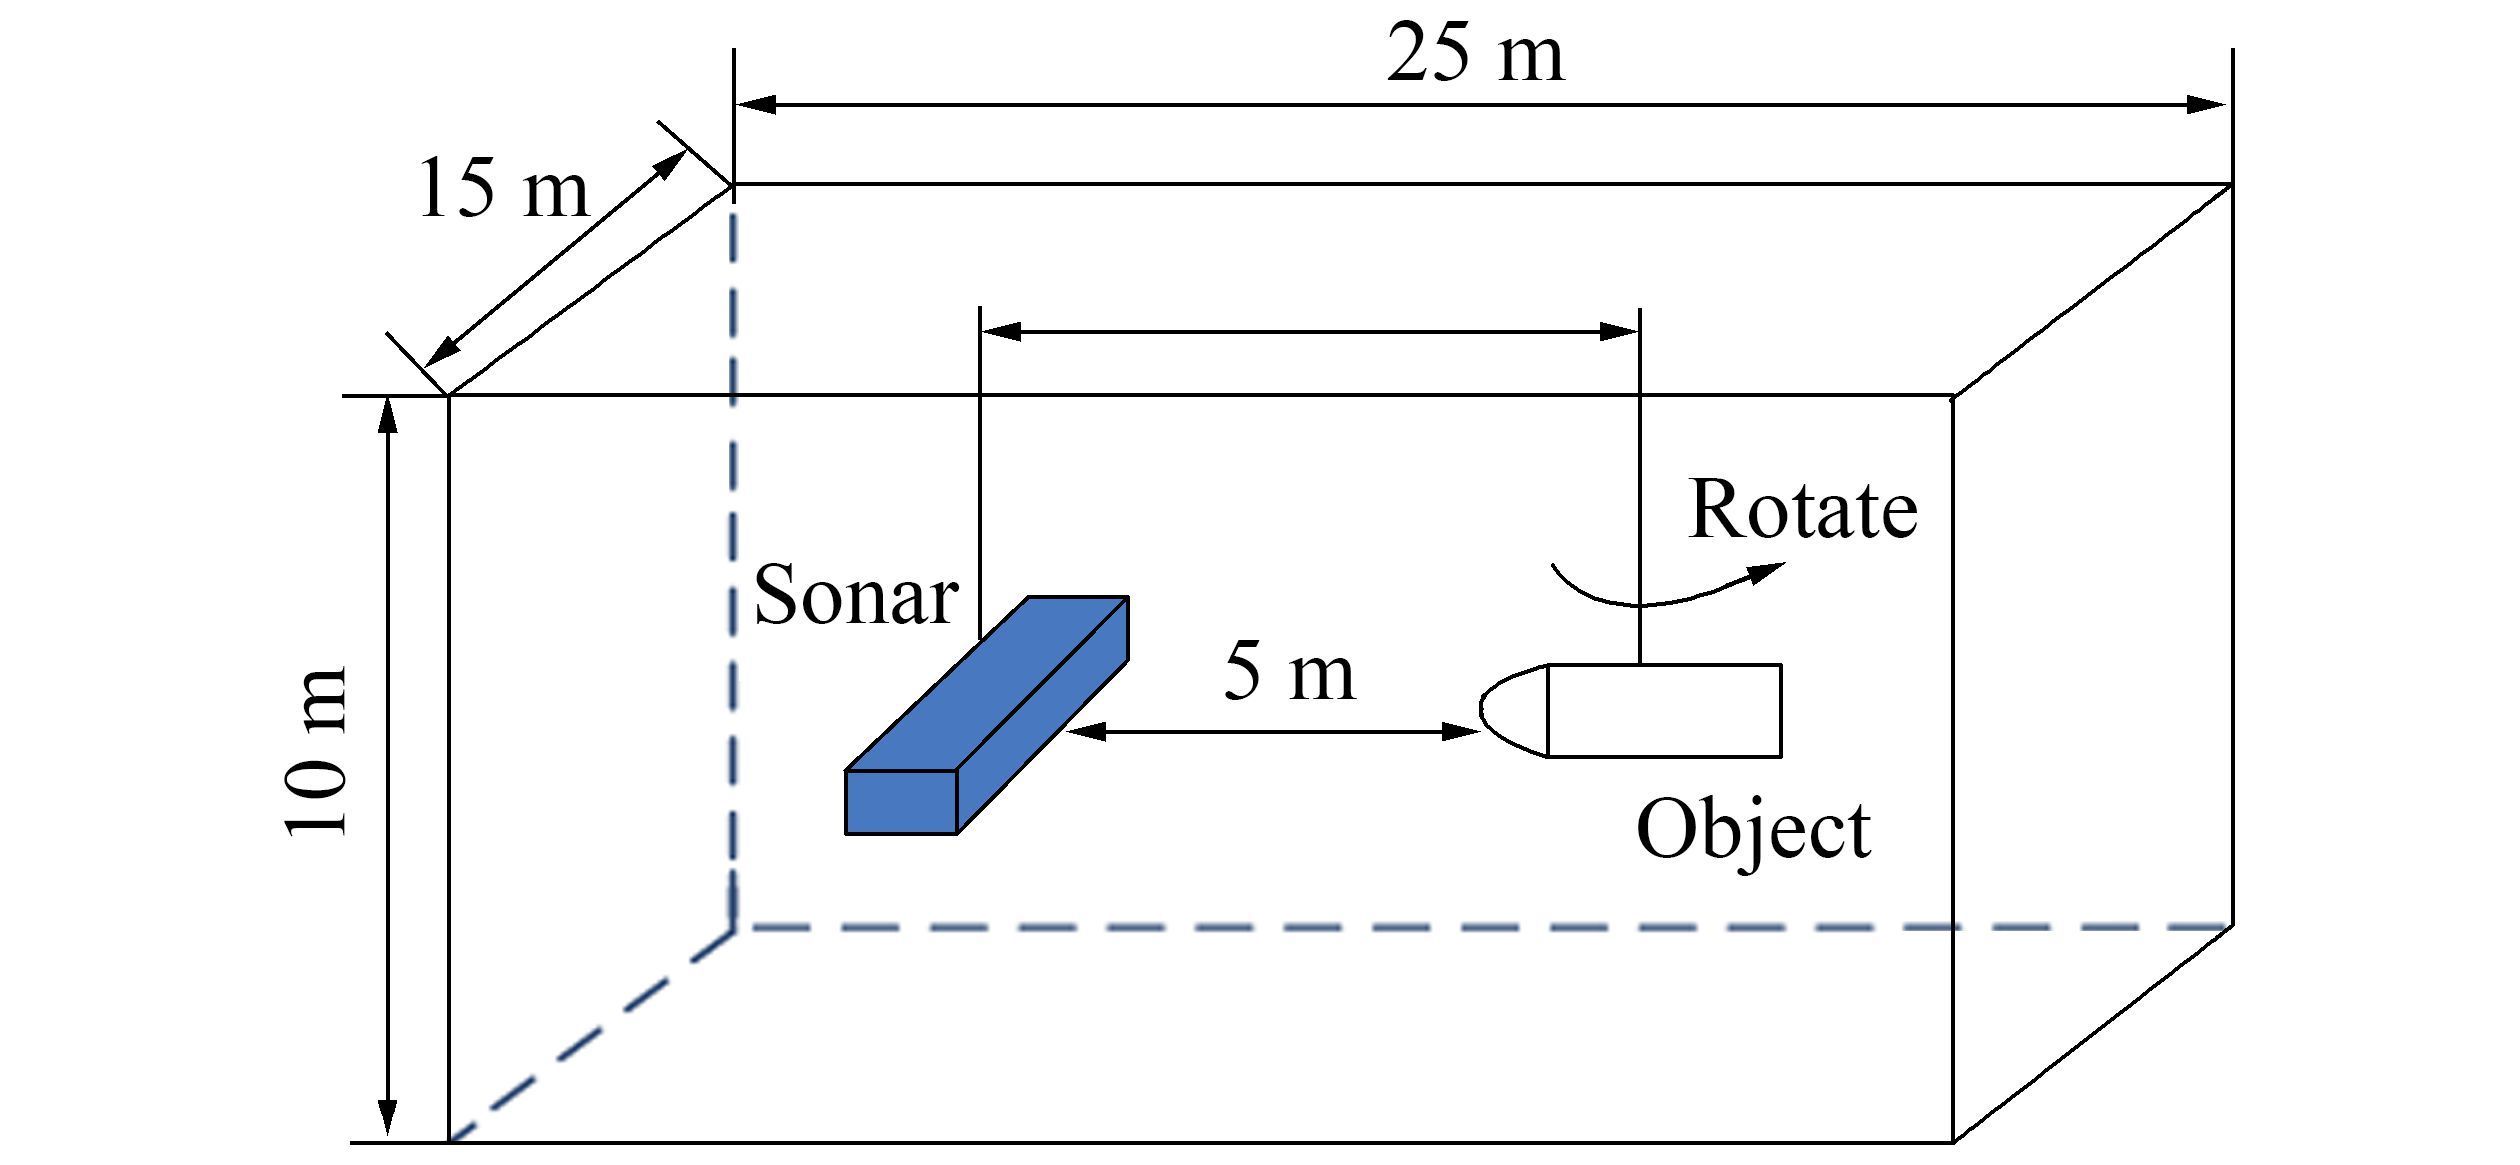
4.1 Experimental situationThe length of the anechoic tank is 25 m, the width is 15 m, and the depth is 10 m. The center of the transmitting array is 4.5 m away from water surface, the top of the target is 4.3 m away from the water surface, and the distance between the sonar and the target is 5 m. The specific layout is shown in Fig. 16. The sonar is a transceiver array with a transmitting transducer emitting a single-frequency signal and receiving transducer receiving signals, which are collected to several data collectors. The model is a cylindrical body with a spherical cap and fixed to rotate on a rotation device. The rotation angle range is from 0° to 360°. In the processing results of experimental data, the frequency is normalized by sampling frequency, and delay is represented in the form of data points.
|
| Figure 16 Experimental device placement |
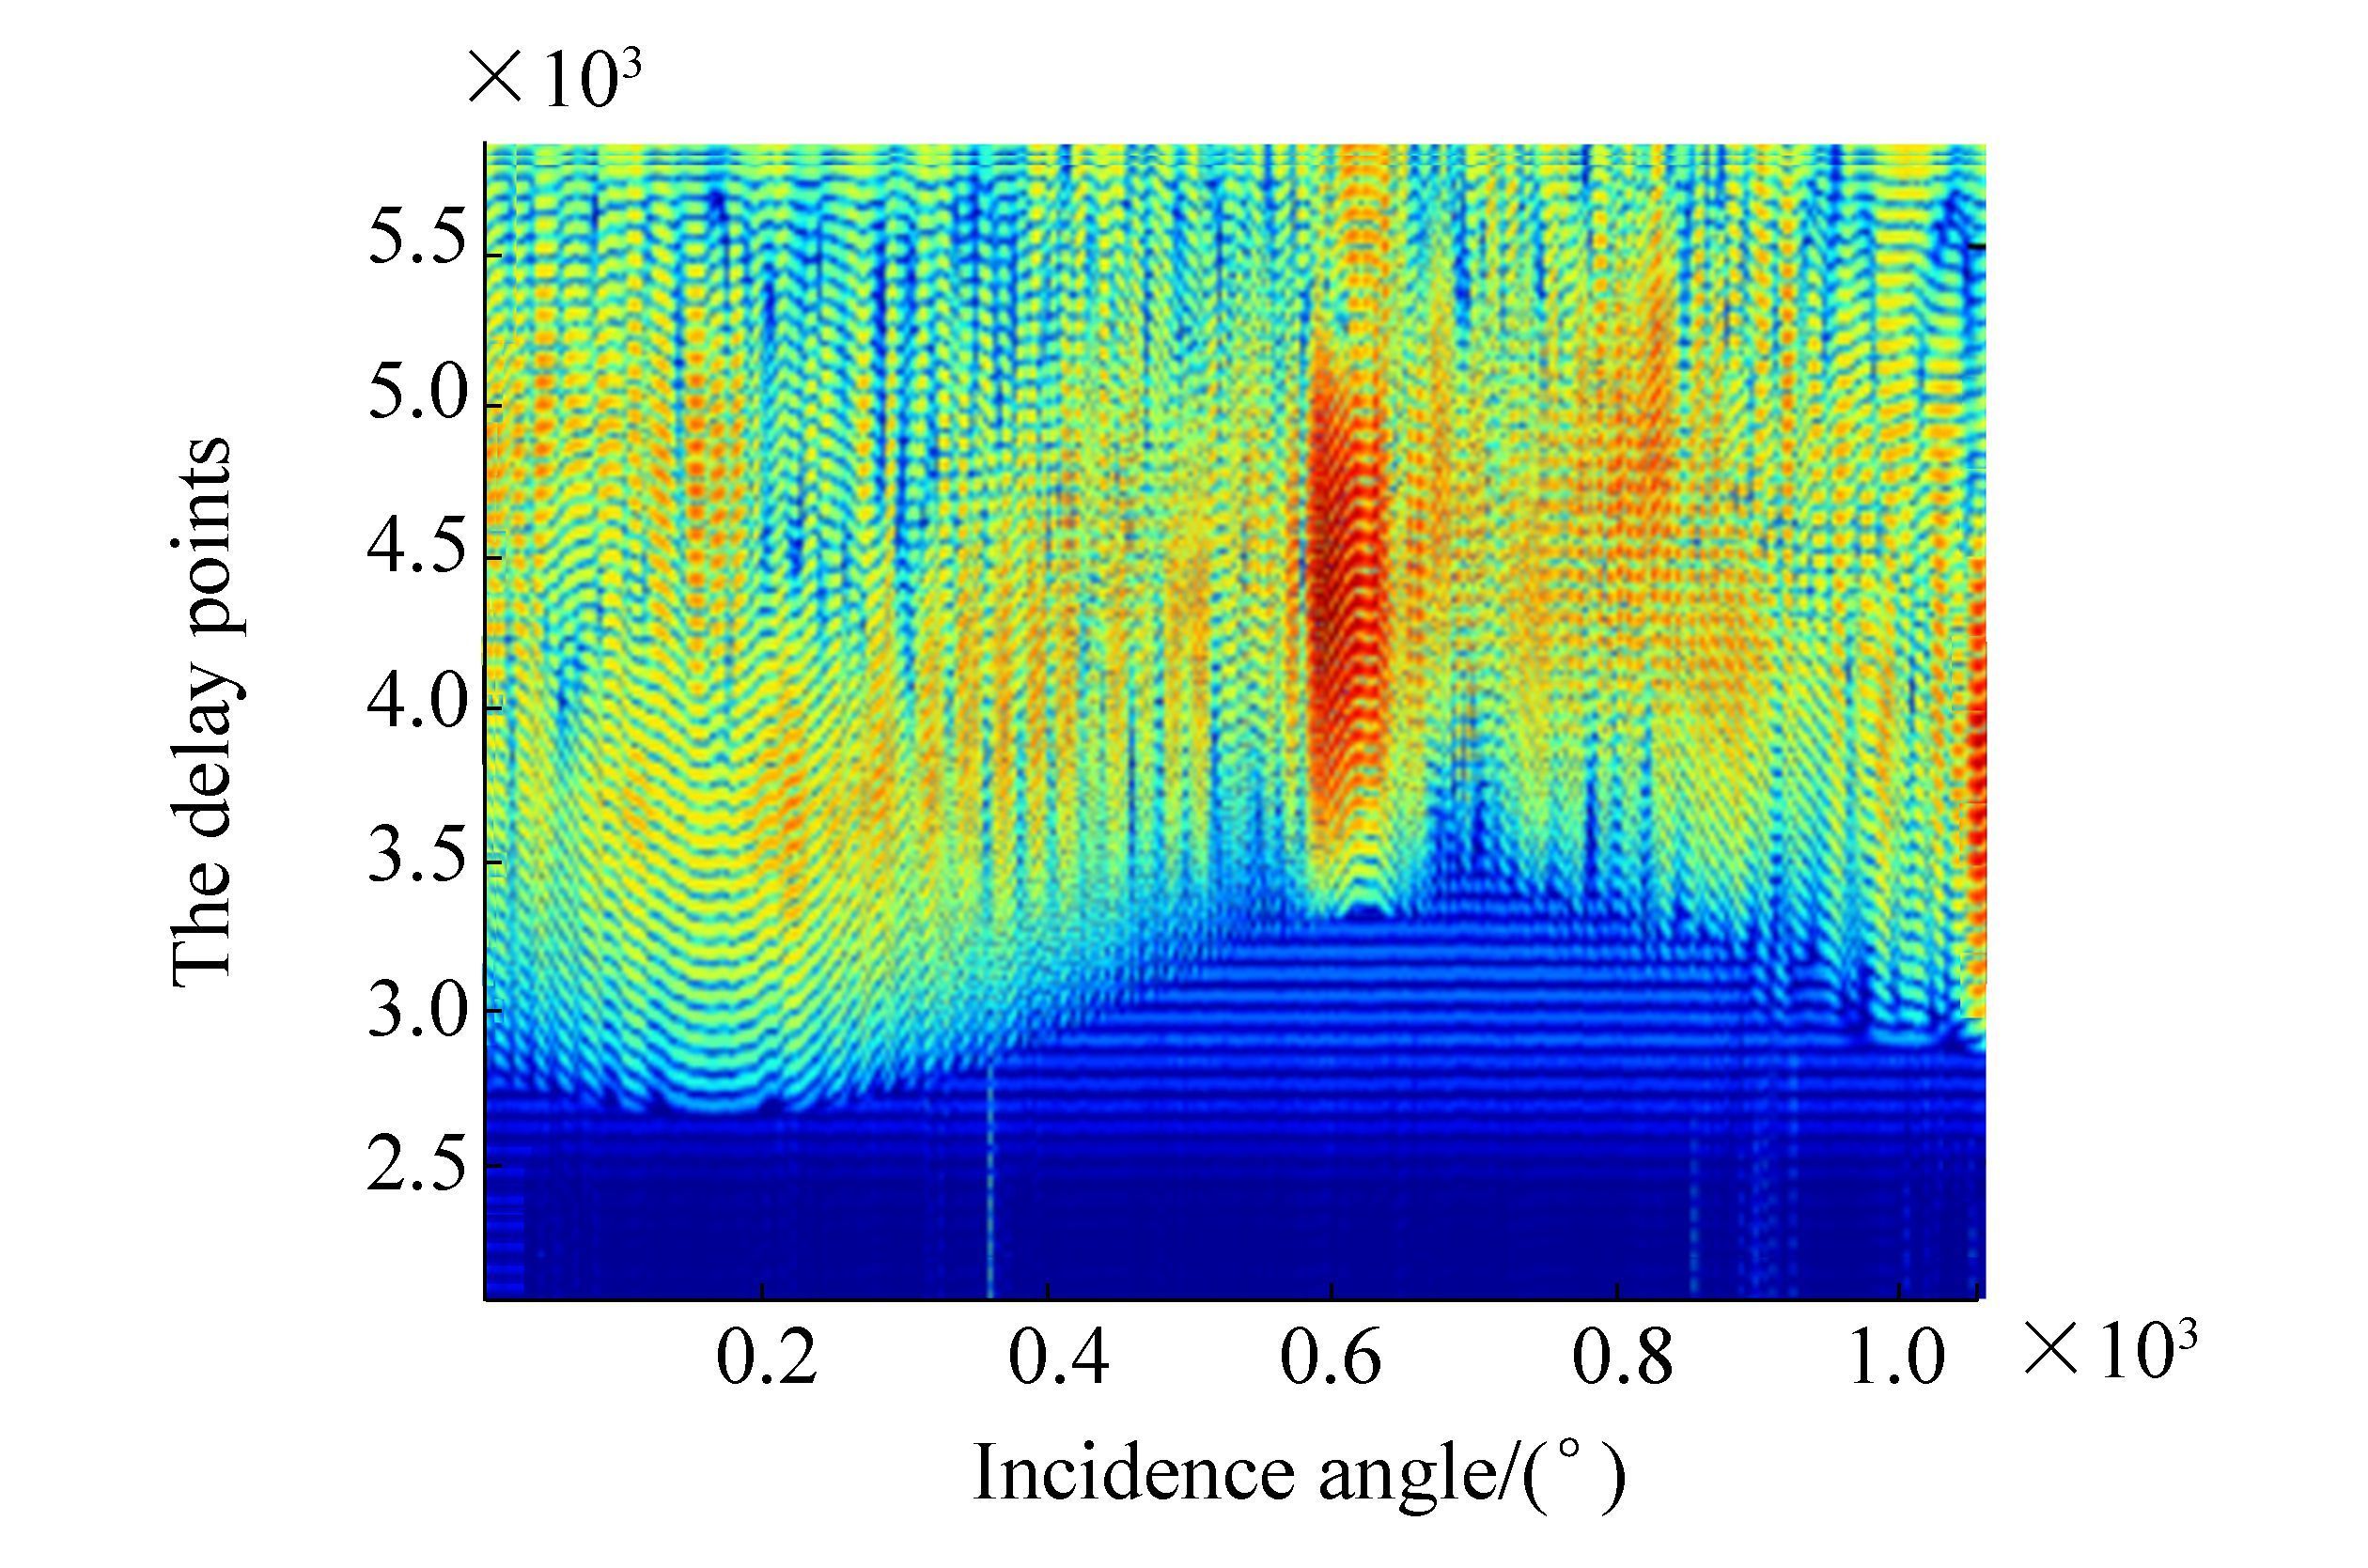
First, matched filter is used to process acoustic scattering signals for comparison. For time delay estimation in time domain, correlation processing such as matched filter is a conventional and common signal processing method with a relatively simple principle and easy engineering application. However, matched filter is more suitable for wideband signal of a large time-bandwidth product, thereby producing a good pulse compression effect and high output SNR gain. For a narrow-band signal such as CW pulse signal, delay estimation capacity is limited and decreased significantly by a wide correlation peak. The time-domain waveform of a set of data is given in Fig. 17. Fig. 18 shows the matched filter results of experimental data with an incident angle that ranges from 0° to 180°. Evidently, time delay information is hardly acquired in Fig. 18, which is consistent with the above analysis. Thus, matched filter is invalid.

|
| Figure 17 Time-domain waveform of a set of data |
|
| Figure 18 Matched filter result of experimental data |
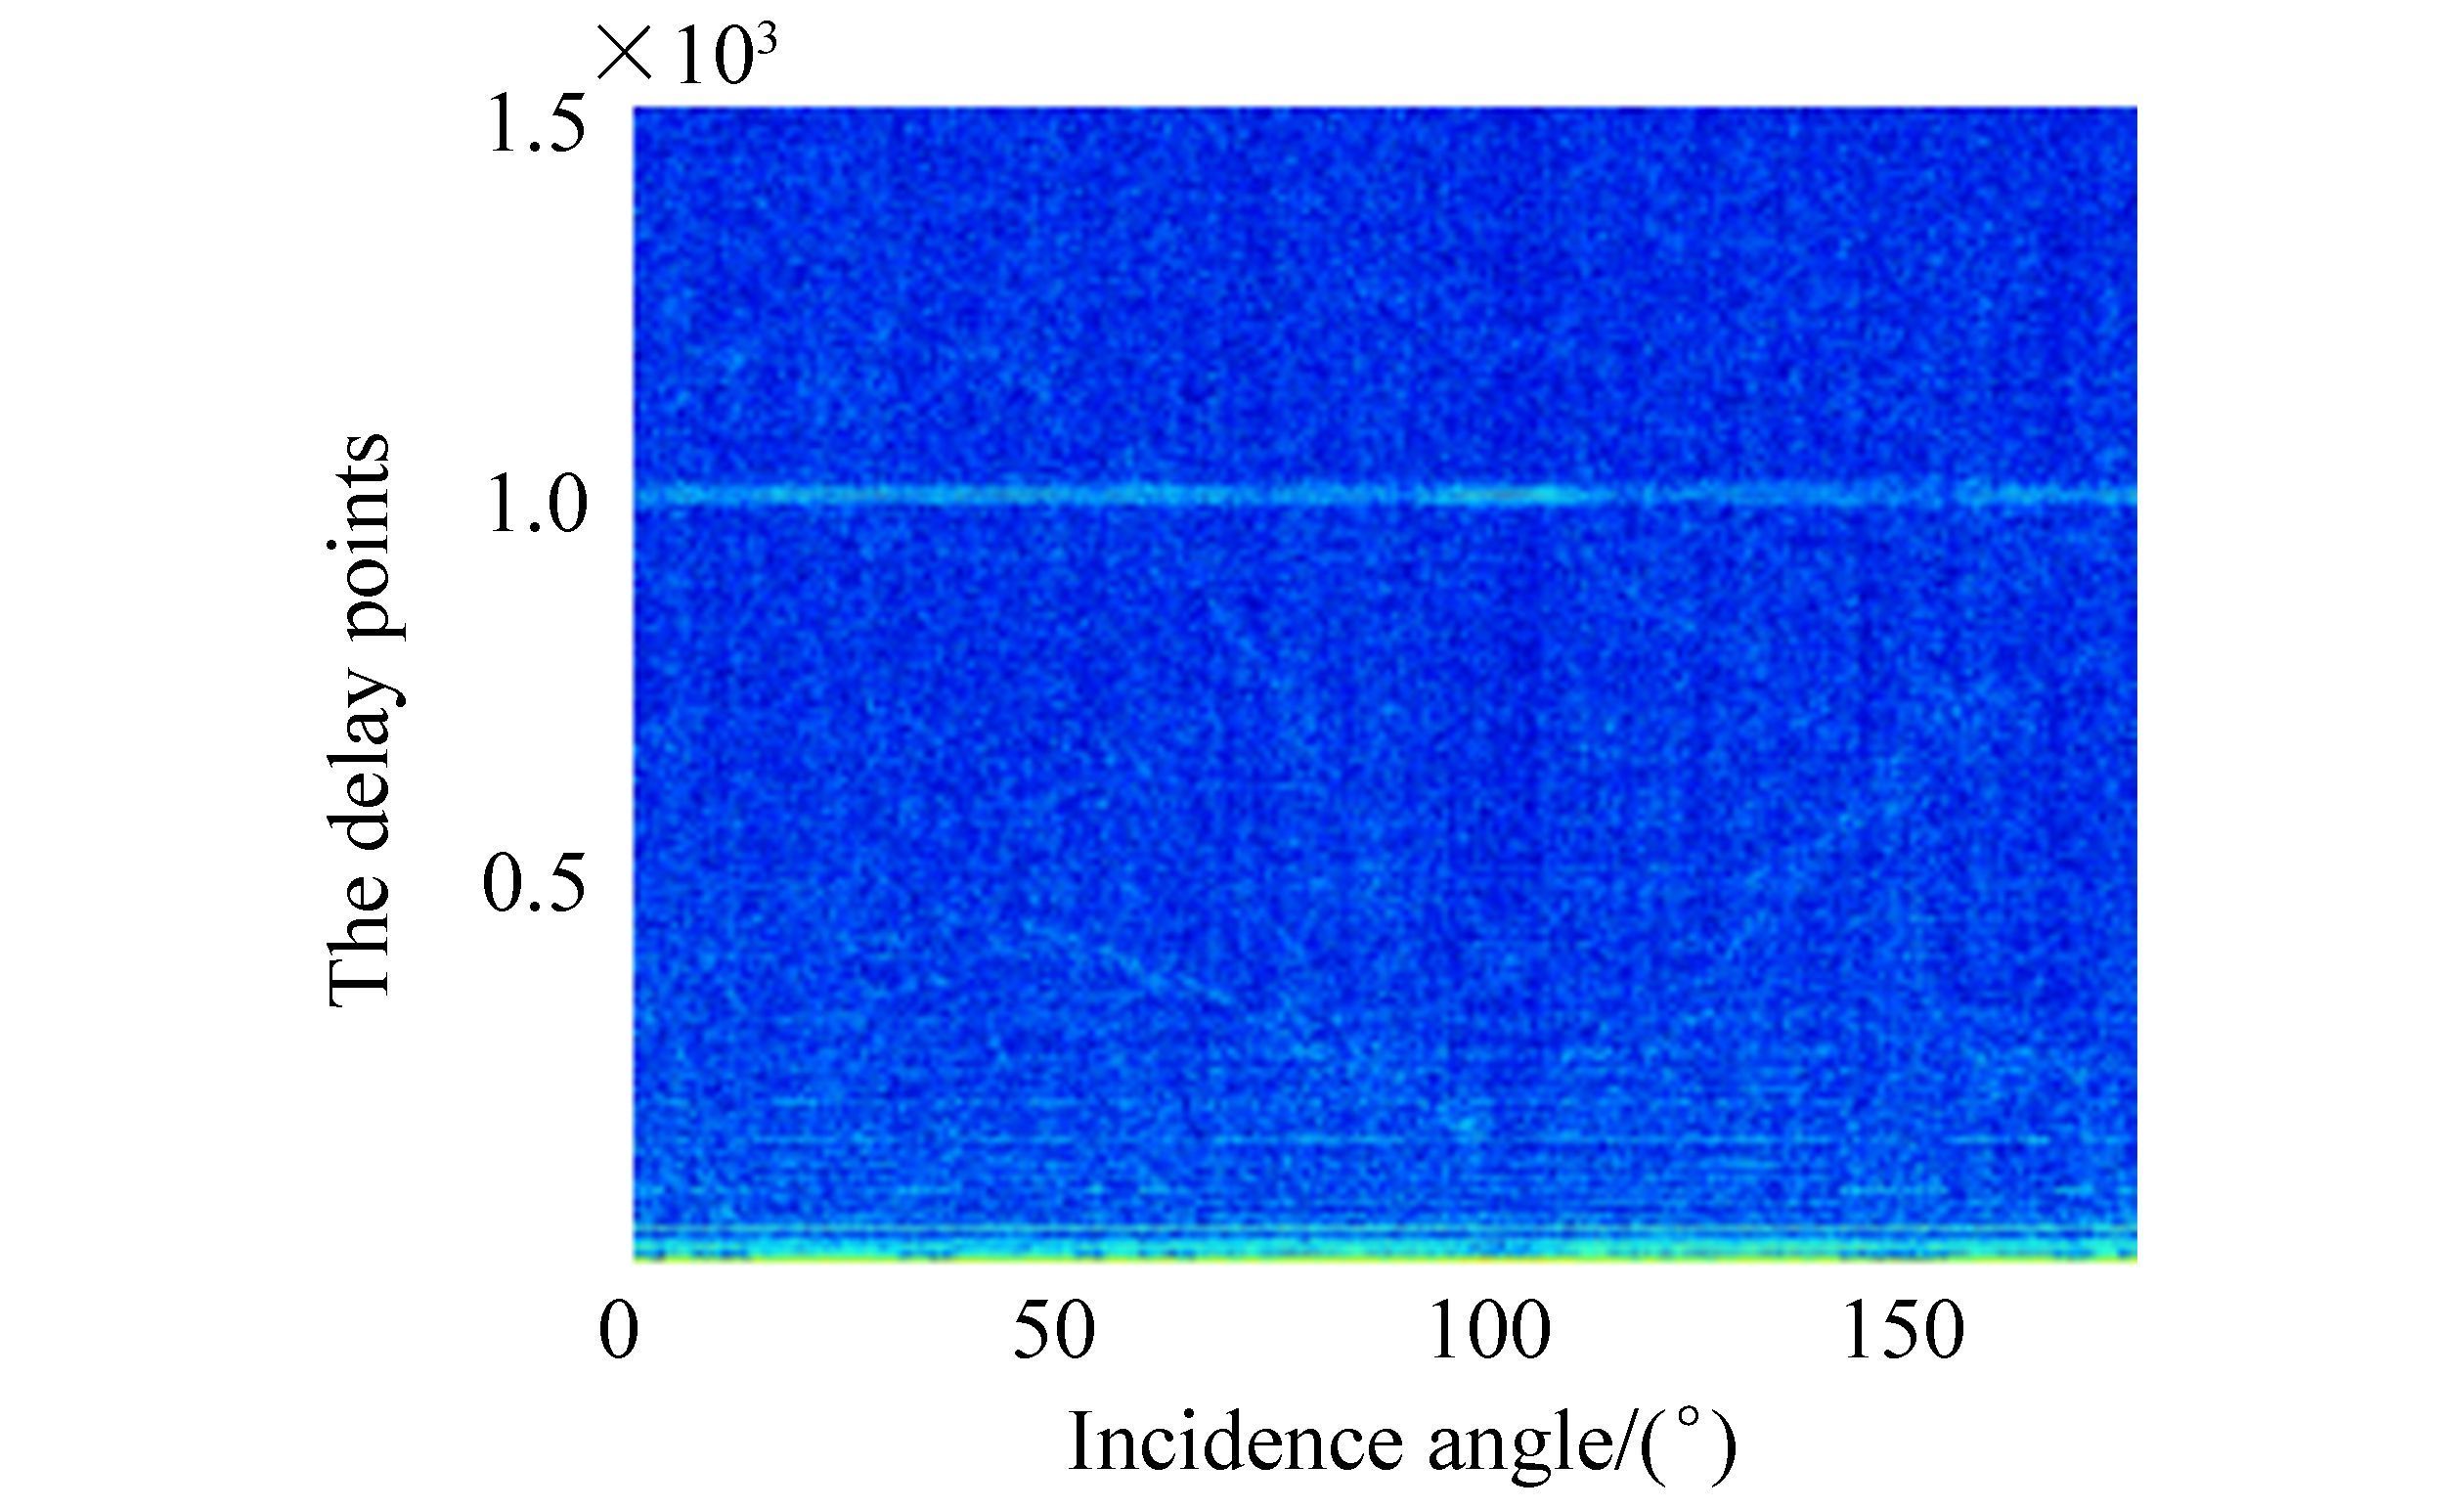
In this section, the preliminary delay information of experiment data is first extracted by cepstrum processing, then the wavelet enhancement operation is taken to improve the effect. Process results are given in Figs. 19 and 20. Compared with the matched filter processing and preliminary cepstrum processing results, the delay information of enhancement processing is extracted effectively. In Fig. 20, the line of point 1 000 is caused by the pulse width of the transmitting signal, and the curve expresses a relative delay relationship between scattering echoes varying with the incident angle. The full-angle processing result in Fig. 20 is somewhat different from the simulation result in Fig. 2 because the cepstrum does not have time targeting capacity. Thus, a relative delay between multiple signals is acquired without the time of the first signal. According to the cepstrum principle, an FFT operation exists in cepstrum processing, and FFT operation is known to not have a time resolution. Therefore, cepstrum does not have time targeting capacity.
|
| Figure 19 Cepstrum processing result of experiment data |

|
| Figure 20 Wavelet enhancement processing result |
Motivated by the unique advantages of cepstrum in time delay estimation, the cepstrum method is applied in the extraction of echo characteristics to improve the performance of underwater target detection and recognition. On the basis of a study on theory and simulation, the application conditions and anti-interference capability of cepstrum are analyzed in detail. Results show that the delay estimation capacity of cepstrum is not limited by the type of echoes, but the effect will decrease with the increase in echo numbers. The envelope modulation of signal has little effect on the extraction of delay information in cepstrum domain. The wavelet enhancement method is proposed to improve the estimation effect of cepstrum, which is easily influenced by interference. Experimental results prove that the full-angle delay model in the cepstrum domain is in accordance with target echo characteristics, thereby demonstrating the feasibility of the cepstrum method.
| Anderson SD, 2012. Space-time-frequency processing from the analysis of bistatic scattering for simple underwater targets. PhD thesis, Georgia Institute of Technology, Georgia, 106-136. |
| Banerjee PS, Chakraborty B, Banerjee J, 2015. Procedure for cepstral analysis in tracing unique voice segments. International Conference on Computing for Sustainable Global Development, 351-356. |
| Bogert BP, Healy MJ, Tukey JW, 1963. The quefrency alanysis of time series for echoes: Cepstrum, pseudo-autocovariance, cross-cepstrum and saphe cracking. Proceedings of the Symposium on Time Series Analysis, 209-243. |
| Fan J, 2001. Study on echo characteristics of underwater complex targets. PhD thesis, State Key Laboratory of Vibration, Shock & Noise, Shanghai Jiao Tong University, Shanghai, 16-26. |
| Fan J, Zhu BL, Tang WL, 2001. Modified geometrical highlight model of echoes from nonrigid surface sonar target. Acta Acustica, 26(6), 545–550. DOI:10.15949/j.cnki.0371-0025.2001.06.012 |
| Fjell PO, 1976. Use of the cepstrum method for arrival times extraction of overlapping signals due to multipath conditions in shallow water. J. Acoust. Soc. Am, 59, 209–211. DOI:10.1121/1.380849 |
| Fu J, Xu WY, Wang Y, Liang GL, 2015. Anti-multipath technique of underwater acoustic channel in complex cepstrum domain. Journal of Harbin Engineering University, 36(9), 1–6. DOI:10.11990/jheu.201406046 |
| Jantti J, Chaudhari S, Koivunen V, 2014. Cepstrum based detection and classification of OFDM waveforms. 2014 IEEE International Conference on Acoustic, Speech and Signal Processing (ICASSP) Department of Signal Processing and Acoustics, 8063-8067. DOI: 10.1109/ICASSP.2014.6855171 |
| Kobayashi H, Shimamura T, 1998. A modified cepstrum method for pitch extraction. The 1998 IEEE Asia-Pacific Conference on Circuits and Systems, 299-302. DOI: 10.1109/APCCAS.1998.743751 |
| Li XK, Meng XX, Xia Z, 2015. Characteristics of the geometrical scattering waves from underwater target in fractional Fourier transform domain. Acta Physica Sinica, 64(6), 064302. DOI:10.7498/aps.64.064302 |
| Liang GL, Zhang Y, Fu J, 2014. Time delay estimation based on adaptive filtering and cepstrum analysis method. Journal of Nanjing University of Science and Technology, 38(1), 147–153. |
| Parisi R, Camoes F, Scarpiniti M, Uncini A, 2012. Cepstrum prefiltering for binaural source localization in reverberant environments. Signal Processing Letters IEEE, 19(2), 99–102. DOI:10.1109/LSP.2011.2180376 |
| Sajid M, Ghosh D, 2014. Logarithm of short-time Fourier transform for extending the seismic bandwidth. Geophysical Prospecting, 62(5), 1100–1110. DOI:10.1111/1365-2478.12129 |
| Tang WL, 1994. Highlight model of echoes from sonar targets. Acta Acustica, 19(2), 92–100. DOI:10.15949/j.cnki.0217-9776.1994.02.004 |
| Tian J, Zhang CH, Liu W, Huang HN, Xue SH, 2005. Cepstrum analysis based classification of passive underwater acoustic signals. Chinese Academy of Sciences, Beijing, 27(10), 1708–1710. |
| Wang Y, Zou N, Fu J, Liang GL, 2014. Estimation of single hydrophone target motion parameter based on cepstrum analysis. Acta Physica Sinica, 36(3), 034302. DOI:10.7498/aps.63.034302 |
| Xia Z, Li XK, 2015. Separation of elasto acoustic scattering of underwater target. Acta Physica Sinica, 64(9), 094302. DOI:10.7498/aps.64.094302 |


