2. Department of Mechanical Engineering, University of Technology, Baghdad 10066, Iraq
1 Introduction
Wind power is an important source of renewable energy, and it is used widely to generate electricity primarily by employing wind turbines on land. Wind energy at sea is set to become increasingly important owing to higher offshore wind speed and higher humidity, which allow offshore turbines to convert a greater amount of energy than that possible with land turbines, (Schaffarczyk, 2014).
The design of OWTs involves relatively complex geometries that experience more severe loads and are subjected to multiple environmental conditions resulting from high waves, currents, and strong wind loads. Therefore, the most important factors concerning OWT design, safety, and reliability are accurate prediction of the influence of environmental conditions and loads on the turbine itself, especially on the foundation part, given the fundamental role of this part in terms of safety. Accordingly, any applied solution methods must be efficient in terms of generating results with acceptable accuracy while being computationally inexpensive.
In many cases, aerodynamic and hydrodynamic forces are determined in separate numerical investigations. The available analysis methods for calculating hydrodynamic loads on offshore foundation structures such as WAMIT, AQWA, DRIFT, Aegir, and WaveDyn, (Ruehl et al., 2014), have been developed for oil and gas platforms. In most cases, such platforms operate in extremely deep waters. The aforementioned methods do not consider rotor-induced aerodynamic forces on the structure because they consider only the part of the foundation structure located below the sea free surface level. Available numerical methods to calculate rotor-induced forces, such as AeroDyn and FAST, (Hansen et al., 1999), have been developed for onshore installations, and they do not take into account the complicated numerical conditions of offshore installations, such as unsteady wave forces. In load prediction under OWT design calculations, different wind and wave spectra should be taken into account to allow for calculation of wave and wind extreme events, as well as fatigue loads. Accurate load prediction will help develop safe, durable, and cost-effective structural foundations.
The aim of this research is further development of the in-house boundary element method—panMARE code—which is based on the potential method, for simulating the unsteady flow behavior of a full OWT considering combined aerodynamic and hydrodynamic loads in the time domain. All results obtained using the BEM code are compared with those obtained using the RANSE solver in the ANSYS CFX environment. This comparison will highlight the viscous effects of the OWT system, which are not considered in the BEM code, and point out limitations of the inviscid flow model in predicting complex OWT loading, which has been applied to simulate ship propellers and has returned reliable results, as in (Greve, 2015; Bauer et al., 2011).
First, we studied the case of an OWT with a monopile support structure composed of a generic 5 MW NREL rotor, (Jonkman et al., 2009), a tower, and a transition piece. The transition piece was welded to the tower and grouted to the pile. The pile diameter was 6 m, and it was assumed to be connected rigidly at the mud-line. The mean still water level was 15 m above the mud line, (American Bureau of Shipping, 2011). Second, we studied the case of the same rotor model combined with a tripod foundation. The tripod foundation part was obtained from reference (MMI Engineering Inc, 2009), and the structure in this case was composed of a tower, a transition piece, the center column of the tripod, and tripod legs connected to the foundation piles. The turbine hub height was 90 m, and the mean still water level was 24 m above the mud line. The third case included a jacket support structure combines with the same rotor. The jacket foundation was based on the model used in the IEA-OC4 study (OC4-Jacket) (Vorpahl et al., 2011). The total height of the jacket foundation structure from mudline was 70.15 m, and the hub height over the Mean Sea Level (MSL) was 90 m.
2 Description of BEM codeThe code was developed at the Institute for Fluid Dynamics and Ship Theory, Hamburg University of Technology (TUHH), and originally, it was meant for simulating propeller flow, (Bauer et al., 2011). The kernel code was developed according to a three-dimensional Boundary Element Method (BEM), the body surfaces were discretized by means of quadrilateral panels, with each panel having a constant-strength singularity distribution of sources and dipoles. For each N body surface panel, the solver governing equation and the boundary conditions are satisfied at a control point (in the center of panel). The potential theory drives the governing equation, in which flow is considered irrotational, incompressible, and inviscid potential.
The equations for conservation of mass and momentum can then be simplified to Laplace's equation for total potential calculation (Katz et al., 2001):
| $\nabla {\mathit{\Phi }^{\rm{*}}} = 0$ | (1) |
where ∇ is the Laplace's operator, and the total potential is defined as
| ${\mathit{\Phi }^{\rm{*}}} = \mathit{\Phi } + {\mathit{\Phi }_{{\rm{ext}}}}$ | (2) |
where Φext denotes an external potential describing such as an undisturbed flow or a wave field. The induced potential Φ is determined by a source and dipole distribution on the surface of all physical boundaries present in the simulated domain., The surface of the body B is discretised by NB panels, each of which is related to a source and a dipole with the strengths σ and μ, respectively. In addition to this, any wake coming from the trailing edge of lifting bodies can be modelled using NW panels. These panels contain only a dipole. Thereafter the induced potential can be computed according to the following equation.
| $\mathit{\Phi } = \frac{1}{{4{\rm{\pi }}}}\int_{B + W} {\mu \frac{\partial }{{\partial n}}\left( {\frac{1}{r}} \right){\rm{d}}S - \frac{1}{{4{\rm{\pi }}}}} \int_B {\sigma \left( {\frac{1}{r}} \right){\rm{d}}S} $ | (3) |
where S denotes the areas of the respective panels, r is the distance from the regarded location, and n is the normal direction with respect to of the panel. μ and σ are defined as
The Dirichlet boundary condition applied to find the total potential (Eq. 3) in an inner point of the body. Then, the overall potential can be defined
| $\frac{1}{{4{\rm{\pi }}}}\int_{B + W} {\mu \frac{\partial }{{\partial n}}\frac{1}{r}{\rm{d}}S - \frac{1}{{4{\rm{\pi }}}}} \sigma \int_B {\left( {\frac{1}{r}} \right){\rm{d}}S} = 0$ | (4) |
The Kutta boundary condition was applied to the panel on blade's trailing edge in order to obtain the value of dipole strength in the wake surfaces behind the trailing edge as follows:
| ${\mu _{{\rm{t}}{\rm{.e}}}} = {\mu _{{\rm{upper}}}} - {\mu _{{\rm{lower}}}}$ | (5) |
The boundary conditions can be transformed the governing equation into a set of linear equations. The solution of these equations gives the strength of each dipole (μ) and source (σ), which can be used to compute the velocities induced induced on the body surface, where
| $p + \rho gz + 0.5\rho {v^2} + \frac{{\rho \partial {\mathit{\Phi }^{\rm{*}}}}}{{\partial t}} = {\rm{const}}$ | (6) |
where v denotes induced velocity, t denotes time, and ρ, g are water density and gravity constant, respectively.
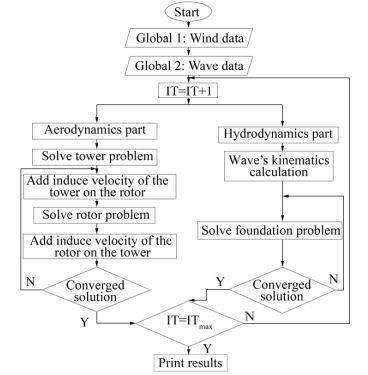
The BEM code simulates aerodynamic and hydrodynamic loads simultaneously by using two combined solvers. Such treatment of the problem allows for changing the wind and wave parameters independently during the simulation.
The solution domain around the offshore wind turbine was divided into two subdomains, to consider different environmental properties of the wind and the wave fields. The first subdomain covers the part above the free water surface and the second subdomain covers the part below it. The first solver (aerodynamics solver) computes aerodynamic forces in the first subdomain, and the second solver (hydrodynamic solver) calculates hydrodynamic loads in the second subdomain. As shown in Fig. 1, the code uses two different input data subroutines.
|
| Figure 1 Solution procedure |
The first subroutine (global 1) contains the rotor operating condition, air properties, and wind velocity. The second subroutine (global 2) contains wave properties. The OWT loads are estimated in each iteration for the two parts, namely, foundation and turbine. The aerodynamics solver uses an iterative procedure to solve the rotor–tower interaction problem, according to which passage of the blades of a wind turbine in front of the tower causes a shadowing effect and produces a loss of wind load on both the blades and the tower.
As the first step, this iterative procedure solves the rotor and the tower problems separately. As the second computational step, it considers the time-dependent influence of each component on the other by including the induced velocities of the adjacent structure.
Furthermore, the split technique (exclude a few panels from the solution), is required in both solvers to handle the foundation part panels that emerges out of the water (Ferreira et al., 2015) and the wake panels that collides with the tower. It should be mentioned that the wake panel will return to set again after passing the tower region.
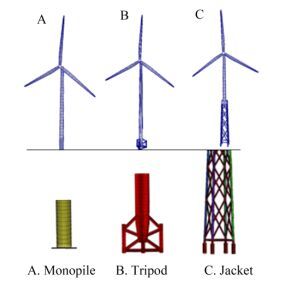
2.1 Panel generation and initial conditionsA quadrate panel grid was generated on all model surfaces, by using an in-house CAD code, excepted tripod and jacket foundation parts, ANSYS ICEM CFD was used for panel generation due to the complexity of these parts, as shown in Fig. 2. Also, Table 1 lists the total number of panels for each case.
|
| Figure 2 OWT panel grids for different types of foundation |
| Type | Monopile case | Tripod case | Jacket case |
| Blade | 1300 | 1300 | 1300 |
| Tower | 450 | 450 | 350 |
| Foundation | 250 | 1700 | 12000 |
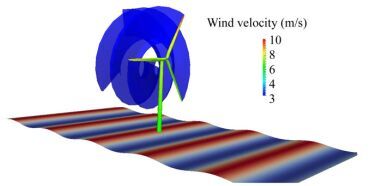
The inflow wind velocity was selected according to the wind shear principle over an offshore area (Erich, 2013), as shown in Fig. 3. The rotor angular velocity was 12.1 r/min, wake length was extended to two revolutions from the blade trailing edge, and time increment was 0.07 s in both solvers. The wave properties were wave amplitude=2 m, wave period=7.16 s, and water depth=(15 m, 24 m, and 50 m) for the three OWT cases of monopile, tripod and jacket, respectively, as listed in Table 2.
| Properties | Monopile case | Tripod case | Jacket case |
| H | 4 | 4 | 4 |
| λ | 69.9 | 76.9 | 80 |
| d | 15 | 24 | 50 |
| d/λ | 0.214 | 0.312 | 0.625 |
| Period | 7.16 | 7.16 | 7.16 |
| H/d | 0.266 667 | 0.166 667 | 0.08 |
| H/λ | 0.057 | 0.052 | 0.05 |
|
| Figure 3 Wind velocity distribution according to log law |
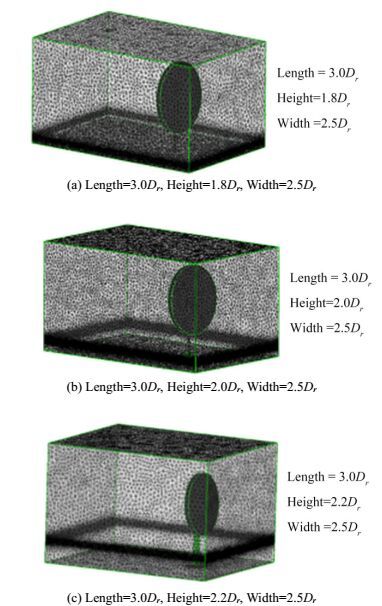
In this part, the same OWT geometrical configurations are used. The computational domains are shown in Fig. 4. Each domain contains a stationary and a rotating region domain. A cylindrical rotating domain is created around the hub and the blades, and this domain has the same rotor speed, while the stationary region domain contains all the other OWT parts. Interfaces are required to connect unmatched meshes within two region domains.
|
| Figure 4 OWT dimensions and mesh domains |
ICEM CFD is used for mesh generation in all domains using unstructured meshes. The mesh on the blade surfaces is triangular with an area of 0.4 m2, which is generated with a deviation of 0.01 for better mesh quality around the surfaces. The three interfaces surface have the same mesh area of about 1 m2, and prism layers are applied to the boundary wall surfaces, where the initial cell thickness is 2 mm, expansion ratio is approximately 1.2, and number of layers is 20. The volume mesh is generated depending on the surface mesh by using tetrahedral elements, to be able to capture wave characteristics with high accuracy. The free surface region is specified as a high-grid-density region compared to the other domain parts, which are extended to ±5 m above and below the still water level. The free surface mesh size setting is related to the wave properties, where the cell number should be more than 10 elements per wave height and 111 elements per wave length (Silva et al., 2010), thus, the mean cell volume in this region is 1.15 m3. The initial settings and refinement on both the free surface and the surrounding blade region lead to the final elements number as shown in Table 3.
| Cases | Total node number | Total mesh cell number |
| OWT with Monopile | 7254909 | 22.830 million |
| OWT with Tripod | 7608842 | 28.148 million |
| OWT with Jacket | 8287603 | 35.257 million |
In all cases, the same boundary conditions and initial conditions were assumed. Wall with no slip boundary condition was applied to all OWT parts in all cases, as well as to the sea bed. The domain of the numerical wave tank consisted of two homogeneous fluids (water and air) with an interface compression level of 2. The SST turbulence model was selected in all cases, and isothermal heat transfer was required for handling the two phase free surface problem. Buoyancy was specified, and buoyancy reference density was set to be equal to air density.
The free surface was modeled using a homogeneous coupled Volume of Fuid (VOF) approach, as developed in (Hirt et al., 1981), where air and water share a common flow field. Each fluid has a volume fraction, and the free surface was tracked by finding the evolution of the variables in each cell over each additional step. The sum of the volume fractions of all phases is unitary (Choi et al., 2013).
The expression formula was used to specify air velocity at the inlet boundary condition by using wind shear profile over offshore area, as presented in (Erich, 2013). The wind velocity at hub height was 8.7 m/s, and it was 7.7 m/s at the lowest position of the blade tip and 9.7 m/s at the highest position, leadings to a velocity difference of about 20%. Because forces scale with the square of velocity, therefore the forces increase from rotor bottom to rotor the top by approximately 36%. Water velocity was defined in the inlet region to generate a progressive regular two dimensional wave acting on the body. Wave velocity was determined based on Airy's linear wave theory, and it has two components in both the horizontal and the vertical directions.
| $u = \left( {{u_{{\rm{wave}}}} \times {\delta _{{\rm{water}}}}} \right) + \left( {{u_{{\rm{wind}}}} \times {\delta _{{\rm{air}}}}} \right)$ |
| $v = 0$ |
| $w = \left( {{w_{{\rm{wave}}}} \times {\delta _{{\rm{water}}}}} \right)$ |
The outlet region was defined with respect to relative static pressure, which was calculated from the hydrostatic pressure and wave dynamic pressure.
The opening boundary condition was applied to the top region, and the symmetric boundary condition was applied to the sides of the numerical wave tank. The second order backward Euler scheme was used, and the number of loops was set as 1–10 loops in each time step. Wave properties and rotor angular velocity were considered to be the same as those in the BEM code setting, which allows for a comparison of the results.
The initial condition was specified for both domains. The velocity was considered in Cartesian coordinates with the same velocity component expression as that used at the inlet boundary condition. Furthermore, the pressure value was defined according to the combination of hydrostatic pressure and wave dynamic pressure, as mentioned before, and with the given wave properties at the initial time, convergence will be improved. Computation using the RANSE solver was carried out by employing 48 processors with 2.2 GHz in an in-house cluster and 121.7 GB of memory in total. Thus, CPU time was 195, 240 and 288 h for the monopile, the tripod and the jacket cases, respectively. The BEM code used four processors with 3.3 GHz and 7 GB of memory in total. Thus, CPU time was 24 h for the monopile case, 36 h for the tripod case, and 72 h for the jacket case.
4 Results and discussionThe described methods were applied to calculate the effects of environmental loads on the three different OWT configurations, which assumed to be fully fixed at the mudline under similar wind and wave characteristics. Initially, it is very important to investigate the generated wave kinematics. Fig. 5 shows the wave kinematics calculated by the two solvers during 30 s (equivalent to about 4.2 from wave period cycles) at two specified points for the three cases. The location of point 1 was 10 m upstream in front of the OWT body on the free surface (z=0) and that of point 2 was 5 m below the first point, where the water waves at these points were considered unaffected by the foundation body or, in other words, wave kinematics were analyzed before the waves hit the OWT foundation.

|
| Figure 5 Wave kinematics |
In Fig. 5, wave elevation in the three cases at point 1 is compared for the two solvers. The difference between the results of the two solvers is acceptable which indicates that the boundary conditions and solver settings are correct. Moreover, the horizontal and vertical water velocity components, as well as the wave dynamic pressure, calculated using the two solvers at the two points were analyzed and compared. Obviously, the horizontal velocity component in the monopile case was higher than those in the other cases, but the highest vertical velocity component was seen in the jacket case.
The difference in the velocity components among the various wave field cases is related to different water depths, which have no effects on dynamic pressure calculations. This difference is much clearer for wave kinematics at point 2 than at point 1, because point 1 is located on the free surface (Z=0). It can be noted that the maximum values of the wave horizontal velocity component were obtained at the wave crest and trough, while vertical velocity equaled zero at these spots. Good agreement was obtained for the horizontal and vertical velocity components moreover to the wave's dynamic pressure values. Remarkably, there was no transient behavior in the CFX simulations, where the wave velocity defined in the wave domain was also used in the initial simulation values.
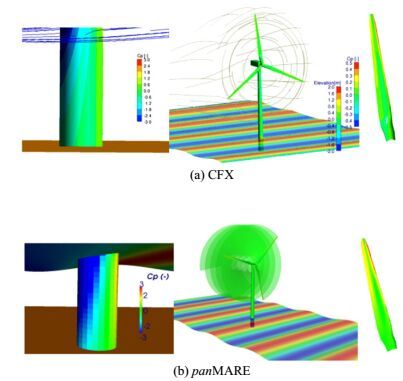
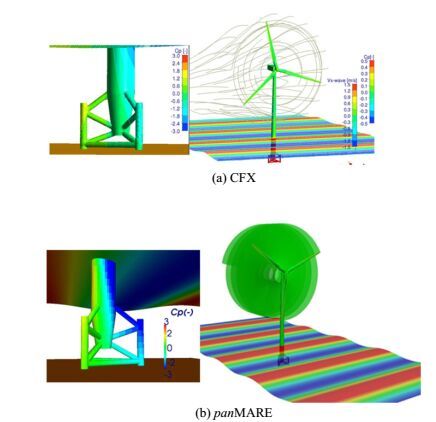
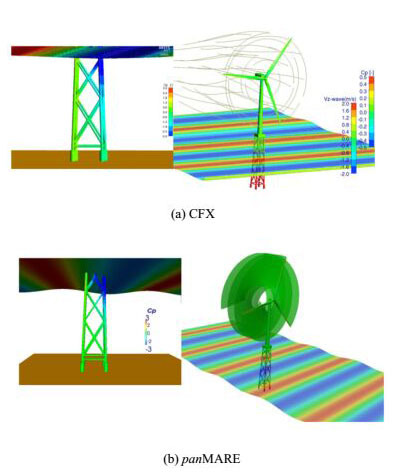
To give a comprehensive overview of all simulations, Figs. 6, 7, and 8show snapshot of the pressure coefficient distributions in the full OWT cases for both numerical methods. In Fig. 6 (monopile case), it is clear from the pressure coefficient distribution on the blade pressure side that the higher pressure region around blade leading edge was predicted correctly by the BEM code despite the limitation of obtaining the flow behavior of the blade tip trailing edge and the region close to the blade root because of the thick boundary layer and the severe flow separation. The BEM under predicted drag in these regions compared to the RANSE solver, which was able to capture the most important viscous effects in these regions. Moreover, the free surface indicates the elevation value in this figure, where the wave crest is just in front of the monopile body.
|
| Figure 6 Pressure distribution in OWT Monopilecase; free surface colored by wave elevation |
|
| Figure 7 Pressure distribution in OWT Tripod case; free surface colored by wave horizontal velocity component |
|
| Figure 8 Pressure distribution in OWT jacket case; free surface colored by wave vertical velocity component |
In Fig. 7 (tripod case), the free surface color was used to visualize the horizontal wave velocity component, and the maximum velocity value hit the tripod body. The above snapshots also presented the pressure coefficient distribution on the foundation surfaces due to wave dynamic pressure. Because the wave is proceeding, water particles under the crest accelerate downward, so the maximum pressure is attained directly below the wave crest. The reverse is true under the wave trough, where the minimum pressure is attained. Between the crest and the trough, acceleration is horizontal, so the vertical pressure distribution is hydrostatic (Faltinsen, 1995).
The free surface color in Fig. 8 (jacket case) indicates the vertical wave velocity component generated in deep water, where pressure undergoes an exponential decay with distance below the still water line. Therefore, the influence of dynamic pressure is small below one-half wavelength in depth, as can be seen in the snapshot of the dynamic pressure coefficient distribution on the jacket surfaces. The integration of dynamic pressure load over the body surface yield the incident wave force.
To determine the quantitative difference that can arise by using different calculation methods, all inflow OWT model loads and the corresponding moments around the mud-line were made to be dimensionless by using the mean value of the last three total loads and moment amplitudes obtained using the BEM code, as shown in Table 4.
| Force values in flow direction/kN | |||||
| Cases | Method | Rotor | Tower | Foundation | Total |
| Monopile | CFX | 609.8 | 20 | 550 | 1 179 |
| BEM | 567 | 10 | 650 | 1 227 | |
| Tripod | CFX | 609.8 | 20 | 600 | 1229 |
| BEM | 567 | 10 | 825 | 1 402 | |
| Jacket | CFX | 609.8 | 8 | 258.2 | 876.0 |
| BEM | 567 | 9 | 325 | 901 | |
| Moments around mud-line/(MN·m) | |||||
| Cases | Method | Rotor | Tower | Foundation | Total |
| Monopile | CFX | 63 | 1.2 | 8.2 | 72.4 |
| BEM | 59 | 0.8 | 10 | 69.8 | |
| Tripod | CFX | 69.5 | 1.3 | 14.4 | 85.2 |
| BEM | 64.6 | 0.9 | 19.8 | 85.3 | |
| Jacket | CFX | 85.3 | 0.7 | 12.9 | 98.9 |
| BEM | 79.3 | 0.85 | 16.2 | 96.3 | |
Figs. 9(a) and 9(b) show the time histories of the horizontal loads and their moments to the mud-line contribution values, which were calculated by the two solvers for the three cases (Monopile, Tripod, and Jacket) respectively. It is known that for each solver, the blades rotor experiences the same thrust in all cases because the same geometry and operating conditions are employed. The RANS solver predicted an average thrust value of 609.8 kN, while the BEM solver predicted an average thrust value of 567 kN, see Table 4. The difference in the mean magnitudes of rotor thrust is about 8%. Regarding this fundamental test, the results show acceptable agreement with both methods. According to the operating condition and airfoil blade, the flow is attached and no stall condition is applicable to the rotor blades. The investigation of thrust loads is useful for explaining and understanding the aerodynamic behavior of the rotor and for quantifying the effects of tower shadow, where the thrust curve behavior shows periodic oscillations with a sharp drop of about 6.3% in the thrust value every blade passing the tower. The contribution of rotor thrust to the total force devise is different in each case due to different achieved total forces in each model, the lower rotor thrust contribution in the tripod case, and higher rotor thrust contribution in the jacket case. An obviously the rotor thrust present from 40% to 51% from total force that effect in the first and second cases (monopile and tripod) and increase to 68.6% in the third case (jacket). The rotor thrust force in all OWT cases can generate a great moment value around the mud-line, exceeding 75.8% from the total OWT moment because of the long lever arm, as can be seen in Fig. 9(b).

|
| Figure 9 Time history of OWT parts horizontal load contribution to total device load, and contributions of OWT parts moments around mud-line to total device moment |
Moreover, it is clear from Fig. 9 that the RANSE solver needs at least two revolutions to reach the periodic solution and the loads predicted on the foundation part have no effect on the rotor thrust, as also noted in (Vorpahl et al., 2012). The acceptable difference between the results obtained with the two solvers shows the capability of the BEM code to accurately represent the rotor flow field.
Fig. 9(a) also shows the time history of the tower's and the foundation's contributions to the OWT total force device obtained using both solvers. The total contributions of thetower and the foundation are lower than 55% in the monopile case, 60% in tripod case, and 38% in the jacket case. The hydrodynamic loads on the foundation part are related to the diameter of the support structure, where the foundation structure with small diameters, for instance, jacket structures, are generally drag dominated. By contrast, for large diameter components, such as monopile and tripod, incur both inertial and drag loads, therefore jacket force is lower than those in the other models. Moreover, the horizontal loads due to thetower and the foundation parts, which are regarded to be very high generated moment around the mudline less than 23.2% from the total OWT moment in all cases. The difference between the wave crest and the wave trough is remarkable, especially in tripod case, where the absolute value of force on the wave crest is lower than that on the trough; this difference can be attributed to the mesh resolution along the free surface tank.
It can be noted from Table 4, that the aerodynamic loads on the tower and its moment around the mud-line are very small compared with those around the other OWT parts, as also noted in (Markus, 2009). The forces on the tower part are a combination of wind aerodynamics and wave hydrodynamic forces, which increases with increasing wind speed and wave height. It can be seen that the contribution of the tower is less than 1% of the total devise force in the BEM solver, which is lower compared to that calculated using RANSE solver, due to wave diffraction induced by the tower root part, which is not taken into account in the BEM solver. Moreover, the tower induced force in the jacket case is lower than that in the other cases due to lower tower height.
The transfer of large bending moment to soil can generate high dynamic loads on the structure. Tripod and jacket can withstand more against this dynamic loads due to their larger bases. It should be mentioned that there are differences in the loads calculated by the BEM code and the RANSE solver owing to simplified assumptions depending on the methods, where the influence of friction between the fluid and the structure in the boundary layer is ignored in the BEM code.
5 ConclusionsThe unsteady flow behaviors of three types of offshore wind turbines under combined aerodynamic and hydrodynamic loads were analyzed using two different methods, namely, BEM and RANSE. The solution procedure using the BEM code involves a combination of two solvers: one for simulating OWT parts above still water level and one for simulating OWT parts below the still water level. In the RANSE method, the free surface was modeled using a homogeneous coupled volume of fluid approach. The three different OWT configurations employed herein consisted of a generic 5 MW NREL rotor with three different foundations types, namely, monopile, tripod, and jacket.
These three configurations were analyzed under the effects of atmospheric wind shear and rotor speed of 12.1 r/min; the wave properties were wave period=7.16 s, waveand water depth=15, 24, and 50 m, respectively.
Wave kinematics at two specified points on the free surface were analyzed and compared, where the horizontal velocity component in the monopile case was higher than those in the other cases, but the highest vertical velocity component was obtained in the jacket case because of the different water depth. The force on each OWT part was calculated to determine the total force. The time history of the forces and moments around the mud-line for each OWT part in the inflow direction were calculated and presented in a dimensionless form with respect to the mean value for the last three amplitude loads obtained from the BEM code. The rotor loads represented 40%–51% of the total force in the monopile and tripod cases, and increased to 68.6% in the jacket case. The contributions of the tower and the foundation loads obtained from both solvers were less than 55% of the total load in the monopile case, 60% in the tripod case, and 38% in the jacket case. The rotor thrust force generated more than 75.8% of the total OWT moment around the mud-line and the other parts (tower and foundation) generated moments around the mud-line present less than 23.2% from total moment. The calculated hydrodynamic loads on the jacket foundation type were lower than the loads in the other two cases because of the smaller diameter of the jacket foundation. Computation using the RANSE solver was carried out in an in-house cluster with very long CPU time, which was less than 288 h. With the BEM solver, we used a personal computer with shorter CPU (less than 72 h). The results confirm the capability of the panMARE code in characterizing the temporal and spatial nature of flow near an OWT with a short computation time.
Nomenclature
A Area (m2)
B Body surface (m2)
Dr Diameter (m)
p Pressure (N/m2)
v Velocity (m/s)
d Water depth (m)
n Normal vector of a surface
u, v, w Velocity components (m/s)
r Radius (m)
S Surface area (m2)
H Wave height (m)
g Acceleration (m2/s)
t Time (s)
x, y, z Coordinate directions (m)
W Wake surface (m2)
T Period (s)
ρ Fluid density (kg/m3)
ω Angular frequency (1/s)
λ Wave length (m)
μ Doublet strength (m4/s)
σ Source strength (m3/s)
δ Volume fraction factor
| American Bureau of Shipping, 2011. Design standards for offshore wind farms. Final report, U. S. American Bureau of Shipping, Houston. |
| Bauer M, Abdel-Maksoud M, 2011. Propeller induced loads on quay walls. 2nd Workshop on Ports for Container Ships of Future Generations, 22, Hamburg. |
| Choi SJ, Lee KH, Hong K, Shin SH, Gudmestad OT, 2013. Nonlinear wave forces on an offshore wind turbine foundation in shallow waters. International Journalof Ocean System Engineering, 3(2), 68–76. DOI:10.5574/IJOSE.2013.3.2.068 |
| Erich H, 2013. Wind turbines: Fundamentals, technologies, application, economics. 3rd translated edition, Springer-Verlag. |
| Faltinsen OM, 1995. Sea loads on ships and offshore structures. Cambridge, UK: Cambridge University Press. |
| Ferreira González D, Lemmerhirt M, König M, Abdel-Maksoud M, Düster A, 2015. Numerical and experimental investigation regarding the landing manoeuvre of a catamaran vessel at an offshore wind turbine in waves. International Conference on Ocean, Offshore, and Arctic Engineering, St. John's, Canada, OMAE2015-42071. DOI: 10.1115/OMAE2015-42071 |
| GreveM, 2015. Non-viscous calculation of propeller forces under consideration of free surface effects. PhD theses, Fluid Dynamic and Ship Theory Institute, Hamburg University of Technology, Hamburg. |
| Hansen AC, Laino DJ, 1999. User's guide to the wind turbine dynamics computer programs YawDyn and AeroDyn for ADAMS. Available from http://wind.nrel.gov/designcodes/simulators/yawdyn/. (Accessed on July 25th, 2006) |
| Hirt CW, Nichols D, 1981. Volume of fluid (VOF) method for the dynamics of free boundaries. Journal of Computational Physics, 39(1), 201–225. DOI:10.1016/0021-9991(81)90145-5 |
| Jonkman J, Butterfield S, Musial W, Scott G, 2009. Definition of a 5-MW reference wind turbine for offshore system development. Technical report NREL/TP-500-38060, National Renewable Energy Laboratory, Golden, UnitedStates. |
| Katz J, Ploklin A, 2001. Low-speed aerodynamics. Cambridge, UK: CambridgeUniversity Press. |
| Markus D, 2009. A code based methodology to account for wave loading in the design of offshore structures. Diploma thesis. Universität Stuttgart, Stuttgart, Germany. |
| MMI Engineering Inc, 2009. Comparative study of OWTGstandards. Prepared for JIP Sponsorship, MMI Project No. MMW528, Oakland. |
| Ruehl K, Michelen C, Kanner S, Lawson M, Yu YH, 2014. Preliminary verification and validation of WEC-Sim, an open-source wave energy converter design tool. 33rd International Conference on Ocean, Offshore and Arctic Engineering, San Francisco, OMAE2014-24312. |
| Schaffarczyk A, 2014. Introduction to wind turbine aerodynamics. Springer-Verlag, Berlin Heidelberg, Kiel. |
| Silva M, De AraújoVitola M, Pinto W, Levi C, 2010. Numerical simulation of monochromatic wave generated in laboratory: Validation of a CFD code. 23rd National Conference of Water Transport, Shipbuilding and Offshore, Rio de Janeiro. |
| Vorpahl F, PopkoW, Kaufer D, 2011. Description of a basic model of the "UpWind reference jacket" for code comparison in the OC4 Project under IEA Wind Annex 30. Technical report, Fraunhofer Institute for Wind Energy and Energy System Technology, Bremerhaven. |
| Vorpahl F, Schwarze H, Fischer T, Seidel M, Jonkman J, 2012. Offshore wind turbine environmental loads simulation and design. WIREs Energy and Environment, 2(5), 548–570. DOI:10.1002/wene.52 |


