2. Department of Mechanical Engineering, University of Sistan and Baluchestan, Zahedan 98155-987, Iran
1 Introduction
The super cavitation process should be used to reach high velocities underwater. This phenomenon can be achieved naturally and artificially. Bulbs are usually generated by a device called a cavitator, which is placed at the tip of the vehicle and implemented especially for this purpose. Cavitators come in different types, including conic, cuneal, and disc shape (Goel, 2002). Cavitational streams are expressed as
The use of a cavitator may not be sufficient to create cavitation. Therefore, air is blown at the tip of the different parts of the body of a vehicle to continuously generate cavitation (Goel, 2002). The amount of air with a gas injection rate coefficient
Cavitational streams are dynamic and complex. The smallest change in the stream field affects the shape of the bulb and its parameters. As it also influences the prediction and development of the bulb, the numerical and experimental research in the cavitation field has been conducted broadly. Previous literature investigated the changes in different parameters, including cavitator shape, attack angle, and gas injection rate coefficient, among others, and analyzed their effects on natural and artificial cavitation bulbs. On the basis of previous studies, we consider that to investigate under-water vehicles, such as torpedoes, the following points should be regarded in the model:
● The existence of a body at the back of the cavitator should be considered as the body behind the cavitator affects the shape and symmetry of the bulb (Schauer, 2003; Ma et al., 2006; Alishahi, 2010).
● The effect of gravity should be observed (Zhang et al., 2007).
● If the body is symmetric, a good correspondence will be achieved between 2D and 3D results, and the return and hydro pulse leakages will be visible (Ahn et al., 2012).
● The number of natural cavitation affects the bulb shape made out of gas injection; therefore, these two phenomena should be investigated together (Yang et al., 2009; Wei et al., 2009).
● The artificial supercavitation is a timely phenomenon (Zou et al., 2010; Vlasenko and Savchenko, 2012)
One of the most important experimental studies conducted in recent years is Schauer (2003). We used Schauer's model in the present study because the details of Schauer's study are completely available. Moreover, the model enables us to examine artificial and natural cavitation separately and simultaneously, which is one of the purposes our study, and to investigate artificial supercavitation in low velocity in torpedoes. In the current research, a numerical study was implemented in two dimensions, and the change in injection angle in artificial cavitation and the effect of this change on the field of the speed of the stream and the bulb shape were investigated. A side from the parameters mentioned by (Wei et al., 2009), the gas injection angle is also an important factor influencing the shape of the bulb. Therefore, the three parameters of injection rate coefficient, injection angle, and cavitation number can affect on the drag and lift coefficients. Through the Design of Experiment (DOE) method, we defined the practical conditions of the experiment. The DOE was implemented to define the practical conditions. The relations of the objective functions of the lift and drag coefficients were calculated according to injection angle, injection rate coefficient, and cavitation number, and the related charts were presented.
2 Numerical simulationIn this numeral solution, the non-linear Reynolds averaged Navier-Stokes equations and the auxiliary equation for the volume fraction of water are solved based on pressure completely and implicitly. A simple algorithm was used for the dependency of the velocity and pressure field (Baradaran Fard and Nikseresht, 2012). Non-temporal resolution was used for natural cavitation and temporal resolution was used for artificial cavitation (Alishahi, 2010). A mixed model was used to demonstrate the multi-phase flow (Hashem Abadi and Dehnavi, 2011). The turbulence model of the mixture is a multi-phase turbulence model as pre-supposed. This model is the extension of the single phase k-ε model. In this situation, taking advantage of the mixture features and the mixture velocities to determine the turbulence stream characteristics is sufficient. The geometry of the torpedo is designed based on the geometry implemented in Schauer's experiment (Schauer, 2003) in which the cavitator diameter is 10 mm, the diameter of the torpedo body is 16 mm, and the length of the torpedo is 107 mm.
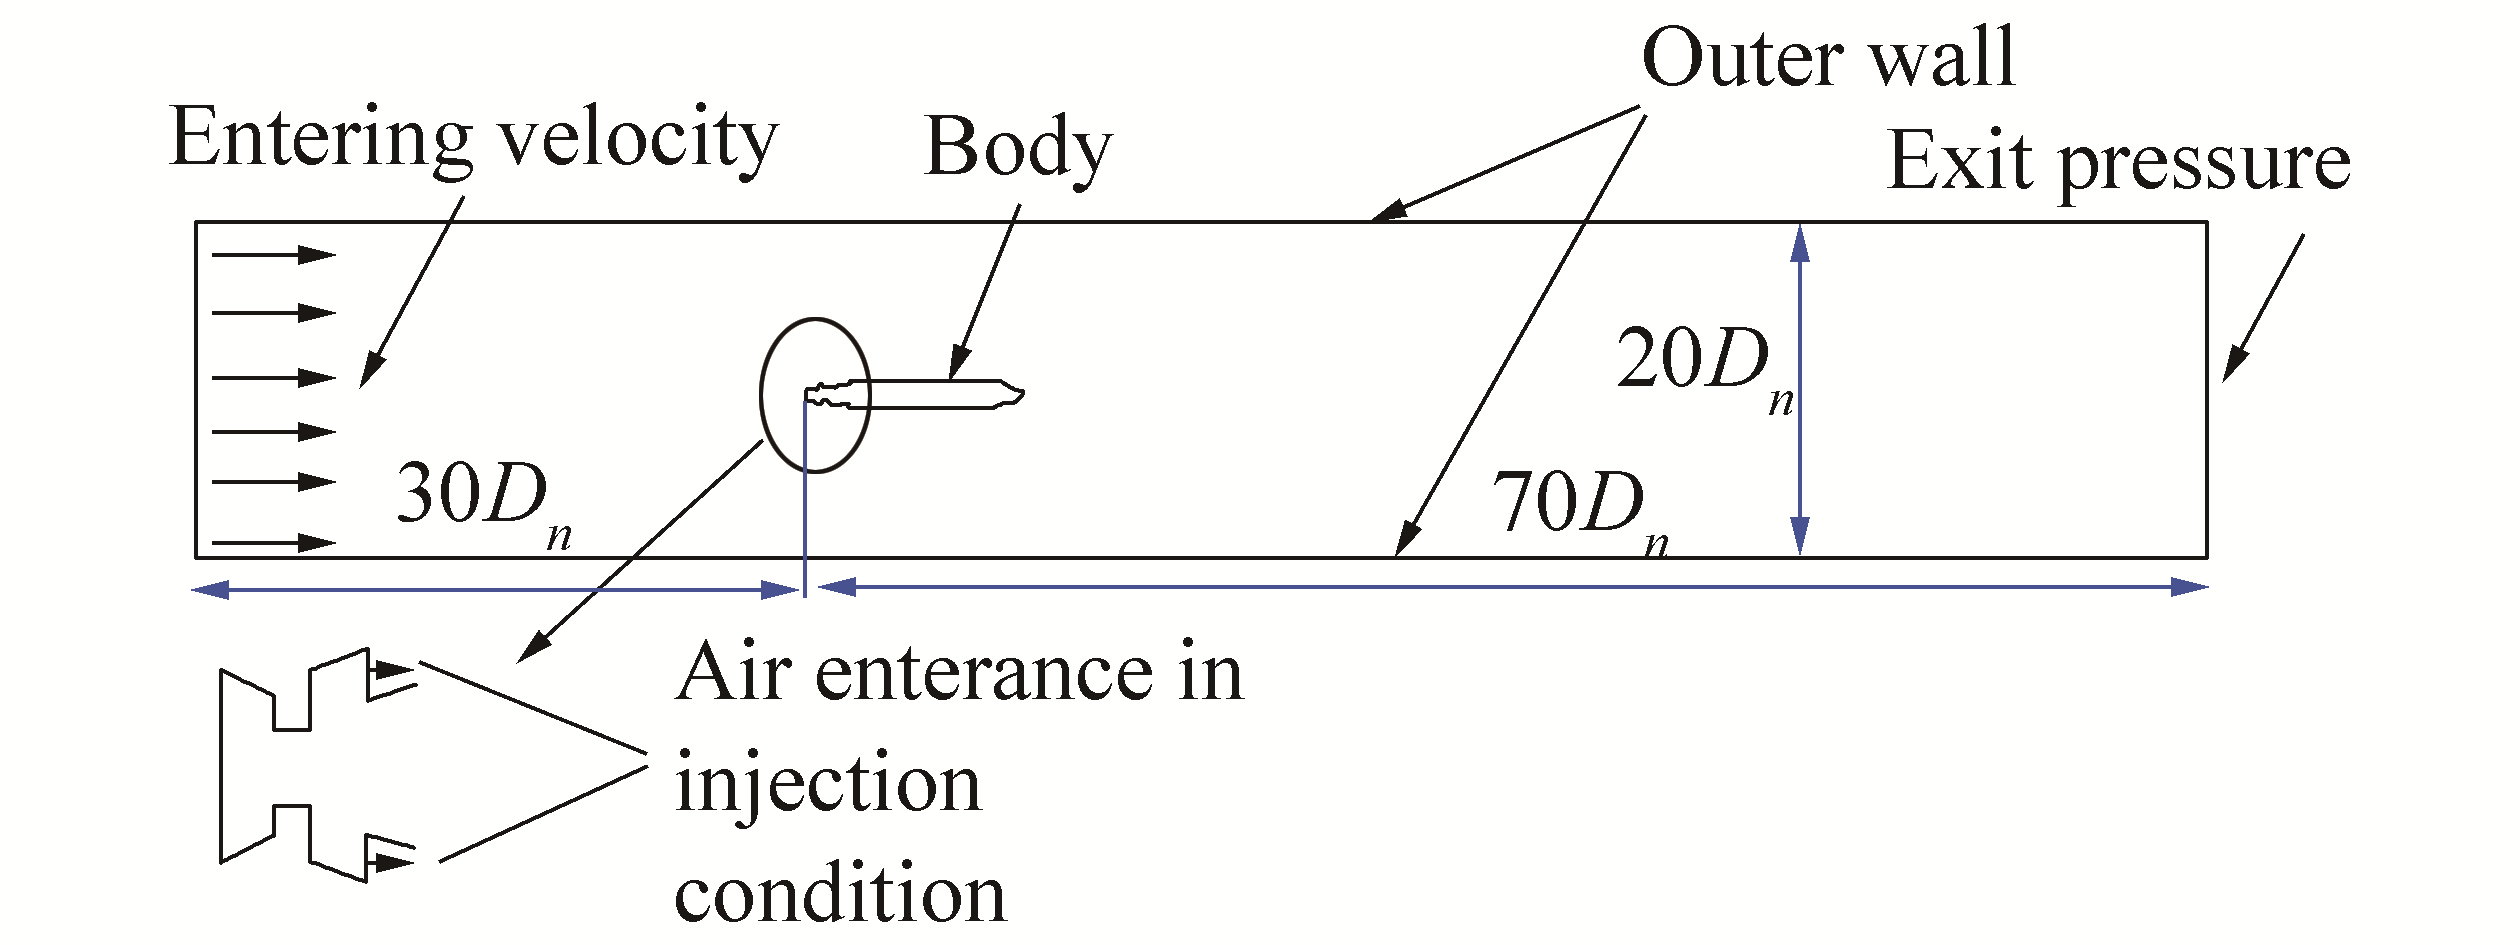
Fig. 1 shows the circumference and the solution borders surrounding the torpedo. Regarding the asymmetry of the bulb in the presence of the acceleration of gravity around the torpedo body, the axial symmetry of the shape is ignored (Zhang et al., 2007).
|
| Figure 1 Solution borders |
The upper border of the stream is located at 30Dn, i.e., 300 mm away from the cavitator, and the downstream border is located 700 mm away from the cavitator. The upper and lower walls are 100 mm away from the center line (Ji et al., 2010). The upper border of the velocity stream at the entrance and the downstream pressure at exit in the torpedo body is the pre-condition for non-slipping. For air injection in artificial cavitation, entering velocity in the injection point and in the upper and lower walls are regarded as the pre-conditions of freely slipping.
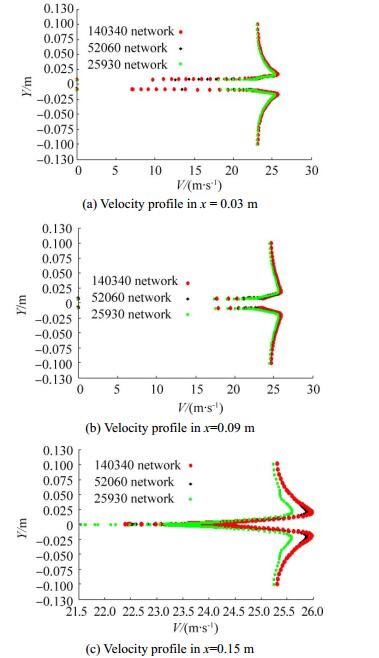
2.1 Independence from networksFor the stream parameters to be independent from a number of networks, the ideal network for the solution field should be chosen in a way that it does not increases the calculations and does not introduce errors into the simulation.
In Fig. 2, the velocity profiles for the three networks in the three cross-sections with distances of 3, 9, and 15 cm at the back of the cavitator are shown. As defined in the figure, the changes in the velocity profile in two networks, namely, 52 060 and 140 340, are close to each other. As a result, network 52 060 is independent from network changes.
|
| Figure 2 Analysis of the independence of the velocity profile network in three cross-sections |
We analyze Y+ around the torpedo body to analyze the quality of the selected network. To attain this aim, Y+ should be less than 100 (Ji et al., 2010, Roohi et al., 2013). Y+ is a non-dimensional distance. It is often used to describe how coarse or fine a mesh is for a particular flow pattern. It is important in turbulence modeling to determine the proper size of the cells near domain walls. The turbulence model wall laws have restrictions on the Y+ value at the wall. For instance, the standard K-epsilon model requires a wall Y+ value between approximately 300 and 100. A faster flow near the wall will produce higher values of Y+, so the grid size near the wall must be reduced.
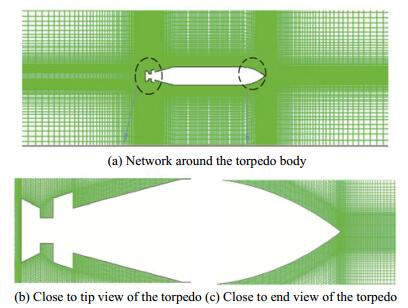
As shown in Fig. 3, the amount of Y+ is below 60. Therefore, network 52 060 is selected as the optimal network for simulation. Fig. 4 shows network 52 060 along the edges of the shape in detail.

|
| Figure 3 Amount of Y+ around the torpedo body in 52 060 network |
|
| Figure 4 Selected network 52 060 |
Fig. 5 presents the results of artificial cavitation compared with those of the experimental one. To calculate the artificial cavitation number in terms of the length and diameter of the bulb, the semi-experimental wide relation is used. The wide realtion for a disc cavitator with zero attack number is defined as follows (Schauer, 2003):

|
| Figure 5 Comparison of the simulation results with Schauer's laboratory results (Schauer, 2003) |
| $ L=\frac{1.08}{\sigma _{c}^{1.118}}{{D}_{n}} $ | (1) |
| $ D=\frac{0.534}{\sigma _{c}^{0.568}}+1 $ | (2) |
where Dn is the cavitator diameter,
As shown in Fig. 5, the shape of the simulated bulbs matches well with the experimental results.
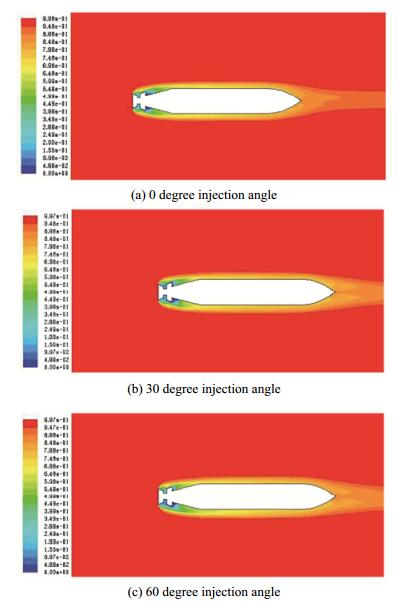
4 Result and discussion 4.1 Effect of gas injection methodTo examine the effect of the gas injection method on the air stream entrance border, we implement the angle condition to enable the preferred angle to enter the air stream. The injection angles in three situations are the 0°, 30°, and 60° angle changes.
As shown in Fig. 6, the increase in angle results in the increase in volume of the bulb. To what extent these changes are useful and how other parameters (e.g., amount of the injection rate coefficient and number of natural cavitation) affect the artificial cavitation bulb in different angles should also be investigated.
|
| Figure 6 Comparison of changes in the artificial cavitation phase in different injection angles at an injection rate coefficient of 0.18 and σv=1 |
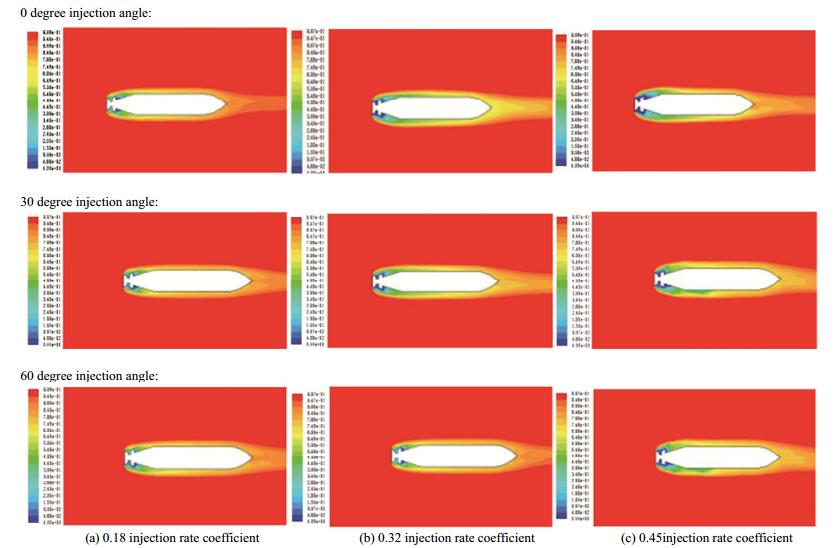
In Fig. 7, phase counters are compared in three different injection angles and injection rate coefficients at σv=1. Phase counters are presented according to the increase in injection rate coefficients from right to left and according to injection angle from up to down.
|
| Figure 7 Comparison of phase counters in three different injection angles and injection rate coefficients at σv=1 |
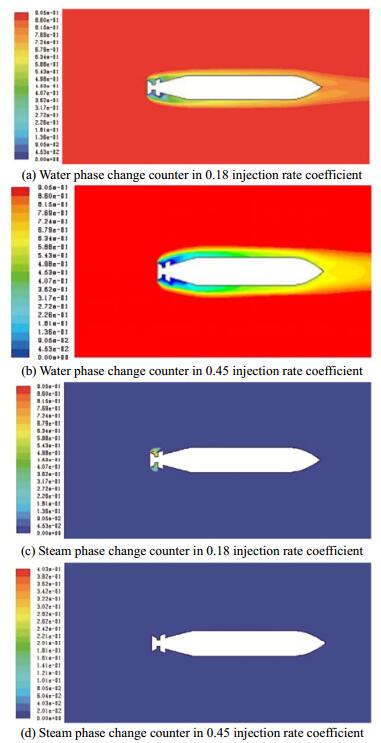
With increasing angle, the bulb length in all three injection rate coefficients, except the 0.32 injection rate and 60° injection angle, also increases. The shape of the bulb phase counter around the torpedo in the 0.18 injection rate coefficient and 30° injection angle is near the phase counter shape in the 0.32 rate coefficient and 0° injection angle. This fact applies to the shape of the bulb phase counter around the torpedo in the 0.18 injection rate coefficient and 60° injection angle. In other words, the bulb shape in the 0.18 injection rate coefficient gets closer to the bulb shape in the 0.32 injection rate coefficient with increasing injection angle. However, this outcome does not mean that the change in injection angle is useful 100%. The increase in injection rate coefficient causes pulsing cavitation in the 0.45 injection rate coefficient. This situation is observed in the 0.32 injection rate coefficient and 30°injection angle. The figure shows that the bulb in the 0.32 injection rate coefficient and 30° injection angle is near the bulb in the 0.45 injection rate coefficient and 0° angle. In the other words, the cavitation bulb may reach an inconsistent state with the increase in injection rate coefficient and injection angle. In the 0.45 injection rate coefficient, an increase in injection angle causes an increase in the wave-like state in the bulb wall. It also disturbs the bulb symmetry to 0.5 volume fraction of the phase changes (i.e., the green color in 0.45 injection rate coefficient of the phase counter). An increase in bulb asymmetry disturbs the upside and the downside with an increase in injection angle. Up to this stage, variation analysis of the changes in cavitation number 1 is conducted. Cavitation number 1.5 is also simulated, and the results of phase counters are similar to those of cavitation number 1. As no steam is found in the steam phase, we do not mention the results. The situation in cavitation number 0.5 is different as some steam is observed. In this special condition, artificial and natural cavitations exist simultaneously together. Fig. 8 presents the comparison of the interaction of the two phases in the injection rate coefficients of 0.18 and 0.45, 0° injection angle, and σv=0.5. The increase in injection rate coefficient removes the steam phase caused by natural cavitation. In the 0.45 injection rate coefficient, an air injection penetrates the forward side of the torpedo and surrounds the whole torpedo body. This issue is investigated in a previous study (Ji et al., 2010).
|
| Figure 8 Comparison of interaction between two phases in the 0.18 and 0.45 injection rate coefficients, 0° injection angle, and σv=0.5 |
The shape of the bulb and its effects are shown in the drag and lift coefficients. Therefore, the general result is affected in terms of the three parameters of injection rate coefficient, injection angle, and cavitation number on the drag and lift coefficient. The test design is examined using the DOE method to determine the change in injection angle and effect parameters. The DOE method shows the parameter number and each parameter level in the target subject with a random test. The current study addresses the factorial design at three levels. Therefore, to observe the change in target subject and operation of the injection angle, the three parameters of cavitation number, injection angle, and injection rate coefficient are considered in three cases (Table 1). Cavitation number is for visible velocity and temperature (i.e., for evaporation pressure), and water pressure is at three levels of 0.5, 1, and 1.5. Torpedo velocity is not high in the injection in primary moments when natural cavitation is achieved. Therefore, natural cavitation is considered for an amount when natural cavitation is not or is forming. The injection angle is considered at three logical levels of 0°, 30°, and 60° and the injection rate coefficient is considered at the three levels of 18%, 32%, and 45%. The injection rate coefficient in the bulb is made as a permanent and perfect artificial cavitation.
| Factors | Parameters | Level (+1) | Level (0) | Level (-1) |
| A | Cavitation number | 1.5 | 1 | 0.5 |
| B | Injection rate coefficient | 0.45 | 0.32 | 0.18 |
| C | Injection angle | 60 | 30 | 0 |
To determine the effect ratio of parameters on drag and lift, this test targets subjects so that dramatist models are made in the form of (33)27. The second model 2FI and quadratic model are used to model the drag and lift coefficient. In models A, B, and C, cav, air, and tet correspond to the introducer cavitation number, injection rate coefficient, and injection angle, respectively. Variance analysis is confirmed in these models (Table 2). To examine the correctness of the relations among previous amounts in each drag and lift coefficient by deferent points, the relation between the internal and external extents for solving from the dramatist model improves the error percentages. Consistently, the internal extent is less than 4% and the external extent is less than 7% (Table 3).
| Source | Sum of squares | Degree of freedom | Mean square | F-value | p-value |
| Model | 1.04 | 6 | 0.17 | 32.77 | < 0.000 1 significant |
| A-cav | 1.00 | 1 | 1.00 | 189.40 | < 0.000 1 significant |
| B-air | 0.026 | 1 | 0.026 | 5.00 | 0.003 68 significant |
| C-tet | 2.222E-005 | 1 | 2.222E-005 | 4.204E-003 | 0.009 489 significant |
| AB | 2.083E-004 | 1 | 2.083E-004 | 0.039 | 0.008 446 significant |
| AC | 5.208E-005 | 1 | 5.208E-005 | 9.854E-003 | 0.009 219 significant |
| BC | 0.011 | 1 | 0.011 | 2.16 | 0.001 574 significant |
| Variation range | Cavitation number | Injection rate | Injection angle | Maximization coefficient | Relation prediction coefficient | Error percentage | |||||
| Lift | Drag | Lift | Drag | Lift | Drag | ||||||
| Within range | 1.25 | 0.18 | 0 | -0.4 | 0.87 | -0.411 6 | 0.882 6 | 2.905 4 | 1.444 2 | ||
| Within range | 1.25 | 0.18 | 30 | -0.28 | 0.85 | -0.271 3 | 0.853 9 | 3.091 8 | 0.456 9 | ||
| Within range | 1.25 | 0.18 | 60 | -0.4 | 0.86 | -0.395 5 | 0.825 2 | 1.122 7 | 4.046 1 | ||
| Within range | 1.25 | 0.18 | 60 | -0.27 | 0.82 | -0.264 1 | 0.815 3 | 2.200 2 | 0.577 4 | ||
| Within range | 1 | 0.32 | 45 | -0.45 | 0.72 | -0.434 4 | 0.695 3 | 3.463 6 | 3.436 3 | ||
| Within range | 1.25 | 0.32 | 0 | -0.45 | 0.82 | -0.470 3 | 0.808 7 | 4.510 6 | 1.381 0 | ||
| Without range | 1 | 0.32 | 75 | -0.6 | 0.725 | -0.633 2 | 0.697 5 | 5.54 | 3.791 5 | ||
| Without range | 1.25 | 0.6 | 30 | 0.8 | 0.78 | 0.845 2 | 0.728 1 | 5.644 | 6.648 4 | ||
The final relation to predict the lift and drag coefficients is obtained as follows:
| $ \begin{align} &\text{drag}=0.36889+0.48694\times \text{cav}-0.45062\times \text{air}- \\ &0.0025\times \text{tet}-0.061728\times \text{cav}\times \text{air}+ \\ &0.000138889\times \text{cav}\times \text{tet}+0.00761317\times \text{air}\times \text{tet} \\ \end{align} $ | (3) |
| $ \begin{align} &\text{lift}=+1.76346-3.77389\times \text{cav-4}\text{.47051}\times \text{air-} \\ &\text{0}\text{.00124074}\times \text{tet-0}\text{.18519}\times \text{cav}\times \text{air}+ \\ &0.005\times \text{cav}\times \text{tet+0}\text{.022634}\times \text{air}\times \text{tet}+ \\ &1.99111\times \text{ca}{{\text{v}}^{2}}+8.56577\times \text{ai}{{\text{r}}^{2}}-0.000146914\times \text{te}{{\text{t}}^{2}} \\ \end{align} $ | (4) |
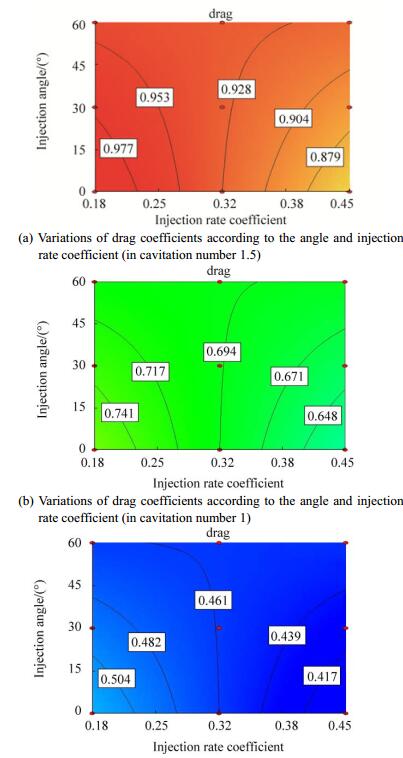
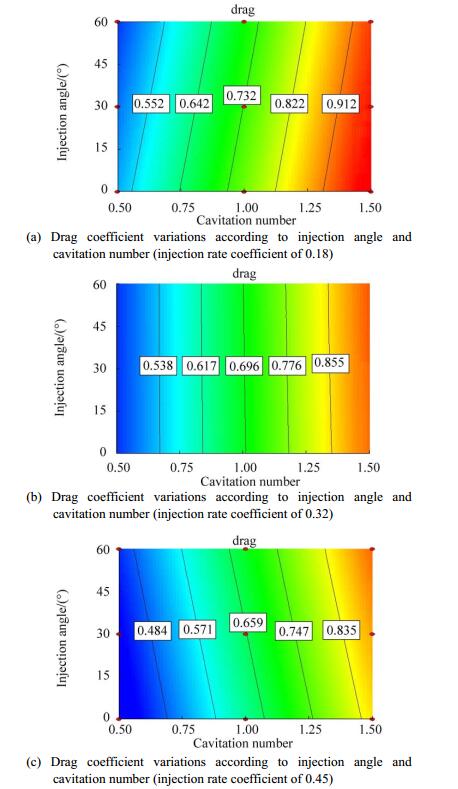
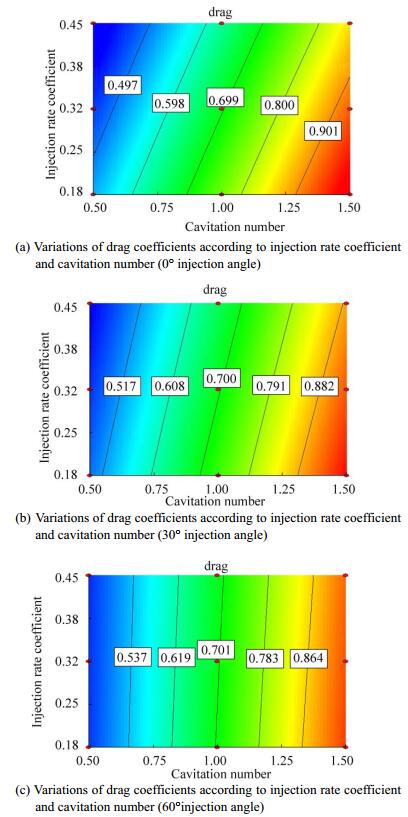
As shown in Fig. 9, changes in the drag coefficient according to the injection angle and injection rate coefficient in the cavitation number are different. Each of the three cavitation numbers for a low injection rate coefficient (less than 28%) increases the injection angle because of the decrease in drag coefficient. However, an injection with a high injection rate coefficient (higher than 35%) increases the angle because of the increase in drag coefficient. In Fig. 10, the changes in drag coefficient are according to the injection angle and cavitation number in the injection rate coefficient. Fixed drag lines are similar to parallel lines. Grades of the drag coefficient lines are fixed in the injection rate coefficient at 18%. They gradually increase with the increase in injection rate coefficient and increase to 45% when the injection rate coefficient is negative.
|
| Figure 9 Variations of drag coefficient according to the angle and injection rate coefficient in different cavitation numbers |
|
| Figure 10 Drag coefficient variations according to injection angle and cavitation number in different injection rate coefficients |
In these shapes, changes in the injection angle are not desirable (Fig. 11). In high injection rate coefficients, an increase in injection angle causes an increase in an undesirable drag coefficient. Fixed drag lines are similar to parallel lines. Increasing the angle increases the grade of fixed drag coefficient lines.
|
| Figure 11 Variations of drag coefficients according to injection rate coefficient and cavitation number in different degrees of injection angle |
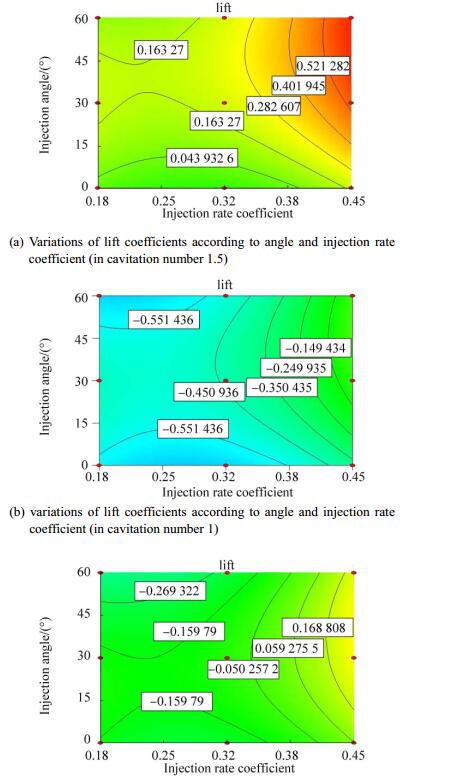
This section examines the graph changes in the lift coefficient in relation to the three parameters of injection rate, injection angle, and cavitation number. These changes depend on designers' ideas or on the application of a torpedo from the shot place to the up or down part or with no movement. The conclusion on these graphs is that they can reach the special target.
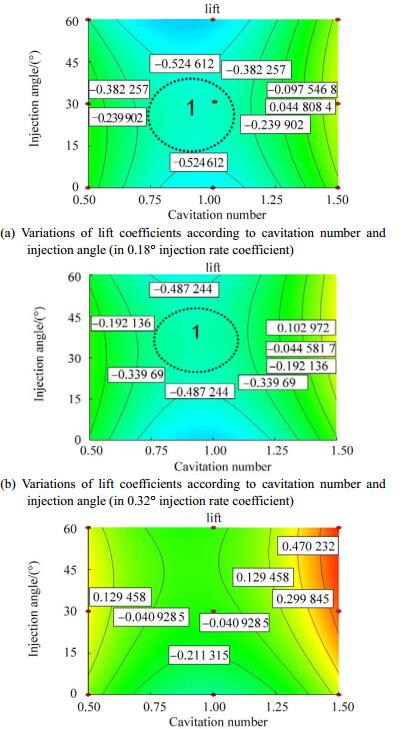
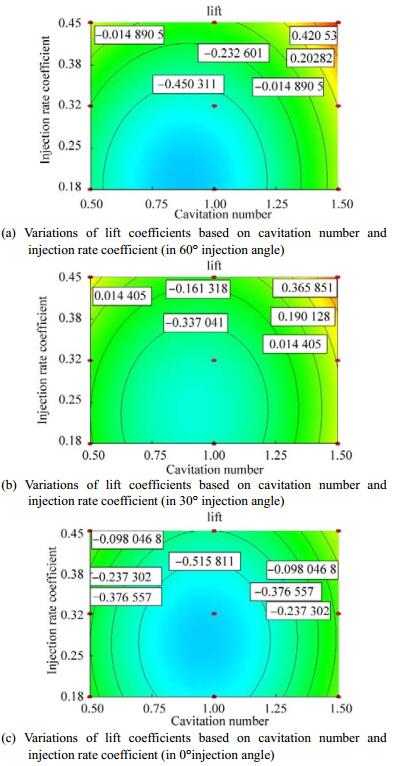
The lift coefficient increases in each of the three cavitation numbers by increasing the injection rate coefficient (Fig. 12). In a high injection rate coefficient, the change in lift coefficient is achieved by increasing the injection angle. Moreover, the lift coefficient increases with the increasing injection rate coefficient and injection angle. A high cavitation number means that the velocity of a low torpedo's change in the extent of lift coefficient according to angle injection and injection rate coefficient has increased intensity, and a low cavitation number means decreased intensity. In this shape, the injection rate coefficient presented in the order of up to down increases more than the other results in this shape. In each cavitation number, the extent of change of the lift coefficient according to cavitation number and injection angle is small. For injection rate coefficients of 18% and 32%, and injection angle of 30° is observed, and the lift coefficient in the extent of change in cavitation number is fixed (Fig. 13). The extent of changes of the lift coefficient in Fig. 14 is in the order of up to down with a decreased injection angle. In this figure, the results indicate that the lift coefficient lines according to cavitation number and injection rate coefficient increase similar to concentric circles.
|
| Figure 12 Variations of lift coefficients according to angle and injection rate coefficient in different cavitation numbers |
|
| Figure 13 Variations of lift coefficients according to cavitation number and injection angle in different degrees of injection rate coefficient |
|
| Figure 14 Variations of lift coefficient based on cavitation number and injection rate coefficient in different degrees of injection angle |
This study uses a test plan to determine the condition operation. Tests examining the operation of the three basic parameters of cavitation number, injection rate coefficient, and injection angle are performed at three levels. The end relation for drag (using the 2FI model) and lift coefficients (using the quadratic model) according to these parameters is attained. Then, the comparison between the calculation amount of these relations with the amount produced from the dramatist correctness relation (with errors less than 4% in the internal solution extent and less than 7% in the external solution extent) is discussed.
The mutual effects of cavitation number, injection rate coefficient, and injection angle on the lift and drag coefficients are in accordance with the relationships of different diagrams. These diagrams enable designers to change the angle and injection rate coefficient in different torpedo velocities (cavitation number) according to their purpose. As indicated in the diagrams, if the injection rate has an angle, it causes a remarkable improvement in decreasing the drag factor. However, in increasing the injection rate, the angle should be decreased to prevent the increase in drag coefficient.
Nomenclature
P∞ Absolute pressure, N/m2
Qg Gas volume flow, m3/s
qg Gas injection rate coefficient
V∞ Reference velocity, m/s2
σc Artificial cavitation number
ρ Water density, kg/m3
D Largest cavity diameter, m
Dn Cavitator diameter, m
L Cavity length, m
Pc Pressure inside the bulb, N/m2
Pv Steam pressure, N/m2
σv Natural cavitation number
| Ahn BK, Lee TK, Kim HT, Lee CS, 2012. Experimental investigation of supercavitating flows. International Journal of Naval Architecture and Ocean Engineering, 4(2), 123–131. DOI:10.3744/JNAOE.2012.4.2.123 |
| Alishahi MM, 2010. The effect of the injected gas at super-gas injection (with the first leak). The Tenth Conference of Iranian Aerospace Society, 5. |
| Baradaran Fard M, Nikseresht AH, 2012. Numerical simulation of unsteady 3D cavitating flows over axisymmetric cavitators. Scientia Iranica, 19(5), 1258–1264. DOI:10.1016/j.scient.2012.07.013 |
| Goel A, 2002. Control strategies for supercavitating vehicles. PhD thesis, University of Florida, Gainesville. |
| Hashem Abadi SH, Dehnavi MA 2011. CFD simulation of multiphase flows with Fluent software. Andishe Sara, 208. |
| Schauer TJ, 2003. An experimental study of a ventilated supercavitating vehicle. PhD thesis, University of Minnesota. |
| Ma C, Jia D, Qian ZF, Feng DH, 2006. Study on cavitation flows of underwater vehicle. Journal of Hydrodynamics, 18(3), 373–377. DOI:10.1016/S1001-6058(06)60081-4 |
| Ji B, Luo XW, Peng XX, Zhang Y, Wu YL, Xu HY, 2010. Numerical investigation of the ventilated cavitating flow around an under-water vehicle based on a three-component cavitation model. Journal of Hydrodynamics, 22(6), 753–759. DOI:10.1016/S1001-6058(09)60113-X |
| Roohi E, Zahiri AP, Passandideh-Fard M, 2013. Numerical simulation of cavitation around a two-dimensional hydrofoil using VOF method and LES turbulence model. Applied Mathematical Modelling, 37(9), 6469–6488. DOI:10.1016/j.apm.2012.09.002 |
| Vlasenko YD, Savchenko GY, 2012. Study of the parameters of a ventilated supercavity closed on a cylindrical body. In: Supercavitation, Springer, 201-214. DOI: 10.1007/978-3-642-23656-3_11 |
| Wei YJ, Cao W, Wang C, Zhang JZ, Zou ZZ, 2009. Experimental research on character of ventilated supercavity. New Trends in Fluid Mechanics Research, Springer, Berlin, Heidelberg, 348-351. DOI: 10.1007/978-3-540-75995-9_108 |
| Yang WG, Zhang YW, Kan L, Deng F, 2009. Experimental investigation on the property of high-speed ventilated supercavitation. New Trends in Fluid Mechanics Research, Springer, Berlin, Heidelberg, 475-478. DOI: 10.1007/978-3-540-75995-9_152 |
| Zhang XW, Wei YJ, Zhang JZ, Wang C, Yu KP, 2007. Experimental research on the shape characters of natural and ventilated supercavitation. Journal of Hydrodynamics, 19(5), 564–571. DOI:10.1016/S1001-6058(07)60154-1 |
| Zou W, Yu KP, Wan XH, 2010. Research on the gas-leakage rate of unsteady ventilated supercavity. Journal of Hydrodynamics, 22(5), 778–783. DOI:10.1016/S1001-6058(10)60030-3 |


