1 Introduction
Considering fossil fuel reserves reduction as well as global warming issues, attention has been paid to renewable energies although their technical and economic aspects still need to be discussed in depth. Recently, wave energy, with an average power density of 8 kW/m, compared to wind or solar sources, with a maximum production capacity of 500 W/m2, has received special attention (Flocard and Finnigan, 2010) although its level of technological readiness needs to be justified. In recent years, numerous scientific and applied research have been performed in this field with the aim to design and optimize devices with an acceptable output. Such devices, in terms of their distance from the coast, are generally categorized into three main groups: shoreline, nearshore, and offshore. Most research had been historically focused on shoreline and offshore devices until Folley and Whittaker (2009) introduced the concept of exploitable wave energy resource. Despite the significant reduction of wave energy nearshore, they discussed that exploitable energy does not vary much if the effects of wave entrance into shallow waters is taken into account (Folley and Whittaker, 2009). According to Xiros and Dhanak (2016), the horizontal speed of water particles sharply increases nearshore and strongly affects the efficiency of surging Wave Energy Converters (WECs). It has been proved in another research both theoretically and experimentally that absorbed energy by a surging device nearshore is directly related to the horizontal wave force rather than the total wave energy (Folley et al., 2007). In addition to the mentioned issues, these types of WECs are less expensive to install and maintain compared to offshore types. Additionally, in contrast to shoreline WECs, they do not suffer from visual and environmental pollutions while benefitting from higher energy levels due to wave breaking. Caska and Finnigan (2008) investigated the hydrodynamic performance of a cylinder hinged to the floor on average depths. Flocard and Finnigan (2010) continued the study with physical models of the cylinder and investigated the effects of damping and diameter on power capture. In the meantime, Whittaker and Folly (2010) brought this idea into practice and created a commercial model of the surging WEC called Oyster. Zhao et al. (2013) of Zhejiang University optimized the density and damping of this device for short-wave sea states with wave periods lower than 6 s. Here it should be noted that that flap-type WEC has been the subject of many theoretical investigations (Renzi and Dias, 2013; Renzi and Dias, 2015a). Besides, it has been discussed with more accurate or recently developed numerical models (Wei et al., 2015; Wei et al., 2016; Wolgamot and Fitzgerald, 2015; Schmitt et al., 2016; Yeylaghi et al., 2016; Tomey-Bozo et al., 2016; Pezzutto, 2016). Also, there are lots of recent works discussing flap-type WEC in a farm (Renzi et al., 2014; Renzi and Dias, 2015b, Gunawardane et al., 2016), its Power Take-Off (PTO) mechanism (Bacelli et al., 2015); its combination with wind energy in turbines (Michailides et al., 2014), its extension over still water level (Kamkar et al., 2013) or its degrees of freedom (Kurniawan and Moan, 2012).
This study presents a simple new methodology to investigate appropriate positioning of the apparatus and its optimized PTO system in the presence of wave rose. The study was performed in the Persian Gulf. The research shows that a slight change in the stiffness of the structure and thereby a change in its natural frequency has a drastic impact on the energy produced by the determined wave spectrum. In addition, determination of PTO damping as well as device heading is inevitable when discussing a real case.
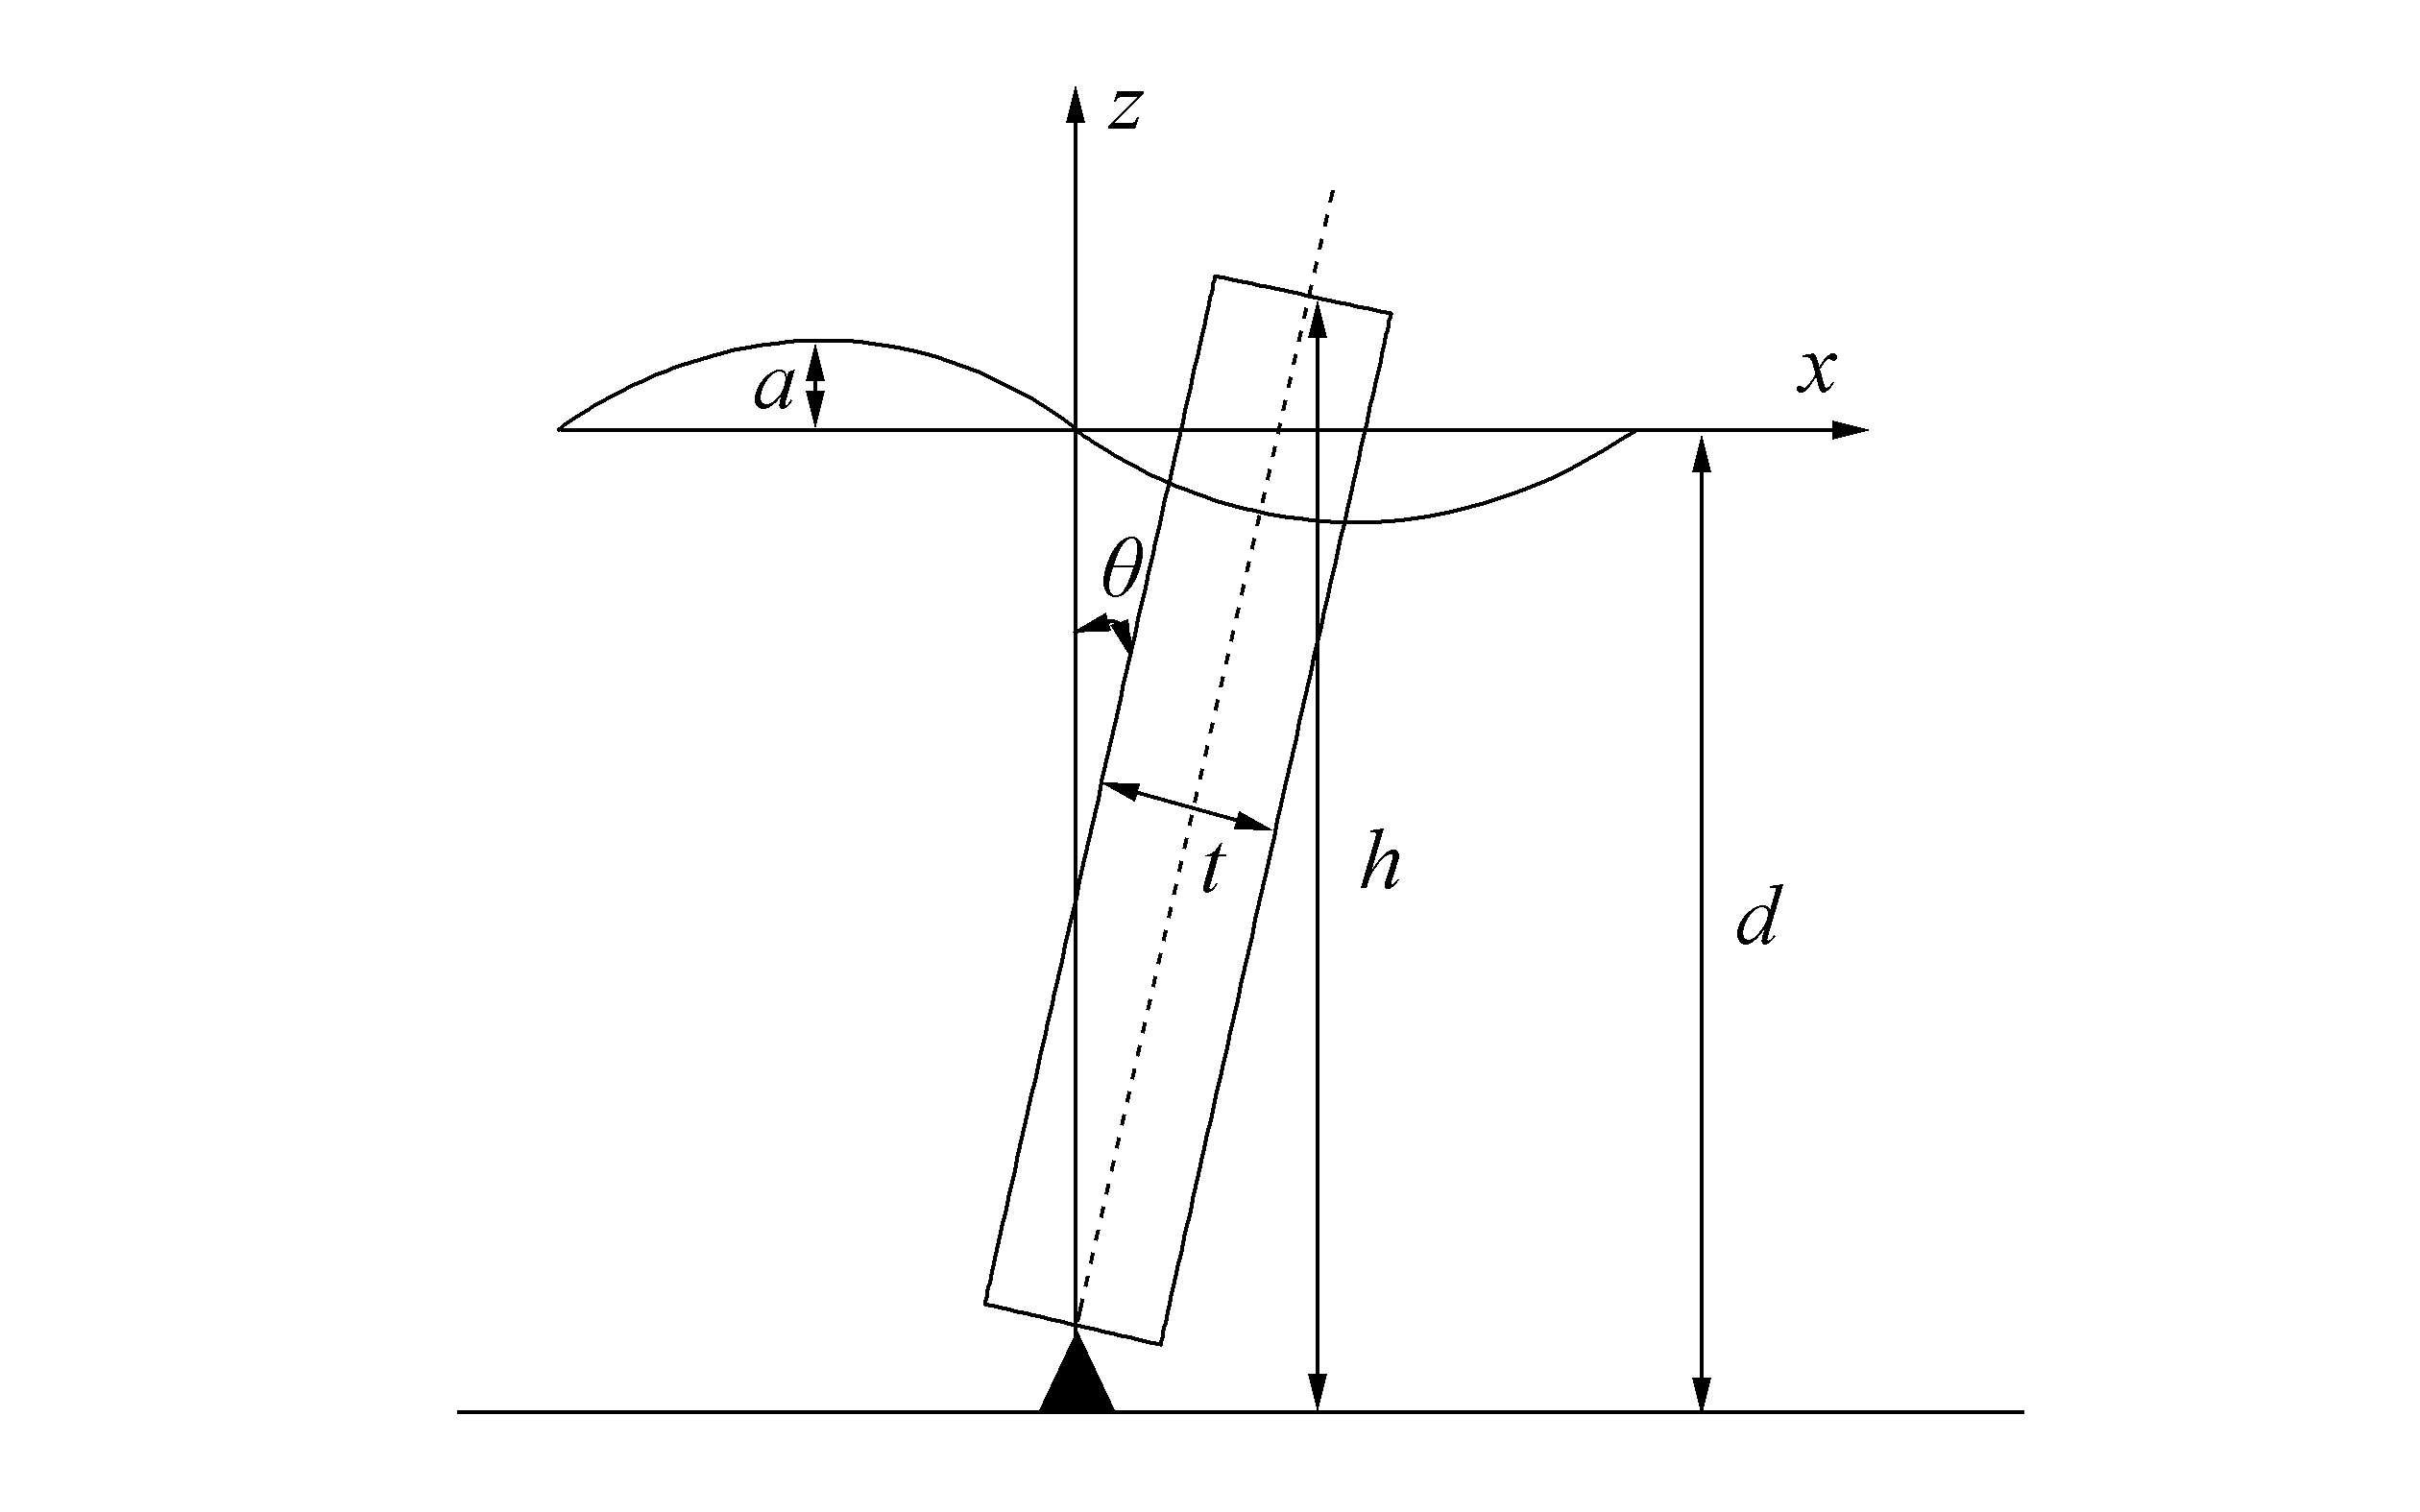
2 Absorbed energy in a paddle-type WECFig. 1 shows the converter's schematic model. The converter is a thin plate with width w, thickness t and height h, oscillating in water with depth d and incoming wave amplitude a. By applying the linear wave theory, the converter begins to oscillate with a frequency equal to the frequency of the incoming wave (ω). The oscillating amplitudes are smaller compared to the converter size. Thus, the effect of viscosity can be neglected. Converter pitching amplitude θ can be calculated with the above assumptions shown in Eq. (1):
|
| Figure 1 Schematic model of a paddle-type converter |
| $ \left[ -{{\omega }^{2}}\left( I+{{I}_{a}} \right)-\text{i}\omega \left( {{c}_{r}}+{{c}_{\text{PTO}}} \right)+K \right]\theta ={{T}_{\text{ex}}} $ | (1) |
where I is the moment of inertia of the flap, Ia is the added moment of inertia, cr is the radiation damping coefficient, cPTO is the linear PTO damping coefficient, K is the pitching stiffness coefficient, and Tex is the excitation moment (Zhao et al., 2013; Xiros and Dhanak, 2016). I and K can be expressed similar to the vertical parallelepiped flap as shown below:
| $ I={{\rho }_{0}}twd\left( {{t}^{2}}+4{{d}^{2}} \right)/12 $ | (2) |
| $ K=\rho g{{t}^{3}}w/12+\left( \rho -{{\rho }_{0}} \right)gtw{{d}^{2}}/2 $ | (3) |
where g is the acceleration of gravity, w is the width of the flap, ρ0 is the density of the flap, and ρ is the density of seawater. Thus, Eq. (1) could be solved to calculate θ for each time step.
It is assumed that the average power absorbed by PTO is equal to the power captured by the converter. Furthermore, Eqs. (4) and (5) calculate for the regular wave and spectrum, respectively (Flocard and Finnigan, 2010):
| $ {{P}_{{{C}_{\text{PTO}}}}}=\frac{1}{2}{{\omega }^{2}}{{\theta }^{2}} $ | (4) |
| $ P=\frac{{{C}_{\text{PTO}}}}{n}\sum\limits_{k=0}^{n}{V_{k}^{2}} $ | (5) |
where θ is the device maximum pitching angle in a regular wave and Vk is the flap rotational velocity at the kth time step.
3 Numerical simulation and validationANSYS-AQWA, which was developed based on the potential flow and diffraction theory (ANSYS-AQWA Brochure, 2015), is used to perform numerical modeling in this study, as it is useful software for similar cases (Amiri et al., 2016). Here, an incompressible, inviscid, and irrotational flow with negligible surface tension is calculated. For simplification, motions and wave heights are assumed smaller in comparison to wavelength. Considering the velocity potential ϕ, u=∇ϕ is calculated as the superposition of incident undisturbed wave potential (ϕI), diffraction potential of waves around the restrained body (ϕD), and radiation potential from the oscillating body in still water (ϕR). Using diffraction theory, potential functions are calculated by solving the Laplace equation and by applying appropriate boundary conditions. The pressure and consequent forces acting on the body are calculated. This results in solving a fluid–structure interaction problem formulated as a boundary value problem.
To ensure validity and to assess accuracy of the model, numerical results are then compared with the physical model (Flocard and Finnigan, 2010).
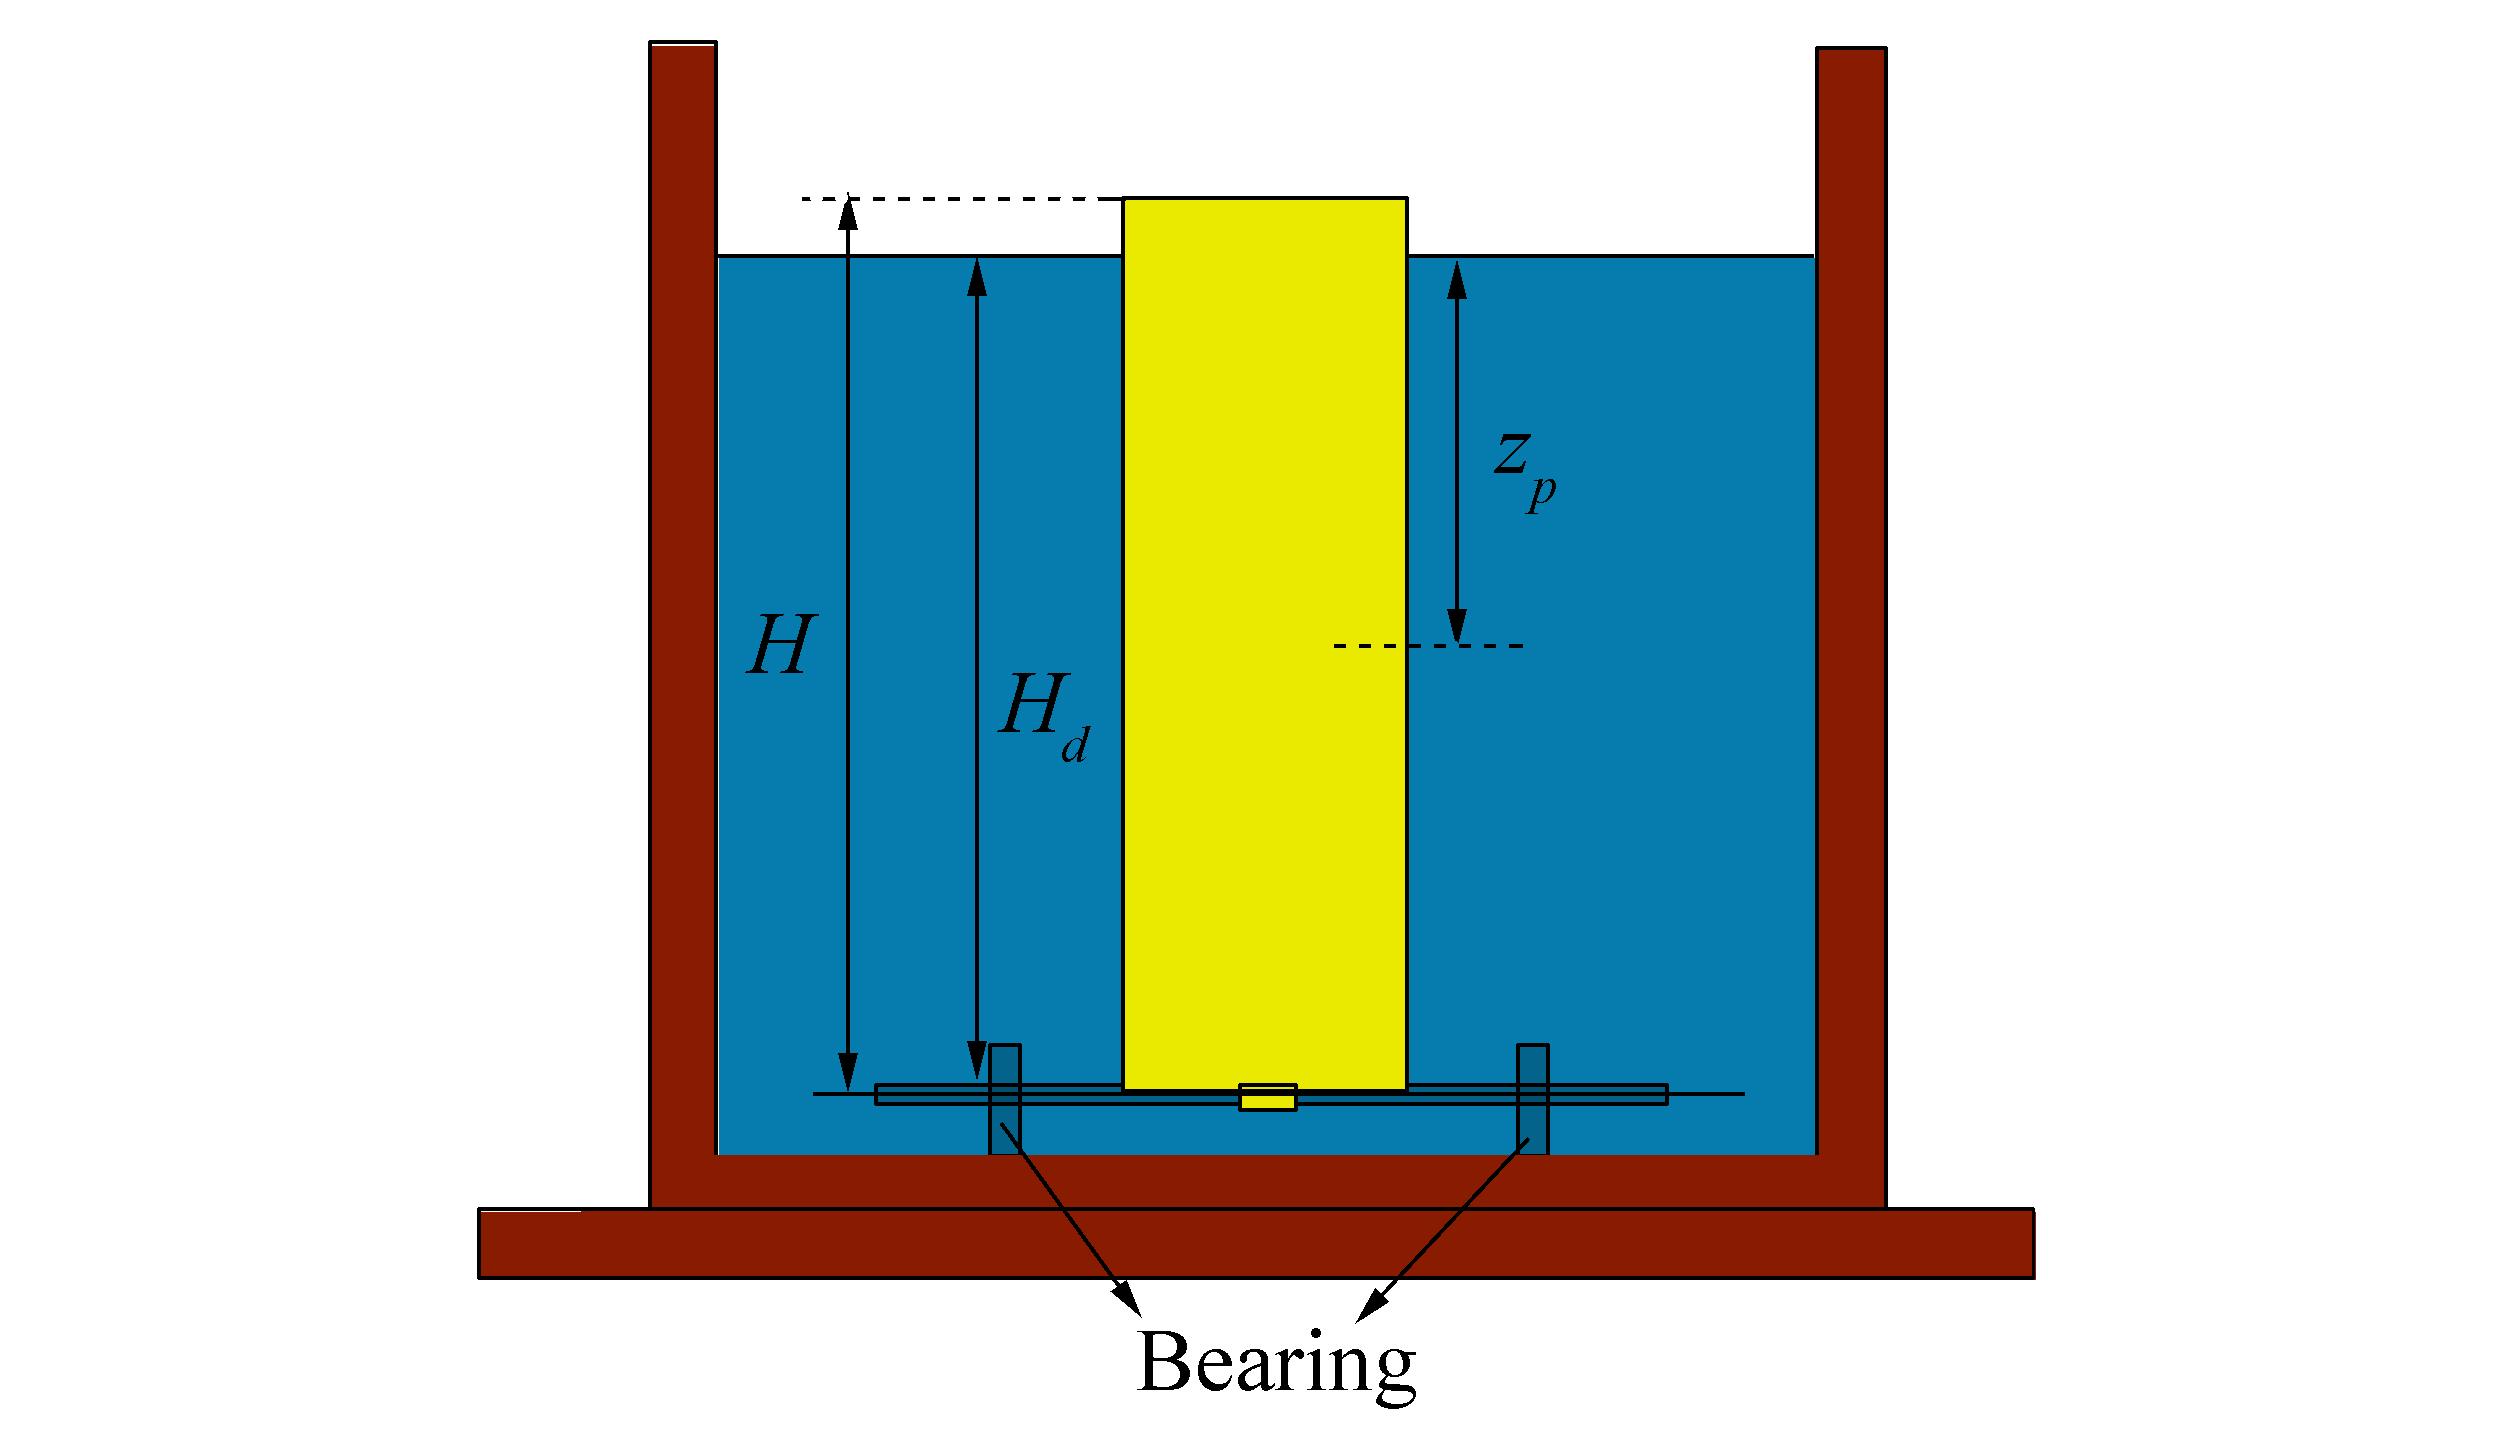
Fig. 2 shows the experimental model comprising a buoyant cylinder hinged to the bottom of the flume by a low-friction shaft that allows pitching along a single direction aligned with the wave direction. Here, a wavemaker, creating regular waves with different amplitudes and periods, is implemented. Installed sensors on the cylinder record displacements and velocities of the device during oscillations. The main characteristics of the cylinder are presented in Table 1.
|
| Figure 2 Front view of the experimental model |
| Diameter D/m | 0.2 |
| Mass m/kg | 4.95 |
| Height H/m | 0.725 |
| Draft Hd/m | 0.665 |
| Center of the mass Zp/m | 0.327 |
| Mass moment of inertia I/(kg·m2) | 1 |
In this paper, the ANSYS geometry module has been used to create the device body. The model has been made of a thin shell to satisfy software requirement; as software can not treat thick plates. The PTO system of the WEC is modeled by a torsion spring to represent oscillating motions as well as a damper to control displacements in resonance conditions. An increase in the maximum element size in domain mesh generation will decrease the maximum threshold of the allowable frequency of a moving object when using the boundary element method. Considering the typical wave rose implemented in this study containing the least wave period of 3 s, the maximum element size of 1 m is applied. Investigating frequencies smaller than 0.5 Hz is then permissible. ANSYS-AQWA calculates the actual response in the time–domain analysis representing device pitching velocity versus time. The average power absorbed by the PTO system is calculated for a regular wave as well as a wave spectrum. For an irregular condition, one should capture enough time to ensure coverage of all frequencies.
Fig. 3 shows the numerical model in ANSYS-AQWA. The movements of the device have been captured in three typical time steps to represent the software working environment.

|
| Figure 3 Typical results of ANSYS-AQWA |
The discussed model has been validated in the three subsections that follow for still water as well as regular waves by assessment of pitch angle and captured power.
3.1 Decay testAccording to the linear theory, a point absorber WEC is expected to to perform at its best close to its natural frequency. Thus, its PTO system should be tuned with respect to the wave condition. The decay test is an approach to calculate the system frequency as presented in this section.
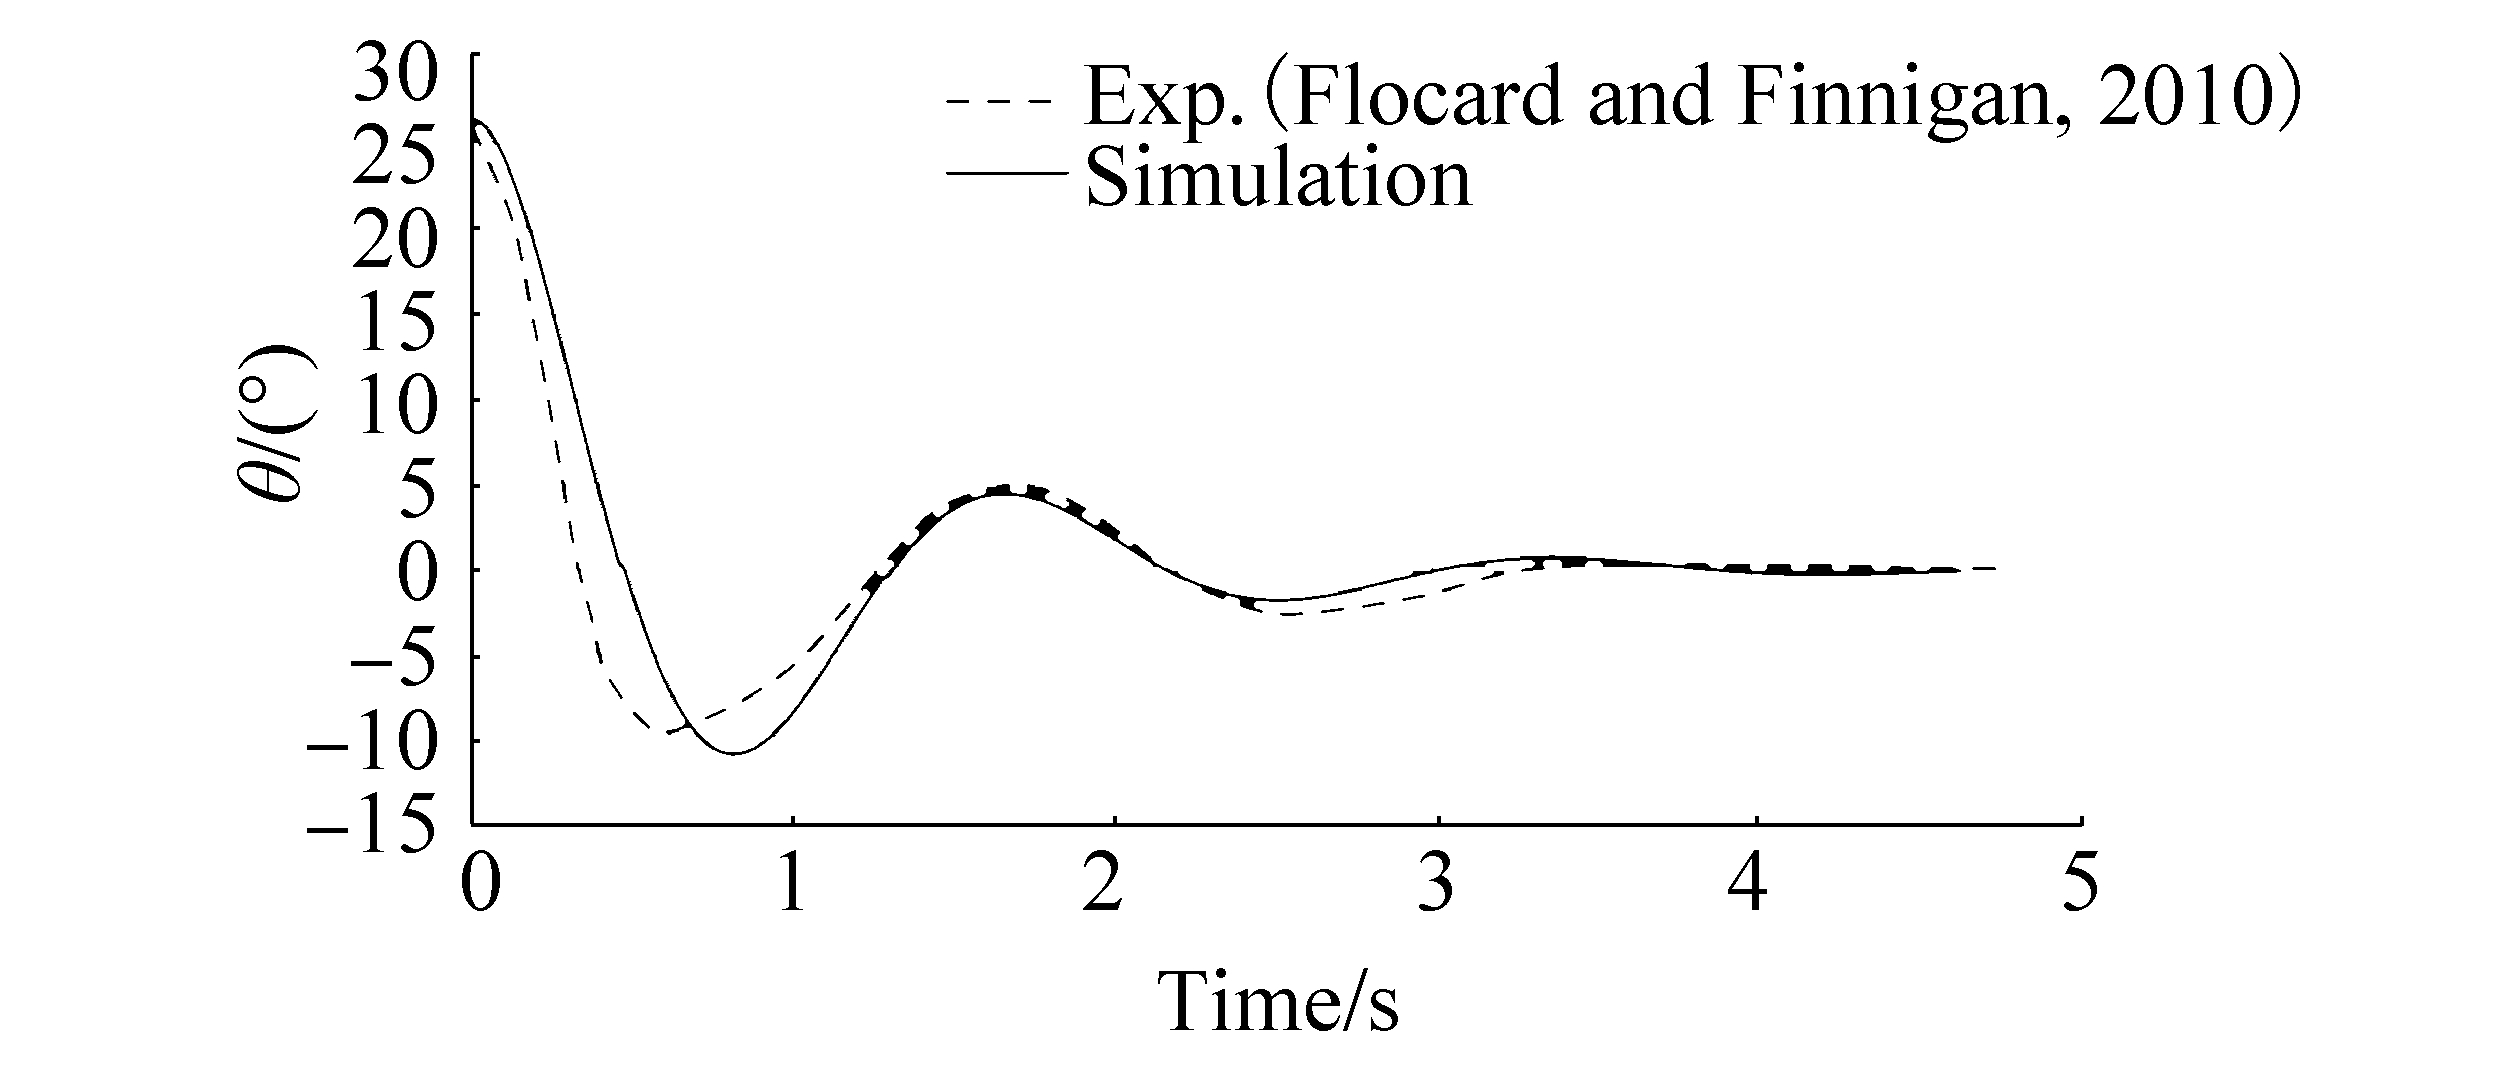
In the experimental model, an initial displacement of 25° has been applied to the cylinder (Flocard and Finningan, 2010) and released for swinging. This free oscillation test is simulated in ANSYS-AQWA by applying a primary force to the cylinder for a short time (0.1 s), which causes the cylinder to initially deviate at about 25°. This simulation approach is implemented due to software limitations in representing the required initial displacement. Fig. 4 shows the cylinder's oscillation time history with stiffness and damping of 1 N·m/rad and 10 N·m·s/rad, respectively.
|
| Figure 4 Assessment of the typical decay test results; time history of pitch angle for the cylinder with 1N·m/rad stiffener and 10 N·m·s/rad damper |
The natural frequency of the device is independent of its primary disturbance; however, the applied force has been chosen such that an approximately similar initial displacement is caused in the numerical model to easily compare the result with the experimental one. Thus, an initial difference between the acceleration of the experimental and numerical models is inevitable. As shown in Fig. 4, the natural period of the simulated device (1.84 s) is 8% higher than that of the physical device (1.69 s). This could be treated as an acceptable difference when using a software with several simplifications.
3.2 Oscillation time historyIn this section, the angular motion of the cylinder with 1 N·m/rad stiffener and 10 N·m·s/rad damper is investigated. By simulating a regular wave with 0.03 m amplitude and 0.96 Hz frequency, the time history of the cylinder motion is extracted (as shown in Fig. 5) together with the experimental data. The cylinder has a large angular motion during simulation. In the meantime, a phase shift exists between the numerical and experimental data.

|
| Figure 5 Time history of cylinder pitching angle with 1N·m/rad stiffener and 10 N·m·s/rad damper in a regular wave with an amplitude of 0.03 m and a frequency of 0.06 Hz |
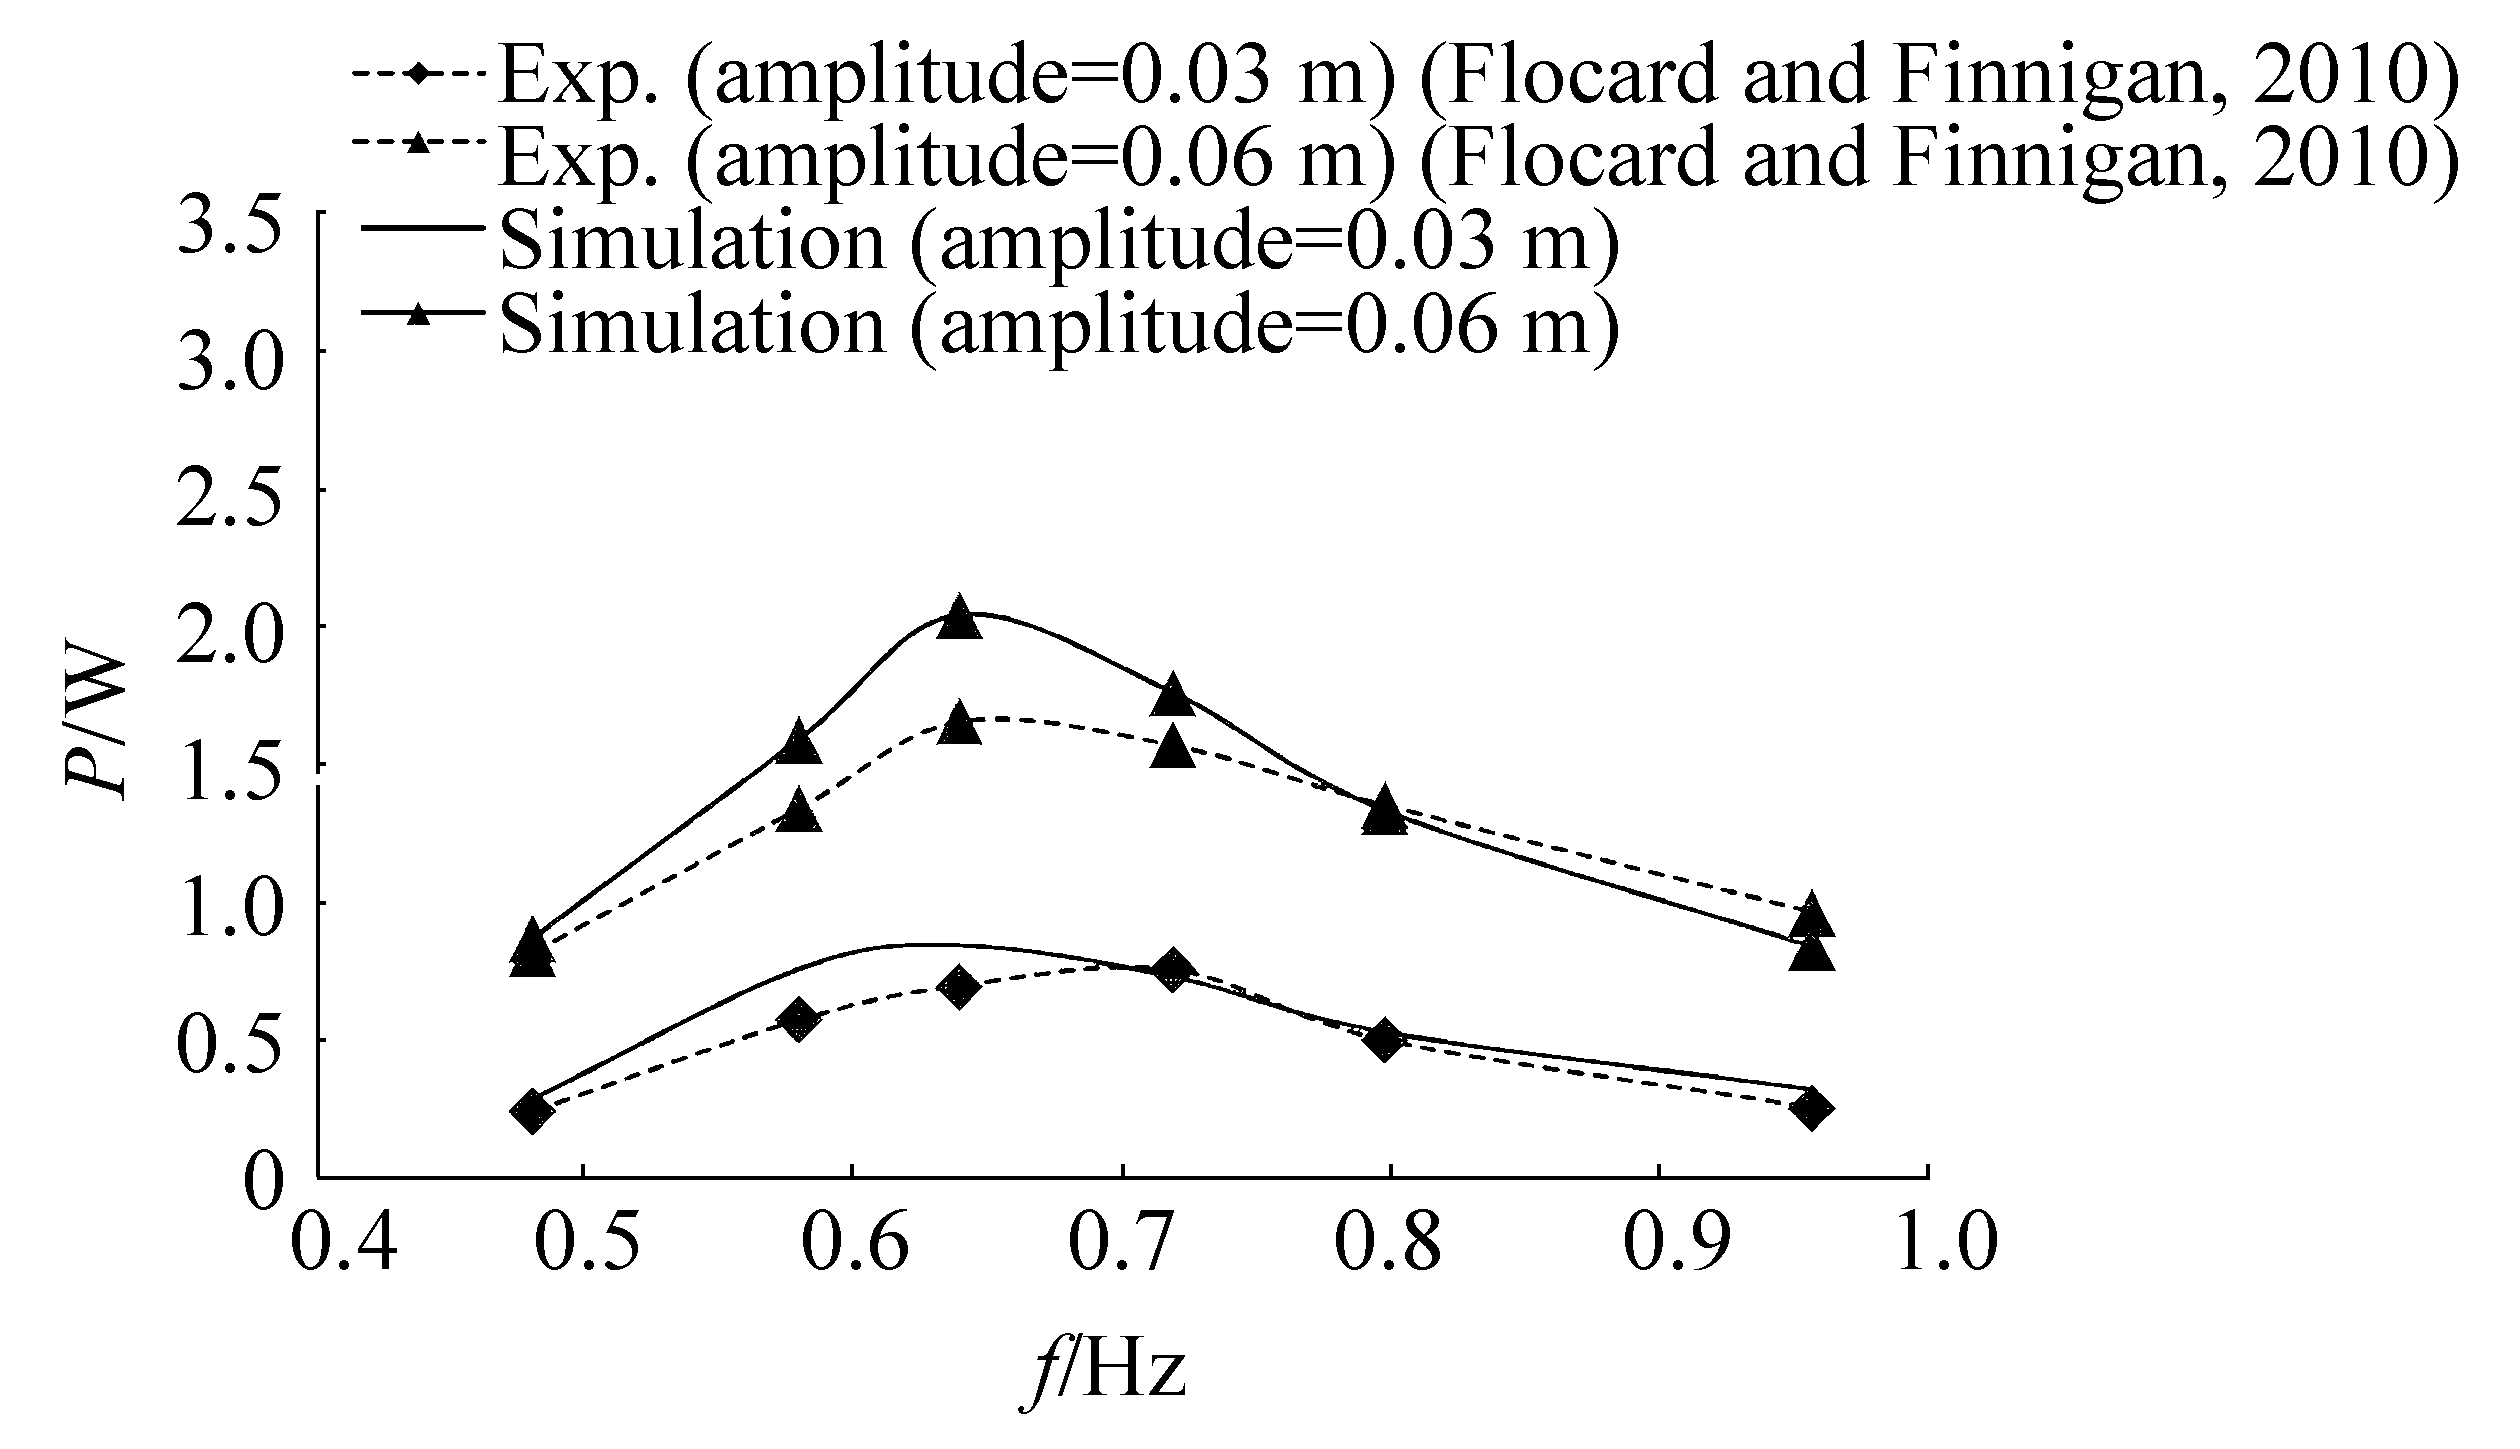
In this simulation series, two waves with amplitudes of 0.03 and 0.06 m have been projected to the cylinder with a stiffness of 1 N·m/rad and a damping of 10 N·m·s/rad at different frequencies with calculation of power. Fig. 6 represents the numerical results together with the experiment. An average error of 18% for the small-wave amplitude and a 12% error for the big-wave amplitude are shown. Additionally, the peak frequency is appropriately predicted for the big-wave amplitude but a shift in the case of the small-wave amplitude is observed.
|
| Figure 6 Comparison of the captured power by the cylinder between numerical and experimental results |
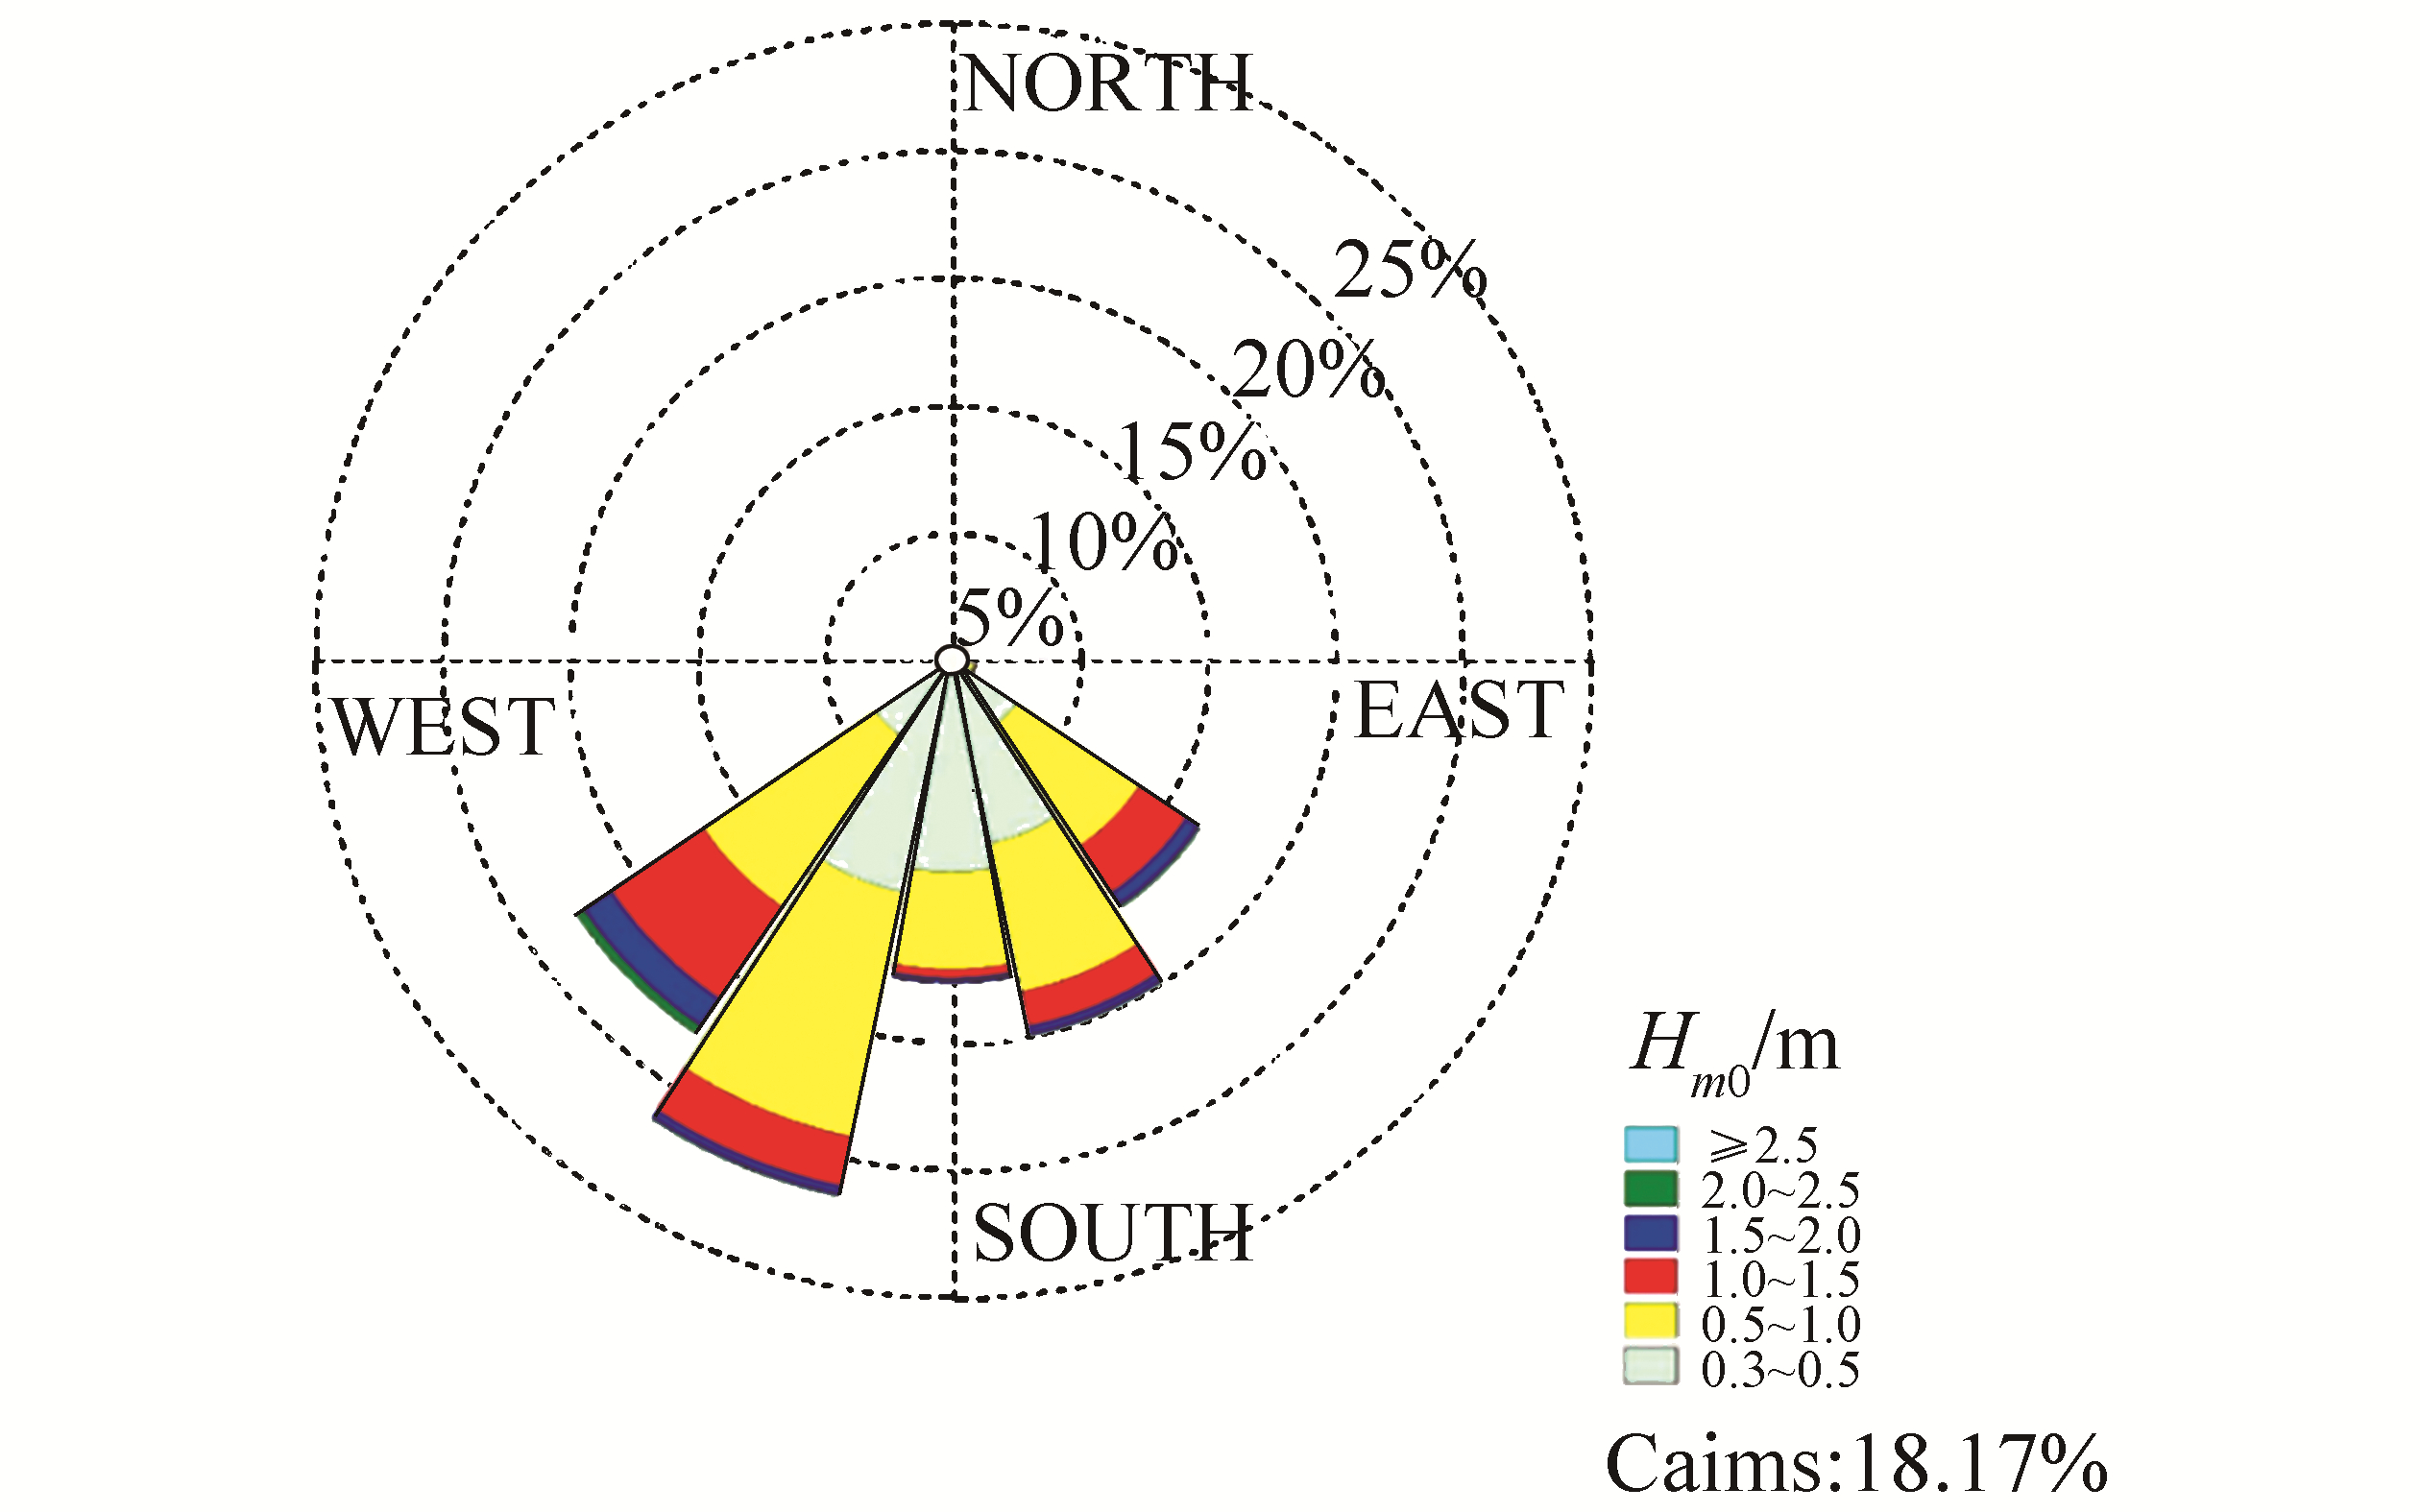
When designing an energy farm, its devices should be calibrated to harness the maximum amount of energy with respect to the environmental condition. This procedure has been represented here. Furthermore, it has been used for a specific location in the Persian Gulf, as shown in Fig. 7. It is located at the east of the Persian Gulf and south of the Hormuz Island with coordinates of (27.143 479, 56.653 061) and depth of 10 m. Additionally, Fig. 8 shows the site's wave rose as a result of area measurement. The recommended dimension for the flap-type WEC is 12 m in height, 20 m wide, and 0.5 m thick.

|
| Figure 7 Location of the site selected for case study |
|
| Figure 8 Wave rose of the site selected for case study |
By assuming constant mass and dimension for this WEC and applying the algorithm presented in Fig. 9, the stiffness, damping, and WEC direction have been investigated and optimized in this section. The algorithm will be implemented step-by-step and discussed in following subsections.

|
| Figure 9 Parametric study and optimization algorithm |
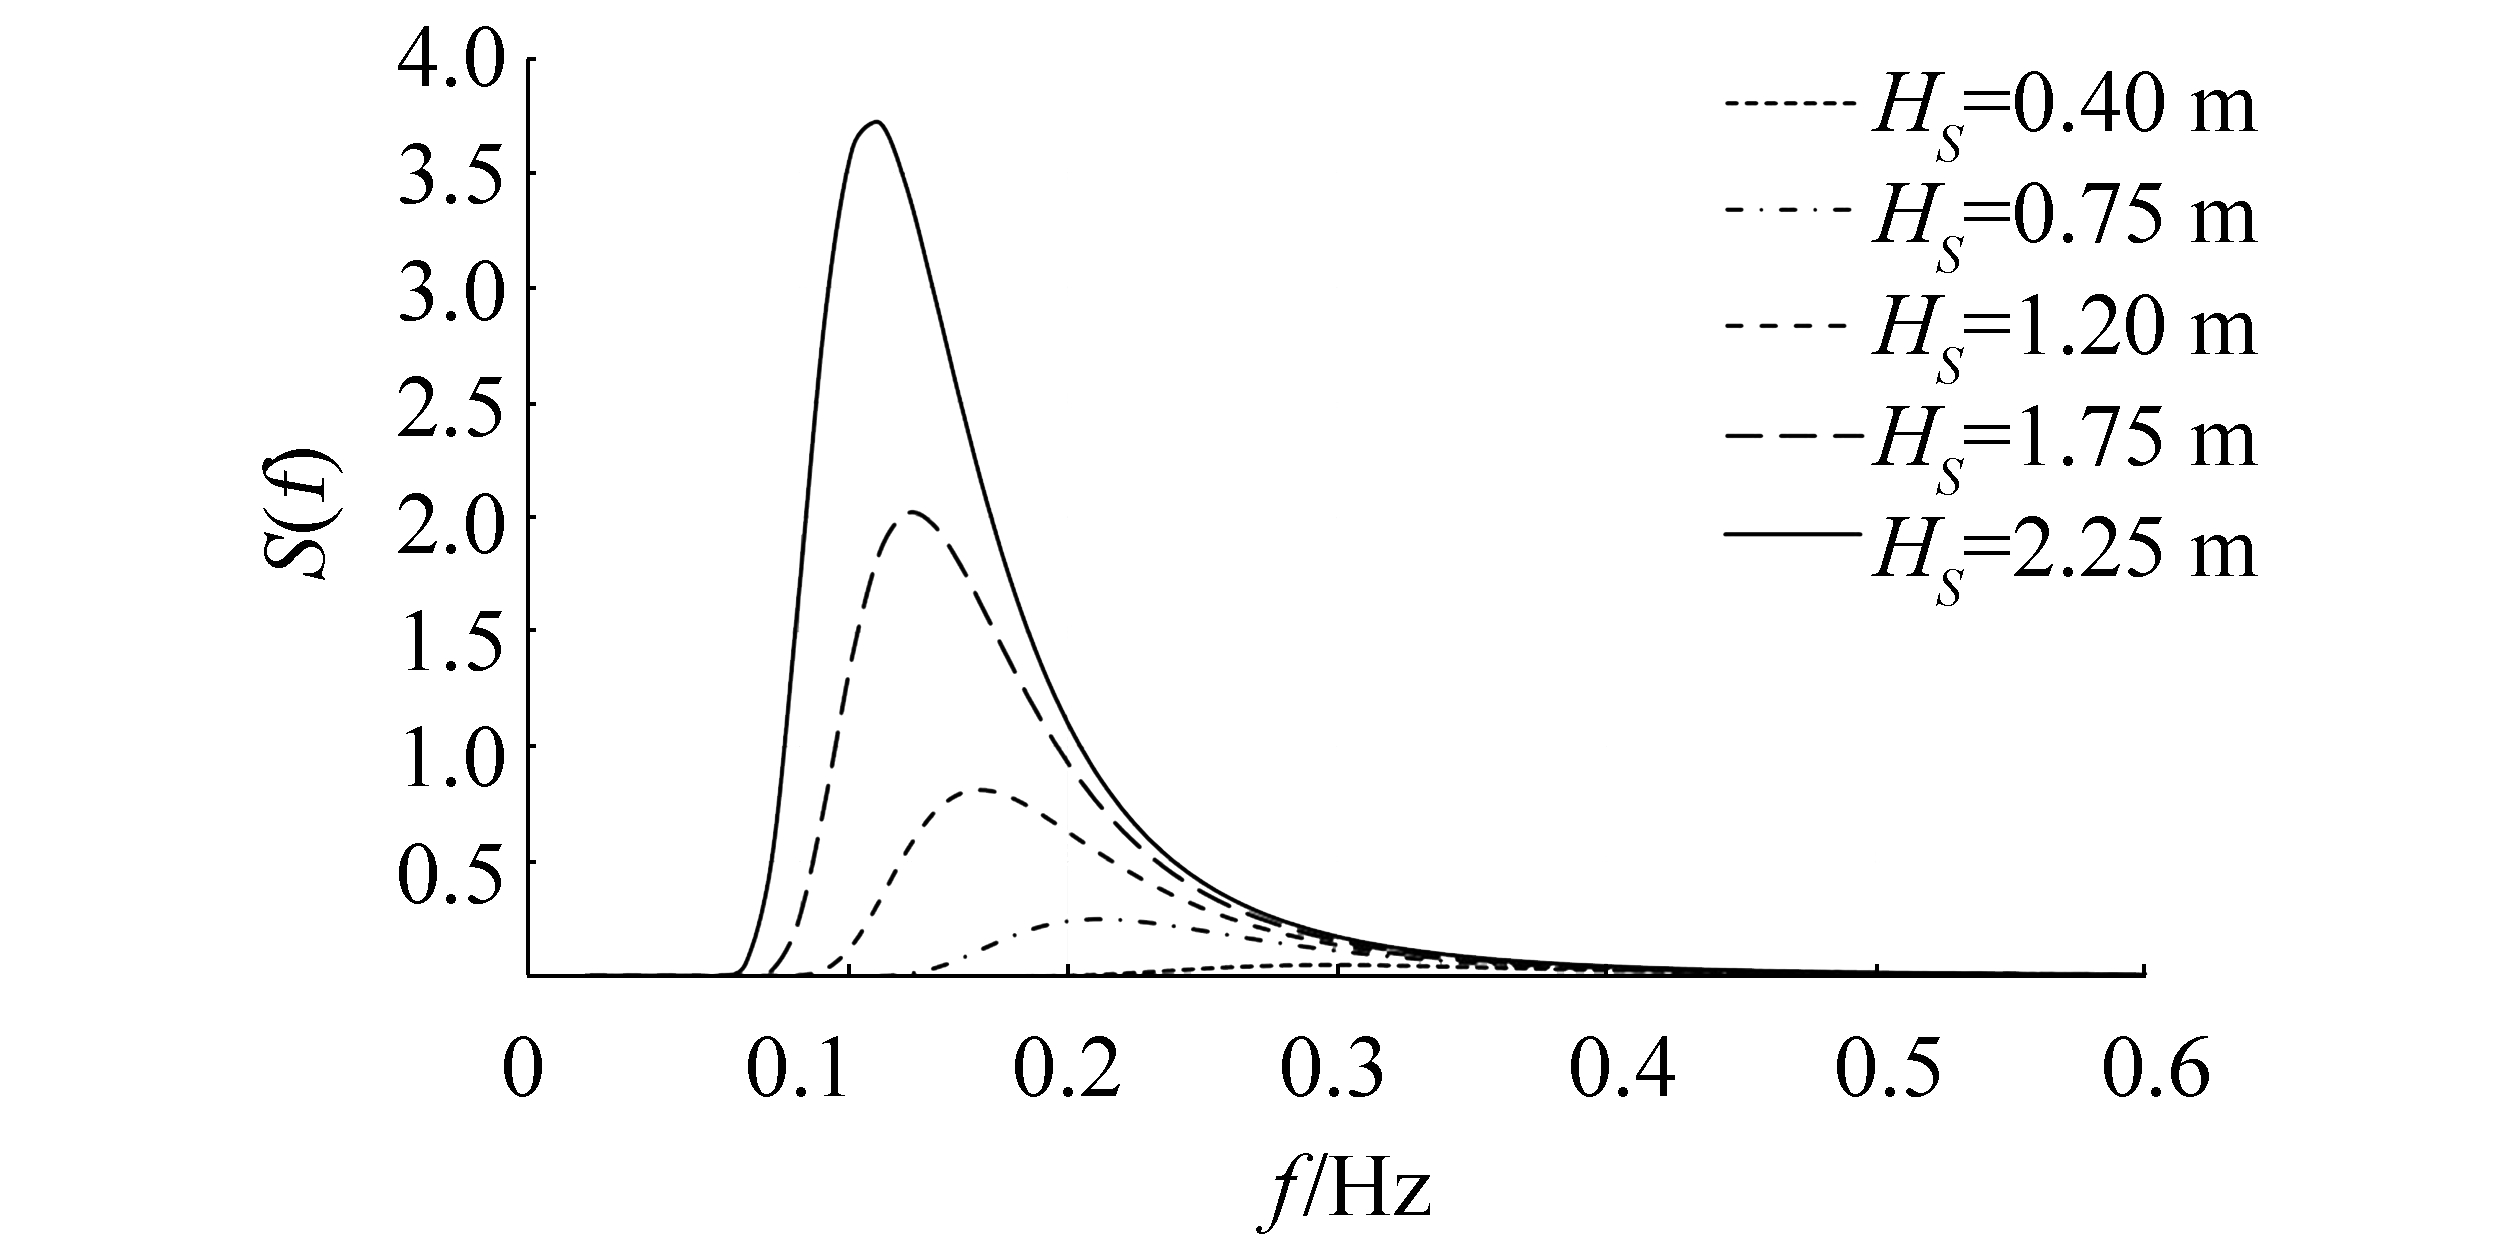
To decompose the discussed wave rose into its spectra, each direction has been investigated to determine its significant wave height as its representative. According to a recent study on this region's wave, an appropriate peak period has been assigned to the aforementioned wave heights. Such main characteristics have been summarized in Table 2. The study also shows that the region's governing spectrum is similar to the International Towing Tank Conference (ITTC) spectrum with modified coefficients (Gharangian et al., 2015). Using Table 2 and modified ITTC spectrum (Eq. (6)), such spectra have been presented in Fig. 10. Here, A and B are modified coefficients for the ITTC spectrum; f is the spectrum frequency.
| $ S\left( f \right)=\frac{A}{{{f}^{5}}}\exp \left( -B/{{f}^{4}} \right) $ | (6) |
| $ A=0.27\frac{H_{s}^{2}}{T_{p}^{4}},B=\frac{1.03}{T_{p}^{4}} $ | (7) |
| Hs/m | 0.4 | 0.75 | 1.2 | 1.75 | 2.25 |
| Tp/s | 3.2 | 4.5 | 5.7 | 6.7 | 7.5 |
|
| Figure 10 Spectra of different sea states |
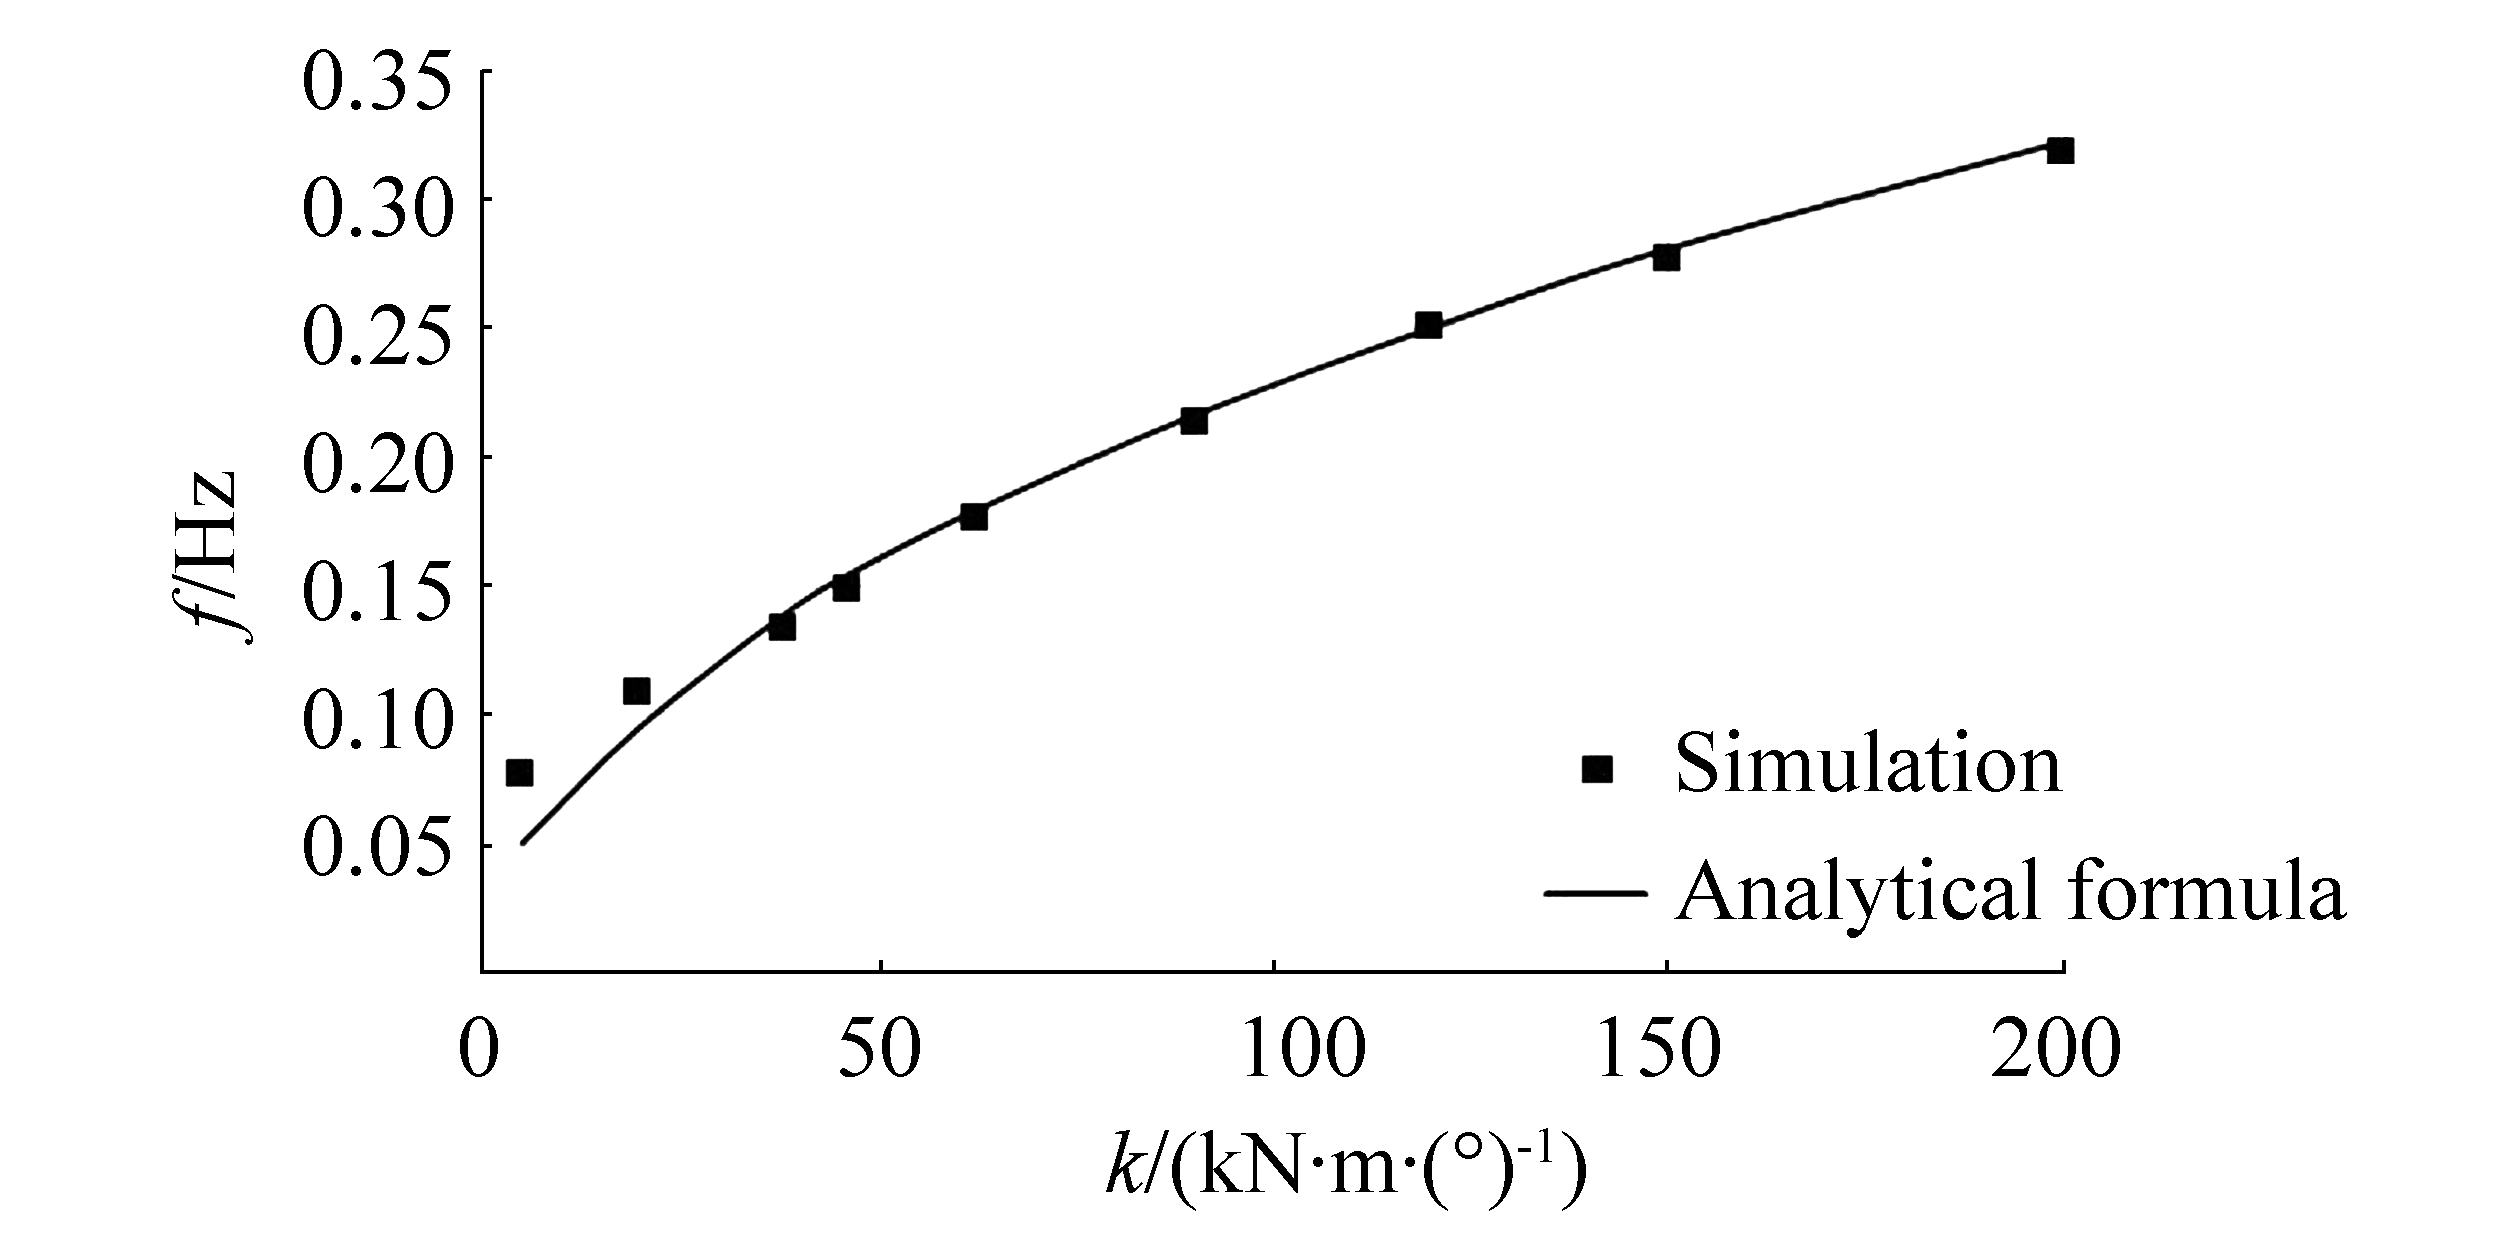
The effect of stiffness on the device's natural frequency is investigated. The device is modeled with different stiffness, a primary force is applied, and it is released for a free oscillation, similar to what was performed in Section 3.1. It is necessary to find the corresponding stiffness for each spectrum's peak frequency considering that the best performance of such WEC happens around its natural frequency.
By repeating the decay test for different stiffness and extracting the natural WEC frequency, extracting stiffness with regard to peak frequencies, as presented in Table 2, becomes possible. On the other hand, it is possible to extract the system stiffness for any frequencies by using
|
| Figure 11 Natural frequency for different stiffness |
In other words, frequencies calculated based on time–histories in numerical simulations coincide with those of the analytical formulation.
4.3 Finding optimized damping for each stiffnessThe five spectra introduced in Section 4.1 are inserted into the optimization procedure. Each of the spectra is projected into the WEC with five stiffnesses. Changing the damping of the system finally results in the optimum damping value for which the maximum power is captured as shown in Fig. 12.

|
| Figure 12 Captured power versus damping for different stiffnesses |
As shown in Eq. (4), the most absorbed power is achieved by maximizing the CPTO·θ2 term. By rewriting Eq. (1), differentiating it with respect to y, and equating it to zero gives Eq. (7), which is the theoretical equation for optimum damping in regular waves:
| $ \begin{align} &{{C}_{\text{PTO}}}=\sqrt{{{\left[ \left( \frac{K}{\omega }-\omega (I-{{I}_{a}} \right) \right]}^{2}}+c_{r}^{2}} \\ & \\ \end{align} $ | (8) |
In resonance, wave frequency (ω) is equal to the natural frequency of the system (ωn). Thus, by replacing ω in Eq. (8) with ωn, the optimum damping will be obtained as follows:
| $ {{C}_{\text{PTO}}}={{c}_{r}} $ | (9) |
Although the equation has been validated for regular wave condition, it has enough accuracy near the peak frequency of the spectrums.
4.4 Directional WEC analysis with sets of stiffness and dampingWith stiffness corresponding to the five peak frequencies of the candidate spectra and damping optimized for each stiffness, waves with certain angles with regard to wave rose are projected to the WEC; the total power is calculated for each set of stiffness and damping.
Fig. 13 shows the total power absorption versus the WEC direction with respect to the south direction. K=90 kN·m/( ) and c=4 000 N·m·s/rad are the best sets for the PTO system; a deviation of 11.5° to the west from the south direction is the best direction for WEC considering the wave rose (see Fig. 14).

|
| Figure 13 Total captured power in different directions and stiffness with related optimized damping |

|
| Figure 14 WEC direction with the most captured power for the specific wave rose |
As a rule of thumb, the optimum direction could be approximately obtained without calculating power. The absorbed power has a direct relationship with the square of the wave height; the optimum direction can be found by calculating the weighted average of the square of the wave rose sections area.
According to the result of this method, a deviation of 8° to the west leads to a maximum power absorption, which validates the result of the first method with an approximately equal amount of deviation. This difference happens because the parametric study has been conducted on finite number of headings with 11.25° intervals as slices of wave rose. However, when one integrates over the wave rose, the best position could be found irrespective of such slices.
5 ConclusionsMaximizing the performance of a WEC is very important when designing one for a real case. This research reported a new method for a real case with a real wave rose to design a bottom-hinged flap-type WEC in terms of its PTO stiffness, damping, and direction. Considering the waves with different directions, height, and period, conducting a similar method to ensure device performance is very important. It is theoretically reasonable to use a similar device with a universal joint rather than a hinged-type joint, although its costs and benefits should be discussed. Furthermore, as the next research step, one should perform this method for a farm because it is generally used in farms. The WEC might have different PTO characteristics as well as different directions in farms.
| Amiri A, Panahi, R, Radfar S, 2016. Parametric study of two-body floating-point wave absorber. Journal of Marine Science and Application, 15(1), 41–49. DOI:10.1007/s11804-016-1342-1 |
| ANSYS-AQWA Brochure, 2015. Proven technology for design and analysis of mobile offshore structures. Available from http://www.ansys.com/-/media/Ansys/corporate/resourcelibrary/brochure/ansys-aqwa-brochure.pdf [Accessed on Feb. 20, 2016]. |
| Bacelli G, Genest R, Ringwood JV, 2015. Nonlinear control of flap-type wave energy converter with a non-ideal power take-off system. Annual Reviews in Control, 40, 116–126. DOI:10.1016/j.arcontrol.2015.09.006 |
| Caska AJ, Finnigan TD, 2008. Hydrodynamic characteristics of a cylindrical bottom-pivoted wave energy absorber. Ocean Engineering, 35(1), 6–16. DOI:10.1016/j.oceaneng.2007.06.006 |
| Flocard F, Finnigan TD, 2010. Laboratory experiments on the power capture of pitching vertical cylinders in waves. Ocean Engineering, 37(11), 989–997. DOI:10.1016/j.oceaneng.2010.03.011 |
| Folley M, Whittaker TJT, 2009. Analysis of the nearshore wave energy resource. Renewable Energy, 34(7), 1709–1715. DOI:10.1016/j.renene.2009.01.003 |
| Folley M, Whittaker TJT, Henry A, 2007. The effect of water depth on the performance of a small surging wave energy converter. Ocean Engineering, 34(8), 1265–1274. DOI:10.1016/j.oceaneng.2006.05.015 |
| Gharangian R, Shafieefar M, Panahi R, 2015. Unidirectional wave spectrum models for Chabahar bay. 16th Marine Industries Conference, Tehran. |
| Gunawardane SP, Kankanamge CJ, Watabe T, 2016. Study on the performance of the??pendulor?? wave energy converter in an array configuration. Energies, 9(4), 282–308. DOI:10.3390/en9040282 |
| Kamkar D, Bhattacharjee J, GuedesSoares C, 2013. Scattering of gravity waves by multiple surface-piercing floating membrane. Applied Ocean Research, 39, 40–52. DOI:10.1016/j.apor.2012.10.001 |
| Kurniawan A, Moan T, 2012. Characteristics of a pitching wave absorber with rotatable flap. Energy Procedia, 20, 134–147. DOI:10.1016/j.egypro.2012.03.015 |
| Michailides C, Luan C, Gao Z, Moan T, 2014. Effect of flap type wave energy convertors on the response of a semi-submersible wind turbine in operational conditions. Proceedings of the ASME 2014 33rd International Conference on Ocean, Offshore and Arctic Engineering, San Francisco, OMAE2014-24065. |
| Pezzutto P, 2016. Extension of 2D second-order irregular waves generation equations to non-continuous wavemaker shapes. Coastal Engineering, 116, 207–219. DOI:10.1016/j.coastaleng.2016.06.007 |
| Renzi E, Abdolali A, Bellotti G, Dias F, 2014. Wave-power absorption from a finite array of oscillating wave surge converters. Renewable Energy, 63, 55–68. DOI:10.1016/j.renene.2013.08.046 |
| Renzi E, Dias F, 2013. Hydrodynamics of the oscillating wave surge converter in the open ocean. European Journal of Mechanics-B/Fluids, 41, 1–10. DOI:10.1016/j.euromechflu.2013.01.007 |
| Renzi E, Dias, F, 2015a. Mathematical modelling of a flap-type wave energy converter. 32ndInternational Conference on Ocean, Offshore and Arctic Engineering, Nantes, OMAE2013-10215. |
| Renzi E, Dias F, 2015b. Relations for a periodic array of flap-type wave energy converters. Applied Ocean Research, 39, 31–39. DOI:10.1016/j.apor.2012.09.002 |
| Schmitt P, Asmuth H, Elsäßer B, 2016. Optimizing power take-off of an oscillating wave surge converter using high fidelity numerical simulations. International Journal of Marine Energy, 16, 196–208. DOI:10.1016/j.ijome.2016.07.006 |
| Tomey-Bozo N, Murphy J, Lewis T, TrochP, Thomas G, 2016. Flap type wave energy converter modelling into a time-dependent mild-slope equation model. Proceeding of the 2nd International Conference on Renewable Energies Offshore, Lisbon, 277-284. |
| Wei Y, Rafiee A, Henry A, Dias F, 2015. Wave interaction with an oscillating wave surge converter, Part Ⅰ:Viscous effects. Ocean Engineering, 104, 185–203. DOI:10.1016/j.oceaneng.2015.05.002 |
| Wei Y, Rafiee A, Henry A, Dias F, 2016. Wave interaction with an oscillating wave surge converter, Part Ⅱ:slamming. Ocean Engineering, 113, 319–334. DOI:10.1016/j.oceaneng.2015.12.041 |
| Whittaker T, Folley M, 2010. Optimisation of wave power devices towards economic wave power systems. Proceedings of the World Renewable Energy Congress, Aberdeen. |
| Wolgamot HA, Fitzgerald CJ, 2015. Nonlinear hydrodynamic and real fluid effects on wave energy converters. Proceedings of the Institution of Mechanical Engineers Part A Journal of Power and Energy, 229(7), 772–794. DOI:10.1177/0957650915570351 |
| Xiros NI, Dhanak MR, 2016. Ocean Wave Energy Conversion Concepts. In: Xiros NI, Dhanak MR (Eds. ). Springer Handbook of Ocean Engineering. Springer-Verlag, Berlin Heidelberg, 1117-1146. |
| Yeylaghi S, Moa B, Oshkai P, Buckham B, Crawford C, 2016. ISPH modelling of an oscillating wave surge converter using an OpenMP-based parallel approach. Journal of Ocean Engineering and Marine Energy, 2(3), 301–312. DOI:10.1007/s40722-016-0053-7 |
| Zhao H, Sun ZL, Hao CL, Shen JF, 2013. Numerical modeling on hydrodynamic performance of a bottom-hinged flap wave energy converter. China Ocean Engineering, 27(1), 73–86. DOI:10.1007/s13344-013-0007-y |


