2. Department of Mechanical Engineering, Universiti Teknologi PETRONAS, Bandar Seri Iskandar, 32610, Perak Darul Ridzuan, Malaysia
1 Introduction
Submarine pipelines are widely used for oil and gas transportation in offshore engineering. Some significant factors, such as hydrodynamic forces on the pipe surface, play an important role in offshore pipeline design. These forces can be mainly expressed in two parts: lift force, which is the perpendicular force to the flow direction, and drag force, which is the in-line force in the flow direction. These forces are subject to change frequently and oscillate around an average value because of the presence of vorticity on the downstream side of the pipe. Vortex shedding in the free spanning sections may cause vortex-induced vibrations (VIV), which are known as the main reason for offshore pipeline failure. To investigate the unsteady nature of the hydrodynamic force and examine the effect of VIV on pipeline failure, an accurate simulation of the flow pattern around the pipe is necessary.
In recent decades, many studies have been conducted to numerically simulate flow patterns and eddies of an isolated pipe exposed to turbulent flow (e.g., in Ai et al., 2013; Namazi-Saleh et al., 2014). However, the simulation of the flow pattern over a pipeline placed near the seabed and exposed to unsteady turbulent flow was conducted by only a few numerical studies. To consider the effect of bed vicinity, the flow pattern for this condition should be simulated accurately. As mentioned in (Gao et al., 2006; Ong et al., 2010), this simulation is affected by a number of parameters, mainly the following: 1) the effect of bed vicinity, which is shown in terms of the gap ratio (h/D), where h is the value of the gap and D is the cylinder diameter; 2) the ratio of boundary layer thickness to pipe diameter (δ/D); and 3) the Reynolds number expressed as Re=u0D/ϑ, where u0 is the free-stream velocity and ϑ is the kinematic viscosity. Normally, offshore pipelines are exposed to flow with a high Reynolds number (1×10⁴−1×10⁶), and they cover sub-critical flow (300 < Re < 2×10⁵) to trans-critical flow (Re=3.6×10⁶). Therefore, the high Reynolds number is examined in this study.
Some valuable experimental efforts have been conducted to investigate the effect of the above-mentioned factors on the behavior of a pipeline placed near the seabed exposed to unsteady turbulent flow. Roshko et al. (1975), and Kiya (1968) studied the variation of the drag coefficient in a pipe near a rigid bed caused by the change in gap ratios at Reynolds numbers of 1×10⁴and 4×10⁴ respectively. They concluded that the value of the drag coefficient increases when the gap ratio increases. However, with certain criteria, the drag coefficient remains constant. Kiya (1968), stated that for h/D=0.4−0.5 the drag coefficient remains stable, whereas Roshko et al., 1975, showed that this ratio is directly related to the thickness of the approaching boundary layer. However, Buresti and Launaro (1980), did not confirm the suggested value of h/D stated by Roshko et al. (1975). An experimental investigation on the lift coefficient done by Jensen et al. (1990) showed that the coefficient of the lift force mainly depends on the approaching boundary layer and the gap ratio. For instance, in the case of a pipe exposed to shear-free flow, the lift coefficient decreases when the gap ratio increases. Further, the authors experimentally explored the variation of the gap ratio in the value of the mean drag and lift coefficients at a Reynolds number of 1×10⁴. They confirmed the findings given by Kiya (1968) stated earlier.
The advantage of using a numerical modeling that employs the computational fluid dynamic approaches over experimental studies for the simulation of flow around a cylindrical body has been widely recognized. Note that although this type of simulation can easily provide all flow characteristics, the numerical approximations strongly depend on the correct simulation in the computational domain. Lee et al.(1994) and Li et al.(1997) simulate the turbulent flow at Re=45000 around a pipe in the vicinity of a rigid bed, which employs incompressible Navier-Stokes (NS) equations using the Smagorinsky Subgrid Scale (SGS). In this scale, the first effort represents a finite difference solution and the other presents a finite element solution. In both studies, the accuracy of the numerical results was verified by performing a qualitative comparison with the measurements reported by Bearman and Zdravkovich (1978). However, the suppression of the vortex shedding induced by the bed proximity was not addressed. Lei et al. (2000) investigated the simulation of vortex shedding over a pipeline in proximity of a wall at different gap ratios and Reynolds number, i.e., Re=80−1000. They employed the pressure Poisson equation and the 2D NS equations and solved them using the finite difference method. The obtained numerical results revealed that the lift force decreases as the gap ratio decreases. Liang and Cheng (2005) reported the results of a 2D numerical simulation of a steady flow around a circular cylinder placed at a diameter of 0.37 above a flatbed. The governing equations were solved on the basis of the finite difference method, and the performance of various turbulence models (k-ε, k-ω, and SGS models) were studied. The drag and lift coefficients were calculated to examine the dependence of the turbulence model on the used computational mesh. The SGS model was depicted using the predicted velocities. k-ε and k-ω could simulate the time averaged velocity and hydrodynamic pressure reasonably well regardless of the computational mesh. Kazeminezhad et al. (2010) also investigated the effect of 2D numerical modeling using Reynolds-averaged NS equations and the standard k-ε turbulence model for simulation of fluid flow around a pipe near a rigid seabed. The results agreed with the experimental data. The result showed that the vortex shedding formation was slightly affected by the gap ratio, and the root mean square of the lift coefficient, and the mean lift and drag force coefficients were involved by the gap ratio.
Ong et al. (2010) conducted a numerical simulation of flow passing a circular cylinder near a flat seabed subjected to Re=0.5×10⁶−4×10⁶ using the standard high Reynolds approach and k-ε turbulence model. The results showed better accuracy than that in the experimental reports. The interaction of the bed shear layer with the top and bottom shear layers of the cylinder is the main cause of the formation or suppression of the vortex shedding. Furthermore, the vortex shedding is formed when the gap exceeds the critical gap. This vortex shedding develops by increasing the gap and eventually becomes similar to an isolated cylinder.
The current study aimed at numerically modeling flow around a circular cylinder near a flatbed using the Galerkin finite volume method and the large eddy simulation. For this reason, the unstructured triangular grids were employed to discretize the computational domain. The main advantage of unstructured grids is their outstanding ability to discretize domains with a complex shape. The simulation was performed at different Reynolds numbers, including
The incompressible NS equations (density constant) are used to model the flow field around a horizontal pipe, which can be written as follows:
| $\frac{{\partial {u_i}}}{{\partial {x_i}}} = 0$ | (1) |
| $\frac{\partial {{\boldsymbol{u}}_{i}}}{\partial t}+{{\boldsymbol{u}}_{j}}\frac{\partial {{\boldsymbol{u}}_{i}}}{\partial {{\boldsymbol{x}}_{j}}}=-\frac{1}{\rho }\frac{\partial \boldsymbol{p}}{\partial {{\boldsymbol{x}}_{i}}}+\vartheta \frac{\partial }{\partial {{\boldsymbol{x}}_{j}}}\left(\frac{\partial {{\boldsymbol{u}}_{i}}}{\partial {{\boldsymbol{x}}_{j}}}+\frac{\partial {{u}_{j}}}{\partial {{\boldsymbol{x}}_{i}}} \right)-\frac{\partial \overline{\overset{\acute{\ }}{\mathop{{{\boldsymbol{u}}_{i}}}}\, \overset{\acute{\ }}{\mathop{{{\boldsymbol{u}}_{j}}}}\, }}{\partial {{\boldsymbol{x}}_{j}}}$ | (2) |
where
| $-\overline{\overset{\acute{\ }}{\mathop{{{\boldsymbol{u}}_{i}}}}\, \overset{\acute{\ }}{\mathop{{{\boldsymbol{\boldsymbol{u}}}_{j}}}}\, }={{\vartheta }_{t}}\left(\frac{\partial {{\boldsymbol{u}}_{i}}}{\partial {{x}_{j}}}+\frac{\partial {{\boldsymbol{u}}_{j}}}{\partial {{x}_{i}}} \right)-\frac{2}{3}k{{\delta }_{ij\text{ }\!\!~\!\!\text{ }}}$ | (3) |
where k is the dimensionless turbulent kinetic energy and
| ${{\vartheta }_{SGS}}={{\left({{C}_{s}}\Delta \right)}^{2}}{{\left[ 1/2\overline{{{\boldsymbol{s}}_{ij}}}\text{ }\!\!~\!\!\text{ }\overline{{{\boldsymbol{s}}_{ij}}} \right]}^{1/2}}$ | (4) |
| $\overline{{{\boldsymbol{s}}_{ij}}}=1/2\left(\partial {{\boldsymbol{u}}_{i}}/\partial {{\boldsymbol{x}}_{j}}+\partial {{\boldsymbol{u}}_{j}}/\partial {{\boldsymbol{x}}_{i}} \right)$ | (5) |
The SGS model is utilized in the definition of
Conservation of the mass and momentum equations, in conjunction with the SGS turbulence model, is solved using the Galerkin finite volume method. The absence of time derivative of density (or pressure) in incompressible mass equation caused difficulty in a couple of solution in the NS equation. The artificial compressibility method proposed by Chorin (1967), is used in this study to overcome this difficulty by adding the
| $\boldsymbol{\mathit{\Gamma }}\frac{W_{i}^{m+1}-W_{i}^{m}}{\Delta \tau }+\boldsymbol{\kappa }\frac{3\boldsymbol{W}_{i}^{m+1}-4\boldsymbol{W}_{i}^{n}+\boldsymbol{W}_{i}^{n-1}}{2\Delta t}+Rez\left(\boldsymbol{W} \right)_{i}^{m+1}=0$ | (6) |
| $\boldsymbol{\mathit{\Gamma }}=\text{diag}\left[ \begin{matrix} 1/{{\beta }^{2}}&1&1 \\ \end{matrix} \right], \boldsymbol{\kappa} =diag\left[ \begin{matrix} 0&1&1 \\ \end{matrix} \right]$ |
where Wi represents conserved variables at the center of control volume i, (
| $\begin{align} &Rez\left(\boldsymbol{W} \right)=\frac{1}{\Omega }\left[ \sum\nolimits_{k=1}^{{{N}_{face}}}{\left[ \overline{{{F}_{c}}}\left(\Delta y \right)-\overline{{{\boldsymbol{H}}_{c}}}\left(\Delta x \right) \right]} \right]+~ \\ &+~~~\frac{1}{A}\left[ \sum\nolimits_{k=1}^{{{N}_{celle}}}{\left[ \overline{{{\boldsymbol{F}}_{d}}}\left(\Delta y \right)-\overline{{{\boldsymbol{H}}_{d}}}\left(\Delta x \right) \right]} \right] \end{align}$ | (7) |
where
| $\overline{{{\boldsymbol{F}}_{c}}}=\left[ \begin{matrix} {{{\bar{\boldsymbol{u}}}}_{i}} \\ \bar{\boldsymbol{u}}_{i}^{2}+{{\boldsymbol{p}}_{i}} \\ {{{\bar{\boldsymbol{u}}}}_{i}}.{{{\bar{\boldsymbol{v}}}}_{i}} \\ \end{matrix} \right], ~~~~~~~~~\overline{{{\boldsymbol{H}}_{c}}}=\left[ \begin{matrix} {{{\bar{\boldsymbol{v}}}}_{i}} \\ \bar{\boldsymbol{v}}_{i}^{2}+{{\boldsymbol{p}}_{i}} \\ {{{\bar{\boldsymbol{v}}}}_{i}}.{{{\bar{\boldsymbol{u}}}}_{i}} \\ \end{matrix} \right]$ |
| $\overline{{{\boldsymbol{F}}_{d}}}=\left[ \begin{matrix} 0 \\ \vartheta \Delta \bar{\boldsymbol{u}}/\Delta \boldsymbol{x} \\ \vartheta \Delta \bar{\boldsymbol{v}}/\Delta \boldsymbol{x} \\ \end{matrix} \right], ~~~~~~~\overline{{{\boldsymbol{H}}_{d}}}=\left[ \begin{matrix} 0 \\ \vartheta \Delta \bar{\boldsymbol{u}}/\Delta \boldsymbol{y} \\ \vartheta \Delta \bar{\boldsymbol{v}}/\Delta \boldsymbol{y} \\ \end{matrix} \right]$ |
Ω is the control volume of node i and A is the area of a triangular cell.
In all the equations, parameter τ denotes the pseudo time, which is used for sub-iterations steps. When
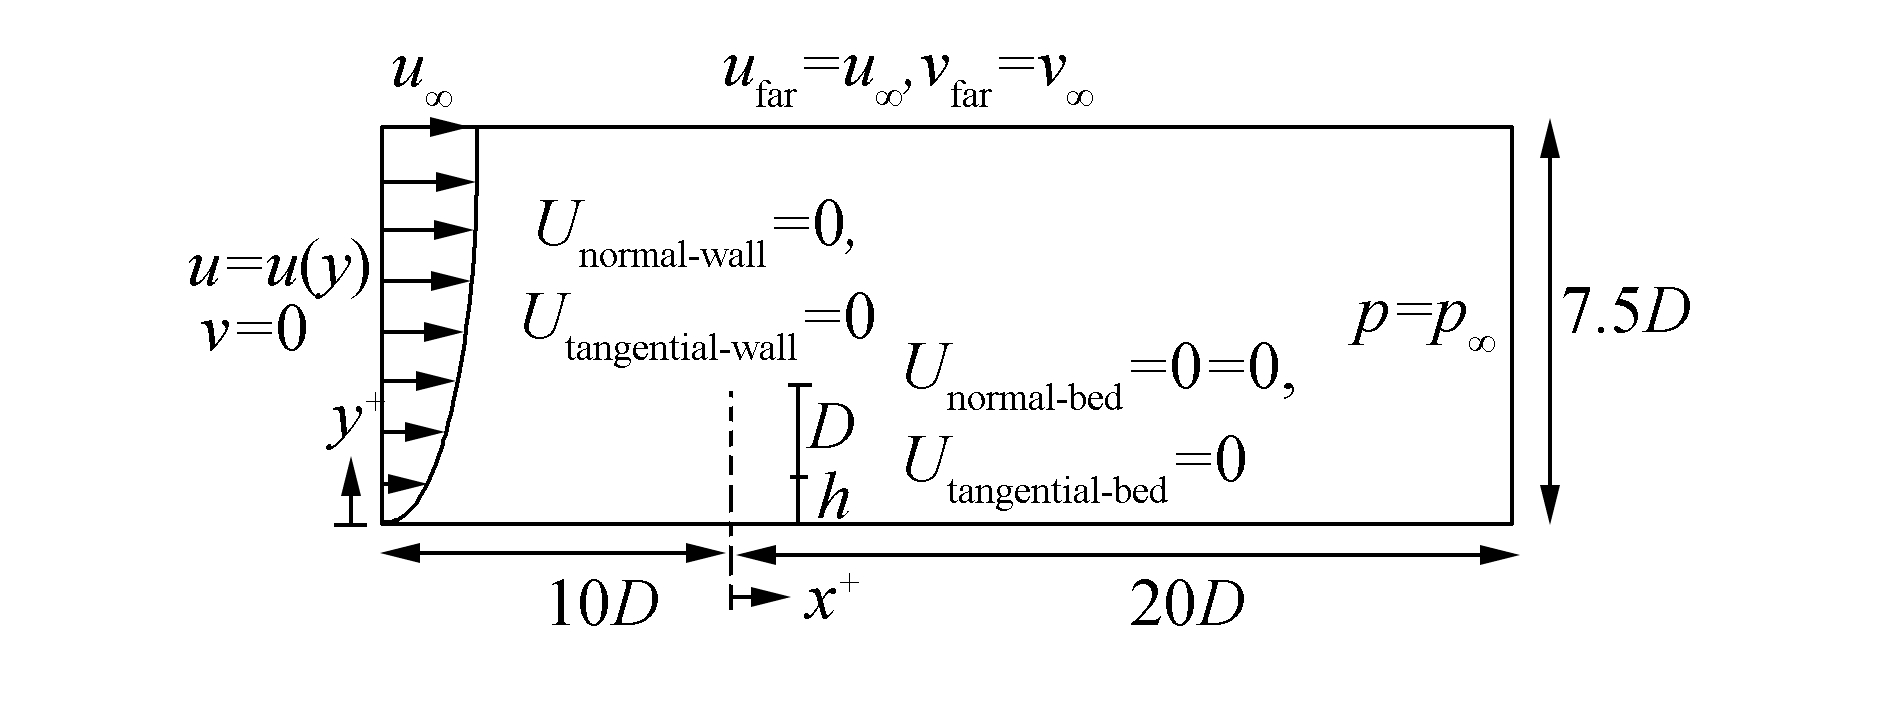
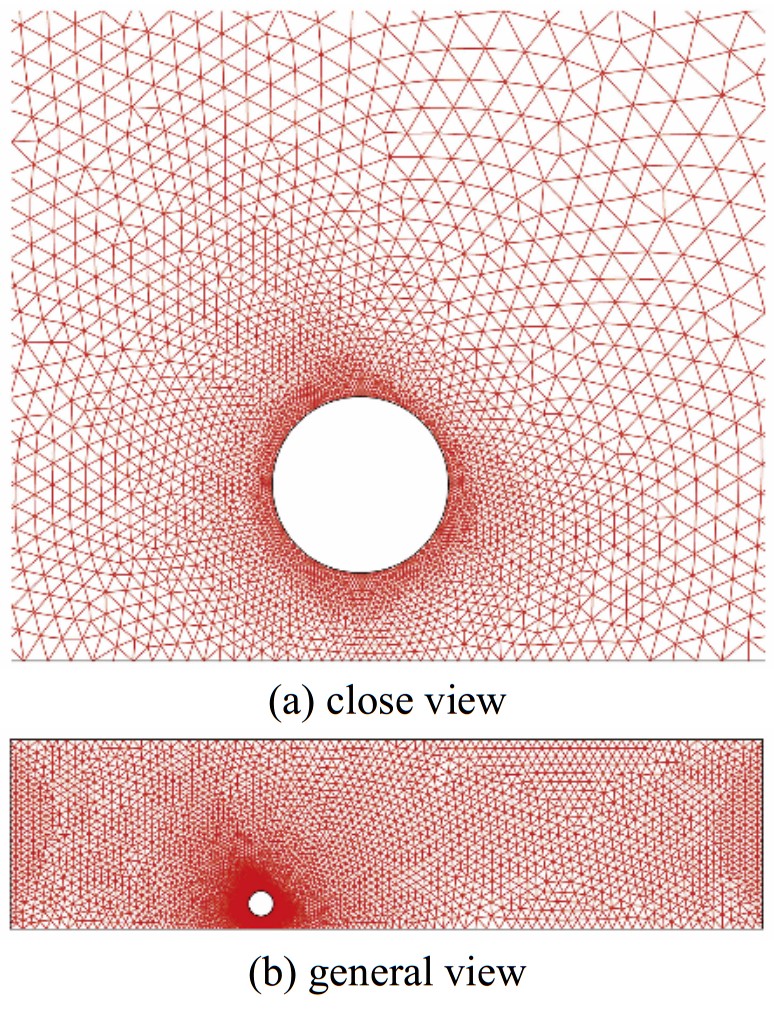
In this study, to simulate a pipeline in the vicinity of a flat seabed, a rectangular flow field domain with a circular cylinder placed near the bed is considered. A triangular mesh is used for the present simulation. To simulate natural boundary layers, a fine mesh is employed near the cylinder and is gradually changed to a coarse mesh in the far field. The domain extended to +7.5D in the vertical direction, −10D in the inflow, and +20D in the outflow direction. These boundaries were developed according to the laboratory conditions of the model by Oner et al. (2008) using a rectangular domain. Therefore, in this case study, the gap ratio (h/D) is small; the vortex shedding on the downstream side of the pipe near rigid seabed is not as strong as that of the isolated pipe; and the height of 7.5D is appropriate for this simulation to reduce computational cost. Fig. 1 schematically shows the size of computational domain and the imposed boundary conditions utilized in the present simulation. The symmetric boundary condition is used by setting the free stream velocity,
|
| Figure 1 Definition sketch of the computational domain and boundary conditions |
|
| Figure 2 Example of the computational mesh (h/ D=0.5) |
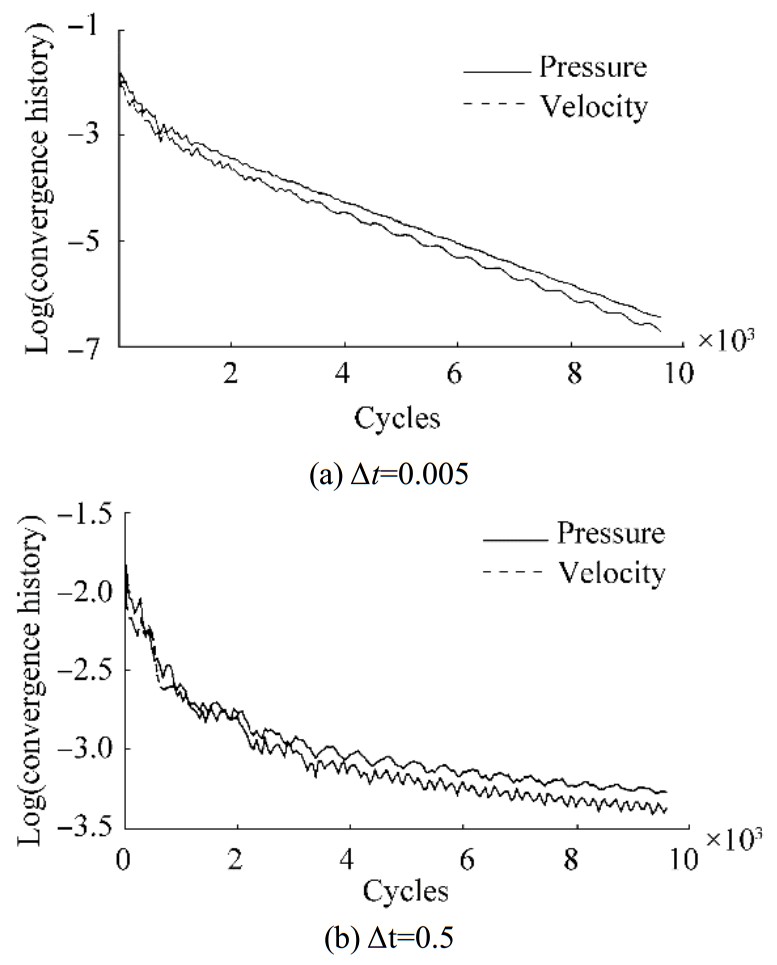
The calculation is conducted with a constant physical time step
|
| Figure 3 Convergence history of the solved pressure and velocity |
To evaluate the present numerical model, Fig. 4 shows the predicted mean pressure coefficient (

|
| Figure 4 Pressure coefficient of the cylinder wall in the case of h/D=0.4 |
The drag and lift coefficients are computed by
| ${{C}_{L}}=\frac{{{F}_{L}}}{1/2\rho {{\boldsymbol{u}}^{2}}D}$ | (8) |
| ${{C}_{D}}=\frac{{{\boldsymbol{F}}_{D}}}{1/2\rho {{\boldsymbol{u}}^{2}}D}$ | (9) |
where FL, FD are the forces acting on the pipe in the transverse and longitudinal direction, respectively, ρ is the fluid density, and u is the free stream velocity. The transverse force, known as the lift force, is formed because of the cross-flow pressure. The longitudinal force, identified as the drag force, is formed because of the in-line hydrodynamic pressure acting on the pipe and friction force. However, as Kazeminezhad et al. (2010) pointed out, the contribution of friction force is less than 2%-3%. Therefore, the lift force and drag force are calculated as follows:
| ${{\boldsymbol{F}}_{L}}=\int_{0}^{2\text{ }\!\!\pi\!\!\text{ }}{\boldsymbol{p}\text{ }\!\!~\!\!\text{ sin}\left(\theta \right)\text{ }\!\!~\!\!\text{ }{{\boldsymbol{r}}_{0}}\text{ }\!\!~\!\!\text{ d}\theta }\text{ }\!\!~\!\!\text{ }$ | (10) |
| ${{\boldsymbol{F}}_{D}}=\int_{0}^{2\text{ }\!\!\pi\!\!\text{ }}{\boldsymbol{p}\text{ }\!\!~\!\!\text{ cos}\left(\theta \right)\text{ }\!\!~\!\!\text{ }{{\boldsymbol{r}}_{0}}\text{ }\!\!~\!\!\text{ d}\theta }\text{ }\!\!~\!\!\text{ }$ | (11) |
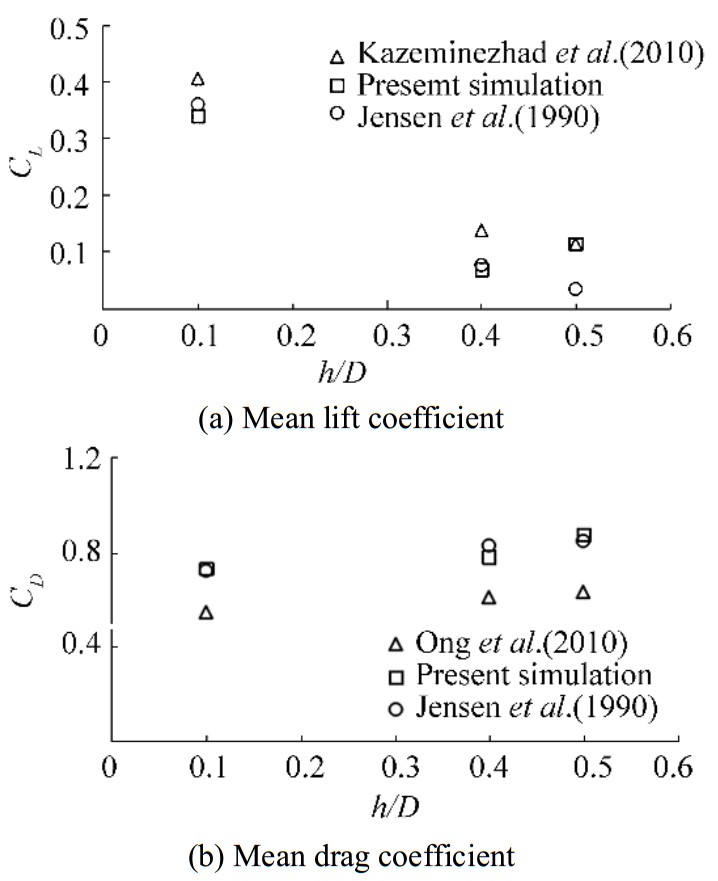
where p is pressure on the surface of the cylinder, θ is the angle in the horizon, and r0 is the radius of the cylinder. The accuracy of the obtained lift and drag forces in the proposed model is validated by the experimental data reported by Jensen et al. (1990) and the numerical simulations of Kazeminezhad et al., 2010 and Ong et al. (2010). The measured mean drag and lift coefficients at different gap ratios, i.e., h/D=0.1, 0.4 and 0.5, in a sub-critical flow regime with Re=1×10⁴ are illustrated in Fig. 5.
|
| Figure 5 Comparison of the (a) mean lift and (b) mean drag coefficients for different gap ratios |
As expected, in Fig. 5(a), the lift coefficient decreases sharply by increasing the gap ratio, but Fig. 5(b) shows that the drag coefficient increases gradually by increasing the gap ratio. This trend continues up to a certain value of the gap ratio. A similar observation was reported by Ong et al. (2010), in which the lift coefficient increases sharply with the decreasing gap ratio, and the drag coefficient decreases as the gap ratio decreases. The increasing rate of the mean drag coefficient decreases at a gap ratio of 0.4 or more. As the cylinder/pipe is far away from the bed, the base pressure drops quickly and consequently causes the mean drag to increase the coefficient because of the formation of vortices. In addition, the mean lift coefficient decreases remarkably at a gap ratio of less than of 0.4. This rate of reduction decreases for h/D > 0.4 mainly because of the large upward displacement of the front stagnation point. Fig. 5 indicates that by increasing the gap ratio, the effect of the seabed vicinity becomes negligible.
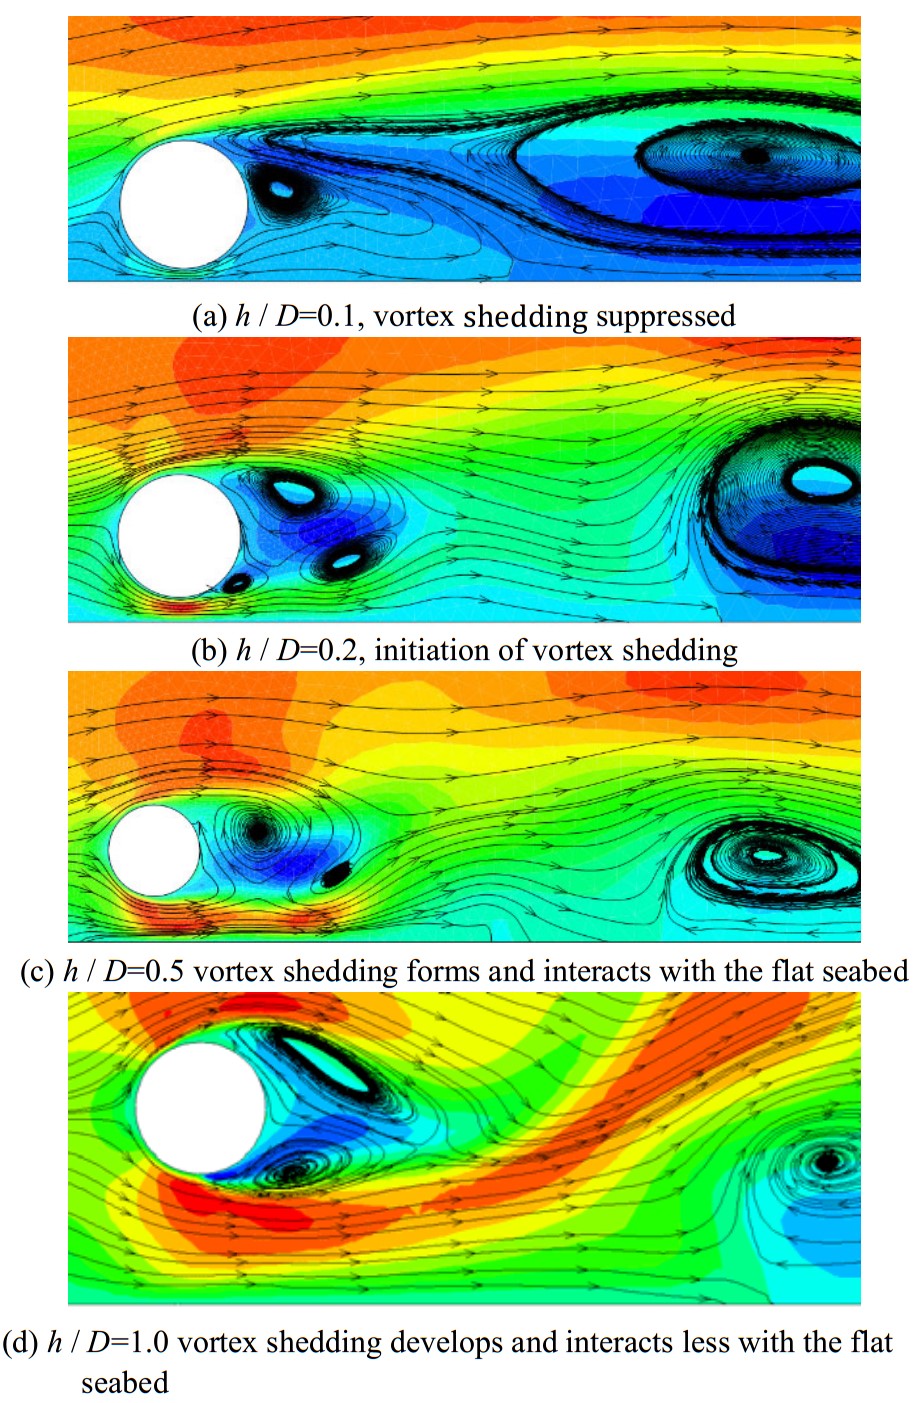
Vortex shedding on the downstream side of the pipe is the most important factor that strongly affects the lift and drag forces to be applied to the pipe frequently. This oscillation causes a periodic variation of force on the pipe. For the pipe near a flat boundary, the bottom shear layer is not developed as strongly as the upper shear layer. Thus, a weak interaction occurs between two shear layers, and this interaction may cause vortex shedding to weaken. Fig. 6 shows the development of the vortex shedding pattern in the downstream direction along a rigid seabed for different gap ratios of 0.1, 0.2, 0.5, and 1.0 at Re=1.5×10⁴. For every small gap ratio, i.e., h/D, no coupling occurs between the upper and lower shear layers of the cylinder to form the Kármán vortex street, as shown in Fig. 6(a). The shear layers continue to grow separately without developing any coupling vortices in the near-wake of the cylinder. By increasing the gap ratio to 0.2 (Fig. 6(b)), the interaction between the two shear layers begins, and then the formation of the Kármán vortex Street becomes visible. In this situation, the counter-clockwise vortex shedding of the bottom shear layer weakens and follows the clockwise vortex in the near-flat-bed region. Fig. 6(c) shows the vorticity formed for a gap ratio of 0.5. The clockwise vorticity of upper shear layer begins to interact with the clockwise vorticity of shear layer of the flatbed, thus causing a large vortex shedding. By increasing the gap ratio, the vortex shedding and flow pattern at the downstream direction of the cylinder become similar to the case of a cylinder far from the bed. This observation is also confirmed by Ong et al. (2010). The qualitative comparison of the observed vortex shedding and the flow pattern shows that the proposed model is capable of accurately simulating turbulent flow around a circular cylinder. For the pipe near a rigid seabed with a gap ratio of h/D=1.0, the vorticity of the pipe does not influence the shear layer at the bed and the vortex shedding is similar to an isolated pipe.
|
| Figure 6 Instantaneous streamline patterns of flow around a circular cylinder for Re=1.5×10⁴ for a gap ratio of (a) 0.1, (b) 0.2, (c) 0.5, and (d) 1.0 |
To investigate the effect of rigid bed proximity on flow pattern and hydrodynamic loads acting on offshore pipelines exposed to turbulent flow, the unsteady incompressible 2D NS equations and LES turbulence model were solved. The solver algorithm was based on the artificial compressibility approach and dual time-stepping technique. To improve the convergence behavior of the developed model, the effect of the computational physical time step in the dual time-stepping scheme was investigated. The effect of bed vicinity on the formation of vortex shedding and the values of drag and lift coefficients at high Reynolds numbers were studied. Predictions of the pressure distribution on the surface of cylinder and the mean drag and lift coefficients indicate satisfactory agreement with published numerical results and experimental data. The main results are as follows:
●The mean drag coefficient decreases gradually by decreasing the gap ratio. CD reaches the minimum value at h/D=0.1, thus indicating that bed vicinity can slightly decrease the value of the drag force.
●The mean lift coefficient increases dramatically by decreasing the gap ratio and reaches the maximum value at h/D=0.1. CL is strongly affected by the value of the gap ratio, especially at small gaps, and causes the cylinder to be removed away from the bed.
The calculated mean lift coefficients at a high Reynolds number of Re=1.5×10⁴ are positive for the range of gap ratios.
●The formation and suppression of vortex shedding on the downstream side of the pipe are strongly affected by the interaction of three shear layers: 1) cylinder top shear layer, 2) cylinder bottom shear layer, and 3) bed shear layer. Vortex shedding is surpassed at gap ratios less than the critical gap ratio, i.e., h/D=0.2. By increasing the gap ratio beyond the critical gap, vortex shedding develops gradually and forms the vortex shedding similar to the case of the isolated cylinder.
Overall, the present simulation confirms that despite the limitations in the 2D simulation, the developed model is capable of predicting hydrodynamic quantities well. Therefore, the proposed simulation method can be a reliable and useful tool for engineering design.
Acknowledgement:The authors would like to thank Universiti Teknologi PETRONAS for the funding support and facilities. This paper was supported by the Technology Innovation Program (grant number: 10053121) funded by the Ministry of Trade, Industry & Energy (MI, Korea) and by the Energy Efficiency & Resource of Korea Institute of Energy Technology Evaluation and Planning (KETEP) grant funded by the Ministry of Knowledge Economy of Korea (grant number: 2014301002-1870).
| Ai Y, Feng D, Ye H, Li L, 2013. Unsteady numerical simulation of flow around 2-D circular cylinder for high Reynolds numbers. Journal of Marine Science and Application, 12(2), 180–184. DOI:10.1007/s11804-013-1183-0 |
| Bearman P, Zdravkovich M, 1978. Flow around a circular cylinder near a plane boundary. Journal of Fluid Mechanics, 89(1), 33–47. DOI:10.1017/S002211207800244X |
| Buresti G, Launaro F, 1980. Pressure measurements around a circular cylinder in cross flow near a plane boundary. University of Pisa, Institute of Aerodynamics, 1-101. |
| Chorin AJ, 1967. A numerical method for solving incompressible viscous flow problems. Journal of Computational Physics, 2(1), 12–26. DOI:10.1016/0021-9991(67)90037-X |
| Gao FP, Yang B, Wu YX, Yan SM, 2006. Steady current induced seabed scour around a vibrating pipeline. Applied Ocean Research, 28(5), 291–298. DOI:10.1016/j.apor.2007.01.004 |
| Jensen B, Sumer B, Jensen H, Fredsoe J, 1990. Flow around and forces on a pipeline near a scoured bed in steady current. Journal of Offshore Mechanics and Arctic Engineering, 112(3), 206–213. DOI:10.1115/1.2919858 |
| Kazeminezhad M, Yeganeh-Bakhtiary A, Etemad-Shahidi A, 2010. Numerical investigation of boundary layer effects on vortex shedding frequency and forces acting upon marine pipeline. Applied Ocean Research, 32(4), 460–470. DOI:10.1016/j.apor.2010.10.002 |
| Kiya M, 1968. Study on the turbulent shear flow past a circular cylinder. Bulletin of the Faculty of Engineering, Hokkaido University, 50, 1–101. |
| Lee YG, Hong SW, Kang KJ, 1994. A numerical simulation of vortex motion behind a circular cylinder above a horizontal plane boundary. The Fourth International Offshore and Polar Engineering Conference, Osaka, Japan, 428-433. |
| Lei C, Cheng L, Armfield S, Kavanagh K, 2000. Vortex shedding suppression for flow over a circular cylinder near a plane boundary. Ocean Engineering, 27(10), 1109–1127. DOI:10.1016/S0029-8018(99)00033-5 |
| Li Y, Chen B, Lai G, 1997. The numerical simulation of wave forces on seabed pipeline by three-step finite element method and large eddy simulation. The Seventh International Offshore and Polar Engineering Conference, Honolulu, USA, 273-277. |
| Liang D, Cheng L, 2005. Numerical modeling of flow and scour below a pipeline in currents:Part I. Flow simulation. Coastal Engineering, 52(1), 25–42. DOI:10.1016/j.coastaleng.2004.09.002 |
| Namazi-Saleh F, John KV, Mustaffa ZB, 2016. Numerical evaluation of galerkin finite volume solver for laminar/turbulent flow over flat plate. ARPN Journal of Engineering and Applied Sciences, 11(4), 2393–2399. |
| Namazi-Saleh F, Kurian JV, Zahiraniza MB, 2014. Investigation of vortex induced vibration of offshore pipelines near seabed. Applied Mechanics and Materials, 567, 265–270. DOI:10.4028/www.scientific.net/AMM.567.265 |
| Oner AA, Kirkgoz MS, Akoz MS, 2008. Interaction of a current with a circular cylinder near a rigid bed. Ocean Engineering, 35(14), 1492–1504. DOI:10.1016/j.oceaneng.2008.06.005 |
| Ong MC, Utnes T, Holmedal LE, Myrhaug D, Pettersen B, 2010. Numerical simulation of flow around a circular cylinder close to a flat seabed at high Reynolds numbers using a k-Dž model. Coastal Engineering, 57(10), 931–947. DOI:10.1016/j.coastaleng.2010.05.008 |
| Roshko A, Steinolfson A, Chattoorgoon V, 1975. Flow forces on a cylinder near a wall or near another cylinder. DTIC Document. |
| Sabbagh-Yazd R, Mastorakis N, Meysami F, Namazi-Saleh F, 2008. 2D Galerkin finite volume solution of steady inviscid/viscous/turbulent artificial compressible flow on triangular meshes. International Journal of Computers, 2(1), 39–46. |
| Sohankar A, 2008. Large eddy simulation of flow past rectangular-section cylinders:Side ratio effects. Journal of Wind Engineering and Industrial Aerodynamics, 96(5), 640–655. DOI:10.1016/j.jweia.2008.02.009 |
| Zhao X, Zhang S, Meganathan A, 2009. Implicit time accurate method for unsteady computations. 47th Aerospace Sciences Meeting and Exhibit, Orlando, AIAA 2009-2166. DOI: http://dx.doi.org/10.2514/6.2009-166 |


